Narrow belt of debris around the Sco-Cen star HD 141011 ††thanks: Based on observations made with ESO Telescopes at the Paranal Observatory under programs ID 095.C-0607, 097.C-0060, 0101.C-0016, 098.C-0739, and 1101.C-0557., ††thanks: This work has made use of the the SPHERE Data Centre, jointly operated by OSUG/IPAG (Grenoble), PYTHEAS/LAM/CESAM (Marseille), OCA/Lagrange (Nice), Observatoire de Paris/LESIA (Paris), and Observatoire de Lyon.
Abstract
Context. We initiated a deep-imaging survey of Scorpius-Centaurus A-F stars in 2015. These stars are predicted to host warm inner and cold outer belts of debris reminiscent of the architecture of emblematic systems such as HR 8799.
Aims. We present resolved images of a ring of debris around the F5-type star HD 141011 that was observed as part of our survey. We aim to set constraints on the properties of the disk, compare them to those of other resolved debris disks in Sco-Cen, and detect companions.
Methods. We obtained high-contrast coronagraphic observations of HD 141011 in 2015, 2016, and 2019 with VLT/SPHERE. We removed the stellar halo using angular differential imaging (ADI). We searched for scattered light emission from a disk in the residuals and applied a forward-modeling approach to retrieve its morphological and photometric properties. We combined our radial velocity and imaging data to derive detection probabilities for companions co-planar with the disk orientation.
Results. We resolve a narrow ring of debris that extends up to 1.1” (141 au) from the star in the IRDIS and IFS data obtained in 2016 and 2019. The disk is not detected in the 2015 data which are of poorer quality. The disks is best reproduced by models of a noneccentric ring centered on the star with an inclination of , a position angle of , and a semimajor axis of au. The combination of radial velocity and imaging data excludes brown-dwarf (M¿13.6 MJup) companions coplanar with the disk from 0.1 to 0.9 au and from 20 au up to 500 au (90% probability).
Conclusions. HD 141011 adds to the growing list of debris disks that are resolved in Sco-Cen. It is one of the faintest disks that are resolved from the ground and has a radial extent and fractional width (12.5%) reminiscent of Fomalhaut. Its moderate inclination and large semimajor axis make it a good target for the James Webb Space Telescope and should allow a deeper search for putative companions shaping the dust distribution.
Key Words.:
techniques: high contrast imaging- stars: planetary systems - stars: individual: HD~141011 (HIP~77432)1 Introduction
| IRDIS | IFS | ||||||||
| Date, UT start | Setup | Density | PA | Airmass | Remarks | ||||
| (s) | (s) | (∘) | (”) | (ms) | |||||
| 25/07/2015, 23:28 | IRDIS-H23+IFS-YJ | ND_1.0 | 251 | 831 | 0.1 | 1.0 | 1.1 | 1.4 | Unsat. PSF |
| 25/07/2015, 23:33 | IRDIS-H23+IFS-YJ | ND_0.0 | 64316 | 64315 | 35.7 | 1.1 | 1.1 | 1.2 | ADI seq. |
| 09/04/2016, 06:53 | IRDIS-H23+IFS-YJ | ND_1.0 | 221 | 411 | 0.1 | 0.6 | 1.1 | 4.6 | Unsat. PSF |
| 09/04/2016, 06:54 | IRDIS-H23+IFS-YJ | ND_0.0 | 32816 | 64416 | 49.2 | 0.6 | 1.1 | 4.5 | ADI seq. |
| 09/04/2016, 08:05 | IRDIS-H23+IFS-YJ | ND_1.0 | 221 | 411 | 0.1 | 0.7 | 1.1 | 3.5 | Unsat. PSF |
| 26/04/2019, 05:22 | IRDIS-BBH+IFS-YJ | ND_2.0 | 481 | 3211 | 0.4 | 0.6 | 1.1 | 4.3 | Unsat. PSF |
| 26/04/2019, 05:25 | IRDIS-BBH+IFS-YJ | ND_0.0 | 321416 | 64716 | 79.3 | 0.6 | 1.1 | 4.3 | ADI seq. |
| 26/04/2019, 07:31 | IRDIS-BBH+IFS-YJ | ND_2.0 | 481 | 3211 | 0.3 | 0.6 | 1.1 | 4.3 | Unsat. PSF |
The proximity (d=90-200 pc), large number of intermediate-mass stars, and young age (11-17 Myr) of the Scorpius-Centaurus OB association (de Zeeuw et al. 1999, and references therein) all contribute to make it a niche for the direct-imaging search of young self-luminous planets and circumstellar disks. The planet-finder instruments SPHERE (Spectro-Polarimetric High-contrast Exoplanet REsearch, Beuzit et al. 2019) and GPI (Gemini Planet Imager, Macintosh et al. 2008) are starting to probe the circumstellar environnements in Sco-Cen at unprecedented contrasts () down to 0.1” separations (10 au at 100 pc). They have already yielded images of 15 debris disks around these stars in the past six years (see Appendix A and references therein). ALMA resolved eight additional disks in the association (Lieman-Sifry et al. 2016; Su et al. 2017; Moór et al. 2017) at more moderate spatial resolutions with no corresponding detection in scattered light so far (HD 112810, HD 113766, HD 121191, HD 121617, HD 131488, HD 138813, HD 142446, and HD 146181). The morphology of each of these disks (wing-tilt, rings) inferred from scattered-light images provides indications about the diversity of planetary system architectures (Lee & Chiang 2016) beyond a separation of 10 au in a narrow age bin (10-17 Myr) immediately after the end of giant planet formation.
We initiated a direct-imaging survey with SPHERE in 2015 to image new giant planets and circumstellar disks around a sample of Sco-Cen F5-A0 stars with high infrared excesses, modeled with two blackbody components, each corresponding to a belt of debris (Chen et al. 2014, hereafter C14). This architecture is reminiscent of the iconic systems previously identified by direct imaging, such as HR 8799 (Marois et al. 2008, 2010), 51 Eridani (Macintosh et al. 2015), the Sco-Cen member HD 95086 (Rameau et al. 2013), and of the Solar System. Bonnefoy et al. (2017) presented the images of two belts of debris around the F0 star HIP 67497 that we inferred from our survey (Paper I).
We report in this work the discovery of a narrow ring of debris around the F5V star HD~141011 (HIP~77432). This intermediate-mass star () is located at a distance of pc according to the Gaia-EDR3 (Gaia Collaboration 2020). The Gaia-EDR3 kinematics and the Banyan tool222http://www.exoplanetes.umontreal.ca/banyan/ (Gagné et al. 2018) confirm the star’s membership in the 16 Myr old (Mamajek et al. 2002) Upper Centaurus Lupus subgroup (de Zeeuw et al. 1999). C14 modeled the infrared excess of the star with two belts of debris: a warm ( K) belt at 0.8 au and a cold ( K) belt at 25.9 au. Ballering et al. (2017) proposed their own analysis of the excess, confirming a two-belt architecture with a warm belt at 0.5 au and a cold belt at a temperature of 101.5 K with no given location. The authors also reported clear silicate features in the best-fit model spectra, which is indicative of exozodiacal dust. Jang-Condell et al. (2015) rather modeled the infrared excess with only one warm belt located at au. These previous modelings of the excess all assumed a distance to HD 141011 of 96.34 pc, which has considerably changed with Gaia. They relied mostly on the Spitzer IRS spectrum that was available for that target, which covers a limited fraction of the excess emission and can lead to spurious identification of two-belt components (see section 4.3 of Kennedy & Wyatt 2014).
Previous adaptive optics observations revealed three candidate companions (Janson et al. 2013) with separations between 1.77″and 4.25″ , but lacked the sensitivity to resolve the circumstellar emission. Our high-contrast observations allow us to constrain its morphology and to clarify the nature of previously identified candidate companions. We use them as well as new radial velocity observations to search for additional companions. We present the observations and data in § 2 and an analysis of the disk, candidate companion properties, and detection limits in § 3. We discuss our findings in § 4.
2 Observations
2.1 SPHERE imaging
We observed HD 141011 on July 25, 2015, April 9, 2016, and April 26, 2019, with the VLT/SPHERE instrument (Beuzit et al. 2019) mounted on the VLT/UT3 (Table 1). The instrument was operated with the IRDIS (Dohlen et al. 2008) and IFS (Claudi et al. 2008) subinstruments in parallel. The mode enabled pupil-stabilized observations of the source placed behind the apodized Lyot coronagraph N_ALC_YJH_S with a radius of 92.5 mas. IRDIS recorded images of the target in the H2 (=1.593 m, width=52 nm) and H3 (=1.667 m, width=54 nm) filters for the 2015 and 2016 epochs (Vigan et al. 2010). We rather used the broad H-band filter (=1.625 m, =290 nm) in 2019 in both IRDIS channels to provide a deeper image of the disk. The IFS yielded images with a field of view each in 39 spectral channels covering the 0.96-1.33 m spectral range at all epochs. We obtained additional coronagraphic observations of the source with satellite spots created by a waffle pattern introduced onto the deformable mirror of the instrument for registration purposes. We recorded nonsaturated exposures of the star placed outside of the coronagraphic mask with neutral density filters (ND_1.0 or ND_2.0) before and/or after the deep-imaging sequence. The point spread function (PSF) extracted from these images were used to estimate the flux and position of the point sources detected in the field of view.
The data were reduced by the SPHERE Data Center (Delorme et al. 2017) in in the same way as for HIP 67497 (Paper I) to obtain a temporal sequence of recentered coronagraphic frames for each of the 2 IRDIS channels and for the 39 IFS channels. We used true north values of , , and plate scales of , , and mas/pixel for the 2015, 2016, and 2019 epochs (see Maire et al. 2016). We adopted a plate scale of mas/pixel for the IFS.
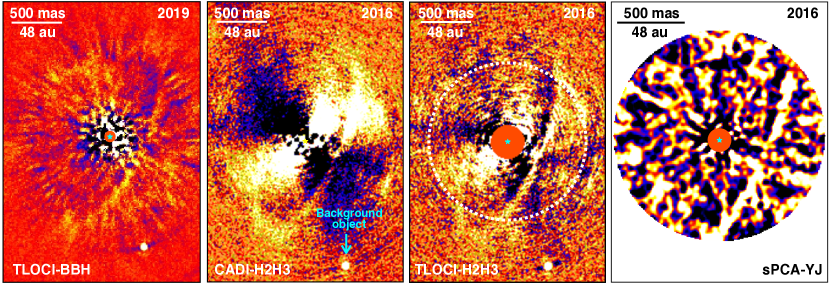
We then applied the classical ADI (cADI, Marois et al. 2006) and TLOCI (Lafrenière et al. 2007) algorithms as implemented in the SPECAL pipeline of the SPHERE Data Center (Galicher et al. 2018) and the principal component analysis algorithm (PCA; Soummer et al. 2012) as implemented in the VIP HCI package (Gomez Gonzalez et al. 2017) on the registered sequence of IRDIS frames to supress the stellar halo. We averaged the H2 and H3 IRDIS images (hereafter H2H3) at each epoch (2015 and 2016) in order to maximize our sensitivity to faint extended structures. We also averaged the two independent BB_H frames obtained from the 2019 observations and produced three averaged IFS images from the 39 spectral channels (from Y to J) of the 2015, 2016, and 2019 epochs, respectively. The first five modes of the PCA contained most of the extended structures in the IRDIS images. We also applied the PCA algorithm relying on the angular and spectral diversity of the IFS data (Mesa et al. 2015, hereafter sPCA). The images are shown in Fig. 1. We extracted the position and flux of each identified candidate in the TLOCI-reduced frames.
2.2 Radial velocity measurements on HIP 141011A
We obtained 13 optical spectra (378-691nm) between March 30, 2018, and March 12, 2020, with the HARPS high-resolution spectrograph (Mayor et al. 2003) mounted on the ESO 3.6m telescope. The data were reduced using the Software for the Analysis of the Fourier Interspectrum Radial velocities (SAFIR Galland et al. 2005). We do not find evidence for spectroscopic binary signals. The measurements are reported in Table 2 and are used in Section 3.3 to set constraints on massive close-in companions in the system.
| MJD - 2 450 000 | RV (km.s-1) | Error (km.s-1) |
|---|---|---|
| 8207.78 | -0.087 | 0.062 |
| 8207.79 | -0.096 | 0.061 |
| 8207.81 | -0.066 | 0.062 |
| 8208.84 | -0.021 | 0.038 |
| 8208.85 | 0.017 | 0.039 |
| 8534.79 | 0.094 | 0.039 |
| 8534.80 | 0.061 | 0.040 |
| 8593.81 | 0.141 | 0.054 |
| 8593.82 | 0.092 | 0.052 |
| 8605.71 | -0.006 | 0.044 |
| 8605.72 | 0.113 | 0.043 |
| 8920.79 | 0.056 | 0.041 |
| 8920.81 | 0.098 | 0.042 |
3 Results
We resolve a ring of debris extending up to 1.1” from the star (141.2 au) into the IRDIS field of view in the 2016 and 2019 images (Figure 1). The disk is retrieved in the cADI, PCA, and TLOCI reductions. We also detect a similar structure with the IFS data taken in 2016 (Figure 1 right) and 2019 (marginal detection) when the cubes are collapsed in wavelength. The disk detection is only marginal in the 2015 IRDIS data (no detection in the IFS) because the observing conditions were poorer. We therefore did not use the 2015 images in the remaining paper to characterize the disk.
3.1 Disk morphology
The various reductions enable us to capture different portions of the disk. The cADI algorithm is the reduction with the least self-subtraction of the disk flux. Therefore it provides deeper images of the faint emission zones far from the star (ansae). The PCA and TLOCI algorithms are more efficient in suppressing the residual halo at short separations. This residual halo is mostly created by the servolag error of the adaptive optics system (also known as wind-driven halo; Cantalloube et al. 2020).
To determine the best disk model that best reproduces the scattered-light image of the disk, we used a python implementation333GraTeR was implemented in python as part of the high-contrast pipeline VIP HCI (Gomez Gonzalez et al. 2017) of the GraTeR code (Augereau et al. 1999). The dust radial density is described by a two-component power law of index and , inside and outside a reference radius , respectively. The vertical dust distribution is parameterized by a Gaussian profile, with a reference scale height at the reference radius and a linear dependence on the distance to the star (constant opening angle). The dust density is therefore parameterized with
| (1) |
We modeled the scattering phase function (hereafter SPF) with a Henyey-Greenstein phase function, which is a common and simple way to describe the phase function of debris disks. It is parametrized by the anisotropic scattering factor (between and ),
| (2) |
where is the scattering angle.
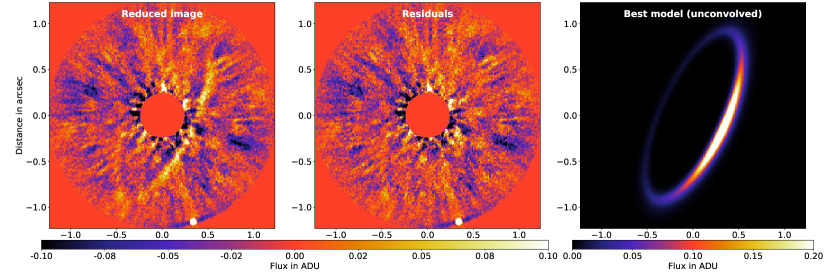
We applied a forward-modelling approach to find the best disk parameters that are compatible with the data. We first generated a synthetic scattered light image from our model, convolved it with the PSF (here the unsaturated images of the star), and we subtracted it from all individual frames of the IRDIS 2016 and 2019 data sets. We then reduced these disk-subtracted data sets with a PCA algorithm, removing five principal components, to obtain four disk-subtracted images (one for each epoch and IRDIS spectral channel), which we averaged together to have a single disk-subtracted image. We iterated over the disk model parameters until the level of residuals in this final image was minimized. To estimate the goodness of fit, we computed the in an elliptical ring encompassing the disk. The was estimated using the following definition of the noise in the final image. We assumed that the noise is purely radial without azimuthal dependence. The noise radial profile was then estimated as the azimuthal root-mean square of the fluxes encircled in apertures with a diameter of one resolution element (), taking into account a correction factor from the small-sample statistics (Mawet et al. 2014) and after masking the disk signal in the final image. The uncertainties on the model parameters were derived following the method described in Bonnefoy et al. (2017).
The initial disk image we started from is shown in Fig. 2 (left). Initial trials showed that we were little sensitive to the scale height as long as it was below 5 au (for between 125 and 130 au). We therefore set its value to 3.5 au to save computational time. This value represents a half-width at half maximum for the vertical density profile of au and an aspect ratio of that is compatible with the minimum natural aspect ratio of debris disks, which is predicted to be by Thébault (2009). Similarly, the forward-modeling approach favored models with a very steep inner slope . However, we cannot constrain an inner slope steeper than 20 because we are limited by the angular resolution of our data. We therefore set the inner slope to 20. We used as free parameters the reference radius , the inclination , the position angle , the outer slope of the radial dust density and the anisotropic scattering factor . We minimized the using the Nelder & Mead (1965) algorithm. The best model is shown in Fig. 2 (right), along with the residuals after subtraction of the best model (middle). The reduced is 1.037, indicating that our model is compatible with the data. The disk peak flux decreases by due to the convolution with the IRDIS point-spread function, and then by another due to the ADI reduction technique (Milli et al. 2012). The best parameters of the model are indicated in Table 3. The model favors a narrow ring inclined by , with a steep outer slope for the radial dust density of and a reference radius au. Because , the location of the maximum dust surface density is slightly greater than and equals 128.2 au, with a ring FWHM of 16.1 au, corresponding to about three resolution elements in the H band. This implies a fractional width for the ring of 12.6%.
| Parameter | Best value |
|---|---|
| (au) | |
| (∘) | |
| (∘) | |
3.2 Excess emission
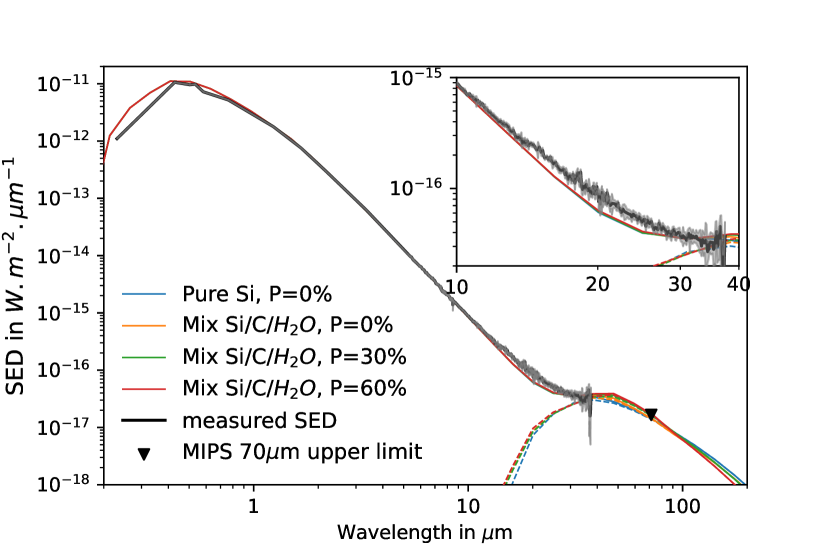
The parameters of the disk that we detect are not compatible with the previous models of the SED alone (C14; Jang-Condell et al. 2015; Ballering et al. 2017). The SED is indeed unconstrained beyond , with only one upper limit from Spitzer/MIPS at (see Fig. 3). The SED fitting can be highly degenerate in these conditions. The absence of more constraining mid- and far-infrared measurements prevents us from carrying out a detailed modeling of the SED of the cold belt detected in the imaging. We do not know either whether the infrared excess detected between and comes from this cold belt or from a warm belt suggested by C14, Jang-Condell et al. (2015), and Ballering et al. (2017).
We therefore modeled the SED anew using the following approach. We assumed that the excess emission detected with Spitzer/IRS between and is entirely due to the imaged cold belt. We also investigated which families of dust particle property models are compatible with this hypothesis.
To do this, we first re-estimated the star’s photospheric contribution, normalizing a Kurucz synthetic spectrum with T =6500K, log g=4.5, and M/H=0.0 onto a compilation of published photometry (GALEX NUV, TYCHO B, Gaia EDR3, and 2MASS JHK) that is not affected by the excess emission gathered through the VOSA tool (Bayo et al. 2008).
We then used the radiative transfer code MCFOST (Pinte et al. 2006, 2009) and the disk morphological parameters described in section 3.1 to model the excess emission.
|
 |
 |
|---|---|---|
|
 |
| # | Ep.a | H2 or H | H3 | PA | Sep. |
|---|---|---|---|---|---|
| (mag) | (mag) | (∘) | (mas) | ||
| 1 | 1 | ||||
| 2 | |||||
| 3 | … | ||||
| 2 | 1 | ||||
| 2 | |||||
| 3 | … | ||||
| 3 | 1 | ||||
| 2 | |||||
| 3 | … | ||||
| 4 | 1 | ||||
| 2 | |||||
| 3 | … | ||||
| 5 | 1 | ||||
| 2 | |||||
| 3 | … | ||||
| 6 | 1 | ||||
| 2 | |||||
| 3 | … | ||||
| 7 | 1 | ||||
| 2 | |||||
| 3 | … |
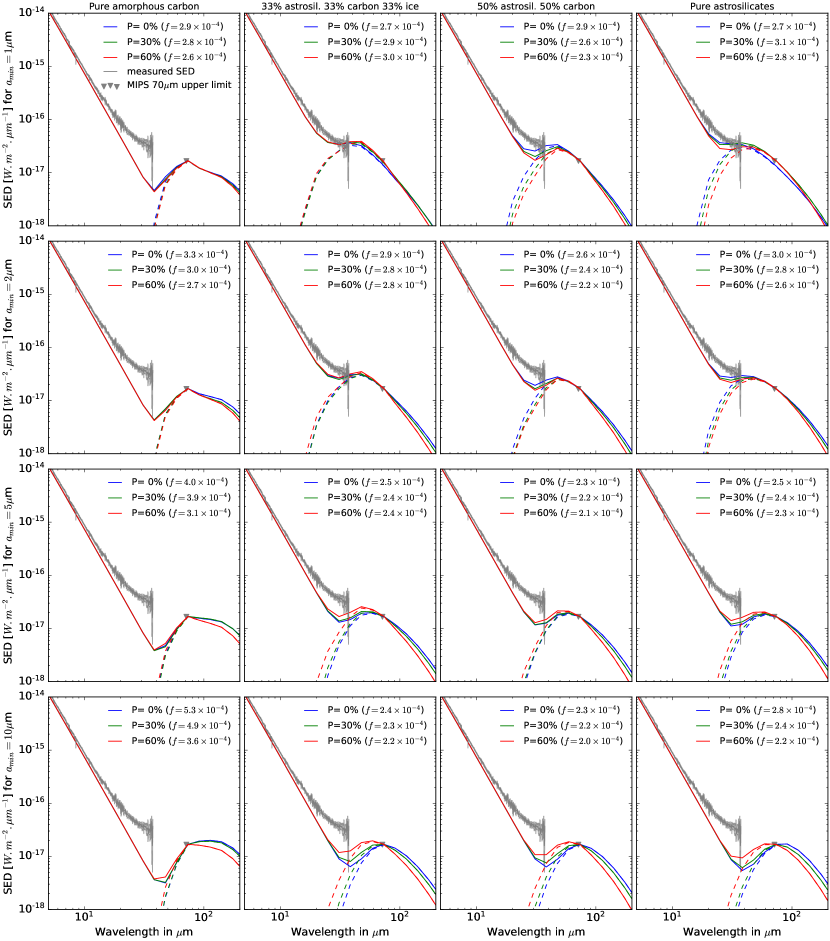
We restrained our investigation to a population of dust particles in a size distribution with a power-law index -3.5 (Dohnanyi 1969), with a minimum particle size of 1, 2, 5 and . A rough estimate of the blow-out size (assuming blackbody grains, Wyatt 2008) is for () and compact astrosilicates of density , and more porous particles would have a larger blow-out size (e.g., Arnold et al. 2019).
We explored four different compositions: pure astrosilicates (Draine & Lee 1984), pure amorphous carbon (Rouleau & Martin 1991), a mix of both in equal amounts, or a mix of astronomical silicates, amorphous carbon, and water ice (Li & Greenberg 1998) in equal amounts. We used the Mie theory, which is valid for spherical particles and assumed either compact particles or 30% or 60% porous particles. We therefore investigated 48 dust models.
We then started from a low initial mass for the belt and scaled it up until the SED of the disk and star either matched the Spitzer/IRS measurements between and , or reached the Spitzer/MIPS upper limit, whichever occured first. For completeness, we provide in Appendix B the SED of the 48 models we explored. The quality of the fit was assessed using the reduced computed between the measured and predicted SED at wavelengths between and (38 degrees of freedom).
Out of our 48 models, 11 are compatible with the IRS spectra and Spitzer/MIPS upper limit with a reduced below 1. These 11 models correspond to dust populations with a minimum particle size of or because all larger minimum particle sizes cannot simultaneously be compatible with the infrared excess and the Spitzer/MIPS upper limit. Out of these 11 models, only 4 stay strictly below (but close to) the Spitzer/MIPS upper limit (the other seven models have a flux equal to the Spitzer/MIPS upper limit) and these 4 models all have a minimum particle size of with the best reduced below . The MIPS image shows a faint point-source at the target location, but overlaid on a variable background so that it cannot be considered as a detection but may indicate that the disk excess indeed falls close to the tabulated upper limit. We highlight that these four models slightly underpredict the SED between and , as shown in the inset of Fig. 3. We did not try to match the measured flux in this wavelength range because the contribution of the cold belt imaged with SPHERE is negligible compared to a potential warmer belt for which we have no observational constraint from the high-contrast images presented in this paper. A warmer belt at K, as proposed by C14, may therefore account for the underestimated flux. We defer this discussion to a further study when a far-infrared or (sub-)millimeter SED measurement of the resolved cold belt will be secured to raise the degeneracy between the cold and warmer components. The fractional luminosity of the four best disk models ranges between and , which is significantly higher than the value reported in C14 ().
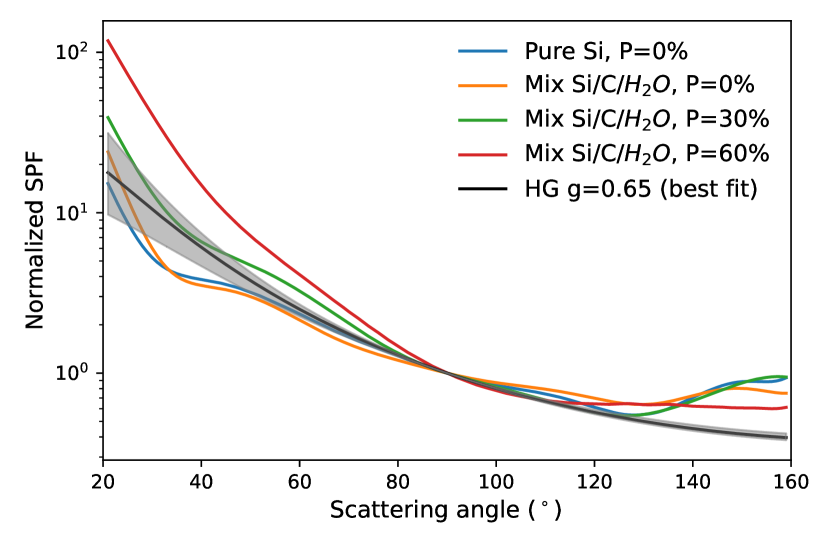
To confirm the compatibility of this family of models with our observations, we verified that they could also reproduce the scattered light images of the disk, especially the scattering phase function (hereafter SPF) of the dust, for which our forward-modeling approach favored an HG with a parameter . The comparison between the theoretical SPF and the HG model is shown in Fig. 5. It shows that the theoretical SPF are compatible with the fitted SPF, except for the more porous dust population including astrosilicates, carbonaceous material, and water ice. Most models predict some slight backward scattering beyond . The back side of the disk is unfortunately not detected in the image, and a single HG SPF cannot reproduce this behavior, so that we cannot discuss the reality of this behavior in the present data.
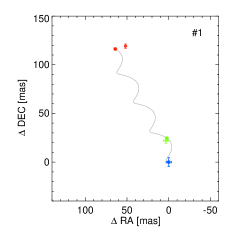
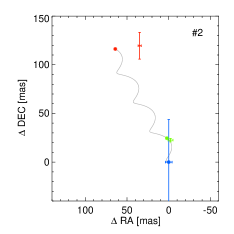
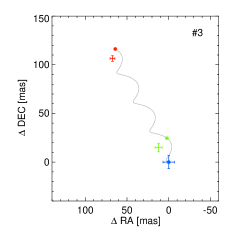
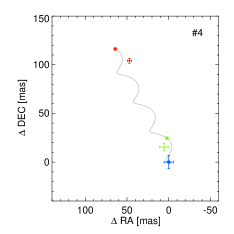
3.3 Searching for perturbers
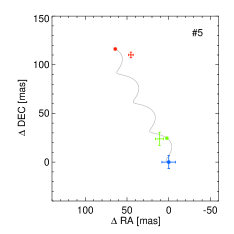
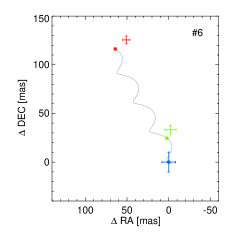
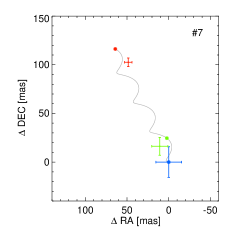
We detect seven point sources in the IRDIS field of view. None of them falls into the field of view of the IFS. Their astrometry is reported in Table 4 and in Figure 4. It confirms that all point sources follow the expected apparent on-sky motion of background objects. Point sources 2, 4, and 5 correspond to those detected by Janson et al. (2013).
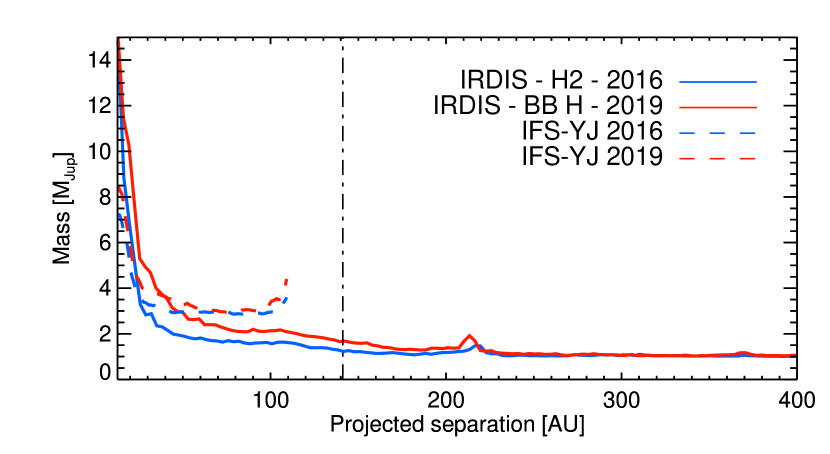
Detection limits for the three epochs of observations were estimated by injecting fake companions with flat spectra into the datacubes for the IFS. The IRDIS detection limits were estimated from the TLOCI coefficients and the local level of the noise. We used the COND evolutionary tracks to convert the derived contrasts into masses (Baraffe et al. 2003) along with the 2MASS photometry of the host star (Cutri et al. 2003). We report these limits in Fig. 6 for the 2016 and 2019 epochs. Any hot-start companion more massive than 2 would have been detected down to 40 au (projected separation). The IFS data are less sensitive than the IRDIS data beyond 40 au. This is coherent with the loose detection of the disk achieved in the data at J band. The detection limits confirm that the 2019 data are less sensitive than the 2016 epoch in spite of the better seeing and coherence time.
We combined the detection limits obtained at the three epochs of SPHERE observations together with the available HARPS radial velocity data (Section 2.2) on the star through the MESS2 tool (Lannier et al. 2017). The tool runs Monte Carlo simulations and compares them against the observations at each epoch to evaluate the detection probabilities down to 0.1 au semimajor axis. We assumed a flat distribution of planet eccentricities from to 0.9 and report the results in Fig 7 for planets coplanar with the disk.
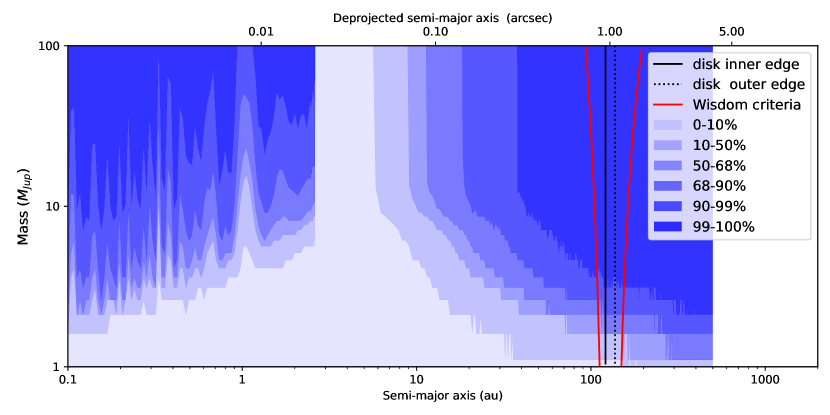
We exclude (90% probability) brown dwarf (M13.6 MJup) companions from 0.1 to 0.9 au, for instance, inside the warm belt component proposed by C14. The imaging data rule out planets more massive than 4 MJup beyond 50 au and up to the disk inner edge.
In an attempt to bring additional constraints from the known system architecture, we investigated whether the very steep inner and outer edges of the disk might be due to the presence of an undetected low-mass companion. A possible mechanism to explain such a sharp ring is indeed the presence of a gravitational perturber shaping the inner or the outer edge of the disk because a planet is surrounded by a chaotic zone where the orbits of potential particles are unstable (Wisdom 1980). The width of this chaotic zone created by the overlap of mean-motion resonances of a planet on a circular orbit is given by
| (3) |
where is the ratio of the planetary to stellar mass, and a is the semimajor axis of the planet. Mustill & Wyatt (2012a) extended this result with numerical simulations to the case of a planet on an eccentric orbit, showing that Eq. 3 still applies when the eccentricity is kept below the critical value of . In our case, this means that Eq. 3 remains valid for an eccentricity below for planets with masses lower than 30 MJup. We show in Fig. 7 with the red line the mass and semimajor axis of planets with an outer (inner) edge of the chaotic zone corresponding to the inner (outer) edge of the debris disks, overplotted with our detection limits. We can exclude with a confidence level higher than 90% that planets more massive than 3 MJup shape the inner or outer edge of the disk.
To conclude, we note that the analysis of the Gaia-eDR3 and HIPPARCOS data (e.g, Kervella et al. 2021) do not reveal significant differences in proper motion values that could be exploited to place further constraints on unseen companions in the system.
4 Discussion and conclusions
HD 141011 is the 53th debris disk that has been resolved in scattered light. It can be compared to the growing sample of related GPI and SPHERE disks that are resolved around stars from the association (see the Appendix A for a summary of the disk and host star properties based on the latest observational inputs, e.g., the Gaia eDR3). We show in figure 8 the radial extent of these disks (except for HD98363, for which no values are reported in the literature). We overlaid the position of the cold classical Kuiper belt (42-47 au) whose objects are thought to have experienced the least interactions with the migrating planets (Parker & Kavelaars 2010; Gomes 2021) and might provide a representative comparison to the radial dust distribution of young debris disks. The symbol sizes are proportional to the reported fractional luminosities.
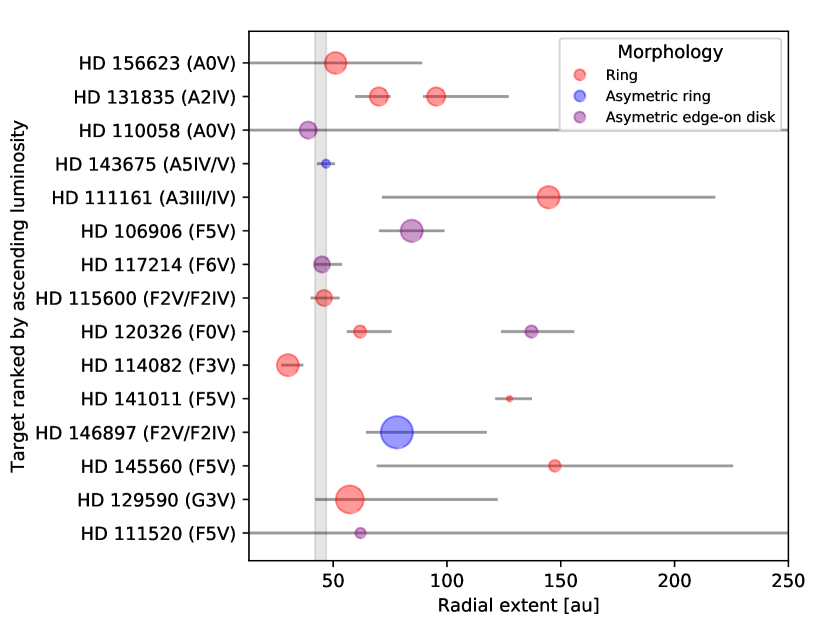
HD141011 has the faintest fractional luminosity () and is one of the largest rings of debris that have been imaged in Sco-Cen. Its inclination and brightness enhancement on the forward-scattering side makes it favorable for detection in scattered light, and our multi-epoch observations have been critical in vetting the detection. The figure also shows no clear correlation between the belt spatial location and the star’s luminosity (e.g., Pawellek et al. 2014; Matrà et al. 2018; Esposito et al. 2020). The sample in Sco-Cen is still limited (in particular, the range of stellar luminosity), however, and the figure rather reveals the unique diversity of architectures encountered in the association.
The ring is found at a larger separation than predicted by the power-law radius - stellar luminosity relation derived by Esposito et al. (2020) and Matrà et al. (2018). When resolved debris disks are considered regardless of their age, the reference radius and fractional luminosity of HD 141011 are relatively close to those of the ring of debris surrounding the F-type star HD 160305 (Perrot et al. 2019). This young ( Myr; e.g., Miret-Roig et al. 2020) disk has also been resolved with SPHERE, but shows a clear asymmetry, and the outer edge is shallower than that of HD 141011.
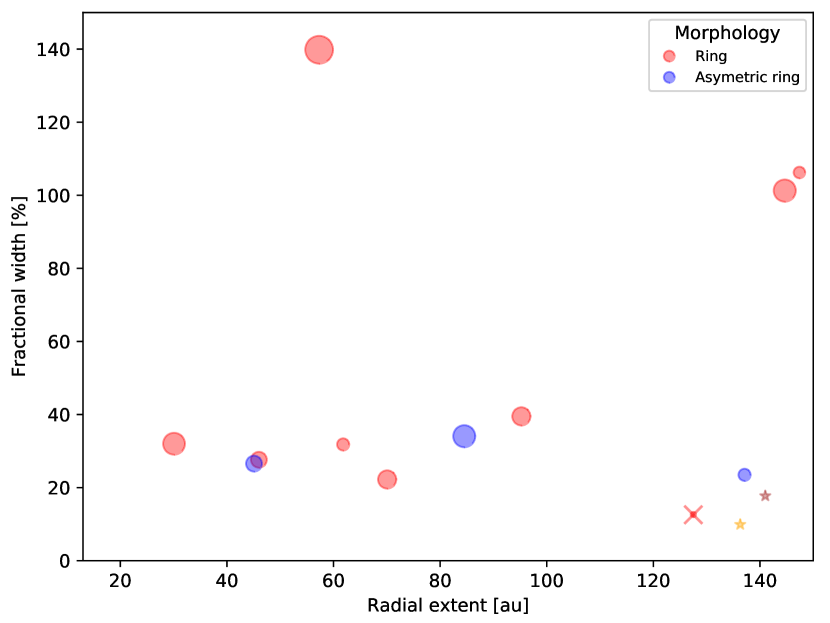
The fractional width of the rings () can inform about the dust confinement mechanisms (Mustill & Wyatt 2012b). The disks in Sco-Cen have all been observed at commensurable spatial resolutions (SPHERE/GPI). However, large uncertainties remain on the disk and values (Table 5) because most of these values rely on the modeling of the flux distribution (with sometime fixed values) in a relatively low S/N regime, which in turn depends on the disk orientation. A tentative analysis is shown in Figure 9. Disks with radii smaller than 100 au have comparable fractional widths below 40%. HD129590 appears as an outlier in this separation range: it has the largest fractional width and highest fractional luminosity. Matthews et al. (2017) noted however that the morphology of this disk might be more complex than a simple ring. Moreover, we did not include several disks whose morphology is less constrained (HD 156623, HD146897) and which might populate this parameter space. Conversely, HD141011 falls close to the outer belt of HD 120326, but the latter is a peculiar case, showing a strong asymmetry that might be related to large-scale structures seen at optical wavelengths (Bonnefoy et al. 2017). When all known debris disks resolved in scattered light are considered (see Adam et al. 2021, for a complete sensus), the spatial extent and fractional width of HD 141011 are in fact similar to the ones of the emblematic older disk around Fomalhaut (Kalas et al. 2005, 2013; MacGregor et al. 2017). The fractional width and low (or null) eccentricity of HD141011 is also similar to that of HR4796, whose age is more similar to that of HD 141011 (e.g., TW Hydrae association; 10 Myr Weinberger et al. 2013; Ducourant et al. 2014). Planets have been proposed to explain the morphologies of both Fomalhaut and HR4796 (e.g., Lagrange et al. 2012; Pearce et al. 2021), and the detection limits (Section 3.3) for the system must now be improved, in particular, along the semiminor axis with deeper observations benefiting from improved AO and contrast performances (SPHERE star-hopping mode, SPHERE+, see Boccaletti et al. 2020), the JWST, or the E-ELT.
Acknowledgements.
We thank our anonymous referees for their constructive comments which helped improving the manuscript. We thank the ESO staff for the help during the preparation of the observations and their execution. We are grateful to the SPHERE consortium for providing us with the most recent measurements of the instrument platescale and True North. We thank Aurélia Leclerc from IPAG for fruitful discussions about the robustness of the Gaia-eDR3 and HIPPARCOS proper motion determination. We acknowledge support in France from the French National Research Agency (ANR) through project grants ANR-14-CE33-0018 and ANR-20-CE31-0012, the CNRS-D2P PICS grant, and the Programmes Nationaux de Planetologie et de Physique Stellaire (PNP & PNPS). This project has received funding from the European Research Council (ERC) under the European Union’s Horizon 2020 research and innovation programme (COBREX; grant agreement 885593). SDe, RGr, CLa, and Dme acknowledge financial support from the ASI-INAF agreement n.2018-16-HH.0 and from PRIN-INAF 2019 ”Planetary systems at young ages (PLATEA)”. C.P. acknowledges funding from the Australian Research Council via FT170100040 and DP180104235. J. O. acknowledges support by ANID, – Millennium Science Initiative Program – NCN19_171, from the Universidad de Valparaíso, and from Fondecyt (grant 1180395). This work has made use of the SPHERE Data Centre, jointly operated by OSUG/IPAG (Grenoble), PYTHEAS/LAM/CeSAM (Marseille), OCA/Lagrange (Nice), Observatoire de Paris/LESIA (Paris), and Observatoire de Lyon/CRAL, and supported by a grant from Labex OSUG@2020 (Investissements d’avenir – ANR10 LABX56). This publication makes use of VOSA, developed under the Spanish Virtual Observatory project supported by the Spanish MINECO through grant AyA2017-84089. VOSA has been partially updated by using funding from the European Union’s Horizon 2020 Research and Innovation Programme, under Grant Agreement nº 776403 (EXOPLANETS-A).References
- Adam et al. (2021) Adam, C., Olofsson, J., van Holstein, R. G., et al. 2021, arXiv e-prints, arXiv:2107.06316
- Arnold et al. (2019) Arnold, J. A., Weinberger, A. J., Videen, G., & Zubko, E. S. 2019, arXiv e-prints [arXiv:1902.10183]
- Augereau et al. (1999) Augereau, J. C., Lagrange, A. M., Mouillet, D., Papaloizou, J. C. B., & Grorod, P. A. 1999, A&A, 348, 557
- Ballering et al. (2017) Ballering, N. P., Rieke, G. H., Su, K. Y. L., & Gáspár, A. 2017, ApJ, 845, 120
- Baraffe et al. (2003) Baraffe, I., Chabrier, G., Barman, T. S., Allard, F., & Hauschildt, P. H. 2003, A&A, 402, 701
- Bayo et al. (2008) Bayo, A., Rodrigo, C., Barrado Y Navascués, D., et al. 2008, A&A, 492, 277
- Beuzit et al. (2019) Beuzit, J. L., Vigan, A., Mouillet, D., et al. 2019, A&A, 631, A155
- Boccaletti et al. (2020) Boccaletti, A., Chauvin, G., Mouillet, D., et al. 2020, arXiv e-prints, arXiv:2003.05714
- Bohn et al. (2019) Bohn, A. J., Kenworthy, M. A., Ginski, C., et al. 2019, A&A, 624, A87
- Bonnefoy et al. (2017) Bonnefoy, M., Milli, J., Ménard, F., et al. 2017, A&A, 597, L7
- Cantalloube et al. (2020) Cantalloube, F., Farley, O. J. D., Milli, J., et al. 2020, A&A, 638, A98
- Chen et al. (2014) Chen, C. H., Mittal, T., Kuchner, M., et al. 2014, ApJS, 211, 25
- Claudi et al. (2008) Claudi, R. U., Turatto, M., Gratton, R. G., et al. 2008, in Society of Photo-Optical Instrumentation Engineers (SPIE) Conference Series, Vol. 7014, Society of Photo-Optical Instrumentation Engineers (SPIE) Conference Series, 3
- Currie et al. (2015) Currie, T., Lisse, C. M., Kuchner, M., et al. 2015, ApJ, 807, L7
- Cutri et al. (2003) Cutri, R. M., Skrutskie, M. F., van Dyk, S., et al. 2003, VizieR Online Data Catalog, II/246
- de Zeeuw et al. (1999) de Zeeuw, P. T., Hoogerwerf, R., de Bruijne, J. H. J., Brown, A. G. A., & Blaauw, A. 1999, AJ, 117, 354
- Delorme et al. (2017) Delorme, P., Meunier, N., Albert, D., et al. 2017, in SF2A-2017: Proceedings of the Annual meeting of the French Society of Astronomy and Astrophysics, ed. C. Reylé, P. Di Matteo, F. Herpin, E. Lagadec, A. Lançon, Z. Meliani, & F. Royer, Di
- Dohlen et al. (2008) Dohlen, K., Langlois, M., Saisse, M., et al. 2008, in Society of Photo-Optical Instrumentation Engineers (SPIE) Conference Series, Vol. 7014, Society of Photo-Optical Instrumentation Engineers (SPIE) Conference Series, 3
- Dohnanyi (1969) Dohnanyi, J. S. 1969, J. Geophys. Res., 74, 2531
- Draine & Lee (1984) Draine, B. T. & Lee, H. M. 1984, ApJ, 285, 89
- Draper et al. (2016) Draper, Z. H., Duchêne, G., Millar-Blanchaer, M. A., et al. 2016, ArXiv e-prints [arXiv:1605.02771]
- Ducourant et al. (2014) Ducourant, C., Teixeira, R., Galli, P. A. B., et al. 2014, A&A, 563, A121
- Engler et al. (2020) Engler, N., Lazzoni, C., Gratton, R., et al. 2020, A&A, 635, A19
- Engler et al. (2017) Engler, N., Schmid, H. M., Thalmann, C., et al. 2017, A&A, 607, A90
- Esposito et al. (2020) Esposito, T. M., Kalas, P., Fitzgerald, M. P., et al. 2020, AJ, 160, 24
- Feldt, M. et al. (2017) Feldt, M., Olofsson, J., Boccaletti, A., et al. 2017, A&A, 601, A7
- Gagné et al. (2018) Gagné, J., Mamajek, E. E., Malo, L., et al. 2018, ApJ, 856, 23
- Gaia Collaboration (2020) Gaia Collaboration. 2020, VizieR Online Data Catalog, I/350
- Galicher et al. (2018) Galicher, R., Boccaletti, A., Mesa, D., et al. 2018, A&A, 615, A92
- Galland et al. (2005) Galland, F., Lagrange, A. M., Udry, S., et al. 2005, A&A, 443, 337
- Gibbs et al. (2019) Gibbs, A., Wagner, K., Apai, D., et al. 2019, AJ, 157, 39
- Gomes (2021) Gomes, R. 2021, Icarus, 357, 114121
- Gomez Gonzalez et al. (2017) Gomez Gonzalez, C. A., Wertz, O., Absil, O., et al. 2017, AJ, 154, 7
- Hom et al. (2020) Hom, J., Patience, J., Esposito, T. M., et al. 2020, AJ, 159, 31
- Jang-Condell et al. (2015) Jang-Condell, H., Chen, C. H., Mittal, T., et al. 2015, ApJ, 808, 167
- Janson et al. (2013) Janson, M., Lafrenière, D., Jayawardhana, R., et al. 2013, ApJ, 773, 170
- Kalas et al. (2005) Kalas, P., Graham, J. R., & Clampin, M. 2005, Nature, 435, 1067
- Kalas et al. (2013) Kalas, P., Graham, J. R., Fitzgerald, M. P., & Clampin, M. 2013, ApJ, 775, 56
- Kalas et al. (2015) Kalas, P. G., Rajan, A., Wang, J. J., et al. 2015, ApJ, 814, 32
- Kasper et al. (2015) Kasper, M., Apai, D., Wagner, K., & Robberto, M. 2015, ApJ, 812, L33
- Kennedy & Wyatt (2014) Kennedy, G. M. & Wyatt, M. C. 2014, MNRAS, 444, 3164
- Kervella et al. (2021) Kervella, P., Arenou, F., & Thévenin, F. 2021, arXiv e-prints, arXiv:2109.10912
- Kral et al. (2020) Kral, Q., Matrà, L., Kennedy, G. M., Marino, S., & Wyatt, M. C. 2020, MNRAS, 497, 2811
- Lafrenière et al. (2007) Lafrenière, D., Marois, C., Doyon, R., Nadeau, D., & Artigau, É. 2007, ApJ, 660, 770
- Lagrange et al. (2016) Lagrange, A.-M., Langlois, M., Gratton, R., et al. 2016, A&A, 586, L8
- Lagrange et al. (2012) Lagrange, A. M., Milli, J., Boccaletti, A., et al. 2012, A&A, 546, A38
- Lannier et al. (2017) Lannier, J., Lagrange, A. M., Bonavita, M., et al. 2017, A&A, 603, A54
- Lee & Chiang (2016) Lee, E. J. & Chiang, E. 2016, ApJ, 827, 125
- Li & Greenberg (1998) Li, A. & Greenberg, J. M. 1998, A&A, 331, 291
- Lieman-Sifry et al. (2016) Lieman-Sifry, J., Hughes, A. M., Carpenter, J. M., et al. 2016, ApJ, 828, 25
- MacGregor et al. (2017) MacGregor, M. A., Matrà, L., Kalas, P., et al. 2017, ApJ, 842, 8
- Macintosh et al. (2015) Macintosh, B., Graham, J. R., Barman, T., et al. 2015, Science, 350, 64
- Macintosh et al. (2008) Macintosh, B. A., Graham, J. R., Palmer, D. W., et al. 2008, in Proc. SPIE, Vol. 7015, Adaptive Optics Systems, 701518
- Maire et al. (2016) Maire, A.-L., Bonnefoy, M., Ginski, C., et al. 2016, A&A, 587, A56
- Mamajek et al. (2002) Mamajek, E. E., Meyer, M. R., & Liebert, J. 2002, AJ, 124, 1670
- Marois et al. (2006) Marois, C., Lafrenière, D., Doyon, R., Macintosh, B., & Nadeau, D. 2006, ApJ, 641, 556
- Marois et al. (2008) Marois, C., Macintosh, B., Barman, T., et al. 2008, Science, 322, 1348
- Marois et al. (2010) Marois, C., Zuckerman, B., Konopacky, Q. M., Macintosh, B., & Barman, T. 2010, Nature, 468, 1080
- Matrà et al. (2018) Matrà, L., Marino, S., Kennedy, G. M., et al. 2018, ApJ, 859, 72
- Matthews et al. (2017) Matthews, E., Hinkley, S., Vigan, A., et al. 2017, ApJ, 843, L12
- Mawet et al. (2014) Mawet, D., Milli, J., Wahhaj, Z., et al. 2014, ApJ, 792, 97
- Mayor et al. (2003) Mayor, M., Pepe, F., Queloz, D., et al. 2003, The Messenger, 114, 20
- Mesa et al. (2015) Mesa, D., Gratton, R., Zurlo, A., et al. 2015, A&A, 576, A121
- Milli et al. (2012) Milli, J., Mouillet, D., Lagrange, A. M., et al. 2012, A&A, 545, A111
- Miret-Roig et al. (2020) Miret-Roig, N., Galli, P. A. B., Brandner, W., et al. 2020, A&A, 642, A179
- Moór et al. (2017) Moór, A., Curé, M., Kóspál, Á., et al. 2017, ApJ, 849, 123
- Mustill & Wyatt (2012a) Mustill, A. J. & Wyatt, M. C. 2012a, MNRAS, 419, 3074
- Mustill & Wyatt (2012b) Mustill, A. J. & Wyatt, M. C. 2012b, MNRAS, 419, 3074
- Nelder & Mead (1965) Nelder, J. A. & Mead, R. 1965, The Computer Journal, 7, 308
- Padgett & Stapelfeldt (2016) Padgett, D. & Stapelfeldt, K. 2016, in IAU Symposium, Vol. 314, IAU Symposium, ed. J. H. Kastner, B. Stelzer, & S. A. Metchev, 175–178
- Parker & Kavelaars (2010) Parker, A. H. & Kavelaars, J. J. 2010, ApJ, 722, L204
- Pawellek et al. (2014) Pawellek, N., Krivov, A. V., Marshall, J. P., et al. 2014, ApJ, 792, 65
- Pearce et al. (2021) Pearce, T. D., Beust, H., Faramaz, V., et al. 2021, arXiv e-prints, arXiv:2103.04977
- Perrot et al. (2019) Perrot, C., Thebault, P., Lagrange, A.-M., et al. 2019, A&A, 626, A95
- Pinte et al. (2009) Pinte, C., Harries, T. J., Min, M., et al. 2009, A&A, 498, 967
- Pinte et al. (2006) Pinte, C., Ménard, F., Duchêne, G., & Bastien, P. 2006, A&A, 459, 797
- Rameau et al. (2013) Rameau, J., Chauvin, G., Lagrange, A.-M., et al. 2013, ApJ, 779, L26
- Rouleau & Martin (1991) Rouleau, F. & Martin, P. G. 1991, ApJ, 377, 526
- Soummer et al. (2012) Soummer, R., Pueyo, L., & Larkin, J. 2012, ApJ, 755, L28
- Su et al. (2017) Su, K. Y. L., MacGregor, M. A., Booth, M., et al. 2017, AJ, 154, 225
- Thébault (2009) Thébault, P. 2009, A&A, 505, 1269
- Vigan et al. (2010) Vigan, A., Moutou, C., Langlois, M., et al. 2010, MNRAS, 407, 71
- Wahhaj et al. (2016) Wahhaj, Z., Milli, J., Kennedy, G., et al. 2016, A&A, 596, L4
- Weinberger et al. (2013) Weinberger, A. J., Anglada-Escudé, G., & Boss, A. P. 2013, ApJ, 762, 118
- Wisdom (1980) Wisdom, J. 1980, AJ, 85, 1122
- Wyatt (2008) Wyatt, M. C. 2008, ARA&A, 46, 339
Appendix A Disks in Sco-Cen
We report in this section a homogeneous set of properties of debris disks that have been resolved in scattered light in Sco-Cen. The host star luminosities were estimated with the VOSA tool (Bayo et al. 2008). The dust radial distributions and the infrared luminosity are updated based on the Gaia-EDR3 parallaxes.
The parameters defining the disk radial distributions (, , ) vary depending on the framework used to model the images (e.g., Wahhaj et al. 2016; Esposito et al. 2020; Lagrange et al. 2016), or are directly extracted from the flux distribution in the images (; Feldt, M. et al. 2017) numerically deprojected whenever the disks are not seen edge-on. We re-estimated the minimum and maximum extent of the belts (, ) from , , and whenever the former was not given in the reference papers following the method described in Adam et al. (2021).
In the sample of targets, HD 98363 has been reported to form a 7000 au wide system with the K-type star Wray 15-788, bearing a circumstellar disk (Bohn et al. 2019), making that system an exceptional case within the sample of disks that are resolved in Sco-Cen. However, the Gaia-EDR3 increases the distance difference between the two objects ( pc) with respect to the DR2 (pc), as well as the significance of the deviation in proper motion on the declination ( for the EDR3 versus for the DR2). Conversely, the difference in proper motion in right ascension ( for the EDR3 versus for the DR2) is slightly reduced. The nature of this putative system should be reinvestigated based on the improved astrometry and radial velocity measurement of both objects, which are provided as part of the future releases of Gaia.
| # Name | Distance | L/L⊙ | Sub-grp | # belts | r0 | Morphology | Refs | ||||||
|---|---|---|---|---|---|---|---|---|---|---|---|---|---|
| (pc) | (au) | (au) | (au) | (au) | |||||||||
| HD 156623a | UCL | 1 | 13.70 | 89.13 | … | … | … | … | ring | 2, 3 | |||
| HD 98363 | LCC | 1 | … | … | … | … | … | … | asym. ring | 4, 3 | |||
| HD 131835a | UCL | 1 | 59.68 | 75.24 | … | … | … | 70.06 | ring | 5, 3 | |||
| 2 | 89.52 | 127.14 | 103.79 | ring | 5, 3 | ||||||||
| HD 110058a | LCC | 1 | … | … | … | 39.02 | asym. edge-on | 6, 3 | |||||
| HD 143675 | UCL | 1 | … | … | … | … | edge-on | 4, 3 | |||||
| HD 111161 | LCC | 1 | … | … | … | … | ring | 4, 3 | |||||
| HD 106906d | LCC | 1 | 70.12b | 98.92b | 10.0 | … | asym. ring | 7, 8, 3 | |||||
| HD 117214 | UCL | 1 | 43.48b | 56.04b | … | asym. ring | 2, 9, 3 | ||||||
| HD 115600 | LCC | 1 | 40.08b | 52.79b | 7.5 | -7.5 | … | ring | 10, 11, 3 | ||||
| HD 120326d | UCL | 1 | 55.99b | 75.66b | 10: | -5: | … | ring | 12, 3 | ||||
| 2 | 123.75b | 155.97b | 10: | 137.1 | … | asym. ring | 12, 3 | ||||||
| HD 114082a | LCC | 1 | 30.43b | 41.25b | 10: | -4.98 | 30.08 | … | ring | 13, 3 | |||
| HD 141011 | UCL | 1 | 121.17b | 137.31b | 20: | … | ring | 6, 3 | |||||
| HD 146897a | US | 1 | 64.40b | 117.52b | … | edge-on | 14, 3 | ||||||
| HD 145560a | UCL | 1 | … | … | … | … | ring | 1, 3, 4 | |||||
| HD 129590a | UCL | 1 | 42.18b | 122.30b | … | ring | 15, 3 | ||||||
| HD 111520a,d | LCC | 1 | 32 | … | … | … | 62 | asym. edge-on | 16, 3 |
, 3 - Gaia Collaboration (2020), 4 - Hom et al. (2020), 5 - Feldt, M. et al. (2017), 6 - Kasper et al. (2015), 7 - Kalas et al. (2015), 8 - Lagrange et al. (2016), 9 - Engler et al. (2020), 10 - Currie et al. (2015), 11 - Gibbs et al. (2019), 12 - Bonnefoy et al. (2017), 13 - Wahhaj et al. (2016), 14 - Engler et al. (2017), 15 - Matthews et al. (2017), 16 - Draper et al. (2016).
Notes: a Also resolved at submillimeter wavelengths (Lieman-Sifry et al. 2016; Kral et al. 2020). b Estimated from , , and . c Fractional luminosity of both belts, d Extended structures at optical wavelengths (Kalas et al. 2015; Padgett & Stapelfeldt 2016; Bonnefoy et al. 2017), e Esposito et al. (2020) presents a lower limit for Rout of 196.2 au.
Appendix B Disk modeling
Fig. 10 shows the SED of the 48 disk models.