Pulse shape discrimination for GRIT: beam test of a new integrated charge and current preamplifier coupled with high granularity Silicon detectors.
Abstract
The GRIT (Granularity, Resolution, Identification, Transparency) Silicon array is intended to measure direct reactions. Its design is based on several layers (three layers in the forward direction, two backward) of custom-made trapezoidal and square detectors. The first stage is 500 m thick and features 128128 orthogonal strips. Pulse shape analysis for particle identification is implemented for this first layer. Given the compacity of this array and the large number of channels involved (7,500), an integrated preamplifier, iPACI, that gives charge and current information has been developed in the AMS 0.35 m BiCMOS technology. The design specifications and results of the test bench are presented. Considering an energy range of 50 MeV and an energy resolution (FWHM) of 12 keV (FWHM) for the preamplifier, the energy resolution for one strip obtained from alpha source measurement in real conditions is 35 keV. The current output bandwidth is measured at 130 MHz for small signals and the power consumption reaches 40 mW per detector channel. A first beam test was performed coupling a nTD trapezoidal double-sided stripped Silicon detector of GRIT with the iPACI preamplifier and a 64-channel digitizer. Z=1 particles are discriminated with pulse shape analysis technique down to 2 MeV for protons, 2.5 MeV for deuterons and 3 MeV for tritons. The effect of the strip length due to the trapezoidal shape of the detector is investigated on both the N- and the P-side, showing no significant impact.
keywords:
Direct reactions , Pulse shape analysis , Semi-conductor detectors , preamplifier , ASIC1 Introduction
Direct reactions are one of the cornerstones to study nuclear structure and nuclear astrophysics as they provide precise information on the single particle and collective properties of nuclear states. The limitation to stable beams in direct kinematics was overcome by the inverse kinematics where the probe is no longer the beam but the target. A wide range of radioactive ion beams becomes available and opens up a complete new era of direct reactions studies. However inverse kinematics comes with a number of experimental challenges. Some of them have been solved with the Silicon detector technology that enables to identify and measure the energy loss and angle of charged particles with a large angular coverage. Moreover, the new generation of facilities in Europe, like SPES [1], HIE-ISOLDE [2] or FAIR [3] will provide heavy radioactive beams that will raise new experimental challenges. Indeed the nuclei investigated through direct reactions will have a high density of states. The measurement of the light ejectiles only will not be sufficient to identify the populated states and coupling with gamma-rays detectors will be crucial. This is the reason for which the new generation of Silicon arrays like GODDESS [4], T-REX [5] and GRIT [6] are designed to be coupled with state-of-the-art gamma arrays.
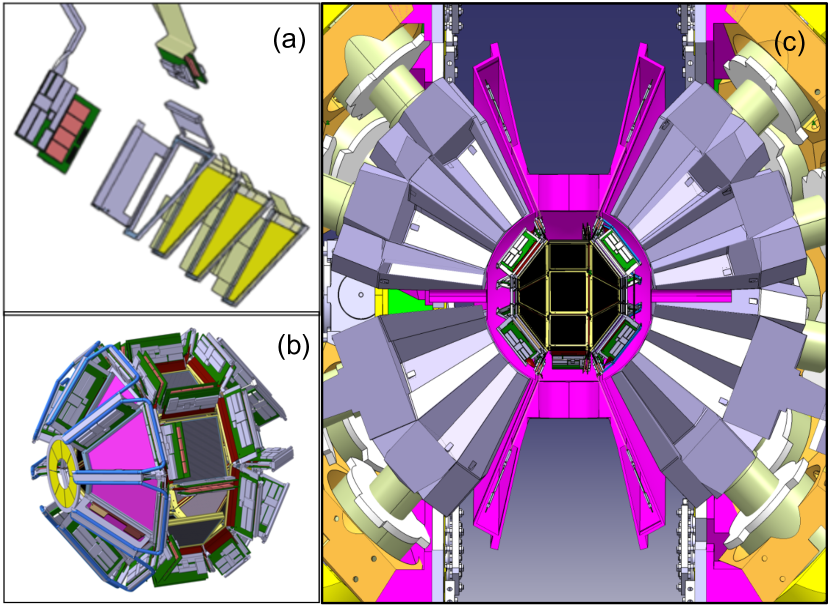
In this paper we will focus on the developments for the GRIT Silicon array to be coupled with AGATA [7]. Its design (see Fig. 1) fits into a 23-cm radius sphere (the one of AGATA) and is as transparent as possible to gamma-rays. It is composed of two rings (one forward and one backward with respect to the beam direction) of 8 trapezoidal telescopes, each composed of 2 (in the backward hemisphere) to 3 layers (in the forward hemisphere) of double-sided stripped Silicon detectors (DSSD). The detectors feature different thicknesses: 500 m for the front layer and 1.5 mm for the others. A ring of 6 square detectors completes the set-up at 90 degrees. With 128 strips on each side for the first layer and 16 for the second and third layers, it amounts to more than 7,500 strips to be read in vacuum with front-end boards attached perpendicularly to the detectors. Table 1 summarizes the detector design of GRIT. The integration of the high-granularity detectors and electronics in a compact reaction chamber under vacuum is a major challenge for GRIT.
| Nb. Tel. | Thickness | Strips | |
|---|---|---|---|
| Forward | 8 | 500 m | 128X+ 128Y |
| 1500 m | 16X+ 16Y | ||
| 1500 m | 16X+ 16Y | ||
| Backward | 8 | 500 m | 128X+ 128Y |
| 1500 m | 16X+ 16Y | ||
| 90 degrees | 6 | 500 m | 128X+ 128Y |
| 1500 m | 16X+ 16Y |
In order to overcome the difficulties in particle identification (PId) inherent to the time-of-flight method used for particles which stop in the first layer of Silicon, the pulse shape analysis (PSA) technique is implemented [8, 9, 10, 11, 12, 13]. It relies on the shape of the current and/or charge signal to identify the particles. For a given energy, the lighter the particle the faster the rise time and the smaller the width of the current signal. This feature is very useful when the flight path of the particle is too short or when the instantaneous beam intensity is too high to have a time reference of good resolution ( 1.5 ns) like for beam tracking devices. Following the studies from the FAZIA collaboration [14, 15, 16, 17, 18] performed for pulse shape discrimination of heavy nuclei on a wide dynamic range (up to GeV), several studies of the PSA focussing on light particles have been carried out for GRIT [19, 20, 21, 22, 23]. They have shown that the optimal observable for the PId is the maximum of the current signal. Other observables can be used like the rise time of the charge signal at the expense of the particle discrimination quality [19].
Considering the large number of channels of the GRIT apparatus and the necessity to have both charge and current information, a new integrated preamplifier has been developed, the so-called iPACI (integrated Pre-Amplifier for Charge and current). Its first version featuring 9 channels and an energy range of 50 MeV is presented in Section 2. Its specification is described in Section 2.1, its architecture in Section 2.2, while the simulated performance is detailed in Section 2.3 and the test results using a pulser in Section 2.4. In Section 3, the results of a follow-up test experiment where this new circuit is coupled with a trapezoidal DSSD prototype of the GRIT project is presented. Note that previous tests had been performed with a neutron transmutation doped (nTD) 500 m thick square DSSD (62x62 mm2, 128x128 strips) designed specifically for the R&D studied of GRIT using an older version of the preamplifier, the discrete PACI preamplifiers [24]. So, this paper represents a very important additional step because it shows the results of the first beam test using a prototype of the first-layer trapezoidal shaped detector of GRIT read out by the first version of the integrated preamplifier iPACI. In Section 3, the Pulse Shape Analysis (PSA) results and the effect of the strip length on the particle discrimination will be presented.
2 iPACI design
The main integration constraint of the GRIT project is to implement 15,000 electronic channels (charge and current signals, related to 7,500 detector strips), in a very compact reaction chamber.
Designing an integrated preamplifier featuring a current output aimed at PSA purpose poses some challenges. The first of them is that the system bandwidth has to be high enough, while the noise kept low so that the detector current is accurately reproduced at the current output. Additionally, feeding fast-edged pulses to the outside of chips can lead to cross-talk and instabilities, due to the high current peaks flowing through the supplies.
The work presented below is the first prototype of the iPACI chip where the same architecture as the long-proven PACI design [24] was kept. Indeed, the usual three-stage architecture of discrete Charge-Sensitive Amplifier with Current Output circuits (abbreviated CSAw/CO below) was used, with independent charge and current, buffered outputs. Keeping the minimum chip size to be sent to fabrication, 4 mm2, the chip can accommodate nine channels.
2.1 Specifications
The first version of the iPACI chip is designed to read the first DSSD layer of the GRIT apparatus, where PSA will be performed. GRIT is mostly intended to detect light particles (Z2) and the 4He particles punch through 500 m Silicon at 33 MeV. The energy range for the first version of iPACI is 0.2 to 50 MeV, which corresponds to 8.9 to 2200 fC. The energy resolution is required to be of the order of 30 keV (FWHM) per strip, which is a typical value for DSSD. This implies below 10 keV resolution for the charge output after ideal shaper and at optimal time constant. The detection of light nuclei up to 12C, which punch through at an energy of 182 MeV, is also of interest. This is why two switchable ranges will be implemented for the final version: 0.2 to 50 MeV and 0.2 to 200 MeV. Increasing the dynamic range while keeping the performances represents a challenge for the next developments of the chip.
The amplitude range of the current signal depends on the depletion of the detector. When under-depleted, part of the charges produced at the lowest energies are created in a region with null electric field, leading to a small current peak. From the data of ref.[19], if we extrapolate our measurement to the lowest energies (10 fC) the smallest amplitude goes down to 10 A for under-depleted regime and 300 A for over-depleted regime. The maximum amplitude (for 2200 fC) is extrapolated for the over-depleted regime at 100 A for Z=1 particles and up to 200 A for 12C. The gain of the current output was set at 7000 V/A, yielding a 1.4 V swing for a 200 A input pulse.
Nevertheless the integration due to the parasitic components (detector capacitances, bonding wire, Kapton ribbon) and to the electronics integration, the current rise time is dominated by the collection time, and in particular it is expected to range from 4 ns to 60 ns, requiring a bandwidth of at least 90 MHz. The pulse width spread was specified from previous measurements with the PACI preamplifier.
For the specifications of the iPACI, the shortest event is assumed to be 20 ns long. On the other hand, the maximum pulse width was observed for the He isotopes, yielding 300 ns in the under-depleted regime and 80 ns for over-depleted regime. Wider signals are expected for Li and C isotopes.
The circuit is designed to operate on both sides of the detector, i.e. on both polarities. Furthermore, inter-strip events lead to inverse polarity with respect to normal events on the ohmic side [25] and have to be captured to be able to retrieve the information from the inter-strip events. Moreover, the GRIT detectors present a variety of strip lengths implying that the preamplifier has to accommodate a range of detector capacitances from 10 pF to 40 pF including kaptons capacitance.
Regarding heat management, the high compacity of the array allows only for 1 to 2 kW of power to be dissipated over the whole detector. Considering a system with approximately 7,500 detector channels, this yields a power consumption of 133 mW/detector channel, to be shared between the various circuits of the detector. For the preamplifier chip, the specification is 40 mW/detector channel. The main specification items are summarized in table 2.
| Outputs | |
|---|---|
| Energy max | 50 MeV in Silicon |
| Bipolar | True |
| ENC (Equivalent noise charge) | 10 keV FWHM (After optimal shaper, =20 pF) |
| Charge non-linearity | (up to 50 MeV) |
| Charge output recovery time | s |
| Current signal BW | 90 MHz |
| System data | |
| Technology | AMS 0.35 m BiCMOS |
| Supply | 3.3 V |
| Detector’s input capacitance | Compatible with [10 pF .. 40 pF] range |
| Current consumption | mW/detector channel |
2.2 Architecture and circuit design
Architecture
The chip is composed of nine independent channels, each comprising a local bias block, a Charge-Sensitive Amplifier with Current Output and two buffers. The channel input is connected to one detector’s strip, while the two buffer’s outputs are connected to high speed digitizers via pads.
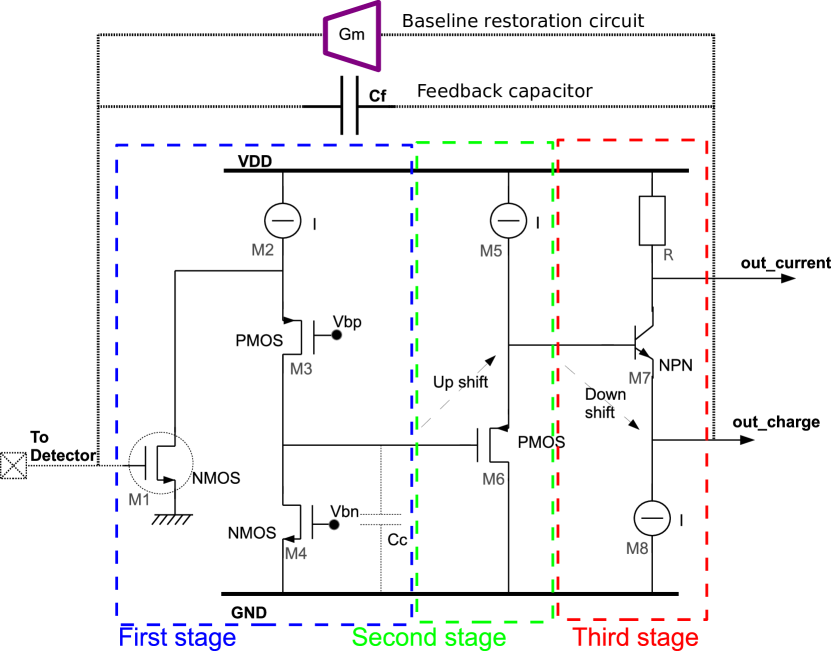
The architecture of one CSAw/CO channel is detailed in Fig. 2. It is composed of an Operational Transconductance amplifier (OTA), a baseline-restoration amplifier (Gm) and a feedback capacitor (). With such an arrangement, the CSAw/CO acts as a current integrator, i.e. a virtual ground at the input absorbs all the current from the detector and generates a voltage output at the out_charge node, which is (with the detector current, and respectively the feedback circuit’s equivalent resistance and feedback capacitor). The baseline-restoration amplifier makes sure that the out_charge node returns to a target voltage within a given time after an event. This duration is typically of the order of 100 s.
The charge and current outputs are single-ended continuous-time analog signals. The current signal is the amplified image of the current received from the detector, while the charge signal is the integral of the current signal. Because a feedback resistance would need to be of several M and would be very large on chip, a MOS-based block (), is used instead.
Operation
The first stage is where all the voltage gain takes place. This gain can be rather large (around 60 dB) due to the folded cascoding of M1 by M3 and due to the large transconductance of the input device () required for noise purposes. On the other hand, instabilities will occur here, due to the second pole, located at the source of transistor M3. A compensation capacitor, noted , will need to be sized accordingly.
The second stage operates a voltage shift up by one Gate-Source voltage. It needs to be fast enough to pass the signal on to the next stage, which is easily achieved on a unity-gain stage.
The third stage operates a shift down by approximately the same amount of voltage and provides a low impedance drive for the out_charge signal. The resistor senses the current through the output branch, thus generating the out_current output; while M7 acts as a cascode that separates the out_charge and out_current parts of the branch. The required speed is also very easy to reach on this branch, due to the unity-gain operation of M7 and the use of an NPN transistor, which features higher transconductance than an NMOS.
Stability adjustment
In order to keep the preamplifier stable despite varying strip lengths, i.e. varying strip capacitances, the compensation capacitor () was made digitally adjustable across 8 compensation levels, i.e. 3 bits.
Baseline-restoration circuit
The baseline-restoration circuit (Gm) insures that the preamplifier charge signal returns to its base line after an event. It can be done with a simple resistor or a more complex device. In our case, a resistor would simply take too much area on silicon due to its high value. Also, the fact that the preamplifier has be be bipolar imposes a more complex solution. A differential pair biased at 20 nA was used, which has the advantage of enabling the adjustment of the baseline voltage. On the other hand, the differential pair acts as a current source for large signals, hence discharging the feedback capacitor at a constant 20 nA current. This, as a consequence, leads to a linear-shaped return the baseline, thus preventing to use pole-zero compensation, also leading to sub-optimal shaping.
Output buffer
The output buffer is a two-stage miller-compensated single-ended OTA, wired up in a unity-gain configuration. This makes a simple design, as the OTA does not have to drive a low-resistance feedback circuit. Also, a unity gain insures the best speed.
2.3 Simulated performance
As a first step, the iPACI prototype has been connected to a “simulated detector” modelled by a 20 pF strip capacitance, 5 uA total detector leakage current, equally spread across the strips, and biased by a 10 M strip bias resistance. All simulations are done with the Spectre simulator [26], on Cadence Virtuoso 6.1.7, and using the AMS kit v.4.10. Note that unless otherwise specified, all figures were obtained at ambient temperature, 3.3 V supply, typical corner, maximum compensation capacitor setting, and with a 5 pF load on the output nodes, mimicking a PCB trace connected to a discrete operation amplifier. The performance achieved in this simulation are summarized in table 3. They show the feasibility of this project with reasonable consumption and area.
| Charge Output | |
|---|---|
| Charge signal swing | 1.6 V single-ended at 50 MeV |
| Charge gain | 32 mV/MeV |
| ENC | 10 keV FWHM |
| Charge output recovery time | 100 s |
| Current Output CSAw/CO | |
| Current gain | 7 k |
| Current signal swing | V single ended |
| Current signal BW | [4 MHz .. 130 MHz] |
| System data | |
| Compensation capacitor | Digitally tuneable [0.5 pF .. 2.25 pF], 0.25 pF step |
| Current consumption | 12 mA (40 mW)/ detector channel |
| Area used on silicon (pads excluded) | 370200 m/channel |
In the following, we analyse the energy resolution connecting an ideal CR-RC2 shaper with adjustable time constant at the chip’s charge output. The noise measured at the shaper’s output, in is referred back to the input in keV FWHM via the input-to-output transient gain, found via a transient simulation.- Fig. 3 shows the resolution obtained versus the shaper time constant. The optimum is found at 7.7 keV at 360 ns.
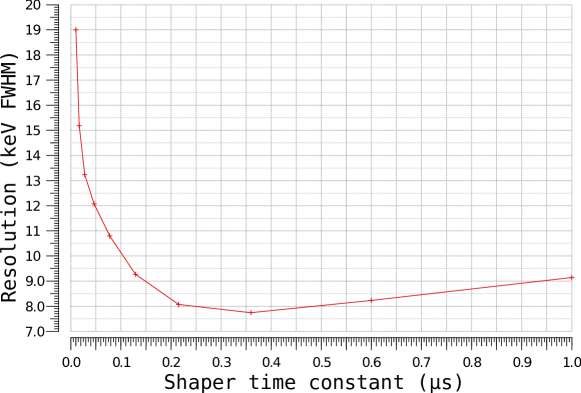
Table 4 presents the main contributors to the noise figure obtained on the previous simulation at the shaper’s optimal time constant (360 ns).
| Contributor | Percentage |
|---|---|
| Current bias circuit | 32.34 |
| CSAw/CO | 13.87 |
| Detector | 24.02 |
| Baseline restoration (Gm) | 26.69 |
| Various | 3.08 |
One notices a predominance of the bias circuitry, used to bias the analog stages at well defined current and very critical in low-noise designs, as largest contribution to the noise. The detector also contributes a significant amount of noise via its intrinsic noise () and the strip bias resistance. Finally, the baseline-restoration circuit has a significant impact, as it is directly connected to the input node, and constantly biased. As a conclusion, the table shows a quite balanced design, with all main contributors having a similar share.
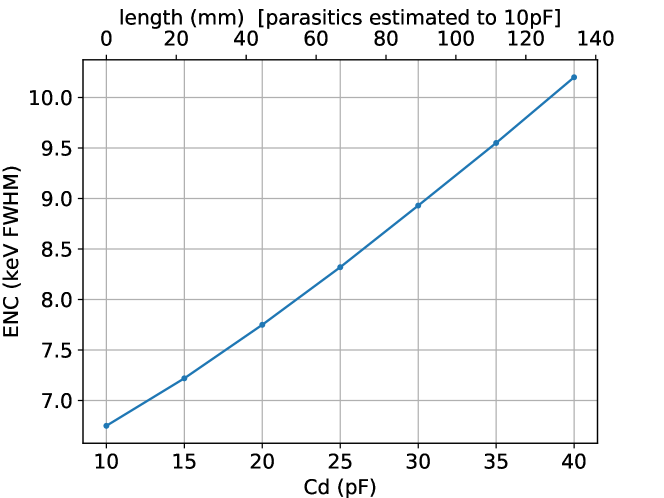
The simulation of the resolution versus the detector capacitance (Fig. 4) shows the effect of the strip length, directly related to the strip capacitance.
2.4 Test results
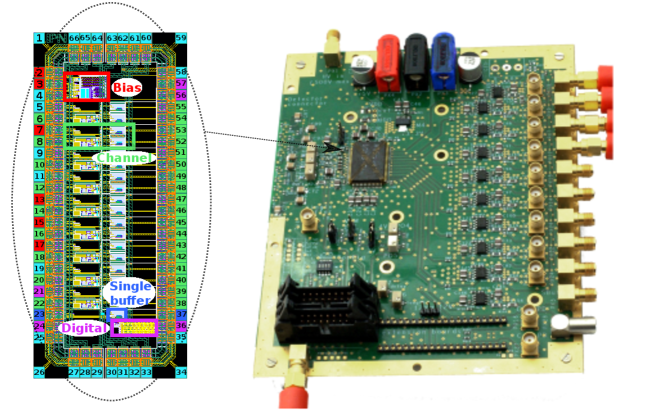
The ASIC was produced in AMS 0.35 m BiCMOS SiGe technology. In order to test the ASIC, a test board was designed and is shown on Fig. 5. The iPACI test board embeds one iPACI, connected to a detector connector and injection circuitry at its input; and to discrete output buffers at its output, driving 50 -terminated coax cables. Unless otherwise specified, all figures were obtained at ambient temperature, 3.4 V supply and maximum compensation capacitor setting. In this section, we present the test results and issues seen with this electronics.
Injection
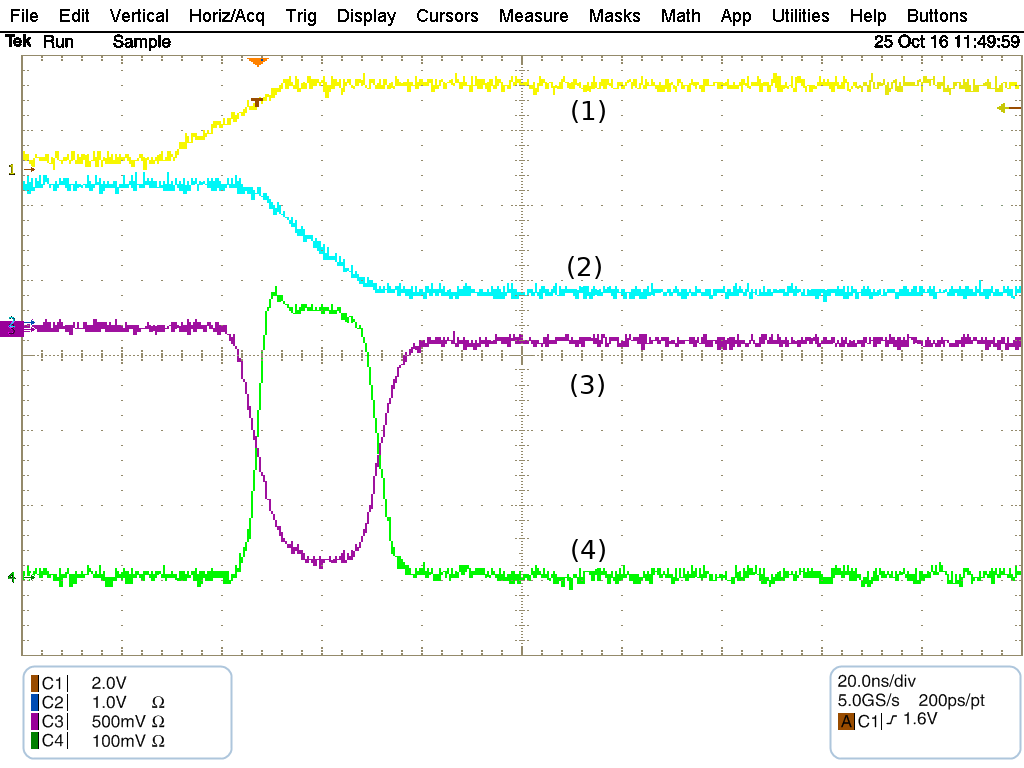
An injection signal of amplitude equivalent to 50 MeV was sent to the chip in order to verify that the functionality was correct. For that purpose, a function generator is connected to the detector input via a 1 pF capacitor, and is programmed to generate ramps of 25 ns rise time with adjustable amplitudes. The amplitude is calculated to match the required charge. The charge and current signals are in turn digitized by an oscilloscope (Tektronix TDS7154B). They can be seen Fig. 6, showing correct functionality.
Linearity
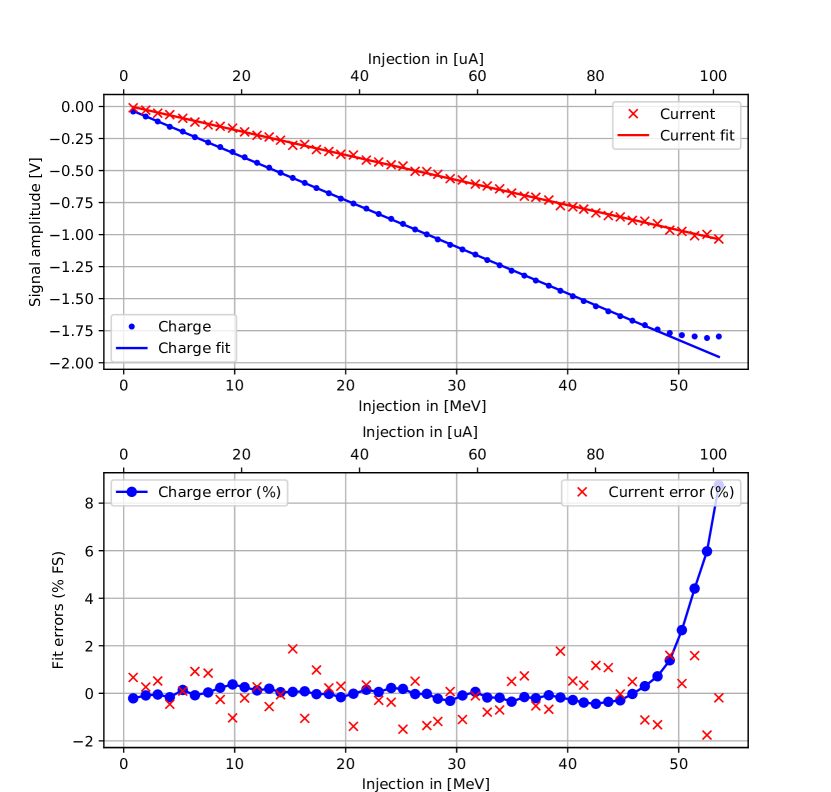
In order to measure the linearity, energies of increasing values are sent to an ASIC channel, while the output charge and current signals are digitized with the same setup as previously and fed to a PC. Charge and current peak voltage values are reported (Fig. 7, TOP) as a function of the input energy, expressed in MeV and A. The data are fitted using a linear regression, yielding a slope value for both measurements. For each data point measured on the charge output, the voltage deviation between the actual measurement and the fitted curve is referred back to MeV using the slope calculated previously. The results are plotted Fig. 7 (BOTTOM), as a percentage of the full scale (50 MeV), yielding a maximum non linearity lower than 2% up to 49.7 MeV injection, and rising very quickly after due to saturation. The current measurement is processed in the same way, yielding 2% maximum non linearity.
Speed
The speed performance of a preamplifier can easily be measured using the current output, which is an image of the input current, however limited by the system’s bandwidth. Speed can either be quoted in terms of bandwidth and measured via a small signal AC injection; or in terms of rise time, and measured as a result of a fast pulse input. We measured the iPACI speed performance using both methods.
In order to run the AC test, a programmable sinewave generator (Rohde&Schwarz SMX) is connected via a resistor to the channel input, and programmed to sweep its frequency from 10 MHz to 250 MHz. The output sinewave seen on the current output is digitized by an oscilloscope, and the traces are sent to a PC, which measures their peak-peak amplitudes. From the data, we measure 130 MHz (at 3dB).
The transient test is more straightforward. A high-performance pulse generator injects fast voltage ramps via a 1 pF capacitor. At 50 MeV equivalent injection, we measure a rise time of 4.3 ns (10-90%) on the current signal.
Note that the figure leads to a large-signal bandwidth of approximately 80 MHz, versus a small signal bandwidth of 130 MHz. This discrepancy is caused by the A-class nature of the stages used in the miller amplifier. This yields to a slew rate which is limited by the stages bias currents, i.e. a low large-signal bandwidth.
Equivalent noise charge (ENC)
The ENC is a measure of the noise present on the charge signal after an ideal shaper. The ENC is expressed in keV FWHM, hence requires to refer the output noise that is measured back to the input. For that purpose, the input-to-output gain is measured on a transient measurement of an energy-calibrated event, like it was done on simulation.
The noise measurement is done in steady-state after a low-noise shaper and an RMS-voltmeter (specific hardware was used), in order to simplify the setup. The shaper’s time constant is adjustable, and was swept across its whole range (10 ns to 1 s).
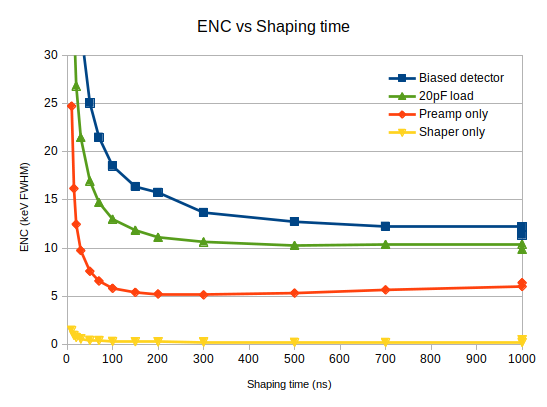
Several test setups were measured in order to fully qualify the system. As a first step, the shaper was measured on its own in order to make sure that its contribution to the overall noise was negligible. Then, the preamplifier and shaper only in order to qualify the noise contributed by the electronics. A PCB fitted with 20 pF capacitors was then plugged onto the detector connectors, thus enabling measurement of the detector’s parasitic capacitance contribution to the ENC. Finally, a DSSD was put in place and biased to its nominal voltage, showing the contribution of both parasitic capacitance and leakage current. The DSSD used is extensively described paragraph 3.1, followed by in-beam test results.
The results are shown Fig. 8, showing 12 keV FWHM ENC at 850 ns in presence of the detector. The measured value is very close to the simulated one. The discrepancy can easily be explained by the non idealities on the PCB (bond wires, supply decoupling, EMC) and unmodeled non-idealities of the detector
Equivalent noise current
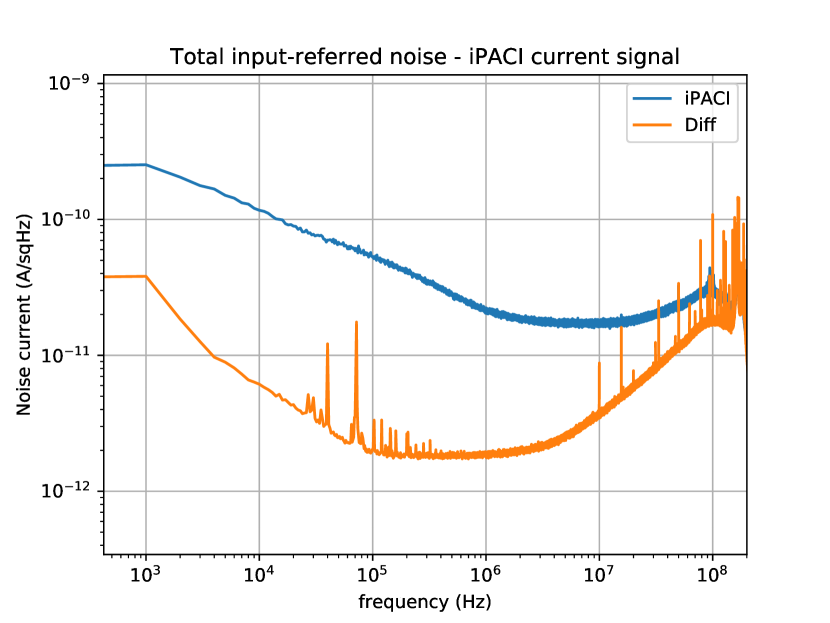
In order to measure the equivalent noise current, we measure the noise voltage on the current output and refer it back to the input using the gain from input to output. Similarly to the ENC, we use the gain seen on a calibrated event. More specifically, a low-noise 100-gain voltage amplifier is inserted between the current output and an oscilloscope. Noise traces were recorded and fed to a PC, which processes and plots the periodograms. In order to reduce the noise on the plot, 32 successive periodograms are averaged together. The obtained plots are shown in Fig. 9. They were made on the native iPACI’s current output (labelled iPACI on the figure) as well as on the differentiator’s output (labelled Diff) (see section 9 for details on the differentiator circuit). They suggest that the native current output noise could be greatly improved with a redesign, thus reaching the performance of the differentiator circuit.
Stability
Once a silicon detector is connected to the ASIC inputs, it strongly destabilizes the preamplifier. This effect is due to the strong strip capacitance seen from the preamp’s input to the experiment’s ground, and can be reproduced with the detector emulator PCB described earlier. This creates a strong sensitivity to the ASIC’s internal ground noise, which gets created in particular during output spikes.
Two ways were found to mitigate the issue, which are shown in Fig. 6 (signals 3 and 4). The first is to reduce the current spikes coming from the current output buffer by inserting a resistor of small value on its output, however limiting the bandwidth of the current signal. The other one is to differentiate the charge signal on PCB, using commercial opamps, at the expense of higher PCB area usage and significant additional consumption (Fig. 10).
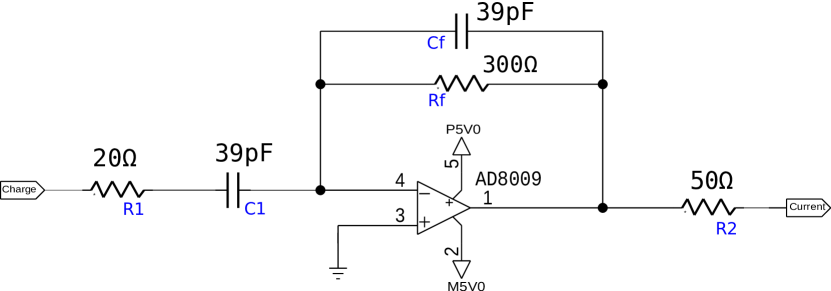
In this configuration, the opamp creates a virtual ground on its negative input. R1 feeds a current to the feedback network that is a derivative of the input signal. Rf converts this current to a voltage, also enabling adjustment of the conversion gain. R1 and Cf are present only to slightly reduce the bandwidth of the differentiator circuit, thus preventing instabilities.
3 Results of the first in beam test of the iPACI prototype with the GRIT trapezoidal prototype DSSD detectors
3.1 Trapezoidal DSSD from GRIT
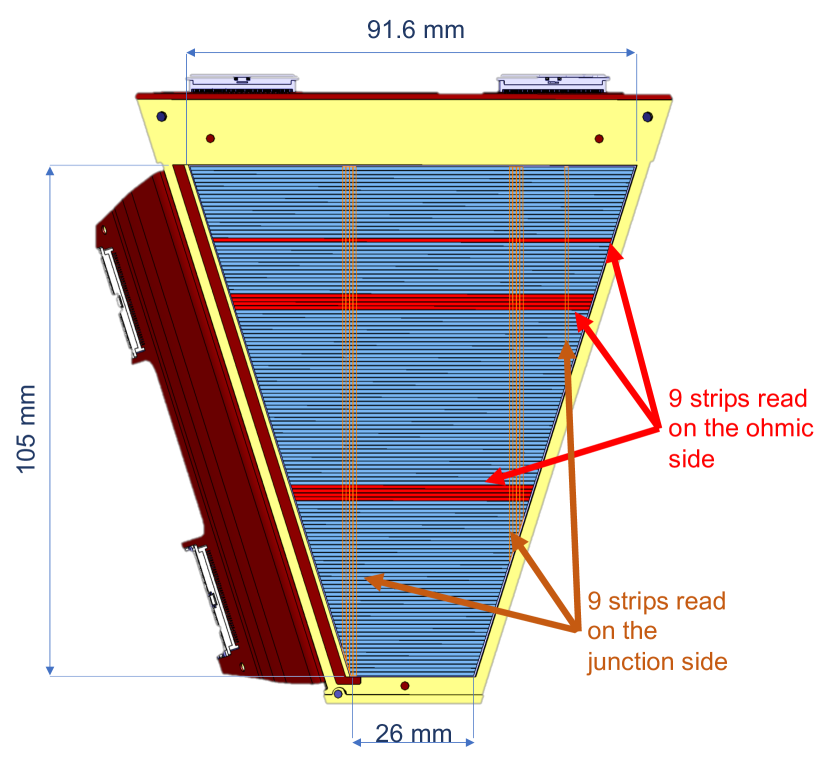
The iPACI preamplifier was tested with a GRIT prototype detector in beam. For this test, we used a 375 m thick trapezoidal DSSD of nTD type with a cut at 4 degrees (crystal orientation 100) to avoid channeling [27]. The DSSDs are manufactured by Micron Semiconductors Limited [28] in 6-inch technology. The design is custom-made (see Fig. 11) with the characteristics detailed in table 5. The packaging of the detector is designed to get as narrow frames as possible and the 20 mm long kapton ribbon cables are bent at 80 degrees and ended by two high density 80-pins connectors. The strips on the ohmic side are perpendicular to the strips on the junction side. The strip pitch is 800 m on the ohmic side and 700 m on the junction side. All its characteristics will be the final one except the thickness of the detector that will be 500 m for the final detectors. The detector was reverse-mounted for the experiment i.e. the ohmic side was facing the beam. Its nominal bias according to the constructor specification is 120 V. At this bias, the energy resolution from the alpha source calibration was found to range from 28 to 36 keV on the N-side and from 32 to 40 keV on the junction side.
| Characteristic | FFF2 |
|---|---|
| Wafer type | nTD 6 inch |
| Strip pitch ohmic side | 760 m |
| Strip pitch junction side | 710 m |
| Crystal orientation | 100 |
| Resisitivity | 2000 .cm |
| Thickness | 375 m |
| Active area | 5000 mm2 |
| Height | 105 mm |
| Metal coverage | Al 30 m |
| Dead layer | 1 m |
| Number of strips | 128X 128Y |
3.2 Experimental set-up and electronics chain
The in-beam test of the electronics and detector of GRIT was performed at the Tandem-ALTO facility in Orsay with a 7Li beam at 35 MeV impinging on a 100 g/cm2 12C target. This reaction has been extensively used for earlier PSA studies [19, 21] as it produces a large variety and amount of Z=1 and Z=2 particles.
As the goal of the experiment is to focus on particle identification, the DSSD was under-depleted at 80 V taking into account the reverse current (the depletion being 90 V) for the experiment to improve particle identification [19]. The leakage current in this case was 0.7 A corresponding to a 7 V drop in the applied bias and it was stable all along the experiment.
Given the trapezoidal shape of the detector, the strips have different lengths depending on their position along the detector. This is why samples of neighbouring strips with different lengths were chosen to be read for the test (see Fig. 11). A total of 9 strips were read on each side of the detector with one 9-channel iPACI ASIC for each side providing for each channel the charge and current signals. The iPACI chips were sitting at 5 cm from the detectors, in vacuum and were cooled down to 15 degrees. The total of 36 outputs (charge and current signals for both sides) were read by the Wavecatcher digitizer [29, 30], a 12-bit digitizer board with 1.25 V input dynamics. The Wavecatcher was set at a sampling rate of 400 MSa/s and a total window of 1024 samples with a trigger delay of 176 samples to cover the full bandwidth of both Silicon detectors and preamplifiers. The trigger was generated internally on charge signals with a discriminator threshold of 10 mV. If one channel triggered, all the 36 signals were written on disk. The maximum acquisition rate for 36 channels was about 100 Hz.
3.3 Pulse shape discrimination results
3.3.1 Data processing
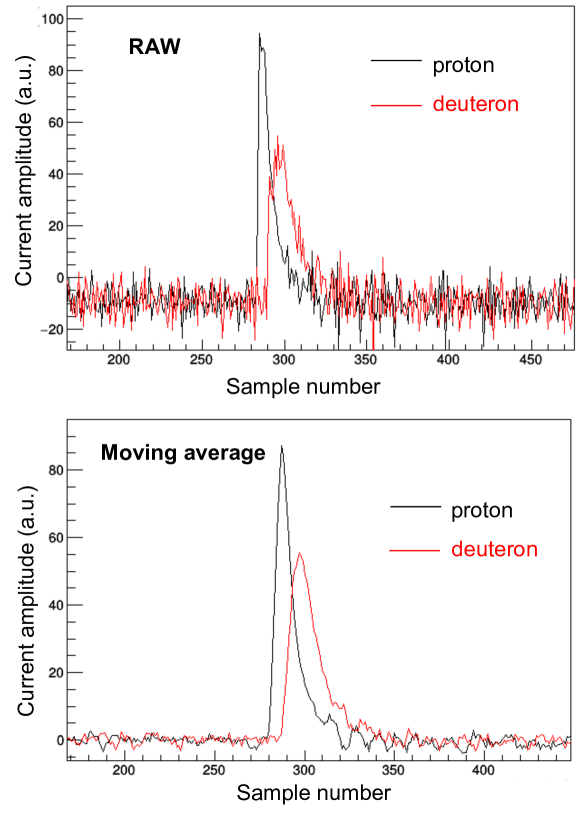
The first step of data processing is to remove the baseline of both charge and current signals by averaging the first 176 samples (i.e. noise samples before the actual peak). Typical raw current signals for a proton and a deuteron of 5 MeV as digitized by the WaveCatcher are shown on Fig. 12 (top). These signals are then filtered by applying a moving average on 7 samples for the current signal corresponding to a bandwidth of 25 MHz. The corresponding signals are shown on Fig. 12 (bottom). The amplitude of the current signal (Imax) is determined after the filter as the maximum of the signal.
The charge signal is filtered by applying a moving average on 101 samples (1.75 MHz bandwidth). The energy of the particles is deduced from the maximum of the charge signal. The energy calibration was performed using triple alpha sources and the punchthrough of the Z=1 particles and of the alpha particles.
Interstrip events can be further suppressed by requiring the coincidence between the P- and N-side with the condition that the energy difference between both sides is less than 0.5 MeV.
3.3.2 Pulse shape discrimination and effect of strip length
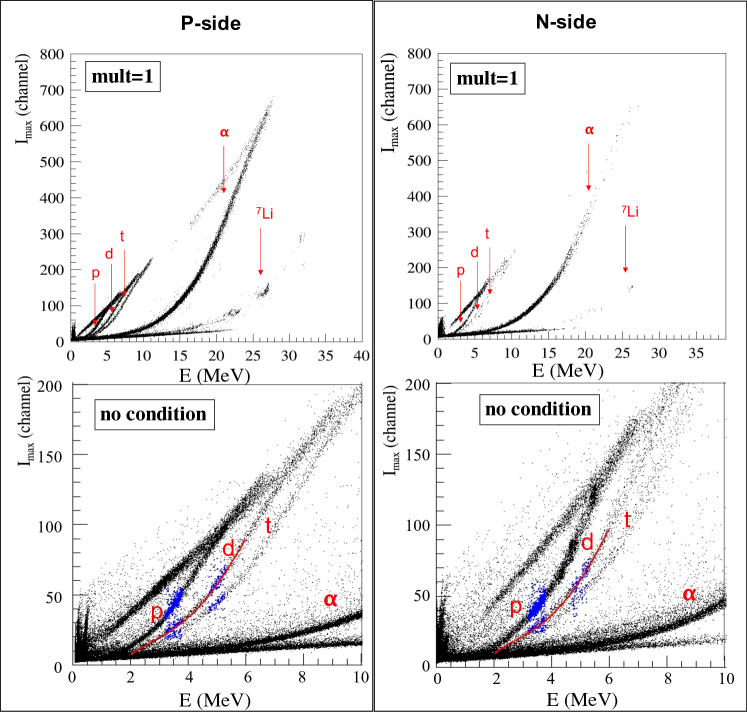
The pulse shape discrimination technique relies on the fact that different particles with the same energy will have different interaction ranges in the detector. The so-called plasma delay time [10] increases with the mass and influences the rise time of the signals whereas the fall time is mainly attributed to the drift of charge carriers. On Fig. 12, the difference between the proton and deuteron signals at 5 MeV can be clearly seen: the height and the width of the signals are completely different although the integrals are equal. For GRIT, the particle identification on both the N- and the P-side relies on the amplitude of the current signal (Imax). The spectra obtained for one strip of each side are shown on Fig. 13 (top) in the under-depleted case (80 V) with the condition that the multiplicity is equal to 1. The signal from the protons, deuterons and tritons on one side and from 4He and then Li isotopes on the other side align on an almost parabolic shape. The punchthroughs of the protons, deuterons, tritons appear as a straight line and are mixed up. For the 4He, it is only observed for the N-side strip. Another line appears below the Li line and stops at 22 MeV. It is tentatively assigned to Be isotopes.
The lowest energy threshold for effective particle identification, determined as the separation between the different isotopes, is 2 MeV for protons, 2.5 MeV for deuterons and 3 MeV for tritons and He isotopes. Below these values, where the particles are very slow, the time-of-flight can be used to identify them. More challenging are the particles with the highest energies near the punchthrough points. For these particles, the rise time of the current signal is very small. For example, it is 4 ns for a 6 MeV proton or a 25 MeV alpha. Given the 400 MSa/s sampling rate, the rise time is spread over very few samples. However, after filtering and thus reducing the bandwidth, the discrimination is still clearly achieved.
The figures of merit (FoM) for the separation between the Z=1 isotopes are evaluated using the following Particle Identification (PId) technique on the spectra without any condition on the multiplicity to get more statistics. A two-dimension fit with a first or higher-order polynomial (depending on the observable considered) is performed on the ”curve” corresponding to a particle (deuteron in our case) (for example, for the deuteron as shown in red on Fig. 13 (bottom)). Then, the PId corresponding to the minimum distance to the curve is calculated for the selected events shown in blue on Fig. 13 (bottom). In order to qualify the separation between the different isotopes, each PId component is fitted with gaussians and the figures of merit are calculated with the following definition:
| (1) |
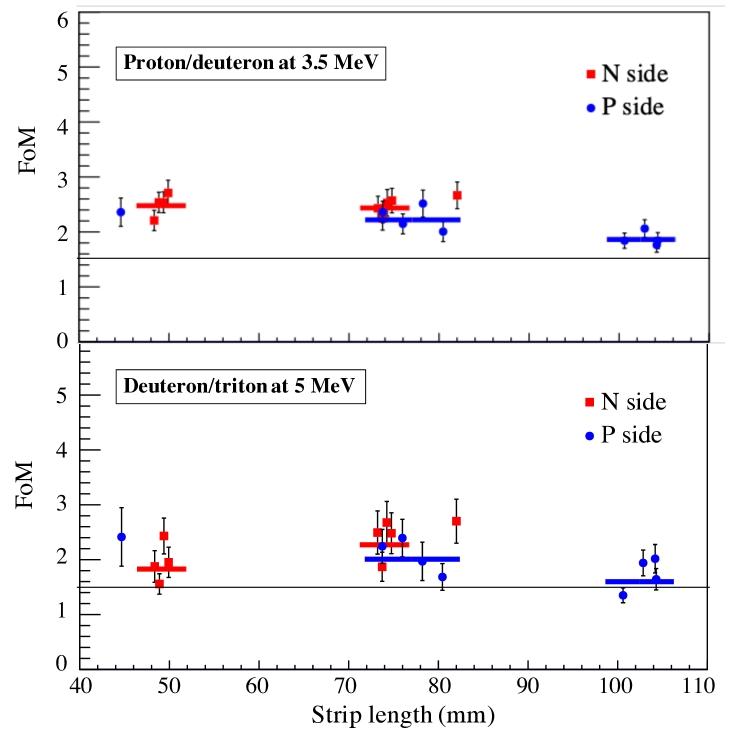
where and are the peak positions and and are the standard deviations for each peak. A FoM of 2 corresponds to a separation between the two peaks of the sum of their FWHM (in the gaussian approximation). The criterion for particle identification with this definition is: FoM1.5. The FoM cannot be calculated over the full energy range because the shape of the Z=1 isotopes lines are quite different. So we evaluated them at a fixed energy within a 500 keV wide gate, taking the deuteron line as a reference. To optimize the statistics for proton-deuteron separation, it is calculated at 3.5 MeV and for deuteron-triton at 5 MeV (see blue points on Fig. 13). Although the FoM could be different for another energy gate, the trend with the strip length is reproduced. For this study we use the 9 strips that were read on each side which gives a panel of strip lengths. No condition on the event multiplicity was set as well as no condition on the coincidence between N-side and P-side so that the full strip length is used. Given that our detector is of nTD type, the uniformity in resistivity guarantees the low position dependence of the signal shape for a given particle at a given energy. It will thus have limited impact on the figures of merit and improve the statistical error. There are three groups of strip lengths: 50, 80 and 100 mm. The two first ones correspond to N-side strips whereas the two last ones correspond to P-side strips. For the 80 mm long strips, we have data for both the N- and the P-side strips. The different lengths correspond to a capacitance of 8, 13 and 18 pF respectively. There is more than a factor of 2 between the shortest and the longest strip in the detector. Fig. 14 shows the figures of merit as a function of the strip length obtained for the N-side and P-side strips. When four strips are neighbors, the averaged value is shown by an horizontal line. The FoM for the N-side are slightly greater than that of the P-side, which is probably related to the better energy resolution obtained on the N-side. However for the strips with the same length (around 70-80 mm) the FoM are compatible between both sides. The trend is almost flat for proton/deuteron separation and slightly better for longer strips for deuteron/triton separation. This latter behavior is probably due to statistical errors that dominate the measurement in this case as the number of events with tritons is quite limited and even more in the shortest strip where the FoM is lower. On the P-side, the FoM slightly decreases with the strip length (from 2.20.1 to 1.90.15 on average for proton/deuteron separation) for both proton/deuteron and deuteron/triton separation. For all cases, the FoM are above 1.5 so that the particle identification is achieved. In turn, the various lengths of the strips in the trapezoidal detector do not prevent from particle identification based on the pulse shape analysis technique.
4 Conclusion and Perspectives
We have described the first beam test results for the GRIT prototype detector with the first version of its ASIC preamplifier iPACI, a 9-channel, 130 MHz - 12 keV FWHM charge and current output preamplifier. The main goal of the study was to investigate the pulse shape analysis performance of the set-up. The focus was put on the effect of the different strip lengths from the trapezoidal detector. Although the strip capacitance varies by a factor of 2 along the detector, no strong effect was observed on the particle identification. A new version of the iPACI preamplifier improving the dynamic range and including more advanced blocks is being tested at the time of writing. This study opens the door for the next step using the full electronics chain to read the GRIT detector.
References
- [1] G. Prete, A. Andrighetto, G. Bassato, L. Biasetto, L. Calabretta, M. Comunian, A. Galatà, M. Giacchini, F. Gramegna, M. Lollo, A. Lombardi, M. Manzolaro, J. Montano, L. Sarchiapone, D. Scarpa, J. Vasquez, D. Zafiropoulos, The spes project: a second generation isol facility, Nuclear Physics A 834 (2010) 754c.
-
[2]
P. Reiter, N. Warr,
Nuclear
structure studies with re-accelerated beams at rex-and hie-isolde, Progress
in Particle and Nuclear Physics 113 (2020) 103767.
doi:10.1016/j.ppnp.2020.103767.
URL http://www.sciencedirect.com/science/article/pii/S0146641020300144 - [3] F. Naqvia, P. Boutachkov, M. Górska, J. Gerl, F. Farinon, a. K. H. E.T. Gregorb, A. Jhingan, Development of slowed down beamsat the fragment separator for fair, ACTA PHYSICA POLONICA B 42 (2011) 725.
-
[4]
S. Pain, A. Ratkiewicz, T. Baugher, M. Febbraro, A. Lepailleur, A. Ayangeakaa,
J. Allen, J. Anderson, D. Bardayan, J. Blackmon, R. Blanchard, S. Burcher,
M. Carpenter, S. Cha, K. Chae, K. Chipps, J. Cizewski, A. Engelhardt,
H. Garland, K. Jones, R. Kozub, E. Lee, M. Hall, O. Hall, J. Hu,
P. O’Malley, I. Marsh, B. Rasco, D. Santiago-Gonzales, D. Seweryniak,
S. Shadrick, H. Sims, K. Smith, M. Smith, P.-L. Tai, P. Thompson,
C. Thornsberry, R. Varner, D. Walter, G. Wilson, S. Zhu,
Direct
reaction measurements using goddess, Physics Procedia 90 (2017) 455 – 462,
conference on the Application of Accelerators in Research and Industry, CAARI
2016, 30 October – 4 November 2016, Ft. Worth, TX, USA.
doi:10.1016/j.phpro.2017.09.051.
URL http://www.sciencedirect.com/science/article/pii/S1875389217302109 -
[5]
V. Bildstein, R. Gernhäuser, T. Kröll, R. Krücken, K. Wimmer,
P. Van Duppen, M. Huyse, N. Patronis, R. Raabe, T.-R. Collaboration,
T-rex, The European
Physical Journal A 48 (6) (2012) 85.
doi:10.1140/epja/i2012-12085-6.
URL https://doi.org/10.1140/epja/i2012-12085-6 -
[6]
Grit web page.
URL http://grit.in2p3.fr -
[7]
E. Clément, C. Michelagnoli, G. [de France], H. Li, A. Lemasson, C. B.
Dejean], M. Beuzard, P. Bougault, J. Cacitti, J.-L. Foucher, G. Fremont,
P. Gangnant, J. Goupil, C. Houarner, M. Jean, A. Lefevre, L. Legeard,
F. Legruel, C. Maugeais, L. Ménager, N. Ménard, H. Munoz, M. Ozille,
B. Raine, J. Ropert, F. Saillant, C. Spitaels, M. Tripon, P. Vallerand,
G. Voltolini, W. Korten, M.-D. Salsac, C. Theisen, M. Zielińska, T. Joannem,
M. Karolak, M. Kebbiri, A. Lotode, R. Touzery, C. Walter, A. Korichi,
J. Ljungvall, A. Lopez-Martens, D. Ralet, N. Dosme, X. Grave, N. Karkour,
X. Lafay, E. Legay, I. Kojouharov, C. Domingo-Pardo, A. Gadea,
R. Pérez-Vidal, J. Civera, B. Birkenbach, J. Eberth, H. Hess,
L. Lewandowski, P. Reiter, A. Nannini, G. D. Angelis], G. Jaworski, P. John,
D. Napoli, J. Valiente-Dobón, D. Barrientos, D. Bortolato, G. Benzoni,
A. Bracco, S. Brambilla, F. Camera, F. Crespi, S. Leoni, B. Million,
A. Pullia, O. Wieland, D. Bazzacco, S. Lenzi, S. Lunardi, R. Menegazzo,
D. Mengoni, F. Recchia, M. Bellato, R. Isocrate, F. E. Canet], F. Didierjean,
G. Duchêne, R. Baumann, M. Brucker, E. Dangelser, M. Filliger, H. Friedmann,
G. Gaudiot, J.-N. Grapton, H. Kocher, C. Mathieu, M.-H. Sigward, D. Thomas,
S. Veeramootoo, J. Dudouet, O. Stézowski, C. Aufranc, Y. Aubert, M. Labiche,
J. Simpson, I. Burrows, P. Coleman-Smith, A. Grant, I. Lazarus, P. Morrall,
V. Pucknell, A. Boston, D. Judson, N. Lalović, J. Nyberg, J. Collado,
V. González, I. Kuti, B. Nyakó, A. Maj, M. Rudigier,
Conceptual
design of the agata 1 array at ganil, Nuclear Instruments and Methods
in Physics Research Section A: Accelerators, Spectrometers, Detectors and
Associated Equipment 855 (2017) 1 – 12.
doi:10.1016/j.nima.2017.02.063.
URL http://www.sciencedirect.com/science/article/pii/S0168900217302590 -
[8]
C. Ammerlaan, R. Rumphorst, L. Koerts,
Particle
identification by pulse shape discrimination in the p-i-n type semiconductor
detector, Nuclear Instruments and Methods 22 (0) (1963) 189 – 200.
doi:10.1016/0029-554X(63)90248-9.
URL http://www.sciencedirect.com/science/article/pii/0029554X63902489 -
[9]
J. England, G. Field, T. Ophel,
Z-identification
of charged particles by signal risetime in silicon surface barrier
detectors, Nuclear Instruments and Methods in Physics Research Section A:
Accelerators, Spectrometers, Detectors and Associated Equipment 280 (2–3)
(1989) 291 – 298.
doi:10.1016/0168-9002(89)90920-0.
URL http://www.sciencedirect.com/science/article/pii/0168900289909200 -
[10]
G. Pausch, W. Bohne, D. Hilscher, H.-G. Ortlepp, D. Polster,
Particle
identification in a wide dynamic range based on pulse-shape analysis with
solid-state detectors, Nuclear Instruments and Methods in Physics Research
Section A: Accelerators, Spectrometers, Detectors and Associated Equipment
349 (1) (1994) 281 – 284.
doi:10.1016/0168-9002(94)90634-3.
URL http://www.sciencedirect.com/science/article/pii/0168900294906343 - [11] M. Mutterer, W. Trzaska, G. P. Tyurin, A. V. Evsenin, J. Von Kalben, J. Kemmer, M. Kapusta, V. G. Lyapin, S. V. Khlebnikov, Breakthrough in pulse-shape based particle identification with silicon detectors, Nuclear Science, IEEE Transactions on 47 (3) (2000) 756–759. doi:10.1109/23.856510.
-
[12]
M. Mutterer, W. Trzaska, Y. Kopatch, M. Sillanpää, J. von Kalben,
S. Khlebnikov, G. Schrieder, G. Tyurin,
Particle
identification with time-of-flight and pulse-shape discrimination in
neutron-transmutation-doped silicon detectors, Nuclear Instruments and
Methods in Physics Research Section A: Accelerators, Spectrometers, Detectors
and Associated Equipment 608 (2) (2009) 275 – 286.
doi:10.1016/j.nima.2009.06.060.
URL http://www.sciencedirect.com/science/article/pii/S0168900209013163 -
[13]
M. Chabot, S. D. Negra, L. Lavergne, G. Martinet, K. Wohrer-Béroff,
R. Sellem, R. Daniel, J. L. Bris, G. Lalu, D. Gardès, J. Scarpaci,
P. Désesquelle, V. Lima,
Shape
analysis of current pulses delivered by semiconductor detectors: A new tool
for fragmentation studies of high velocity atomic clusters and molecules,
Nuclear Instruments and Methods in Physics Research Section B: Beam
Interactions with Materials and Atoms 197 (1–2) (2002) 155 – 164.
doi:10.1016/S0168-583X(02)01309-5.
URL http://www.sciencedirect.com/science/article/pii/S0168583X02013095 -
[14]
L. Bardelli, M. Bini, G. Casini, P. Edelbruck, G. Pasquali, G. Poggi,
S. Barlini, R. Berjillos, B. Borderie, R. Bougault, M. Bruno, S. Carboni,
A. Chbihi, M. D’Agostino, J. Dueñas, J. Gautier, F. Gramegna, C. Huss,
A. Kordyasz, T. Kozik, V. Kravchuk, N. L. Neindre, O. Lopez, I. Martel,
L. Morelli, A. Ordine, M. Rivet, E. Rosato, E. Scarlini, G. Spadaccini,
G. Tobia, M. Vigilante, E. Wanlin,
Progresses
in the pulse shape identification with silicon detectors within the {FAZIA}
collaboration, Nuclear Instruments and Methods in Physics Research Section
A: Accelerators, Spectrometers, Detectors and Associated Equipment 654 (1)
(2011) 272 – 278.
doi:10.1016/j.nima.2011.06.063.
URL http://www.sciencedirect.com/science/article/pii/S0168900211011879 -
[15]
S. Carboni, S. Barlini, L. Bardelli, N. L. Neindre, M. Bini, B. Borderie,
R. Bougault, G. Casini, P. Edelbruck, A. Olmi, G. Pasquali, G. Poggi,
M. Rivet, A. Stefanini, G. Baiocco, R. Berjillos, E. Bonnet, M. Bruno,
A. Chbihi, I. Cruceru, M. Degerlier, J. Dueñas, E. Galichet, F. Gramegna,
A. Kordyasz, T. Kozik, V. Kravchuk, O. Lopez, T. Marchi, I. Martel,
L. Morelli, M. Parlog, H. Petrascu, E. Rosato, V. Seredov, E. Vient,
M. Vigilante, R. Alba, D. Santonocito, C. Maiolino,
Particle
identification using the technique and pulse shape discrimination with the
silicon detectors of the {FAZIA} project, Nuclear Instruments and Methods
in Physics Research Section A: Accelerators, Spectrometers, Detectors and
Associated Equipment 664 (1) (2012) 251 – 263.
doi:10.1016/j.nima.2011.10.061.
URL http://www.sciencedirect.com/science/article/pii/S0168900211020134 -
[16]
S. Barlini, S. Carboni, L. Bardelli, N. L. Neindre, M. Bini, B. Borderie,
R. Bougault, G. Casini, P. Edelbruck, A. Olmi, G. Pasquali, G. Poggi,
M. Rivet, A. Stefanini, G. Baiocco, R. Berjillos, E. Bonnet, M. Bruno,
A. Chbihi, I. Cruceru, M. Degerlier, J. Dueñas, E. Galichet, F. Gramegna,
A. Kordyasz, T. Kozik, V. Kravchuk, O. Lopez, T. Marchi, I. Martel,
L. Morelli, M. Parlog, S. Piantelli, H. Petrascu, E. Rosato, V. Seredov,
E. Vient, M. Vigilante,
Effects
of irradiation of energetic heavy ions on digital pulse shape analysis with
silicon detectors, Nuclear Instruments and Methods in Physics Research
Section A: Accelerators, Spectrometers, Detectors and Associated Equipment
707 (0) (2013) 89 – 98.
doi:10.1016/j.nima.2012.12.104.
URL http://www.sciencedirect.com/science/article/pii/S0168900212016609 -
[17]
N. L. Neindre, R. Bougault, S. Barlini, E. Bonnet, B. Borderie, G. Casini,
A. Chbihi, P. Edelbruck, J. Frankland, D. Gruyer, E. Legouée, O. Lopez,
P. Marini, M. Pârlog, G. Pasquali, M. Petcu, M. Rivet, F. Salomon,
E. Vient, R. Alba, G. Baiocco, L. Bardelli, M. Bini, R. Borcea, M. Bruno,
S. Carboni, M. Cinausero, I. Cruceru, M. Degerlier, J. Dueñas,
K. Ga¸sior, F. Gramegna, A. Grzeszczuk, M. Kamuda, T. Kozik, V. Kravchuk,
I. Lombardo, C. Maiolino, T. Marchi, L. Morelli, F. Negoita, A. Olmi,
H. Petrascu, S. Piantelli, G. Poggi, E. Rosato, D. Santonocito,
G. Spadaccini, A. Stefanini, T. Twaróg, M. Vigilante,
Comparison
of charged particle identification using pulse shape discrimination and
methods between front and rear side injection in silicon detectors, Nuclear
Instruments and Methods in Physics Research Section A: Accelerators,
Spectrometers, Detectors and Associated Equipment 701 (0) (2013) 145 – 152.
doi:10.1016/j.nima.2012.11.005.
URL http://www.sciencedirect.com/science/article/pii/S0168900212012764 -
[18]
S. Valdré, G. Casini, N. Le Neindre, M. Bini, A. Boiano, B. Borderie,
P. Edelbruck, G. Poggi, F. Salomon, G. Tortone, R. Alba, S. Barlini,
E. Bonnet, B. Bougard, R. Bougault, G. Brulin, M. Bruno, A. Buccola,
A. Camaiani, A. Chbihi, C. Ciampi, M. Cicerchia, M. Cinausero,
D. Dell’Aquila, P. Desrues, J. Dueñas, D. Fabris, M. Falorsi,
J. Frankland, C. Frosin, E. Galichet, R. Giordano, F. Gramegna, L. Grassi,
D. Gruyer, M. Guerzoni, M. Henri, M. Kajetanowicz, K. Korcyl, A. Kordyasz,
T. Kozik, P. Lecomte, I. Lombardo, O. Lopez, C. Maiolino, G. Mantovani,
T. Marchi, A. Margotti, Y. Merrer, L. Morelli, A. Olmi, A. Ordine,
P. Ottanelli, C. Pain, M. Pałka, M. Pârlog, G. Pasquali, G. Pastore,
S. Piantelli, H. de Préaumont, R. Revenko, A. Richard, M. Rivet,
J. Ropert, E. Rosato, F. Saillant, D. Santonocito, E. Scarlini, S. Serra,
C. Soulet, G. Spadaccini, A. Stefanini, G. Tobia, S. Upadhyaya,
A. Vanzanella, G. Verde, E. Vient, M. Vigilante, E. Wanlin, G. Wittwer,
A. Zucchini,
The
fazia setup: A review on the electronics and the mechanical mounting,
Nuclear Instruments and Methods in Physics Research Section A: Accelerators,
Spectrometers, Detectors and Associated Equipment 930 (2019) 27–36.
doi:https://doi.org/10.1016/j.nima.2019.03.082.
URL https://www.sciencedirect.com/science/article/pii/S0168900219304243 -
[19]
M. Assié, B. Le Crom, B. Genolini, M. Chabot, D. Mengoni, J. A. Dueñas,
S. Ancelin, D. Beaumel, Y. Blumenfeld, N. de Séréville, J. J.
Dormard, T. Faul, J. Guillot, A. Jallat, V. Le Ven, I. Martel, E. Rauly,
D. Suzuki, A. S. Torrento,
Characterization of light
particles (z 2) discrimination performances by pulse shape analysis
techniques with high-granularity silicon detector, The European Physical
Journal A 51 (1) (2015) 11.
doi:10.1140/epja/i2015-15011-6.
URL https://doi.org/10.1140/epja/i2015-15011-6 -
[20]
M. Assié, A. Matta, B. L. Crom], M. Chabot, D. Mengoni, D. Beaumel,
Y. Blumenfeld, J.-J. Dormard, B. Genolini, F. Hammache, J. Guillot,
A. Jallat, E. Rauly, N. [de Séréville], D. Suzuki,
New
methods to identify low energy 3he with silicon-based detectors, Nuclear
Instruments and Methods in Physics Research Section A: Accelerators,
Spectrometers, Detectors and Associated Equipment 908 (2018) 250 – 255.
doi:10.1016/j.nima.2018.08.050.
URL http://www.sciencedirect.com/science/article/pii/S0168900218310088 -
[21]
J. Dueñas, D. Mengoni, V. Parkar, R. Berjillos, M. Assie, D. Beaumel,
A. Sánchez-Benítez, I. Martel,
Identification
of light particles by means of pulse shape analysis with silicon detector at
low energy, Nuclear Instruments and Methods in Physics Research Section A:
Accelerators, Spectrometers, Detectors and Associated Equipment 676 (0)
(2012) 70 – 73.
doi:10.1016/j.nima.2012.02.032.
URL http://www.sciencedirect.com/science/article/pii/S0168900212002306 -
[22]
B. Genolini, B. L. Crom, M. Assié, J. Dueñas, D. Mengoni, S. Ancelin,
D. Beaumel, Y. Blumenfeld, M. Chabot, N. de Séréville, T. Faul,
J. Guillot, F. Hammache, A. Jallat, V. L. Ven, I. Martel, E. Rauly,
D. Suzuki,
Pulse
shape discrimination at low energies with a double sided, small-pitch strip
silicon detector, Nuclear Instruments and Methods in Physics Research
Section A: Accelerators, Spectrometers, Detectors and Associated Equipment
732 (0) (2013) 87 – 90, vienna Conference on Instrumentation 2013.
doi:http://dx.doi.org/10.1016/j.nima.2013.06.078.
URL http://www.sciencedirect.com/science/article/pii/S0168900213009248 -
[23]
D. Mengoni, J. Dueñas, M. Assié, C. Boiano, P. John, R. Aliaga,
D. Beaumel, S. Capra, A. Gadea, V. Gonzáles, A. Gottardo, L. Grassi,
V. Herrero-Bosch, T. Houdy, I. Martel, V. Parkar, R. Perez-Vidal, A. Pullia,
E. Sanchis, A. Triossi, J. V. Dobón,
Digital
pulse-shape analysis with a {TRACE} early silicon prototype, Nuclear
Instruments and Methods in Physics Research Section A: Accelerators,
Spectrometers, Detectors and Associated Equipment 764 (0) (2014) 241 – 246.
doi:10.1016/j.nima.2014.07.054.
URL http://www.sciencedirect.com/science/article/pii/S0168900214009127 -
[24]
H. Hamrita, E. Rauly, Y. Blumenfeld, B. Borderie, M. Chabot, P. Edelbruck,
L. Lavergne, J. L. Bris], T. Legou, N. L. Neindre], A. Richard, M. Rivet,
J. Scarpaci, J. Tillier, S. Barbey, E. Becheva, F. Bocage, R. Bougault,
R. Bzyl, S. Grévy, B. Carniol, D. Cussol, P. Dźsesquelles, D. Etasse,
E. Galichet, S. Grévy, D. Guinet, G. Lalu, G. Lanzalone, P. Lautesse,
O. Lopez, G. Martinet, S. Pierre, G. Politi, E. Rosato, B. Tamain, E. Vient,
Charge
and current-sensitive preamplifiers for pulse shape discrimination techniques
with silicon detectors, Nuclear Instruments and Methods in Physics Research
Section A: Accelerators, Spectrometers, Detectors and Associated Equipment
531 (3) (2004) 607 – 615.
doi:10.1016/j.nima.2004.05.112.
URL http://www.sciencedirect.com/science/article/pii/S0168900204011106 -
[25]
J. Dueñas, D. Mengoni, M. Assie, B. L. Crom, A. S. Benítez,
B. Genolini, Y. Blumenfeld, S. Ancelin, N. de Séréville, T. Faul,
F. Hammache, A. Jallat, V. L. Ven, E. Rauly, D. Suzuki, D. Beaumel,
I. Martel,
Interstrip
effects influence on the particle identification of highly segmented silicon
strip detector in a nuclear reaction scenario, Nuclear Instruments and
Methods in Physics Research Section A: Accelerators, Spectrometers, Detectors
and Associated Equipment 743 (0) (2014) 44 – 50.
doi:10.1016/j.nima.2014.01.009.
URL http://www.sciencedirect.com/science/article/pii/S0168900214000175 -
[26]
Spectre
circuit simulator documentation.
URL https://www.cadence.com/content/dam/cadence-www/global/en_US/documents/tools/custom-ic-analog-rf-design/spectre-simulation-platform-ds.pdf -
[27]
L. Bardelli, M. Bini, G. Casini, G. Pasquali, G. Poggi, S. Barlini, A. Becla,
R. Berjillos, B. Borderie, R. Bougault, M. Bruno, M. Cinausero,
M. D’Agostino, J. D. Sanctis, J. Dueñas, P. Edelbruck, E. Geraci,
F. Gramegna, A. Kordyasz, T. Kozik, V. Kravchuk, L. Lavergne, P. Marini,
A. Nannini, F. Negoita, A. Olmi, A. Ordine, S. Piantelli, E. Rauly, M. Rivet,
E. Rosato, C. Scian, A. Stefanini, G. Vannini, S. Velica, M. Vigilante,
Influence
of crystal-orientation effects on pulse-shape-based identification of
heavy-ions stopped in silicon detectors, Nuclear Instruments and Methods in
Physics Research Section A: Accelerators, Spectrometers, Detectors and
Associated Equipment 605 (3) (2009) 353 – 358.
doi:10.1016/j.nima.2009.03.247.
URL http://www.sciencedirect.com/science/article/pii/S0168900209007451 -
[28]
Micron semiconductors ltd.
URL http://micronsemiconductor.co.uk - [29] D. Breton, E. Delagnes, J. Maalmi, P. Rusquart, The wavecatcher family of sca-based 12-bit 3.2-gs/s fast digitizers, in: 2014 19th IEEE-NPSS Real Time Conference, 2014, pp. 1–8. doi:10.1109/RTC.2014.7097545.
-
[30]
D. Breton, E. Delagnes, J. Maalmi, K. Nishimura, L. Ruckman, G. Varner,
J. Va’vra,
High
resolution photon timing with mcp-pmts: A comparison of a commercial constant
fraction discriminator (cfd) with the asic-based waveform digitizers target
and wavecatcher, Nuclear Instruments and Methods in Physics Research Section
A: Accelerators, Spectrometers, Detectors and Associated Equipment 629 (1)
(2011) 123 – 132.
doi:10.1016/j.nima.2010.10.087.
URL http://www.sciencedirect.com/science/article/pii/S0168900210023521