Characterization of Two 2 mm-detected Optically-Obscured Dusty Star-Forming Galaxies
Abstract
The 2 mm Mapping Obscuration to Reionization with ALMA (MORA) Survey was designed to detect high redshift (), massive, dusty star-forming galaxies (DSFGs). Here we present two, likely high redshift sources, identified in the survey whose physical characteristics are consistent with a class of optical/near-infrared (OIR) invisible DSFGs found elsewhere in the literature. We first perform a rigorous analysis of all available photometric data to fit spectral energy distributions and estimate redshifts before deriving physical properties based on our findings. Our results suggest the two galaxies, called MORA-5 and MORA-9, represent two extremes of the “OIR-dark” class of DSFGs. MORA-5 () is a significantly more active starburst with a star-formation rate of 830 M⊙ yr-1 compared to MORA-9 () whose star-formation rate is a modest 200 M⊙ yr-1. Based on the stellar masses (M M⊙), space density ( Mpc-3, which incorporates two other spectroscopically confirmed OIR-dark DSFGs in the MORA sample at and ), and gas depletion timescales ( Gyr) of these sources, we find evidence supporting the theory that OIR-dark DSFGs are the progenitors of recently discovered massive quiescent galaxies.
1 Introduction
Our current understanding of star formation and galaxy evolution within the first two billion years after the Big Bang is severely limited by a lack of infrared (IR) constraints and associated sample incompleteness at (Gruppioni et al. 2013; Casey, Narayanan, & Cooray 2014; Madau & Dickinson 2014; Casey et al. 2018b). Very recent studies (Zavala et al., 2021; Casey et al., 2021) have worked to extend IR measurements up to , but uncertainties are still dominant. The census of cosmic star formation out to the highest redshifts is also biased towards unobscured star formation tracers, relying on rest-frame ultraviolet (UV) continuum measurements to seek out Lyman-break selected galaxies (LBGs). While LBG-based studies have yielded the most robust results out to and beyond and have contributed heavily to analyses of the UV luminosity function (UVLF) (Reddy & Steidel, 2009; Finkelstein et al., 2015; Ono et al., 2018), it is well understood that they miss both heavily and moderately dust-obscured star-formation by design (Magnelli et al., 2012; Gruppioni et al., 2013). Therefore, the true abundance of dusty star-forming galaxies (DSFGs) in the early Universe remains unclear. Knowing the prevalence of dust-obscured star formation is particularly important at (within the first 1.5 billion years of the Universe) when cosmic time becomes a significant constraint on the physical processes which produce the dust, metals, and stars observed in galaxies.
Much debate exists over the ubiquity of DSFGs at high redshifts and their contribution to the total cosmic star-formation within the first billion years after the Big Bang. The detection of these dust obscured systems require observations at far-IR and (sub)millimeter wavelengths which trace the dust re-processed UV/optical emission from young stars: an historically tricky task given the small area of deep pencil-beam observations and conversely the shallow depths reached by wider surveys. While some works propose DSFGs as the dominant source of star-formation at (Rowan-Robinson et al., 2016; Gruppioni et al., 2020), others find the contribution from DSFGs to be insignificant (Koprowski et al., 2017; Smith et al., 2017). In an attempt to reconcile these two disparate theories, we look to identify individual DSFGs and constrain their source density at .
Models (Casey et al., 2018a, b) and observations (Staguhn et al., 2014) show that 2 mm observations offer an effective strategy to detect high redshift dusty galaxies at while simultaneously filtering out lower redshift DSFGs at . The Mapping Obscuration to Reionization ALMA (MORA) Survey is the largest (184 arcmin2) 2 mm mosaic mapped with the Atacama Large Millimeter/submillimeter Array (ALMA) whose aim is to efficiently select DSFGs. For a full description of the MORA Survey, see Zavala et al. (2021) and Casey et al. (2021). Twelve total sources were robustly detected () in the MORA survey. Two of these sources were then identified as being of particular interest given their robust mm detections, but lack of optical/near-IR (OIR) counterparts. Systems with these characteristics have the potential to be the highest redshift galaxies in the sample or exceedingly obscured (or both). Additionally, recent works have unearthed a population of massive galaxies undetected in deep ( point-source limit H-band mag) Hubble Space Telescope observations (dubbed HST-dark or rest-frame H/K-band dropouts). As such, we focus on these two sources, MORA-5 and MORA-9, as they appear to be representative of this unique class of heavily obscured galaxies. “OIR-dark” is used as an identifier throughout this paper in reference to DSFGs with non-detections at ultraviolet, optical, and near-IR wavelengths shorter than 2.2 µm.
In this paper we present the physical characteristics of two OIR-dark sources found in the 2 mm MORA survey and discuss their potential to belong to the parent population of high- massive quiescent galaxies. Section 2 presents the ALMA observations from MORA and archival searches as well as ancillary data from the COSMOS survey (Scoville et al., 2007). Section 3 describes the various spectral energy distribution (SED) fitting techniques used to fit the photometric data. Section 4 lists the physical properties derived from SED fitting. Section 5 discusses how these galaxies fit into the broader DSFG population and compare to known OIR-dark sources in the literature. Finally, we assess the potential evolutionary pathway of OIR-dark DSFGs as the progenitors of massive quiescent galaxies at early times. Throughout this paper we assume a Planck cosmology with km s-1 Mpc-1 and (Planck Collaboration et al., 2016) and a Kroupa initial mass function (Kroupa & Weidner, 2003) when referring to SFRs.
2 Data & Observations
In total, thirteen robust sources () were detected in the 2 mm mosaic. We direct the reader to the accompanying MORA papers for a more thorough overview of the survey and complete discussions on 2 mm number counts (Zavala et al., 2021) and source characterization (Casey et al., 2021). What follows is an explanation of the ALMA data reduction and imaging, including available archival data, as well as the existing ancillary data for MORA-5 and MORA-9, which are the focus of this paper. All available photometry is compiled in Table 1.
2.1 ALMA Data
The 2 mm data were obtained during Cycle 6 under program 2018.1.00231.S (PI Casey). MORA-5 and MORA-9 both sit in the contiguous 156 arcmin2 mosaic, where the root mean square (RMS) reached 89 Jy and 74 Jy at their respective source positions. We select all pointings contributing more than 5% to the total sensitivity at the given positions (21 pointings total for both sources) before reducing and imaging the data using the Common Astronomy Software Application111http://casa.nrao.edu (CASA) version 5.6.1 following the standard reduction pipeline scripts. We experimented with different manually defined clean boxes during the cleaning process, of order the size of the emission. We adopt a 1″ aperture centered on the source position as our clean box, encompassing the peak of emission without including any noise. This is a slightly different reduction independent from the large mosaic presented in Zavala et al. (2021), customized for the individual sources given our ability to test multiple setups, but the results are consistent with the full mosaic.
Band 4 (2 mm) observations covered frequencies 139.4–143.2 GHz and 151.5–155.2 GHz with a restoring beam of . The continuum RMS over the 7.5 GHz bandwidth reached 85.1 Jy/beam. Various visibility weights were explored for imaging as we experimented with both natural and Briggs weighting (robust=0.0, 0.5, 2.0), the latter in an attempt to detect any spatially resolved components, though in the end we determined both sources to be unresolved. No spectral lines were detected in the covered bandwidth after close inspection. Based on the continuum imaging, the aggregate band 4 (central frequency of 147.3 GHz) flux densities of MORA-5 and MORA-9 are Jy and Jy, respectively.
Band 6 (1.3 mm) and band 7 (870 µm) continuum data exists from other ALMA programs 2016.1.00279.S (PI Oteo) and 2016.1.00463.S (PI Matsuda) for MORA-5. These data were downloaded from the archive and re-imaged. Band 7 observations covered frequencies 335.6–339.6 GHz and 347.6–351.4 GHz with a restoring beam of 0.94″0.84″. Band 6 observations covered frequencies 223–227 GHz and 239–243 GHz with a restoring beam of 0.90″0.76″. The emission in both bands is unresolved and the reported band 6 and band 7 flux densities for MORA-5 are mJy and mJy.
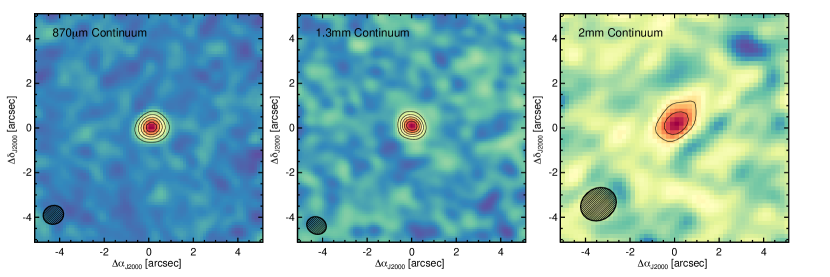
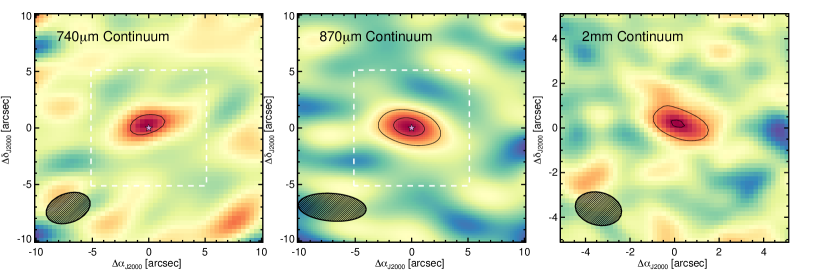
Comparatively, MORA-9 lacks coverage at other frequencies, so we secured follow-up Atacama Compact Array (ACA) observations under program 2019.2.00143 (PI Casey) to obtain band 6, band 7, and band 8 observations for improved dust continuum constraints. The band 6 observations resulted in a detection just under with flux density of mJy. The aggregate band 7 continuum has a flux density of 2.540.37 mJy. This is consistent with SCUBA-2 data (see Section 2.2), but more precise both astrometrically and in the measurement of its flux density. The band 8 continuum flux density for MORA-9 is mJy. Given the lower resolution of the ACA data () we adopt a 2″ aperture centered on the source position as our clean box. Figures 1 and 2 show the ALMA continuum maps for MORA-5 and MORA-9. Natural weighting (robust) is used for all MORA-5 imaging as well as the 740 µm (because of its higher RMS) and 2 mm continuum map of MORA-9. Briggs weighting (robust) is utilized for the 870µm map of MORA-9 to maximize spatial resolution since the ACA data mitigates any loss in flux expected by not using natural weighting.

2.2 Ancillary Archival COSMOS Datasets
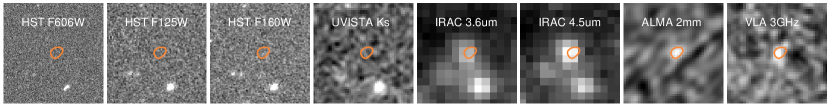
Both sources lie in the Cosmic Evolution Survey Field (COSMOS; Scoville et al., 2007; Capak et al., 2007) within the Cosmic Assembly Near-infrared Deep Extragalactic Legacy Survey (CANDELS; Koekemoer et al., 2011; Grogin et al., 2011) area. We explore a range of apertures centered on the ALMA 2 mm positions and extract photometry from the available OIR data. Apertures of 1.5″ diameter are placed down on the HST F606W, F814W, F125W, F140W, and F160W images resulting in no detections.
While neither source was initially found to have counterparts in the original -selected catalog (Muzzin et al., 2013) within 1″, a -band detection for MORA-9 is now reported in the updated COSMOS2020 catalog (Weaver et al. submitted) after the inclusion of the fourth data release (DR4) of the UltraVISTA survey (McCracken et al., 2012) which folds in deeper (up to 1 mag) -band imaging. MORA-5 however, still lacks a robust detection down to the 25.2 mag () limit with a signal-to-noise ratio (SNR) .
Both sources do have detections in the deep S-CANDELS Spitzer IRAC data (Ashby et al., 2015) at 3.6 µm and 4.5 µm. Neither MORA-5 nor MORA-9 are detected in Spitzer 24 µm imaging (Le Floc’h et al., 2009), Herschel PACS 100 µm and 160 µm imaging (Lutz et al., 2011), or SPIRE 250 µm , 350 µm and 500 µm imaging (Oliver et al., 2012).
The sources were also both detected with SCUBA-2 as reported in Geach et al. (2017) and then again in the deeper, expanded S2COSMOS survey presented in Simpson et al. (2019). The ratio of 850 µm flux density to 2 mm flux density for both MORA-5 and MORA-9 is what initially indicated these sources were likely to be high redshift at (2.5 and 6.92.8, respectively). Specifically, the ratio for MORA-9 is significantly lower than the expected value for emission on the Rayleigh-Jeans tail of the cold dust blackbody. This suggests that the SCUBA-2 measurement at 850 µm is near the peak of the dust SED rather than lower down on the Rayleigh-Jeans tail.
Lastly, neither source was found to have a detection significant enough to be included in the 1.4 GHz VLA-COSMOS catalog (Jy beam-1; Schinnerer et al. 2007) or the 3 GHz VLA-COSMOS catalog (Jy beam-1; Smolčić et al. 2017a). After manually extracting fluxes from the radio imaging at the 2 mm source positions, we find marginal detections of Jy for MORA-5 and Jy for MORA-9.
| Band | Wavelength | Units | MORA-5 | MORA-9 | Reference |
|---|---|---|---|---|---|
| HST-F606W | 606 nm | nJy | (24) | (5024) | Koekemoer et al. (2011) |
| HST-F814W | 814 nm | nJy | (832) | (32) | Koekemoer et al. (2011) |
| HST-F125W | 1.25 µm | nJy | (44) | (43) | Koekemoer et al. (2011) |
| HST-F140W | 1.40 µm | nJy | (14583) | – | Brammer et al. (2012) |
| HST-F160W | 1.60 µm | nJy | (4042) | (4043) | Koekemoer et al. (2011) |
| UVISTA-Ks | 2.2 µm | nJy | (5940) | 26940 | McCracken et al. 2012 |
| IRAC-CH1 | 3.6 µm | nJy | 680140 | 760150 | Ashby et al. (2015) |
| IRAC-CH2 | 4.5 µm | nJy | 790160 | 880170 | Ashby et al. (2015) |
| MIPS24 | 24 µm | Jy | (120) | (10) | Le Floc’h et al. (2009) |
| PACS | 100 µm | mJy | (1.7) | (1.7) | Lutz et al. (2011) |
| PACS | 160 µm | mJy | (3.7) | (3.7) | Lutz et al. (2011) |
| SPIRE | 250 µm | mJy | (3.85.8) | (05.8) | Oliver et al. (2012) |
| SPIRE | 350 µm | mJy | (7.36.3) | (06.3) | Oliver et al. (2012) |
| SCUBA-2 | 450 µm | mJy | (8.534.13) | – | Casey et al. (2013) |
| SPIRE | 500 µm | mJy | (7.16.8) | (06.8) | Oliver et al. (2012) |
| ALMA-B8 | 740 µm | mJy | – | 3.620.66 | THIS WORK |
| SCUBA-2 | 850 µm | mJy | 6.800.53 | 2.610.59 | Simpson et al. (2019) |
| ALMA-B7 | 868 µm | mJy | 6.490.22 | – | THIS WORK |
| ALMA-B7 | 874 µm | mJy | – | 2.540.37 | THIS WORK |
| AzTEC | 1100 µm | mJy | 3.70.9 | – | Aretxaga et al. (2011) |
| ALMA-B6 | 1287 µm | mJy | 2.260.17 | THIS WORK | |
| ALMA-B4 | 2036 µm | Jy | 61090 | 38070 | THIS WORK |
| VLA-3 GHz | 10 cm | Jy | (10.13.4) | (4.32.4) | Smolčić et al. (2017a) |
| VLA-1.4 GHz | 21.4 cm | Jy | () | () | Schinnerer et al. (2007) |
Notes – Available photometric measurements for MORA-5 and MORA-9. Non-detections and measurements with significance are denoted by parenthesis. MORA-9 sits just outside the coverage area of the HST-F140W observations. Neither source is detected in the intermediate band filters available in COSMOS. ALMA band 7 and band 6 were downloaded from the archive and re-imaged for MORA-5. Band 6, band 7, and band 8 data for MORA-9 were obtained with follow-up ACA observations.
3 SED Fitting Techniques
We explore the use of several spectral energy distribution (SED) fitting techniques in relation to the available multiwavelength data on MORA-5 and MORA-9 to derive redshift constraints and physical properties. We elect to input the photometry exactly as it appears in Table 1 into our SED fitting, and therefore our photometric redshift estimates, preserving all formal non-detections rather than substituting them with upper limits. We also note here for clarity that the final redshift estimates adopted for MORA-5 and MORA-9 are a combination of the photometric redshift probability distribution functions (PDFs) of each technique and are referred to as throughout the paper. Due to the highly obscured nature of these galaxies, it would be possible to have an extremely obscured, optically thick central region. Implementing energy balance techniques in SED fitting works best when data sampling the full SED, both the OIR and long wavelength regimes, is available and the galaxy in question does not have much optically thick dust. For these reasons we fit the SEDs of the OIR and FIR/mm regimes separately, but also fit the full SED for a fair comparison of the differing techniques. We recognize the challenge of fitting SEDs without well constrained redshifts, and as we are lacking spectroscopic redshifts for MORA-5 and MORA-9, we approach the process iteratively. Here we describe the tools used for photometric redshift and SED fitting and Section 4.1 describes our results with respect to redshift constraints.

3.1 FIR/millimeter SED and MMpz
We fit the FIR/mm obscured SED with a piecewise function comprised of a single modified blackbody and mid-IR powerlaw using a Metropolis Hastings Markov Chain Monte Carlo (MCMC). For a complete description of the FIR/mm SED fitting technique, called MCIRSED, we encourage the reader to see the forthcoming publication by P. Drew et al. in prep., but briefly explain the model here. At short wavelengths, the FIR/mm SED is dominated by a power law with mid-IR slope, , representing warmer dust emission from star-forming regions and/or active galactic nuclei (AGN). At longer wavelengths, a modified Planck function dominates the SED and represents the cold dust. An MCMC is then employed to sample the posteriors of the fit parameters and provide confidence intervals. We fix the mid-IR power law slope, , and emissivity spectral index, , following Casey et al. (2019). We also fix the wavelength where opacity equals unity, , to µm as is commonly adopted in the literature. Finally, we leave the dust temperature (), wavelength corresponding to the peak in the FIR/mm SED (), and IR luminosity () as free parameters.
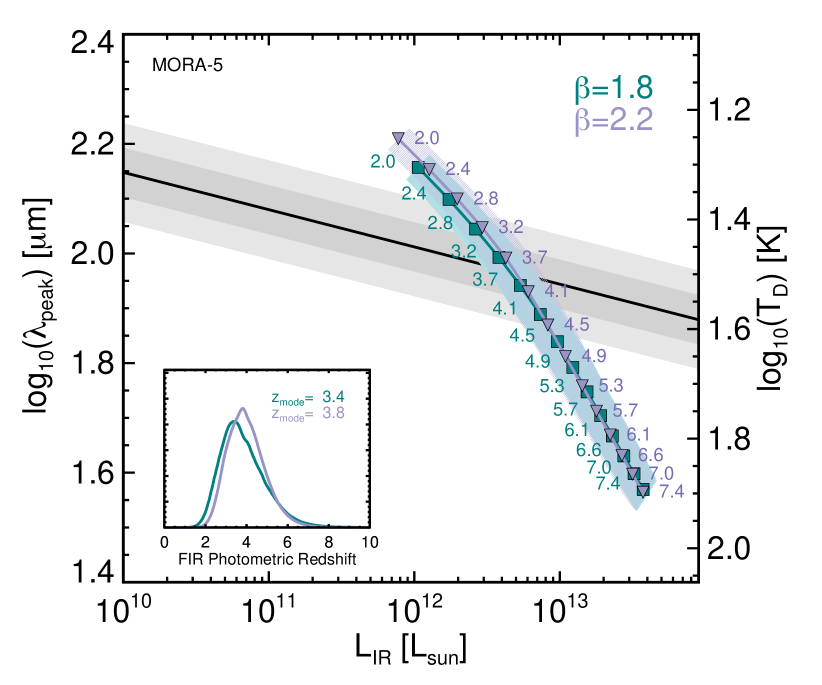
Casey et al. (2018b) (see Figure 3 therein) finds an empirical relationship between galaxies’ intrinsic and their observed given the typical SEDs of cold dust emission in DSFGs. Comparing these two properties provides us with an approximation for the range of redshift solutions which are feasible based on existing observations. This empirical relationship is the basis for the MMpz fitting technique (Casey, 2020) which we use to obtain FIR photometric redshift estimates. The results of this method are illustrated in Figure 4. The – trend is shown by the black line with its associated 1 and 2 scatter from measured data in grey. Across a broad span of redshifts, the teal and purple tracks trace the range of possible SEDs constrained by the measured photometry given values of 1.8 and 2.2 (fixed only to for simplicity in Casey 2020). As we can see, the choice of has a negligible effect on the redshift solution, so we adopt the value for consistency. The associated errors reflect the number of photometric data points available to sample the SEDs, resulting in larger errors for MORA-9.
3.2 eazy OIR SED
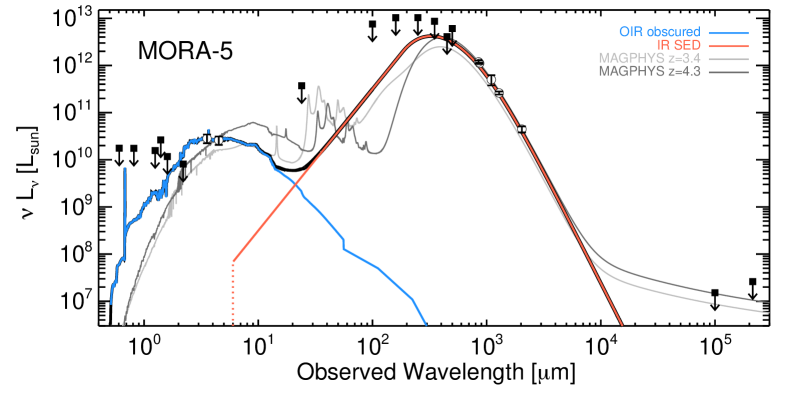
We fit the sparse OIR data with the photometric redshift fitting software eazy (v1.3) (Brammer et al., 2008) using the provided set of templates. The eight eazy templates result from a linear combination of Bruzual & Charlot (2003) synthetic galaxy photometry models and includes a dusty starburst model, an important addition for this work. Due to the limited OIR data, particularly for MORA-5, our results show very broad photometric redshift probability distributions as expected. The eazy SEDs are shown as blue lines in Figure 5 and their associated PDFs correspond to the blue distributions in Figure 6.

3.3 MAGPHYS Energy Balance SED
Lastly, the full SED is fit using MAGPHYS and the updated MAGPHYS+photo- code (da Cunha et al., 2008, 2015; Battisti et al., 2019). The original MAGPHYS incorporates an energy balance technique taking into account emission from stellar populations as well as absorption and emission by dust in galaxies. We opt to use MAGPHYS+photo- results rather than the classic MAGPHYS given its inclusion of IR, (sub)mm, and radio data, plus new star-formation history (SFH) and dust temperature priors which are more appropriate for high redshift DSFGs. Specifically, we adopt stellar masses and rest-frame -band dust attenuation (AV) values from this updated version. However, we obtain the SEDs shown in Figure 5 by running the original MAGPHYS, setting the redshift to that determined from MMpz as well as the final . Light gray lines are the MAGPHYS SEDs given from MMpz while dark gray shows the MAGPHYS SED assuming the . For MORA-9, we also run MAGPHYS given the COSMOS2020 redshift and this is shown as the purple line in the bottom panel. We note that the SEDs produced by MAGPHYS+photo- are also consistent with the original MAGPHYS SEDs when is provided as the redshift. Thus, we do not show the MAGPHYS+photo- SEDs in Figure 5.
4 Results
We rely on photometry to estimate redshifts and several physical properties for MORA-5 and MORA-9. Here we discuss these physical properties, based on the derived from the various SED fitting techniques and computed in Section 4.1, and list them in Table 2.
4.1 Photometric Redshifts
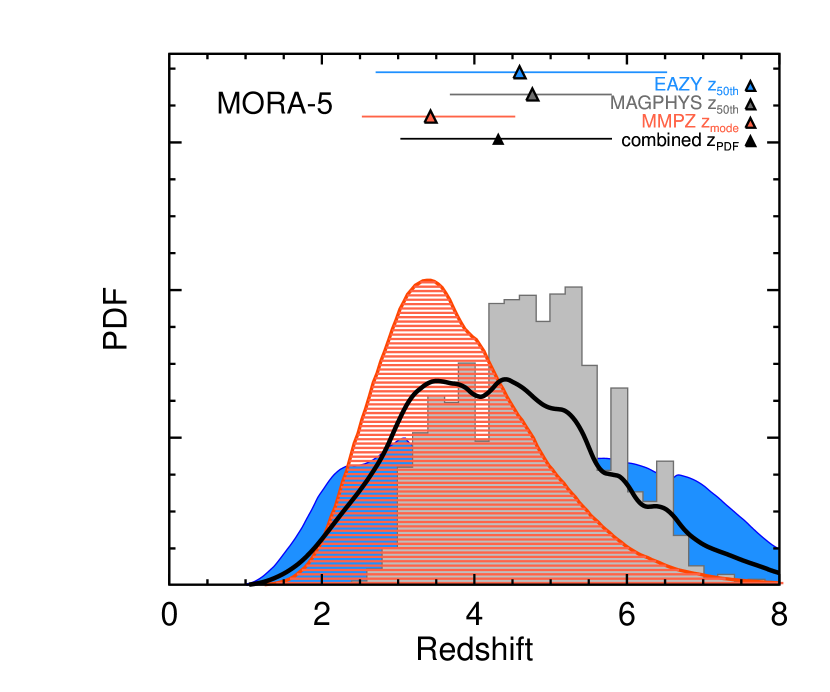
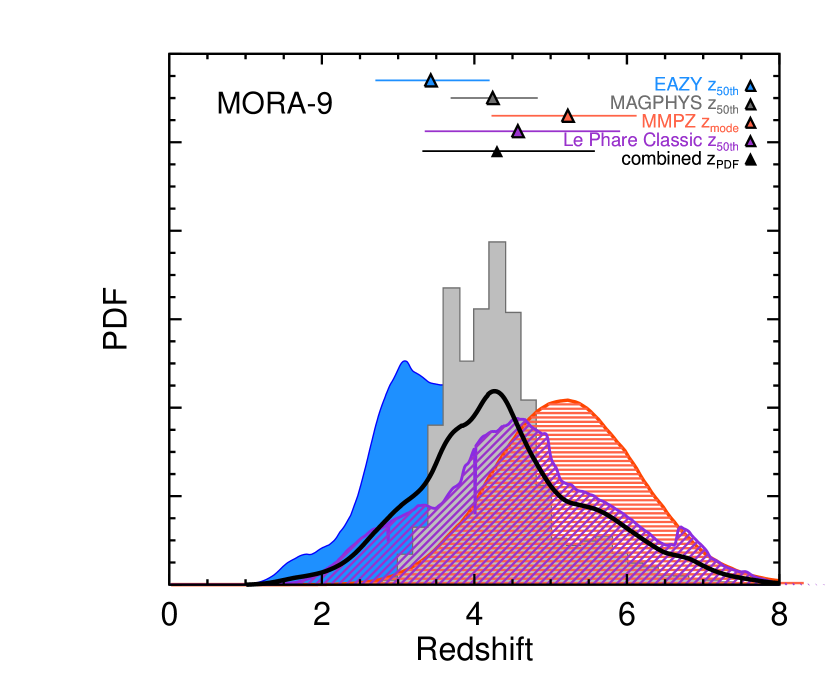
Photometric redshift PDFs from all SED fitting techniques utilized are displayed in Figure 6. The redshift determined from each one and associated errors are depicted by the triangles at the top of the plot. We sum all available PDFs (three for MORA-5 and four for MORA-9 after the inclusion of the COSMOS2020 distribution) and adopt the value from marginalizing over the PDF as our final photometric redshift which we refer to as (black distribution). Combining photometric redshift PDFs from different codes in this way has proven to be advantageous (Dahlen et al., 2013). For MORA-5, and for MORA-9, . The available ALMA observations only offer a few narrow frequency ranges for molecular lines to be detected and a detection at these frequencies would be indicative of a redshift solution, providing some evidence for our adopted estimates. Next, we describe the PDFs and associated photometric redshifts which contribute to the values.
From MMpz (orange distribution), is the mode of the PDF derived from the intersection of the galaxy’s redshift track with the – trend from the literature as shown in Figure 4. For MORA-5, and for MORA-9, . This is the highest redshift estimate for MORA-9. Low-redshift solutions for this source would imply implausibly cold dust for ( µm or T K). This would be an extremely cold system considering the luminosity of MORA-9 (, which is largely insensitive to redshift) and as such we find a higher redshift solution to be more likely given its FIR-mm colors.
Results from eazy are illustrated in blue in both panels of Figure 6. We show the redshifts determined from marginalizing over the full eazy PDF ( for MORA-5 and for MORA-9). The broad distribution of the eazy PDF is expected given the limited OIR photometric data, particularly for MORA-5 which lacks a -band detection and is only constrained by two IRAC detections.
The photometric redshift distributions from MAGPHYS+photo- are displayed in grey. Similar to our eazy results, we show the 50th percentile redshift values for each source. For MORA-5 the redshift estimate is , while for MORA-9 it is .
As noted in Section 2, MORA-9 was found to have a -band counterpart in the most recent UltraVISTA data and consequently is included in the COSMOS2020 catalog with a corresponding redshift. COSMOS2020 includes photometric redshift estimates using both eazy and the same method as cited in Laigle et al. (2016) which utilizes the template-fitting code LePhare (Arnouts et al., 2002; Ilbert et al., 2006). We refer the reader to Weaver, Kauffmann et al. (submitted) for a full explanation, but include these results for comparison and fold in the COSMOS2020 PDF into the final estimate for MORA-9. The redshift reported for MORA-9 in the Classic LePhare COSMOS2020 catalog is .
4.2 IR Luminosity and Star Formation Rate
Total infrared luminosities () are determined by integrating the MMpz FIR SEDs from 8–1000 µm. In Table 2 we list the assuming the combined values. With these values we then calculate star-formation rates (SFRs) utilizing calibrators from the literature (Kennicutt & Evans 2012 with references to Murphy et al. 2011; Hao et al. 2011 therein) and obtain SFR estimates of 830 M⊙ yr-1 for MORA-5 and 200 M⊙ yr-1 for MORA-9. If we were to assume the MMpz-determined redshifts and corresponding instead, the SFRs shift to 680 M⊙ yr-1 and 340 M⊙ yr-1 respectively, remaining consistent to the previous SFRs given the large uncertainties. Since the IR luminosities are redshift dependent, the SFRs increase if we assume higher redshift solutions. For MORA-5, MMpz produces a lower redshift than the result of the combined PDFs, whereas MORA-9 is the inverse case and MMpz produces a higher redshift. Had we used the least constrained photometric redshifts produced by eazy, the opposite would occur: The higher redshift estimate of MORA-5 would push it to an extreme IR luminosity ( L⊙) and subsequent SFR, while the lower redshift estimate of MORA-9 would suggest the system more closely resembles a normal, luminous infrared galaxy (LIRG: Sanders & Mirabel, 1996) found in the local Universe with L⊙.
4.3 Stellar Mass and Attenuation
We report the stellar masses () and absolute magnitudes of extinction () values inferred from MAGPHYS+photo-. As shown in Battisti et al. (2019), M⋆ can be underestimated by a factor of two for DSFGs, and is most divergent at higher stellar masses ( M⊙) when using codes which rely only on rest-frame UV-NIR data such as eazy and the original MAGPHYS. Given this, we report the stellar masses for MORA-5 and MORA-9 to be (1.5 M⊙ and (4.1 M⊙ while is 4.3 and 2.9, respectively. We note that both estimates are only marginally dependent on redshift within each galaxy’s PDF. Any further improvements in our stellar mass estimates will require better constraints on both redshifts and the near/mid-IR SED from, for example, future JWST observations.
| Property | Units | MORA-5 | MORA-9 |
|---|---|---|---|
| RA | – | 10:00:24.157 | 10:00:17.298 |
| DEC | – | +02:20:05.39 | +02:27:15.80 |
| – | 4.3 | 4.3 | |
| L⊙ | (5.6) | (1.4) | |
| SFR | M⊙yr-1 | 830 | 200 |
| µm | 83 | 106 | |
| K | 60 | 43 | |
| M⊙ | (1.5 | (4.1 | |
| M⊙ | (3.60.5) | (2.20.4) | |
| (2 mm) | M⊙ | (2.60.4) | (1.60.3) |
| – | 4.3 | 2.9 | |
| – |
Notes – Derived properties based on the separately fit OIR and FIR/mm SEDs. The reported comes from combining the photometric redshift PDFs of all SED fitting techniques discussed in Section 3. is the derived IR luminosity integrated from 8–1000 µm. SFRs are determined directly from our results using the associated conversion factors reported in Kennicutt & Evans (2012). is the rest-frame wavelength where the FIR/mm dust SED peaks. Stellar masses and are taken from the MAGPHYS+photo- energy balance SED results. Dust and gas masses are derived directly from the 2 mm dust continuum measurements. is computed directly from the FRC and is reported as a lower limit for MORA-5 given its marginal detection at 3 GHz.
4.4 Rest-frame Peak Wavelength and Dust Temperature
As described in Section 3.1, is the wavelength at which the best fit model peaks after fitting the FIR/mm data with a mid-IR power law plus a modified blackbody. The relationship between the measurable quantity, , and dust temperature, , is dependent on the dust opacity model assumed (see Figure 20 of Casey et al. 2014) and here we assume at µm. The dust temperature is set as a free parameter in the model and we extract our adopted values from the best fit FIR/mm SED. Assuming , and are 83 µm and 60 K for MORA-5 and 106 µm and 43 K for MORA-9.
4.5 Dust Mass
We directly infer dust masses from the associated 2 mm dust continuum detections on the Rayleigh-Jeans tail of blackbody emission (at where dust emission is likely to be optically thin) following the framework of Scoville et al. (2016). The dust mass is proportional to the mass-weighted dust temperature (set to 25 K, representative of the bulk of dust dispersed throughout the entire galaxy) and observed flux density at . Given the potentially high-redshift solutions, we assume cosmic microwave background (CMB) heating of the dust in these sources is non-negligible, so we employ Equation 1 from Casey et al. (2019) for our dust mass calculation as it incorporates a correction factor for suppressed flux density against the CMB background. We estimate dust masses of (3.6 M⊙ for MORA-5 and (2.2 M⊙ for MORA-9 with the associated errors propagated from the measurement error of the 2 mm fluxes. The dust-to-stellar mass ratios () for our sources is and . When compared to a recent compilation of for DSFGs (Donevski et al., 2020), we find that both MORA-5 and MORA-9 lie above the determined scaling relation at their respective redshifts, which is identified to rise up to before a mild decline/flattening at is observed. Contrary to low redshift galaxies, we find our higher values to be unsurprising considering the high dust content is assumed to be primarily responsible for their defining features as OIR-dark and IR luminous sources.
4.6 Gas Mass
Functionally, our gas mass estimates are determined in the same manner as dust mass as they are both inferred from the 2 mm data with gas mass being scaled via a dust-to-gas ratio. We adopt a a CO-to-H2 conversion factor of M⊙ (K km s-1 pc2)-1, accounting for the mass of both H2 and He gas. This follows the methodology of Scoville et al. (2016) and Equation 3 of Casey et al. (2019) and accounts for CMB heating. This method makes use of the empirically calibrated conversion factor from 850 µm luminosity to interstellar medium (ISM) mass, erg s-1 Hz-1 M, as determined in Scoville et al. (2016), and intrinsic to this calculation is the assumed CO-to-H2 conversion factor. We adopt the same mass-weighted dust temperature of 25 K as we did in Section 4.5. Ultimately, we find M⊙ for MORA-5 and M⊙ for MORA-9.
5 Discussion
5.1 OIR-dark Galaxies: A Subsample of the SMG/DSFG Population
We suspect OIR-dark DSFGs make up part of the high- tail of the population of dust-obscured submillimeter galaxies (SMGs; Hughes et al., 1998; Blain et al., 2002; Casey et al., 2014). Canonically selected at 850 µm with mJy, SMGs are the most well-studied DSFGs with over two decades of work dedicated to understanding their redshift distributions (Chapman et al., 2005; Zavala et al., 2014; Brisbin et al., 2017), number counts (Scott et al., 2002), spatial density (Aravena et al., 2010; Smolčić et al., 2017b), and intrinsic physical properties (Miettinen et al., 2017; Dudzevičiūtė et al., 2020). SMGs on average have reported stellar and gas masses , SFRs in the range of 100–1000 yr-1, and have often been cited as the progenitors of massive quiescent galaxies, e.g., ellipticals in the centers of local galaxy groups and clusters (Hainline et al., 2011). Similarly, SMGs have been suggested to be the parent source for intermediate redshift () compact quiescent galaxies (Toft et al., 2014). Moving forward, we group SMGs under the more generalized term of DSFGs for simplicity, which encompasses all galaxies at high- originally selected at FIR or submillimeter wavelengths. The OIR-dark galaxies discussed in this work are part of this population, having also been first detected at (sub)mm wavelengths and exhibiting similarly broad ranges of stellar masses and star-formation activity.
The majority of known DSFGs at are almost all extreme star-forming systems (forming upwards of 1000 Myr-1 and with stellar masses exceeding M) as they are predominantly detected by Herschel. As with early DSFG observations, initial OIR-dark DSFG discoveries were of the most extreme, rare, starbursts (Walter et al., 2012), and not necessarily termed OIR-dark. Gas/dust-rich, optically undetected DSFGs have also been discovered as companion systems to (sub)mm bright high redshift quasars (Fogasy et al., 2017, 2020). Now, with the advent of longer wavelength interferometric surveys covering wider areas, independent of single dish studies, more moderate systems are being readily discovered and are believed to make up the bulk of the population of these highly obscured galaxies (Fujimoto et al., 2016; Oteo et al., 2016; Franco et al., 2018; González-López et al., 2020; Zavala et al., 2021). Interestingly, Valentino et al. (2020) suggest galaxies with lower (sub)mm fluxes ( mJy) better reproduce the and SFR distributions expected for the progenitors of high- quiescent galaxies, further supporting our interest in uncovering such systems. The extremely dust-obscured sources (undetected in the deepest -band surveys) are proposed to make up 20% of all DSFGs according to Dudzevičiūtė et al. (2020), which is in line with our results from the MORA survey as 23% of the detected DSFGs are OIR-dark.
Wang et al. (2019) reported 39 OIR-dark DSFGs (selected as H-band dropouts) at . They were detected via ALMA at observed-frame 870 µm and determined to be DSFGs via their robust millimeter detections. The median stellar mass of this population is M⊙ with a characteristic IR luminosity of L⊙ and SFRs M⊙ yr-1 as determined via stacking. Similarly, Williams et al. (2019) reported serendipitous detections of two previously unknown sources found in a small 8 arcmin2 3 mm survey in the COSMOS field, one of which being an “ALMA-only” source (named ) with and OIR counterparts only detected () in deep, stacked IRAC 3.6 µm and 4.5 µm observations (see also Zavala 2021 which reports a tentative CO(6-5) line indicative of a redshift solution). Both sources have SFRs akin to “normal” main sequence (MS) galaxies (a few 100 M⊙ yr-1) and are in line with the H-band dropouts on the MS. OIR-dark DSFGs have also been identified starting from deep radio surveys. For example, Talia et al. (2021) present 197 VLA sources ( Jy beam-1) which do not have a COSMOS2015 counterpart, though we note MORA-5 and MORA-9 would not be included given this selection criteria.
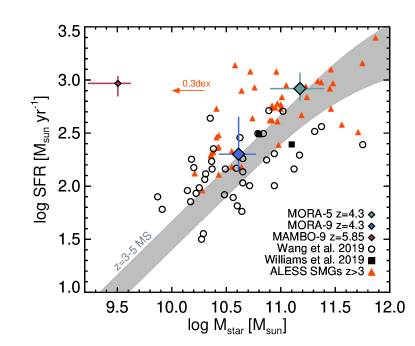
Based on our current observations and SFR calculations, MORA-9 appears to belong to the moderately star-forming subsample of OIR-dark DSFGs, while MORA-5 displays physical characteristics consistent with other rare, extreme OIR-dark starbursts. Figure 7 shows SFR versus M⋆ of our results of MORA-5 and MORA-9 (blue and teal diamonds) along with MORA-4, a.k.a. MAMBO-9, a spectroscopically confirmed OIR-dark DSFG (see Casey et al. 2019). The H-band dropouts (open circles), 3 mm detected OIR-dark DSFGs (filled squares), and DSFGs (orange triangles) from the ALESS survey (da Cunha et al., 2015) are shown for comparison. Stellar masses of the ALESS sample are reduced by 0.3 dex in Wang et al. (2019) (depicted by the orange arrow) to account for different assumptions in their respective mass estimations. Since stellar masses for the MORA sources are estimated in the same manner as the ALESS sample (through MAGPHYS), we do not apply this offset in our figure. To compare apples to apples, the H-band dropout sample should have a factor of higher mass than shown. These results are all plotted on top of the MS of galaxies at (filled gray region) as parameterized in Schreiber et al. (2015).
5.2 The Dynamic Range of OIR-dark DSFGs
This work, along with those mentioned in Section 5.1, illustrates the heterogeneous nature of OIR-dark DSFGs. The MORA survey, with its relatively large coverage area (184 arcmin-2 in total) for an interferometric survey, has shown to be effective at detecting both rarer, bright OIR-dark DSFGs with high submillimeter fluxes as well as fainter sources – a unique aspect of the survey design. We defined OIR-dark to simply include any galaxy (likely a DSFG) lacking detections at wavelengths shortward of 2.2 µm, and it is clear this encompasses a broad range of star-formation and stellar mass.
While we lack some clarity on why some DSFGs are OIR-dark and others are not, it seems likely that a combination of factors are at play. Perhaps the most evident component contributing to the OIR-dark nature of DSFGs is the high redshifts of these sources compared to other DSFGs with comparable (sub)mm fluxes across mJy. Smail et al. (2021) finds that (-band magnitude ) DSFGs from the AS2UDS survey (Dudzevičiūtė et al., 2020) have a significantly higher median photometric redshift compared to their brighter -detected sample: versus , respectively. This work also shows a higher median dust attenuation () for the population compared to their redshift-matched control sample (), which is attributed to the smaller dust continuum sizes observed (i.e. higher specific SFR, SFR). Finally, Smail et al. (2021) point to the mixture and relative scales of the obscured versus unobscured components, suggesting OIR-dark DSFGs may exhibit an absence of spatially extended, less obscured star-formation. The lower value for MORA-9 and its associated -band detection suggests it has a stellar component which is geometrically distinct from the dust emission whereas those same components for MORA-5 may be coupled.
5.3 Do OIR-dark DSFGs Host Active Galactic Nuclei?
We searched for X-ray emission in the Chandra COSMOS Legacy data to infer the presence of AGN in MORA-5 and MORA-9, but neither source is detected. However, given the suspected high redshifts of these sources and the depth of the X-ray observations, the current data cannot rule out the presence of an AGN.
The infrared to 1.4 GHz radio luminosity ratio, , quantifies the far-IR/radio correlation (FRC). Various works have looked to determine if a redshift evolution of as well as how it may differ in star-forming galaxies (SFGs) compared to AGN (Magnelli et al., 2012; Delhaize et al., 2017). Assuming a synchrotron slope of (Condon, 1992), the marginal () 3 GHz detection of MORA-5 implies a lower limit of which is in agreement with what is predicted by the evolution of for a SFG (; Delhaize et al. 2017). Examining the radio emission of MORA-9 produces similar results and we find a lower limit of .
When examined separately, AGN are found to have lower values overall and at this redshift a galaxy with a luminous AGN could be expected to have given the evolution of the FRC found by Delhaize et al. (2017). Even with a marginal radio detection in MORA-5, the uncertainty in the source’s redshift makes it impossible to conclude whether or not an AGN is present; for example, it may sit at lower redshift with radio emission from star-formation or at higher redshift with a radio loud AGN. Confirming the redshifts of the two sources via an emission line search will be critical in determining whether or not they host luminous AGN.
5.4 Potential Evolutionary Tracks
The discovery of OIR-dark DSFGs at has now been evolutionarily linked to the recent detections of high redshift (up to ) massive (MM⊙) quiescent galaxies (Spitler et al., 2014; Glazebrook et al., 2017; Schreiber et al., 2018; Valentino et al., 2020; Stevans et al., 2021). The prevalence of OIR-dark galaxies in the early Universe has large implications for the cosmic star-formation rate density (SFRD), stellar mass function (SMF), and theoretical models which have broadly excluded this population of galaxies due to their poor observational constraints (Dudzevičiūtė et al., 2020).These discoveries also drastically compress the formation and quenching timescales of quiescent galaxies to just a few billion years and raises questions regarding the galaxies they evolved from. While a handful of DSFGs have been discovered out to (Marrone et al., 2018), they represent rare systems and are not thought to make up the bulk of the population of DSFGs at . Ultimately, the number density of massive high-redshift galaxies required to reproduce the observed population of quiescent galaxies at is not supported by the summation of massive LBGs and known extreme DSFGs alone (Straatman et al., 2014). To assess the viability of OIR-dark DSFGs as the progenitors of high- massive quiescent galaxies, we follow arguments based on number density and stellar mass evolution.
5.4.1 Space Density of OIR-dark DSFGs
In total, four OIR-dark DSFGs were detected in the MORA survey. Along with MORA-5 and MORA-9, two additional sources which already have spectroscopic confirmations, MORA-3 (a.k.a. AzTEC-2; Jiménez-Andrade et al. 2020) and MORA-4 (a.k.a. MAMBO-9; Casey et al. 2019), are folded into our source density calculations. We rely on these spectroscopic redshifts (MORA-3: and MORA-4: ) to aid in our estimate of the upper bound of the selection volume, ultimately adopting . Nominally, the maximum redshift of a 2 mm-detected DSFG could be much higher given the negative K-correction, even after accounting for CMB heating. Realistically though, we know sources are extremely rare at based on current surveys and our understanding of the IR luminosity function (Zavala et al., 2021). We then set the lower bound to , given our photometric redshifts for MORA-5 and MORA-9. Examining the contiguous 156 arcmin2 area where all four sources were detected across results in a number density of arcmin-2 and comoving volume density of Mpc-3. The uncertainty on the volume density is generated by running MC trials to create the distribution of expected sources given both cosmic variance (35% between as determined in Zavala et al. 2021) and Poisson noise. These distributions are then summed and the resulting errors are reported. The area of the survey is sufficiently large, despite the small sample size, for this first order estimate given that cosmic variance only begins to dominate beyond (Zavala et al., 2021). A larger survey area, however, would of course improve our determination of number density.
This result is lower than the total H-band dropout space density reported in Wang et al. (2019) ( Mpc-3), which is said to be in agreement with that of massive quiescent galaxies found at (Straatman et al., 2014). We note that our sample is ALMA-selected, whereas % of the H-band dropouts are ALMA-undetected. Limiting the calculation to H-band dropouts with ALMA detections lowers the volume density of the Wang et al. (2019) sample by a factor of 2. Furthermore, if we look only at the twenty sources in the sample, the density drops down to Mpc-3 and falls in line with what we observe in MORA across this redshift range.
Whether or not a source is observed to be OIR-dark, all DSFGs are expected to quench and evolve into passive elliptical galaxies. Indeed, being OIR-dark is likely very dependent on redshift and geometry as discussed in Section 5.2. With this in mind, we also calculate the volume density of all 2 mm-detected DSFGs in the MORA sample from and find Mpc-3. While it is reassuring to see agreement across different samples, the measurements of spatial density presented in the literature as well as this work both suffer from uncertainties in the co-moving volume due to the reliance on photometric redshifts, highlighting the need for future spectroscopic follow-up of high- DSFGs.
5.4.2 Stellar Mass Growth
Both MORA-5, M⊙, and MORA-9, M⊙, have stellar masses already consistent with massive quiescent galaxies (Schreiber et al., 2018), albeit on the lower mass end for MORA-9. High- DSFGs are commonly thought to undergo a short ( Myr), bursty period of star-formation mediated by strong galactic feedback (Mihos & Hernquist, 1996; Cox et al., 2008; Toft et al., 2014; Swinbank et al., 2014; Aravena et al., 2016; Spilker et al., 2020), potentially triggered by an initial gas-rich major merger or interaction. Conversely, consistent gas infall may lead to significantly longer duty cycles of up to a gigayear (Hayward et al., 2013; Narayanan et al., 2015). Based on the star-formation rates and gas masses estimated in Section 4, MORA-5 and MORA-9 have star-forming gas depletion timescales of Myr and Myr, respectively. This is significantly longer than DSFGs at . Assuming these gas depletion times, the stellar mass of MORA-5 increases to M⊙ by and the stellar mass of MORA-9 increases to M⊙ by . These evolved masses are still in line with the mass range of the quiescent sample, however it should be noted that we cannot exclude the possibility of accretion refilling the gas reservoirs and extending the depletion timescales. Valentino et al. (2020) (Figure 6 therein) illustrate the wide range in predicted number densities of quiescent galaxies with log() from both observations and theory across . This mass threshold is well aligned with the entire MORA sample for which we expect to produce galaxies with stellar masses in excess of log() (Casey et al. 2021, Figure 13). For the COSMOS field specifically, the stellar mass function determined in Davidzon et al. (2017) produces a number density of Mpc-3, which then drops precipitously as the mass threshold increases. The lack of consensus in the number density of quiescent galaxies speaks to the need for future observations with JWST to detect and constrain this galaxy population. Luckily, this is a science goal for several of the approved Cycle 1 proposals and as such we eagerly await those results.
If we consider the current stellar mass estimates alone in this closed box scenario, the MORA OIR-dark DSFGs are viable progenitors to high- quiescent galaxies. For now, our conjecture stops there until more accurate stellar masses and greater understanding of potential feedback and quenching mechanisms for these two OIR-dark DSFGs can be obtained. Future observations with JWST MIRI imaging would provide constraints on the rest-frame 1.6 µm stellar bump, thus elucidating the stellar masses of these heavily obscured systems.
6 Conclusions
We present photometric redshifts and physical characterization of MORA-5 and MORA-9, two OIR-dark DSFGs detected in the 2 mm MORA survey. These sources, of interest for their potential to be the highest redshift objects in MORA, lacked secure detections in any photometric bands short of 2.2 µm, consistent with other OIR-dark systems reported in recent literature.
The photometric redshifts reported in this work, for MORA-5 and for MORA-9 are the result of combining the redshift distributions determined via OIR, FIR/mm, and energy balance SEDs. It is this value which informs the physical properties derived for these two systems with the exception of stellar mass and . These two properties are instead determined by MAGPHYS+photo- given its inclusion of IR, (sub)mm, and radio data which is especially beneficial for high-, dust-obscured galaxies.
Based on our current observations, MORA-5 is the more active of the two systems. Its high stellar mass, (1.5 M⊙, and star-formation rate, M⊙yr-1, suggests it is part of a class of rarer, more extreme OIR-dark galaxies. MORA-9 is modest in comparison with (4.1 M⊙ and M⊙yr-1. From our 2 mm dust continuum observations we determine MORA-5 and MORA-9 to have gas masses of M⊙ and M⊙ and gas depletion timescales of Myr and Myr, respectively. Evolving the stellar masses according to our estimated gas depletion timescales results in both systems remaining consistent with the masses of known quiescent galaxies.
It is promising to see convergence towards solutions in all the redshift PDFs given the decision to observe at 2 mm to effectively weed out interlopers thanks to the very negative K-correction at millimeter wavelengths. However, we still highlight the need for spectroscopic follow-up of OIR-dark DSFGs to confirm redshifts and allow for accurate calculations of their spatial density and contribution to the cosmic star-formation rate density (CSFRD) as a function of redshift. Secure redshifts are also essential for placing constraints on dust production mechanisms and build-up within the first billion years after the Big Bang. Redshift confirmation via spectral scan to search for CO transitions with ALMA could be achieved in less than eight hours for both sources combined, taking into account the required rms sensitivity determined by the – relation (Bothwell et al., 2013; Greve et al., 2014).
Given the uncertainties in redshift (and thus, SFR) and stellar masses of OIR-dark DSFGs, it is difficult to compare them directly with high- quiescent galaxies. Based on our current understanding of the space density of both populations and estimates of stellar mass growth, our work is in agreement with previous studies and supports the notion that OIR-dark DSFGs are the progenitors of , massive, quiescent galaxies. Resolved (sub)mm observations providing effective radius measurements of OIR-dark DSFGs are necessary for determining an evolutionary link to compact quiescent galaxies in terms of their comparative spatial extents. They would also allow for measurements of the average dust column density (alluding to the interstellar medium conditions in OIR-dark DSFGs) as well as star-formation surface density. Future observations, either with JWST NIRSpec campaigns or emission line surveys (e.g. with ALMA, NOEMA, LMT) would establish accurate redshifts, while JWST NIRCam and MIRI imaging would constrain the stellar emission and offer insights into the morphologies of these systems. Finally, we will look to expand with wide-field 2 mm imaging as an effective strategy to detect high-, OIR-dark DSFGs.
acknowledgments
We thank the anonymous reviewer for their thoughtful suggestions which helped improve this manuscript. SMM thanks Isabella Cortzen, Seiji Fujimoto, and Francesco Valentino for their hospitality and helpful discussions while visiting the Cosmic DAWN Center. SMM also thanks her parents who provided a home, companionship, and a desk to write this paper during the lockdown brought on by the COVID-19 pandemic. Finally, SMM thanks the National Science Foundation for support through the Graduate Research Fellowship under Grant No. DGE-1610403, the NSF GROW travel grant, Georgios Magdis for being her site host at DAWN, and the NRAO SOS grant. Support for this work was also provided by NASA through the NASA Hubble Fellowship grant #HST-HF2-51484 awarded by the Space Telescope Science Institute, which is operated by the Association of Universities for Research in Astronomy, Inc., for NASA, under contract NAS5-26555. CMC thanks the National Science Foundation for support through grants AST-1814034 and AST-2009577 and thanks RCSA for a Cottrell Scholar Award, sponsored by IF/THEN, an initiative of the Lyda Hill Philanthropies. GEM acknowledges the Villum Fonden research grant 37440, ”The Hidden Cosmos” and the Cosmic Dawn Center of Excellence funded by the Danish National Research Foundation under then grant No. 140. MA acknowledges support from FONDECYT grant 1211951, “CONICYT + PCI + INSTITUTO MAX PLANCK DE ASTRONOMIA MPG190030” and “CONICYT+PCI+REDES 190194”. KK acknowledges support from the Knut and Alice Wallenberg Foundation. MT acknowledges the support from grant PRIN MIUR 2017. This paper makes use of the following ALMA data: ADS/JAO.ALMA#2019.2.00143.S. ALMA is a partnership of ESO (representing its member states), NSF (USA) and NINS (Japan), together with NRC (Canada), MOST and ASIAA (Taiwan), and KASI (Republic of Korea), in cooperation with the Republic of Chile. The Joint ALMA Observatory is operated by ESO, AUI/NRAO and NAOJ. The National Radio Astronomy Observatory is a facility of the National Science Foundation operated under cooperative agreement by Associated Universities, Inc.
References
- Aravena et al. (2010) Aravena, M., Bertoldi, F., Carilli, C., et al. 2010, ApJ, 708, L36, doi: 10.1088/2041-8205/708/1/L36
- Aravena et al. (2016) Aravena, M., Spilker, J. S., Bethermin, M., et al. 2016, MNRAS, 457, 4406, doi: 10.1093/mnras/stw275
- Aretxaga et al. (2011) Aretxaga, I., Wilson, G. W., Aguilar, E., et al. 2011, MNRAS, 415, 3831, doi: 10.1111/j.1365-2966.2011.18989.x
- Arnouts et al. (2002) Arnouts, S., Moscardini, L., Vanzella, E., et al. 2002, MNRAS, 329, 355, doi: 10.1046/j.1365-8711.2002.04988.x
- Ashby et al. (2015) Ashby, M. L. N., Willner, S. P., Fazio, G. G., et al. 2015, ApJS, 218, 33, doi: 10.1088/0067-0049/218/2/33
- Battisti et al. (2019) Battisti, A. J., da Cunha, E., Grasha, K., et al. 2019, ApJ, 882, 61, doi: 10.3847/1538-4357/ab345d
- Blain et al. (2002) Blain, A. W., Smail, I., Ivison, R. J., Kneib, J. P., & Frayer, D. T. 2002, Phys. Rep., 369, 111, doi: 10.1016/S0370-1573(02)00134-5
- Bothwell et al. (2013) Bothwell, M. S., Smail, I., Chapman, S. C., et al. 2013, MNRAS, 429, 3047, doi: 10.1093/mnras/sts562
- Brammer et al. (2008) Brammer, G. B., van Dokkum, P. G., & Coppi, P. 2008, ApJ, 686, 1503, doi: 10.1086/591786
- Brammer et al. (2012) Brammer, G. B., van Dokkum, P. G., Franx, M., et al. 2012, ApJS, 200, 13, doi: 10.1088/0067-0049/200/2/13
- Brisbin et al. (2017) Brisbin, D., Miettinen, O., Aravena, M., et al. 2017, A&A, 608, A15, doi: 10.1051/0004-6361/201730558
- Bruzual & Charlot (2003) Bruzual, G., & Charlot, S. 2003, MNRAS, 344, 1000, doi: 10.1046/j.1365-8711.2003.06897.x
- Capak et al. (2007) Capak, P., Aussel, H., Ajiki, M., et al. 2007, ApJS, 172, 99, doi: 10.1086/519081
- Casey (2020) Casey, C. M. 2020, ApJ, 900, 68, doi: 10.3847/1538-4357/aba528
- Casey et al. (2018a) Casey, C. M., Hodge, J., Zavala, J. A., et al. 2018a, ApJ, 862, 78, doi: 10.3847/1538-4357/aacd11
- Casey et al. (2014) Casey, C. M., Narayanan, D., & Cooray, A. 2014, Phys. Rep., 541, 45, doi: 10.1016/j.physrep.2014.02.009
- Casey et al. (2013) Casey, C. M., Chen, C.-C., Cowie, L. L., et al. 2013, MNRAS, 436, 1919, doi: 10.1093/mnras/stt1673
- Casey et al. (2018b) Casey, C. M., Zavala, J. A., Spilker, J., et al. 2018b, ApJ, 862, 77, doi: 10.3847/1538-4357/aac82d
- Casey et al. (2019) Casey, C. M., Zavala, J. A., Aravena, M., et al. 2019, ApJ, 887, 55, doi: 10.3847/1538-4357/ab52ff
- Casey et al. (2021) Casey, C. M., Zavala, J. A., Manning, S. M., et al. 2021, arXiv e-prints, arXiv:2110.06930. https://arxiv.org/abs/2110.06930
- Chapman et al. (2005) Chapman, S. C., Blain, A. W., Smail, I., & Ivison, R. J. 2005, ApJ, 622, 772, doi: 10.1086/428082
- Condon (1992) Condon, J. J. 1992, ARA&A, 30, 575, doi: 10.1146/annurev.aa.30.090192.003043
- Cox et al. (2008) Cox, T. J., Jonsson, P., Somerville, R. S., Primack, J. R., & Dekel, A. 2008, MNRAS, 384, 386, doi: 10.1111/j.1365-2966.2007.12730.x
- da Cunha et al. (2008) da Cunha, E., Charlot, S., & Elbaz, D. 2008, MNRAS, 388, 1595, doi: 10.1111/j.1365-2966.2008.13535.x
- da Cunha et al. (2015) da Cunha, E., Walter, F., Smail, I. R., et al. 2015, ApJ, 806, 110, doi: 10.1088/0004-637X/806/1/110
- Dahlen et al. (2013) Dahlen, T., Mobasher, B., Faber, S. M., et al. 2013, ApJ, 775, 93, doi: 10.1088/0004-637X/775/2/93
- Davidzon et al. (2017) Davidzon, I., Ilbert, O., Laigle, C., et al. 2017, A&A, 605, A70, doi: 10.1051/0004-6361/201730419
- Delhaize et al. (2017) Delhaize, J., Smolčić, V., Delvecchio, I., et al. 2017, A&A, 602, A4, doi: 10.1051/0004-6361/201629430
- Donevski et al. (2020) Donevski, D., Lapi, A., Małek, K., et al. 2020, A&A, 644, A144, doi: 10.1051/0004-6361/202038405
- Dudzevičiūtė et al. (2020) Dudzevičiūtė, U., Smail, I., Swinbank, A. M., et al. 2020, MNRAS, 494, 3828, doi: 10.1093/mnras/staa769
- Finkelstein et al. (2015) Finkelstein, S. L., Ryan, Russell E., J., Papovich, C., et al. 2015, ApJ, 810, 71, doi: 10.1088/0004-637X/810/1/71
- Fogasy et al. (2020) Fogasy, J., Knudsen, K. K., Drouart, G., Lagos, C. D. P., & Fan, L. 2020, MNRAS, 493, 3744, doi: 10.1093/mnras/staa472
- Fogasy et al. (2017) Fogasy, J., Knudsen, K. K., Lagos, C. D. P., Drouart, G., & Gonzalez-Perez, V. 2017, A&A, 597, A123, doi: 10.1051/0004-6361/201628173
- Franco et al. (2018) Franco, M., Elbaz, D., Béthermin, M., et al. 2018, A&A, 620, A152, doi: 10.1051/0004-6361/201832928
- Fujimoto et al. (2016) Fujimoto, S., Ouchi, M., Ono, Y., et al. 2016, ApJS, 222, 1, doi: 10.3847/0067-0049/222/1/1
- Geach et al. (2017) Geach, J. E., Dunlop, J. S., Halpern, M., et al. 2017, MNRAS, 465, 1789, doi: 10.1093/mnras/stw2721
- Glazebrook et al. (2017) Glazebrook, K., Schreiber, C., Labbé, I., et al. 2017, Nature, 544, 71, doi: 10.1038/nature21680
- González-López et al. (2020) González-López, J., Novak, M., Decarli, R., et al. 2020, ApJ, 897, 91, doi: 10.3847/1538-4357/ab765b
- Greve et al. (2014) Greve, T. R., Leonidaki, I., Xilouris, E. M., et al. 2014, ApJ, 794, 142, doi: 10.1088/0004-637X/794/2/142
- Grogin et al. (2011) Grogin, N. A., Kocevski, D. D., Faber, S. M., et al. 2011, ApJS, 197, 35, doi: 10.1088/0067-0049/197/2/35
- Gruppioni et al. (2013) Gruppioni, C., Pozzi, F., Rodighiero, G., et al. 2013, MNRAS, 432, 23, doi: 10.1093/mnras/stt308
- Gruppioni et al. (2020) Gruppioni, C., Béthermin, M., Loiacono, F., et al. 2020, A&A, 643, A8, doi: 10.1051/0004-6361/202038487
- Hainline et al. (2011) Hainline, L. J., Blain, A. W., Smail, I., et al. 2011, ApJ, 740, 96, doi: 10.1088/0004-637X/740/2/96
- Hao et al. (2011) Hao, C.-N., Kennicutt, R. C., Johnson, B. D., et al. 2011, ApJ, 741, 124, doi: 10.1088/0004-637X/741/2/124
- Hayward et al. (2013) Hayward, C. C., Narayanan, D., Kereš, D., et al. 2013, MNRAS, 428, 2529, doi: 10.1093/mnras/sts222
- Hughes et al. (1998) Hughes, D. H., Serjeant, S., Dunlop, J., et al. 1998, Nature, 394, 241, doi: 10.1038/28328
- Ilbert et al. (2006) Ilbert, O., Arnouts, S., McCracken, H. J., et al. 2006, A&A, 457, 841, doi: 10.1051/0004-6361:20065138
- Jiménez-Andrade et al. (2020) Jiménez-Andrade, E. F., Zavala, J. A., Magnelli, B., et al. 2020, ApJ, 890, 171, doi: 10.3847/1538-4357/ab6dec
- Kennicutt & Evans (2012) Kennicutt, R. C., & Evans, N. J. 2012, ARA&A, 50, 531, doi: 10.1146/annurev-astro-081811-125610
- Koekemoer et al. (2011) Koekemoer, A. M., Faber, S. M., Ferguson, H. C., et al. 2011, ApJS, 197, 36, doi: 10.1088/0067-0049/197/2/36
- Koprowski et al. (2017) Koprowski, M. P., Dunlop, J. S., Michałowski, M. J., et al. 2017, MNRAS, 471, 4155, doi: 10.1093/mnras/stx1843
- Kroupa & Weidner (2003) Kroupa, P., & Weidner, C. 2003, ApJ, 598, 1076, doi: 10.1086/379105
- Laigle et al. (2016) Laigle, C., McCracken, H. J., Ilbert, O., et al. 2016, ApJS, 224, 24, doi: 10.3847/0067-0049/224/2/24
- Le Floc’h et al. (2009) Le Floc’h, E., Aussel, H., Ilbert, O., et al. 2009, ApJ, 703, 222, doi: 10.1088/0004-637X/703/1/222
- Lutz et al. (2011) Lutz, D., Poglitsch, A., Altieri, B., et al. 2011, A&A, 532, A90, doi: 10.1051/0004-6361/201117107
- Madau & Dickinson (2014) Madau, P., & Dickinson, M. 2014, ARA&A, 52, 415, doi: 10.1146/annurev-astro-081811-125615
- Magnelli et al. (2012) Magnelli, B., Lutz, D., Santini, P., et al. 2012, A&A, 539, A155, doi: 10.1051/0004-6361/201118312
- Marrone et al. (2018) Marrone, D. P., Spilker, J. S., Hayward, C. C., et al. 2018, Nature, 553, 51, doi: 10.1038/nature24629
- McCracken et al. (2012) McCracken, H. J., Milvang-Jensen, B., Dunlop, J., et al. 2012, A&A, 544, A156, doi: 10.1051/0004-6361/201219507
- McMullin et al. (2007) McMullin, J. P., Waters, B., Schiebel, D., Young, W., & Golap, K. 2007, in Astronomical Society of the Pacific Conference Series, Vol. 376, Astronomical Data Analysis Software and Systems XVI, ed. R. A. Shaw, F. Hill, & D. J. Bell, 127
- Miettinen et al. (2017) Miettinen, O., Delvecchio, I., Smolčić, V., et al. 2017, A&A, 606, A17, doi: 10.1051/0004-6361/201730762
- Mihos & Hernquist (1996) Mihos, J. C., & Hernquist, L. 1996, ApJ, 464, 641, doi: 10.1086/177353
- Murphy et al. (2011) Murphy, E. J., Condon, J. J., Schinnerer, E., et al. 2011, ApJ, 737, 67, doi: 10.1088/0004-637X/737/2/67
- Muzzin et al. (2013) Muzzin, A., Marchesini, D., Stefanon, M., et al. 2013, ApJS, 206, 8, doi: 10.1088/0067-0049/206/1/8
- Narayanan et al. (2015) Narayanan, D., Turk, M., Feldmann, R., et al. 2015, Nature, 525, 496, doi: 10.1038/nature15383
- Oliver et al. (2012) Oliver, S. J., Bock, J., Altieri, B., et al. 2012, MNRAS, 424, 1614, doi: 10.1111/j.1365-2966.2012.20912.x
- Ono et al. (2018) Ono, Y., Ouchi, M., Harikane, Y., et al. 2018, PASJ, 70, S10, doi: 10.1093/pasj/psx103
- Oteo et al. (2016) Oteo, I., Zwaan, M. A., Ivison, R. J., Smail, I., & Biggs, A. D. 2016, ApJ, 822, 36, doi: 10.3847/0004-637X/822/1/36
- Planck Collaboration et al. (2016) Planck Collaboration, Ade, P. A. R., Aghanim, N., et al. 2016, A&A, 594, A13, doi: 10.1051/0004-6361/201525830
- Reddy & Steidel (2009) Reddy, N. A., & Steidel, C. C. 2009, ApJ, 692, 778, doi: 10.1088/0004-637X/692/1/778
- Rowan-Robinson et al. (2016) Rowan-Robinson, M., Oliver, S., Wang, L., et al. 2016, MNRAS, 461, 1100, doi: 10.1093/mnras/stw1169
- Sanders & Mirabel (1996) Sanders, D. B., & Mirabel, I. F. 1996, ARA&A, 34, 749, doi: 10.1146/annurev.astro.34.1.749
- Schinnerer et al. (2007) Schinnerer, E., Smolčić, V., Carilli, C. L., et al. 2007, ApJS, 172, 46, doi: 10.1086/516587
- Schreiber et al. (2015) Schreiber, C., Pannella, M., Elbaz, D., et al. 2015, A&A, 575, A74, doi: 10.1051/0004-6361/201425017
- Schreiber et al. (2018) Schreiber, C., Glazebrook, K., Nanayakkara, T., et al. 2018, A&A, 618, A85, doi: 10.1051/0004-6361/201833070
- Scott et al. (2002) Scott, S. E., Fox, M. J., Dunlop, J. S., et al. 2002, MNRAS, 331, 817, doi: 10.1046/j.1365-8711.2002.05193.x
- Scoville et al. (2007) Scoville, N., Aussel, H., Brusa, M., et al. 2007, ApJS, 172, 1, doi: 10.1086/516585
- Scoville et al. (2016) Scoville, N., Sheth, K., Aussel, H., et al. 2016, ApJ, 820, 83, doi: 10.3847/0004-637X/820/2/83
- Simpson et al. (2019) Simpson, J. M., Smail, I., Swinbank, A. M., et al. 2019, ApJ, 880, 43, doi: 10.3847/1538-4357/ab23ff
- Smail et al. (2021) Smail, I., Dudzevičiūtė, U., Stach, S. M., et al. 2021, MNRAS, 502, 3426, doi: 10.1093/mnras/stab283
- Smith et al. (2017) Smith, D. J. B., Hayward, C. C., Jarvis, M. J., & Simpson, C. 2017, MNRAS, 471, 2453, doi: 10.1093/mnras/stx1689
- Smolčić et al. (2017a) Smolčić, V., Novak, M., Bondi, M., et al. 2017a, A&A, 602, A1, doi: 10.1051/0004-6361/201628704
- Smolčić et al. (2017b) Smolčić, V., Miettinen, O., Tomičić, N., et al. 2017b, A&A, 597, A4, doi: 10.1051/0004-6361/201526989
- Spilker et al. (2020) Spilker, J. S., Aravena, M., Phadke, K. A., et al. 2020, ApJ, 905, 86, doi: 10.3847/1538-4357/abc4e6
- Spitler et al. (2014) Spitler, L. R., Straatman, C. M. S., Labbé, I., et al. 2014, ApJ, 787, L36, doi: 10.1088/2041-8205/787/2/L36
- Staguhn et al. (2014) Staguhn, J. G., Kovács, A., Arendt, R. G., et al. 2014, ApJ, 790, 77, doi: 10.1088/0004-637X/790/1/77
- Stevans et al. (2021) Stevans, M. L., Finkelstein, S. L., Kawinwanichakij, L., et al. 2021, arXiv e-prints, arXiv:2103.14690. https://arxiv.org/abs/2103.14690
- Straatman et al. (2014) Straatman, C. M. S., Labbé, I., Spitler, L. R., et al. 2014, ApJ, 783, L14, doi: 10.1088/2041-8205/783/1/L14
- Swinbank et al. (2014) Swinbank, A. M., Simpson, J. M., Smail, I., et al. 2014, MNRAS, 438, 1267, doi: 10.1093/mnras/stt2273
- Talia et al. (2021) Talia, M., Cimatti, A., Giulietti, M., et al. 2021, ApJ, 909, 23, doi: 10.3847/1538-4357/abd6e3
- Toft et al. (2014) Toft, S., Smolčić, V., Magnelli, B., et al. 2014, ApJ, 782, 68, doi: 10.1088/0004-637X/782/2/68
- Valentino et al. (2020) Valentino, F., Tanaka, M., Davidzon, I., et al. 2020, ApJ, 889, 93, doi: 10.3847/1538-4357/ab64dc
- Walter et al. (2012) Walter, F., Decarli, R., Carilli, C., et al. 2012, Nature, 486, 233, doi: 10.1038/nature11073
- Wang et al. (2019) Wang, T., Schreiber, C., Elbaz, D., et al. 2019, Nature, 572, 211, doi: 10.1038/s41586-019-1452-4
- Williams et al. (2019) Williams, C. C., Labbe, I., Spilker, J., et al. 2019, ApJ, 884, 154, doi: 10.3847/1538-4357/ab44aa
- Zavala (2021) Zavala, J. A. 2021, Research Notes of the American Astronomical Society, 5, 15, doi: 10.3847/2515-5172/abdd26
- Zavala et al. (2014) Zavala, J. A., Aretxaga, I., & Hughes, D. H. 2014, MNRAS, 443, 2384, doi: 10.1093/mnras/stu1330
- Zavala et al. (2021) Zavala, J. A., Casey, C. M., Manning, S. M., et al. 2021, ApJ, 909, 165, doi: 10.3847/1538-4357/abdb27