TOI-712: a system of adolescent mini-Neptunes extending to the habitable zone
Abstract
As an all-sky survey, NASA’s TESS mission is able to detect the brightest and rarest types of transiting planetary systems, including young planets that enable study of the evolutionary processes that occur within the first billion years. Here, we report the discovery of a young, multi-planet system orbiting the bright K4.5V star, TOI-712 (, , , K). From the TESS light curve, we measure a rotation period of 12.48 days, and derive an age between about Myr and 1.1 Gyr. The photometric observations reveal three transiting mini-Neptunes (, , ), with orbital periods of days, days, and days. After modeling the three-planet system, an additional Earth-sized candidate is identified, TOI-712.05 ( days, ). We calculate that the habitable zone falls between 0.339 and 0.844 au (82.7 and 325.3 days), placing TOI-712 d near its inner edge. Among planetary systems harboring temperate planets, TOI-712 () stands out as a relatively young star bright enough to motivate further characterization.
1 Introduction
Planetary systems undergo many evolutionary processes within the first billion years, but the mechanisms that shape their physical properties and orbital architectures are not yet fully understood. Early interactions with the protoplanetary disk, with other planets, and with the host star can all influence the properties of the mature systems we observe today, but it can be difficult to constrain early processes by observing mature systems. Observing young ( Gyr) planetary systems gives us a chance to more directly observe evolutionary processes (e.g., tidal circularization, atmospheric escape, cooling) and constrain their timescales.
Most stars form in groups, the densest of which persist for hundreds of millions of years in loosely bound stellar clusters and associations (e.g., Briceño et al., 2007). Young stars rotate rapidly, which enhances magnetic field strength and leads to active surface regions (Hartmann & Noyes, 1987). These features produce large stellar activity signals and make it difficult to distinguish planetary signals from those of stellar origin (e.g., Saar & Donahue, 1997). Early investigations of young planetary systems were largely composed of radial velocity (RV) surveys targeting known moving groups, stellar clusters, and associations (Paulson et al., 2004; Sato et al., 2007; Lovis & Mayor, 2007; Quinn et al., 2012, 2014) but were limited to detecting giant planets due to the difficulty in detecting low-amplitude signals in the presence of increased stellar activity.
While these RV surveys have contributed to our understanding of planetary formation and evolution, transiting planets provide additional constraints on the physical evolution of planets by measuring planet radii and paving the way for subsequent atmospheric observations. Moreover, precise, space-based photometry is capable of identifying small transiting planets even in the presence of the large photometric rotational modulation that is characteristic of young stars. Kepler (Borucki et al., 2010), and especially the ecliptic survey of K2 (Howell et al., 2014) made possible the detection and characterization of small planets orbiting young stars. K2 discoveries include planets in open clusters like the Hyades (Mann et al., 2016a; Livingston et al., 2018; Mann et al., 2018; Vanderburg et al., 2018) and Praesepe (Mann et al., 2016a; Obermeier et al., 2016; Pepper et al., 2017; Rizzuto et al., 2018; Livingston et al., 2019), as well as associations like Upper Scorpius (David et al., 2016; Mann et al., 2016b) and the Taurus-Auriga star forming region (David et al., 2019). These discoveries led to the observation that young planets tend to have larger radii than their mature counterparts. While there may be a bias against detecting small planets orbiting young stars, the large radii of young planets are broadly consistent with predictions for planets undergoing atmospheric mass loss, though the observed sizes imply more mass loss than the models predict. Further study of the evolution of the planet size distribution can constrain the timescales of the process and therefore the mechanisms driving it. This result demonstrates the promise of young systems, but the K2 sample is relatively small and most of the host stars are too faint or active for mass measurements with radial velocities. To discover new benchmark young systems amenable to detailed characterization, and to build a large enough sample of young planets to derive strong constraints from their ensemble properties, many more young stars must be surveyed.
Fortunately, ESA’s Gaia mission (Gaia Collaboration et al., 2016, 2018), which has already released extremely precise astrometric and photometric measurements for more than a billion stars, has unveiled previously unknown young stellar groups and identified new members of existing groups (e.g., Kounkel & Covey, 2019; Gagné et al., 2021). As an all-sky survey, NASA’s TESS mission (Ricker et al., 2016) is searching the brightest of these stars for transiting planets. This has led to the discoveries of many more planets in known young groups (e.g., Newton et al., 2019; Plavchan et al., 2020; Rizzuto et al., 2020; Mann et al., 2020; Tofflemire et al., 2021). Moreover, because Sun-like stars spin down over time (e.g., Barnes, 2007; Mamajek & Hillenbrand, 2008), the TESS photometry used for transit searches can also identify young stars via their rapid rotation. In some cases, this leads to a revised young age for entire groups of stars (the Pisces-Eridanus stream; Meingast et al., 2019; Curtis et al., 2019b). In other cases, TESS rotation periods reveal a young age for planet-hosting field stars (Carleo et al., 2021; Zhou et al., 2021). Because TESS observes nearly the whole sky, it has begun to find the brightest, nearest examples of young planetary systems, which are amenable to detailed characterization through radial velocity masses and atmospheric measurement.
Though the size distribution of young planets has provided evidence for the physical evolution of small planets, many of them reside in systems with only one transiting planet, so their orbital architectures are not well constrained. In the same way that comparing the radii of young planets to their mature counterparts can illuminate the physical evolution of small planets, comparing the orbital architectures of young planetary systems to their mature counterparts can illuminate their orbital evolution. Kepler revealed that most short-period multi-planet systems are flat, with well-aligned, relatively circular orbits, and a slight preference to reside just outside of low-order mean motion resonances (Lissauer et al., 2011; Fabrycky et al., 2014; Hadden & Lithwick, 2014). However, to explain the observed population of systems with only one transiting planet, it has been suggested that there exists a sample of planets that is either characterized by high mutual misalignment or single planet systems (e.g., Lissauer et al., 2011; Fang & Margot, 2012; Ballard & Johnson, 2016). On the other hand, recent analysis of the mutual inclinations of Kepler systems shows that they can be modeled by a single continuous distribution (Millholland et al., 2021). Planetary system architectures at young ages can help us understand the processes that have shaped the observed characteristics of the more mature Kepler sample. Multi-planet systems also offer an opportunity to constrain the system properties (e.g., masses, eccentricities, inclinations) via dynamical simulations, and to perform comparative studies with planets that have experienced the same stellar environment. For young planets, this may be particularly important in the context of constraining the timescale of thermal mass loss.
In this paper, we report the discovery of three mini-Neptunes transiting the adolescent, K4.5V, field star TOI-712, with periods of 9.53 days (TOI-712 b), 51.69 days (TOI-712 c), and 84.39 days (TOI-712 d). Additionally, we find a small candidate planet with a period of 4.3 days, but additional data is needed to confirm its planetary nature. In Section 2, we present our observational data obtained from TESS and ground-based facilities. In Section 3, we describe the stellar characterization, including constraints on the age of TOI-712. In Section 4, we provide our global analysis of the TOI-712 system, and report the derived properties of the planets. In Section 6, we present a dynamical stability analysis and explore the evolution of the TOI-712 system, including the potential survivability of a habitable zone (HZ) planet, given the location of TOI-712 d in the Venus zone at the inner edge of the HZ. We discuss our results in Section 7.
2 Observations
2.1 TESS Photometry
NASA’s Transiting Exoplanet Survey Satellite (TESS) is an all-sky photometric survey, launched 18 April 2018. Its primary mission is to detect small planets around nearby, bright stars, ideal for follow-up observations for further characterization. Using 4 cameras, each , TESS observes the sky in strips. In the two-year prime mission, these strips generally spanned from one of the ecliptic poles to near the ecliptic plane. Each observing sector lasts 27.4 days before stepping to the next anti-solar sector. After a year (13 sectors) observing the southern ecliptic hemisphere, the spacecraft oriented to observe the north for a year111Some deviation from this strategy was necessary in the northern hemisphere to avoid regions of high scattered light due to the Earth and Moon, and some new pointing strategies are being employed in the extended mission to observe regions of the ecliptic plane. Overlap of the fields of view of successive sectors at high ecliptic latitudes results in longer observation time spans, extending to nearly continuous year-long coverage at the poles.
TIC 150151262 (TOI-712) was pre-selected for 2-minute cadence observations by the TESS mission on the basis of the star’s size, brightness, and position on the sky near the southern ecliptic pole, the combination of which was expected to enable detection of small transiting planets. TOI-712 was observed on Camera 4 during the prime and extended missions between 2018 September 20 UTC and 2021 June 24 (sectors 3, 4, 6, 7, 9, 10, 11, 13, 27, 29, 30, 31, 32, 33, 34, 36, 37, and 39). During the extended mission, TOI-712 was selected for 20-second cadence observations in sector 27 as part of two Guest Investigator programs: G03068 (PI D. Kipping) and G03278 (PI A. Mayo).
The raw photometric data from TESS was processed by the TESS Science Processing Operations Center (SPOC) located at NASA Ames Research Center. The SPOC pipeline (Jenkins et al., 2010a, 2016) extracts the light curve using Simple Aperture Photometry (SAP) and also corrects the light curve for instrument systematics using the Presearch Data Conditioning (PDC) algorithm (see Stumpe et al., 2012). The resulting light curves are available through the Mikulski Archive for Space Telescopes (MAST) archive. After filtering for stellar variability and residual noise, the light curve was searched for transit signals using the SPOC Transiting Planet Search (TPS, Jenkins, 2002; Jenkins et al., 2010b, 2020), which revealed two periodic transit events with periods of 9.53 days and 51.69 days. An initial limb-darkened transit model was fitted to the data (Li et al., 2019) and a suite of diagnostic tests were conducted to make or break confidence in the planetary interpretation of the signatures (Twicken et al., 2018). The two candidates passed all the diagnostic tests and the sources of the transits were localized to within 1.9500 4.1489 arc sec and 2.0800 4.5217 arc sec, respectively. The TESS Science Office reviewed the DV Data Validation reports and issued an alert in May 2019 (Guerrero et al., 2021). These were released as TESS Objects of Interest (TOIs), TOI-712.01 and TOI-712.02. An additional candidate with a period of 53.7 days was released as TOI-712.03, but only one transit event looked believable, and a system with 51- and 53-day planets would not be dynamically stable.
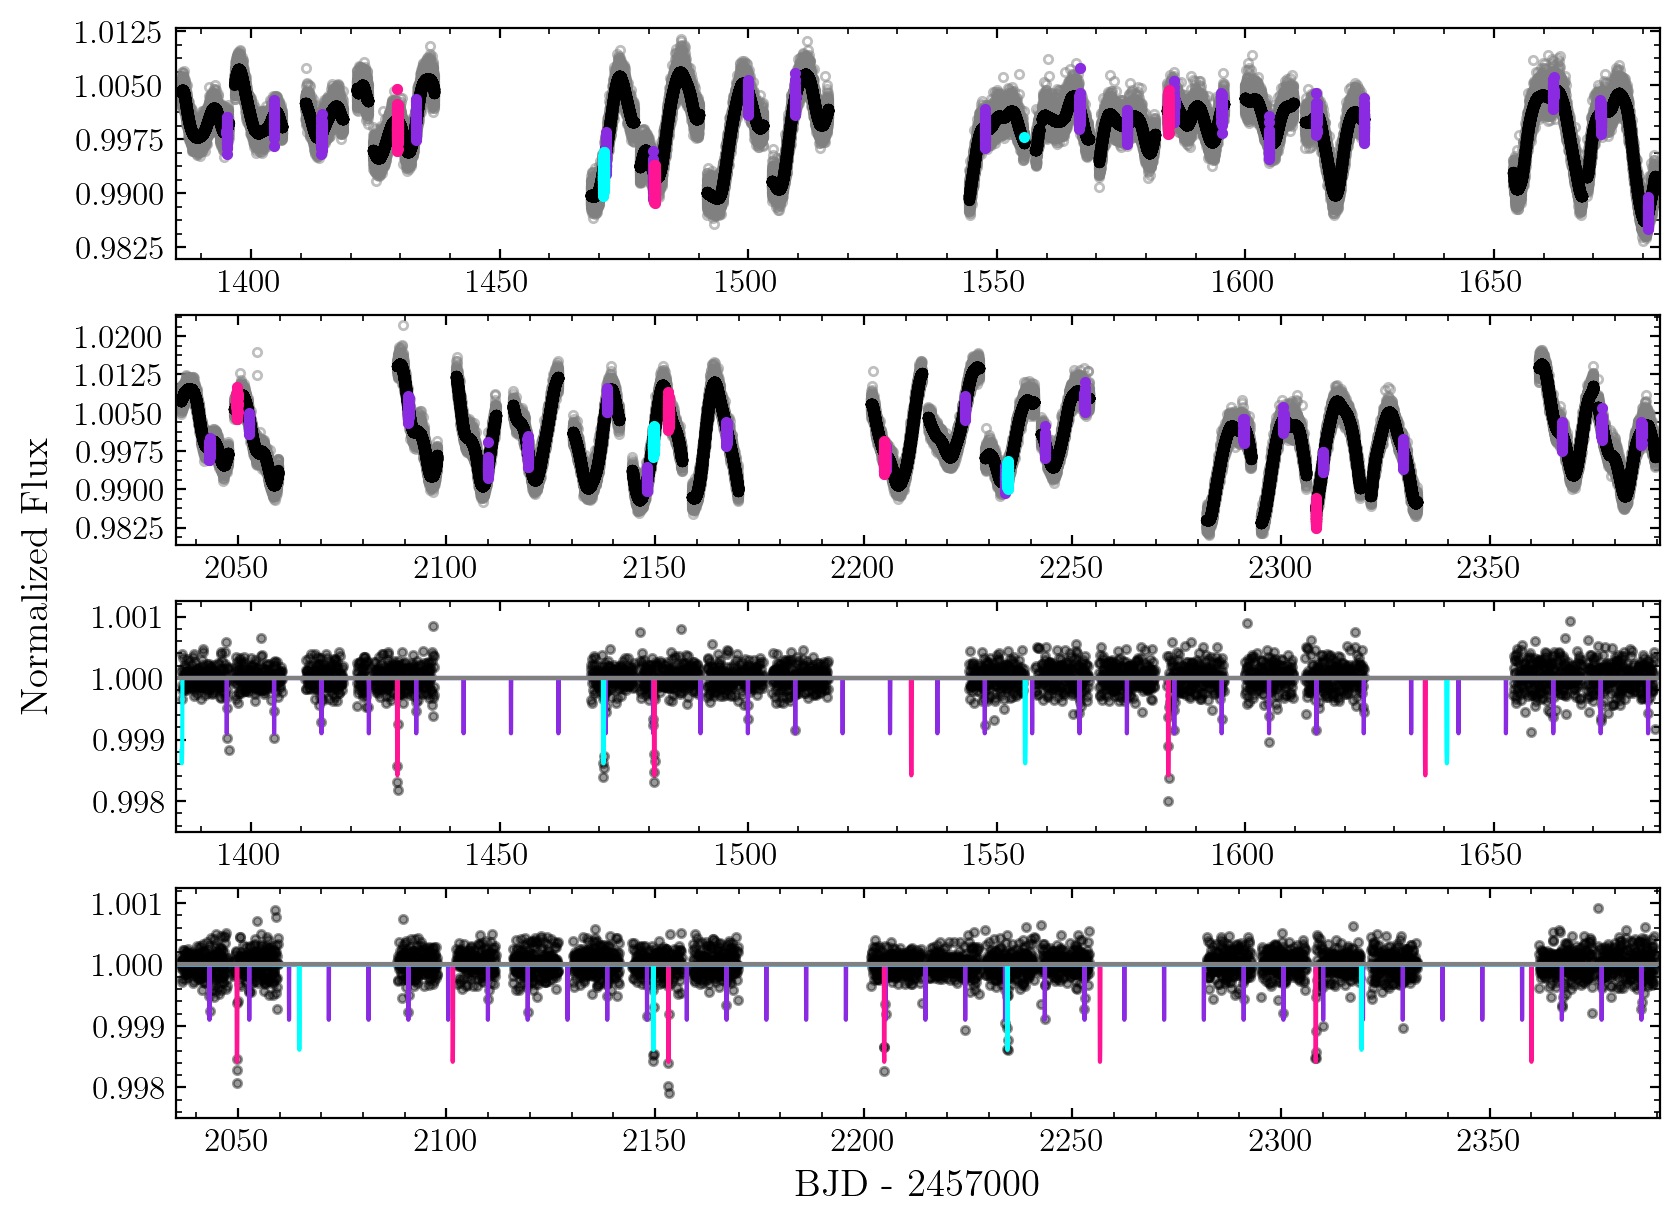
We note that the algorithms applied by SPOC are successful for the vast majority of stars, but the stellar variability of young stars often requires a boutique analysis to properly remove stellar signal and identify real transits (see, e.g., Rizzuto et al., 2017; Hedges et al., 2021). Given the apparent presence of this additional transit-like event, we chose to re-extract the light curve while correcting for spacecraft systematics, following Vanderburg et al. (2019). We started with the SPOC simple aperture photometry (SAP) light curve and fit a model to the time series consisting of a basis spline (with breakpoints spaced every 1.0 days to adequately model the stellar variability) and systematics parameters relating to the means and standard deviations of the spacecraft quaterion time series within each exposure (see Vanderburg et al. 2019), the fast timescale (band 3) cotrending basis vectors from the SPOC PDC analysis, and a high-pass-filtered time series of the flux in the SPOC background aperture. We fit for up to quadratic relationships in each systematics parameter. We solved for the best-fit coefficients of our free parameters using a matrix inversion technique, iteratively excluding 3 outliers from the fit until it reached convergence. We then subtracted the best-fit systematics vectors from the SAP light curve, and corrected for diluting flux in the optimal aperture using the SPOC crowdsap parameter, to yield a final, corrected light curve. While there are 24 stars within two TESS pixels, none of them are brighter than , and as a result the aperture typically includes only about dilution. The uncertainty in this correction, propagated to the derived parameters, is negligible compared to other sources of uncertainty. We performed the same extraction for the sector 27 twenty-second data, and then binned to 2 minutes. While the overall scatter in our extracted light curve is similar to the PDCSAP scatter, the systematics during periods of increased pointing jitter are reduced. This helped us identify additional transits of the third candidate, for which we determined a period of 84.839 days. We note that SPOC later identified another transit of this candidate in the extended mission. It was assigned a period of 678.7 days (eight times too long) and released as TOI-712.04, though we now know that both TOI-712.03 (53 days) and TOI-712.04 (679 days) correspond to the 84.8-day candidate. The three candidates have transit depths close to 1 mmag, implying sizes between and , and durations ranging from 1.7 to 5.7 hours, as expected for the range of orbital periods. Details of the transit fitting are discussed in Section 4. Our extracted light curve is shown in Figure 1.
2.2 Ground-based Time-series Photometry
We conducted ground-based photometric follow-up observations for TOI-712 as part of the TESS Follow-up Observing Program222https://tess.mit.edu/followup (TFOP; Collins, 2019). We used the TESS Transit Finder, which is a customized version of the Tapir software package (Jensen, 2013), to schedule our transit observations. The observations are described below and summarized in Table 1.
2.2.1 LCOGT
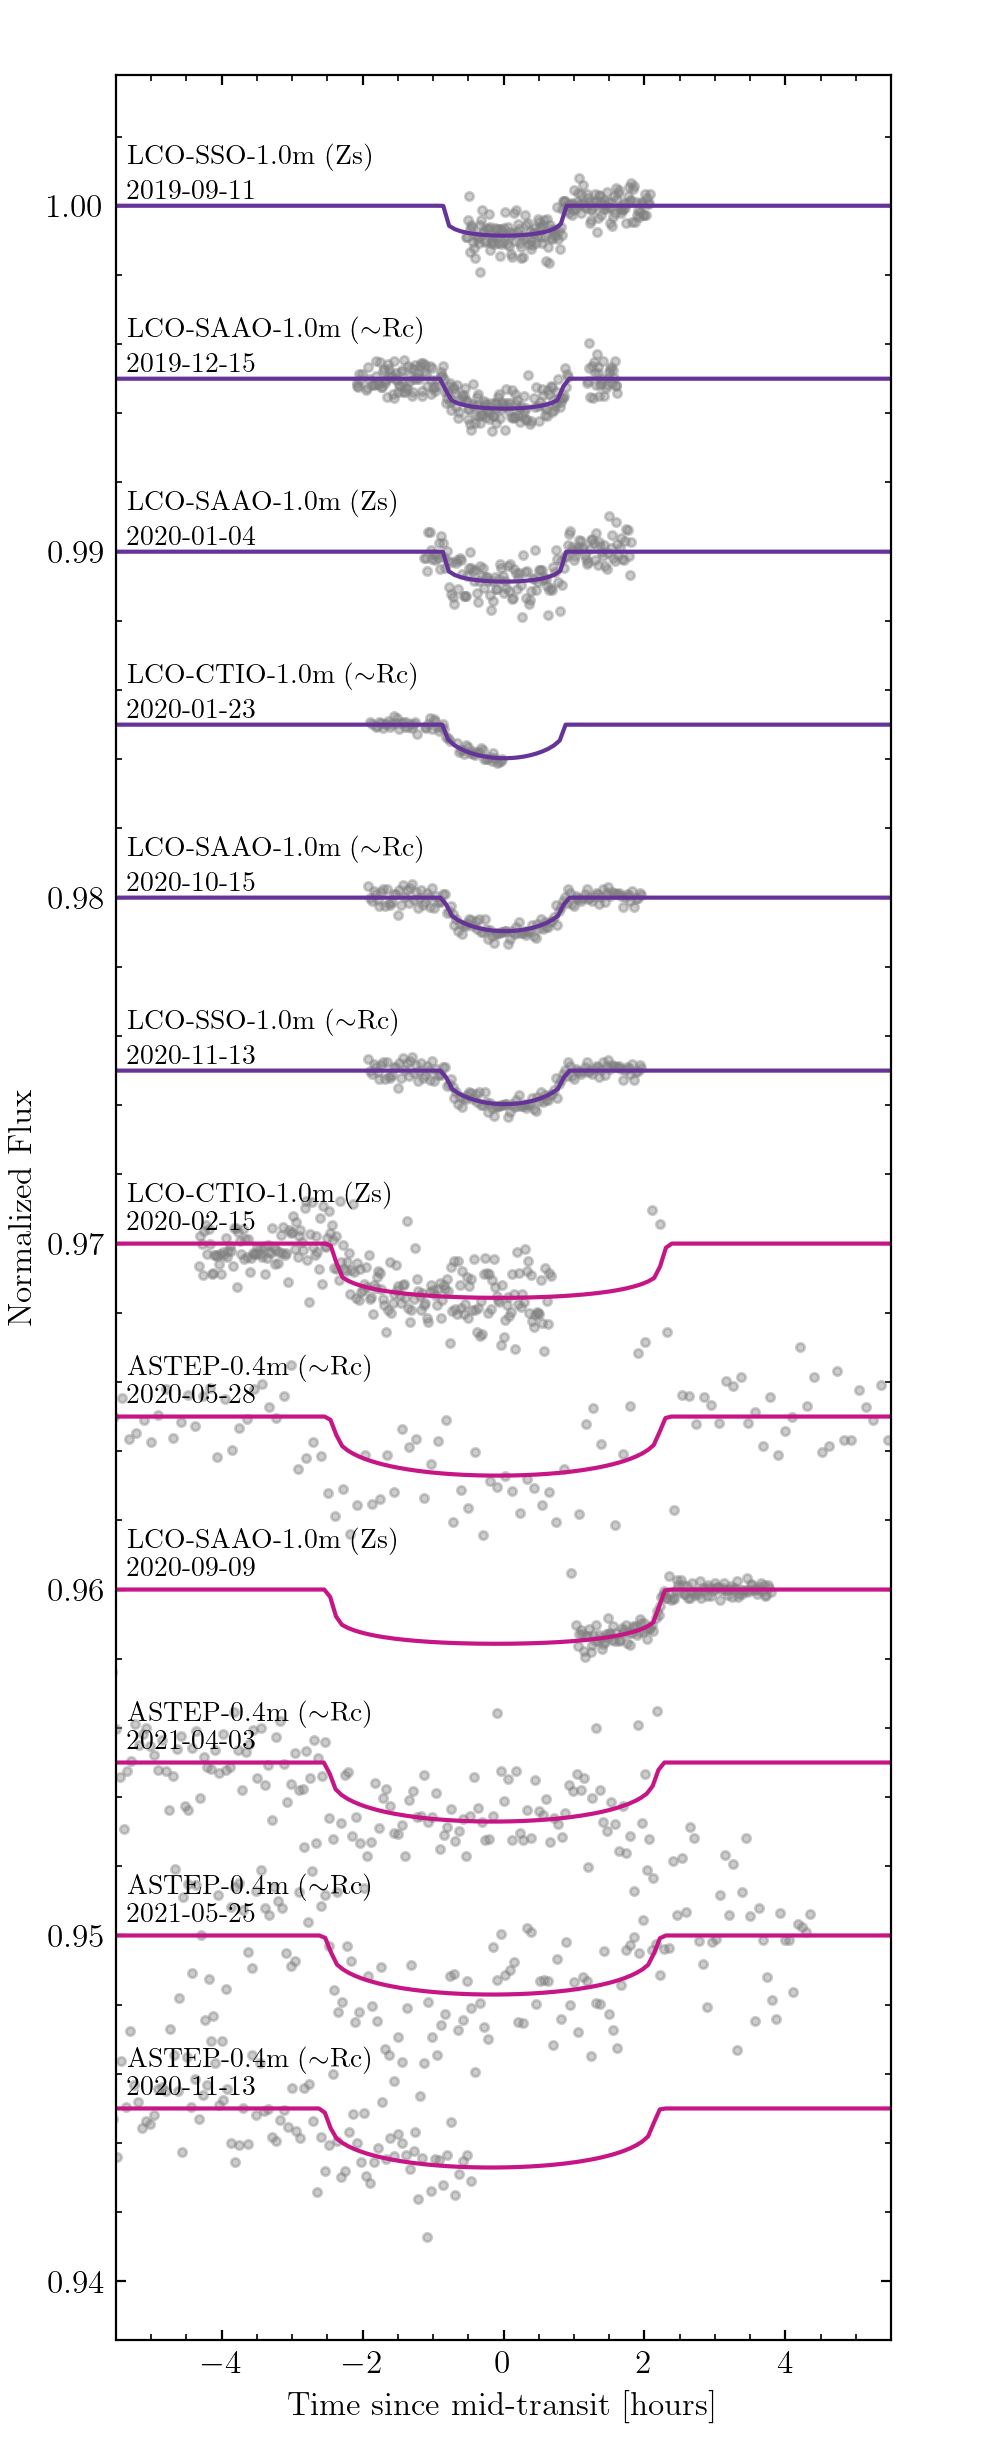
We observed seven TOI-712 b and three TOI-712 c full or partial transits from the Las Cumbres Observatory Global Telescope (LCOGT; Brown et al., 2013) 1.0 m network. The LCOGT SINISTRO cameras have an image scale of per pixel, resulting in a field of view. The images were calibrated by the standard LCOGT BANZAI pipeline (McCully et al., 2018), and photometric data were extracted using AstroImageJ (Collins et al., 2017).
We include all observations in the global fit (see Section 4) with the exception of the egress observation from 2019-12-25, which suffered from poor precision. It was nevertheless an important observation that confirmed that the transit occurrs at the location of the target star and is not a nearby eclipsing binary unresolved by TESS.
| Date (UT) | Telescope | Filter | Coverage |
|---|---|---|---|
| TOI-712 b | |||
| 2019-09-11 | LCO-SSO-1.0m | Zs | Egress |
| 2019-12-15 | LCO-SAAO-1.0m | Zs | Full |
| 2020-01-04 | LCO-SAAO-1.0m | Zs | Full |
| 2020-01-23 | LCO-CTIO-1.0m | B | Ingress |
| 2020-10-15 | LCO-SAAO-1.0m | B | Full |
| 2020-11-13 | LCO-SSO-1.0m | Zs | Full |
| 2020-12-12 | LCO-CTIO-1.0m | ip | Full |
| TOI-712 c | |||
| 2019-12-25† | LCO-SSO-1.0m | Zs | Egress |
| 2019-12-25† | Hazelwood-0.32m | Rc | Ingress |
| 2020-02-15 | LCO-CTIO-1.0m | Zs | Ingress |
| 2020-05-28 | ASTEP-0.4m | Rc | Full |
| 2020-09-09 | LCO-SAAO-1.0m | Zs | Egress |
| 2021-04-03 | ASTEP-0.4m | Rc | Ingress |
| 2021-05-25 | ASTEP-0.4m | Rc | Full |
| 2021-09-05 | ASTEP-0.4m | Rc | Ingress |
Note. † indicates an observation that was not used in the global fit.
The LCOGT filter designations Zs and ip indicate Pan-STARRS -short band and Sloan band, respectively. The LCOGT 1 m telescope nodes used are at Siding Spring Observatory (SSO), Cerro Tololo Inter-American Observatory (CTIO), and South Africa Astronomical Observatory (SAAO). See text regarding the ASTEP observation band.
2.2.2 ASTEP
Four transits of TOI-712 c were observed in 2020 and 2021 with the Antarctica Search for Transiting ExoPlanets (ASTEP) program on the East Antarctic plateau (Guillot et al., 2015; Mékarnia et al., 2016). This includes two full transits observed on 2020-05-28 and 2021-05-25. The 0.4 m telescope is equipped with an FLI Proline science camera with a KAF-16801E, front-illuminated CCD. The camera has an image scale of pixel-1 resulting in a 1 corrected field of view. The focal instrument dichroic plate splits the beam into a blue wavelength channel for guiding, and a non-filtered red science channel roughly matching an Rc transmission curve. The data are processed on-site using an automated IDL-based pipeline described in Abe et al. (2013).
| RV | ||
|---|---|---|
| ( km s-1) | ( km s-1) | |
| 2458746.897310 | 3.822 | 0.064 |
| 2458787.812670 | 3.967 | 0.066 |
| 2459314.531560 | 3.953 | 0.036 |
Note. The CHIRON radial velocities show no significant variation that might have been indicative of a bound stellar companion.
2.2.3 Hazelwood
We observed an ingress of TOI-712 c from Hazelwood Observatory near Churchill, Victoria, Australia. The 0.32 m telescope is equipped with a SBIG STT3200 camera. The image scale is 055 pixel-1, resulting in a field of view. The images were calibrated and the photometric data were extracted using AstroImageJ.
This event was the same as the one observed by LCOGT on 2019-12-25. It shows evidence for systematics in transit, and we therefore do not include it in our fit, but as the first observation of this candidate, we note that it represented a valuable confirmation that the transit occurs on the target star and is not a nearby eclipsing binary.
2.3 CHIRON Spectroscopy
We obtained three spectra of TOI-712 with the CHIRON high-resolution echelle spectrograph on the 1.5 m SMARTS telescope at the Cerro Tololo Inter-American Observatory (CTIO), Chile (Tokovinin et al., 2013). Observations were taken on UT 2019-Sep-20, 2019-Oct-31, and 2021-Apr-10 in slicer mode, which employs a fiber-fed image slicer to deliver light to the spectrograph, achieving a resolving power of across the wavelength range – Å. The CHIRON spectra can be used to characterize the stellar properties, search for massive outer companions, and rule out false positive scenarios that would induce large radial-velocity (RV) variations or exhibit line profile variations.
We extracted the RVs of TOI-712 by fitting the line profiles of each spectrum, which were measured via least-squares deconvolution (LSD) of the observed spectra against synthetic templates (Donati et al., 1997). The RVs, which reveal no significant velocity variation beyond the uncertainties ( m s-1) are listed in Table 2. We also find no evidence for a composite spectrum or line profile variations.
2.4 High-resolution Imaging
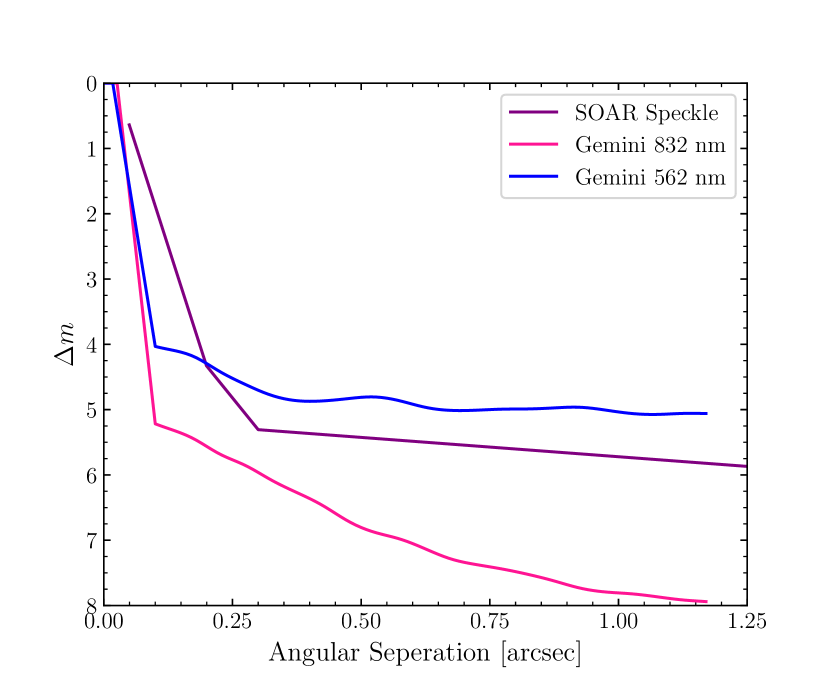
We searched for close visual companions to TOI-712 in band using the HRCam speckle imager on the m Southern Astrophysical Research (SOAR) telescope (Tokovinin, 2018; Ziegler et al., 2018) on UT 2019-Oct-16, and simultaneously at nm and nm using the Zorro333https://www.gemini.edu/sciops/instruments/alopeke-zorro/ speckle imager on the 8 m Gemini South Telescope on UT 2020-Jan-10. We achieved contrast ratios better than magnitudes at a separation of and magnitudes beyond in the Zorro nm data, which have a field of view of and are therefore sensitive to companions within about of TOI-712. Outside of , Gaia can exclude the presence of stellar sources bright enough to produce the observed transit signals (Ziegler et al., 2018). Closer stars unresolved by Gaia will often manifest as elevated astrometric noise (see, e.g., Evans, 2018), but TOI-712 has , providing no evidence for excess astrometric motion444See Lindegren et al. (2018) for a description of the Gaia astrometric solution. A description of the Renormalised Unit Weight Error (RUWE) can be found at https://www.cosmos.esa.int/web/gaia/public-dpac-documents. The contrast curves from our speckle imaging are shown in Figure 3.
3 Stellar Parameters
3.1 Spectroscopic Classification
We extract the effective temperature (), surface gravity (), and metallicity () of TOI-712 from the CHIRON spectrum by matching against a library of observed spectra that have been previously classified by SPC (Buchhave et al., 2012), with interpolation performed via a gradient-boosting regressor implemented in the scikit-learn python module. We find K, , and . The projected rotational velocity, , is derived following Gray (2005) and Zhou et al. (2018), fitting broadening kernels to the instrumental, macroturbulent, and rotational line profiles. We estimate km s-1 and km s-1, though the instrumental resolving power is only km s-1; for such slow rotation, these estimates may suffer systematic offsets. The projected rotational velocity is consistent with the equatorial rotation velocity calculated from the stellar radius and rotation period, but it is not precise enough to confidently state that the stellar spin and orbital axes are well aligned.
3.2 The Age of TOI-712
3.2.1 Gyrochronology
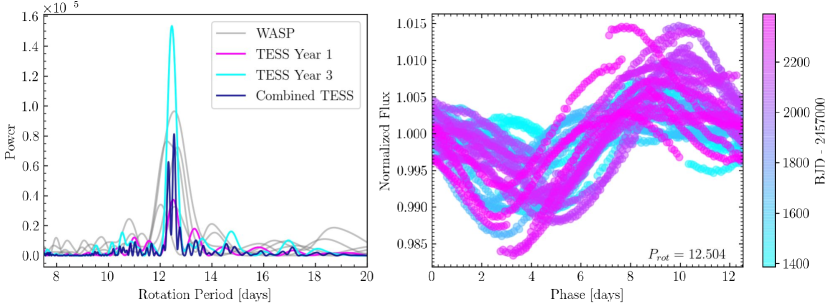
Right: Normalized TESS light curve detrended using the methods described in Vanderburg et al. (2019), phase folded over the measured stellar rotation period extracted from the combined primary and extended TESS observations. The phased points are colored based on the time of observation, showing that while the phase curve morphology changes slightly over time, the measured period is consistent with data from both Year 1 (blue tint) and Year 3 (pink tint).
The TESS light curve of TOI-712 shows rotational modulation with an amplitude of , indicative of active regions on the stellar surface like those expected for a young star. We estimate the rotation period with multiple techniques, first using a Lomb-Scargle periodogram (Lomb, 1976; Scargle, 1982). We assign the rotation period to the period of maximum power, with the uncertainty taken to be the half width at half maximum. However, the analysis is slightly complicated by the long time span of observations. Visual inspection of the light curve (Figure 1) reveals changes in the morphology of the rotational phase curve on a relatively short timescale. The first year of TESS observations includes two epochs of a more complex, double-peaked phase curve and two epochs of a single-peaked phase curve. The third year is primarily single-peaked. If the dominant spot latitudes also change between the prime and extended missions, we might expect a slight change in the measured rotation period due to differential rotation, which is both predicted (e.g., Küker & Rüdiger, 2011) and measured for some rapidly rotating stars (e.g., Collier Cameron, 2007). A periodogram of the full time series would then be sensitive to the phasing of the signals even though we should not expect or require them to be in phase. Indeed, this is what we see in Figure 4, which shows that the periodogram of the combined TESS light curve only allows a few discrete periods, while individual years of data each exhibit broader peaks that are consistent with one another. We therefore measure the rotation period in each year separately.
From the TESS year 1 light curves, we measure a stellar rotation period of 12.505 0.441 days, and the TESS year 3 light curves yields a rotation period of 12.452 0.629 days. Additionally, WASP photometry spanning five observing seasons from 2008 to 2012 measures a rotation period of 12.503 days. The periodograms from the TESS and WASP observations are shown in Figure 4, and the binned TESS light curve, phase-folded to the measured rotation period, is shown in Figure 4. As a check on the Lomb-Scargle periods, we also fit the full TESS light curve using a Gaussian process with a quasi-periodic kernel. This yields a period consistent with the Lomb-Scargle results, days. We adopt a weighted average of rotation periods from individual seasons, days.
Finally, we caution that we are observing the rotation period at the latitude of the active regions. The unknown strength of differential rotation and current spot latitudes contribute additional (systematic) uncertainties if interpreting the observed rotation period as the equatorial rotation period. If differential rotation in TOI-712 is similar to that of the Sun, then the true equatorial rotation period could be different by or more.
We adopt the activity-rotation-age relation as described in Mamajek & Hillenbrand (2008), to estimate the age of TOI-712. In particular, we use the equation:
| (1) |
where is the rotational period of the star, in days, is the stellar age in Myr, is the color index, and are gyrochronolgy constants, is the ’color singularity‘, and is the time-dependent power law. Using the stellar rotation period above, and , we estimate a gyrochronological age of Myr. However, we caution that the formal uncertainty is quite likely underestimated. First, systematic errors may affect the determination of , as described above. More importantly, TOI-712 is outside of the color range () in which the Mamajek & Hillenbrand (2008) relation is well calibrated, as their sample consisted of primarily Sun-like stars and TOI-712 is relatively red. More recent investigations of the gyrochronology of K dwarfs, enabled by precise photometry of adolescent stars from K2 and TESS, suggest that in contrast to the G dwarfs, K dwarfs experience an epoch of stalled spin-down. While it is true that K dwarfs are expected to have rotation periods similar to TOI-712 at 500 Myr, they may also have the same rotation period at twice that age (Curtis et al., 2019a). As a result, from its rotation alone, we can only estimate the age of TOI-712 to be between about and Gyr.
3.2.2 Comparison with stellar populations
Since recent work has identified many new members of known stellar groups, we explore whether TOI-712 might belong to a known association. We use the online tool BANYAN (Gagné et al., 2018), to assess possible membership in known groups, but the result suggests that it is not part of any previously known groups.
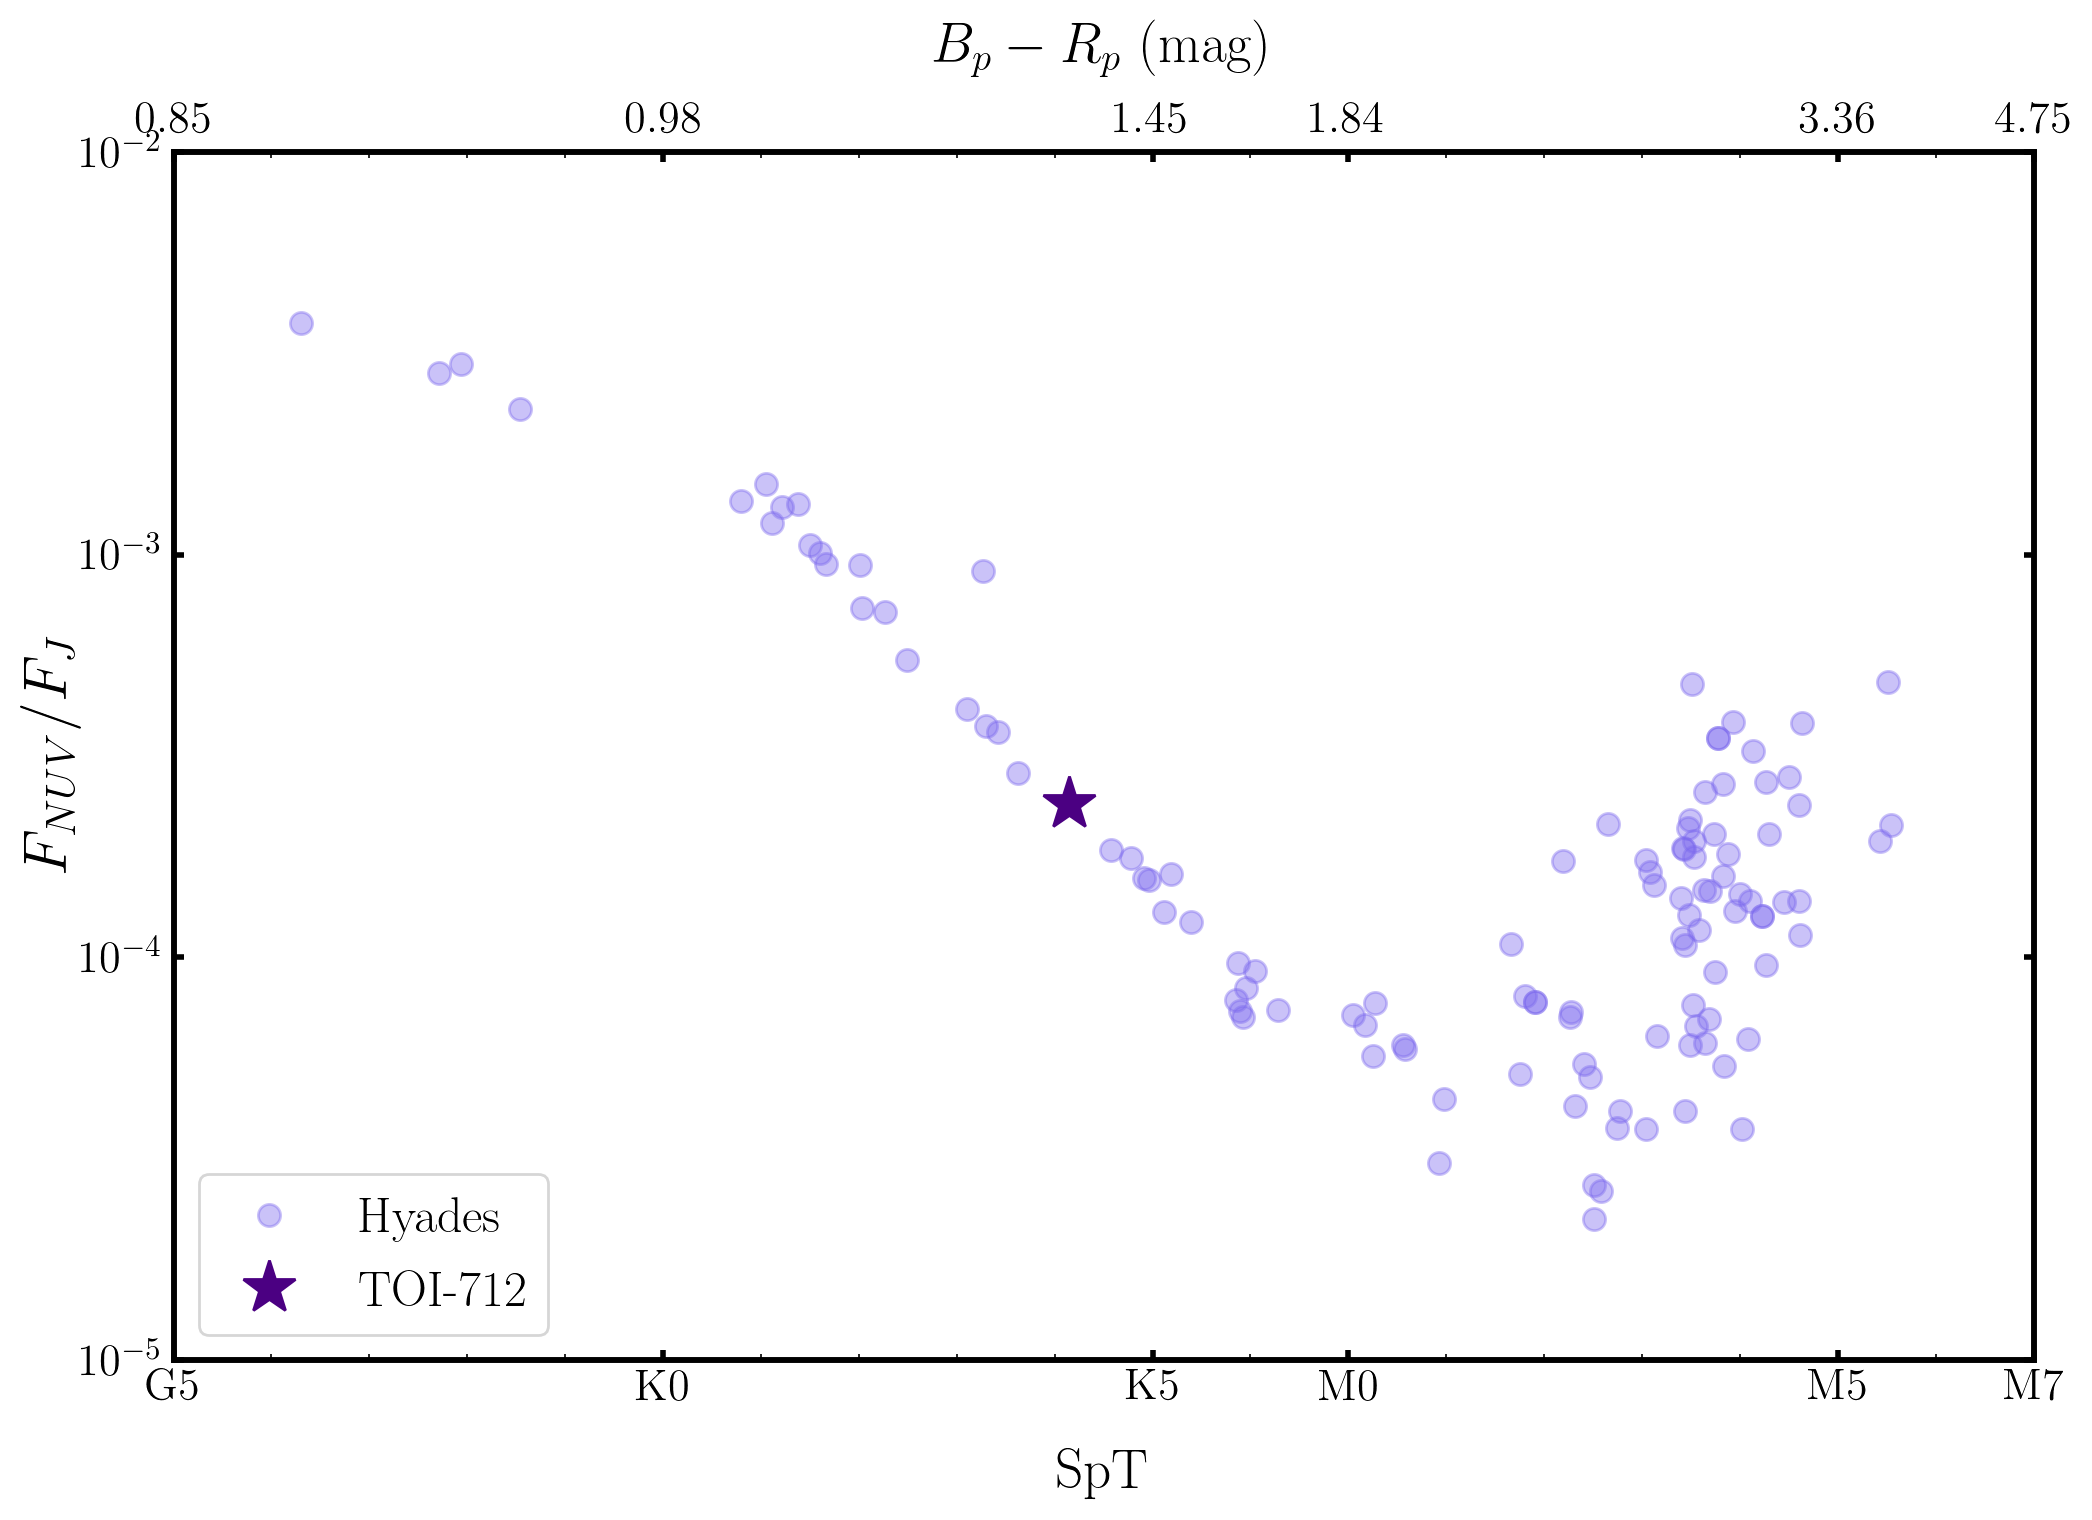
Similarly, there are likely many sparse groups that are currently unrecognized, but the large volume of public data (from Gaia, TESS, broadband photometric surveys, and spectroscopic surveys) makes possible a targeted search for comoving, coeval companions to a star of interest. We searched for evidence of a previously unknown comoving population of stars via Friend Finder555https://github.com/adamkraus/Comove. Within 25 pc of TOI-712, we find only two stars with similar kinematics, but this is likely no more than would be expected by chance. TOI-712 has either escaped from its birth environment or formed in such a small environment that almost none of its stellar siblings remain within parsecs. While no convincing kinematic matches were found, the age can also be constrained by the precise UV photometry provided by GALEX (e.g., Shkolnik et al., 2011; Findeisen & Hillenbrand, 2010). Friend Finder illustrates that the near-UV (NUV) flux of TOI-712 is consistent with the NUV sequence of the stars populating the Hyades cluster (see Figure 5), which has a well constrained age of 625 Myr (see, e.g., Perryman et al., 1998; Martín et al., 2018) . Older stars should exhibit lower levels of NUV flux. This provides supporting evidence that the age of TOI-712 is consistent with the age of the Hyades, though if NUV flux and rotation evolve together, it is possible that NUV flux would plateau while spin-down stalls. If that were the case, then the NUV flux of Hyades K dwarfs could be similar to that of somewhat older stars. Richey-Yowell et al. (2019) do show that the NUV flux is inversely related to stellar age in K dwarfs, but that study included no stars between Hyades age and field stars. NUV sequences in slightly older clusters like NGC 752 (1.3 Gyr; Agüeros et al., 2018) and Ruprecht 147 (2.7 Gyr; e.g., Torres et al., 2020; Curtis et al., 2020) might help resolve the age of TOI-712, but because of their distance, GALEX provides only non-informative upper limits for most of the K dwarf members.
Given the age ambiguity associated with the stalled spin-down of K dwarfs, we ultimately adopt an age of Myr and bounded between 0.3 and 1.3 Gyr, as determined by the global fit described in Section 4.
3.2.3 The stellar flare rate of TOI-712
TOI-712 was observed with 20-second cadence in sector 27, and during that time a flare was observed at time BTJD 2054.672 with a maximum flux excursion of %. Though it lasted only three 20-second cadences, two independent flare-finding algorithms (Medina et al. 2020; Feinstein et al. 2020a, b) identify it as a high-probability flare. We calculate an energy in the TESS bandpass of ergs, and we derive a flare rate of approximately flares per day above an energy of ergs. While there are no well calibrated flare rates for adolescent K dwarfs, this flare rate falls slightly below the observed rates for younger K dwarfs (Feinstein et al., 2020b). This does not resolve the gyrochronology age degeneracy, but the presence of any significant flares further supports that this is an adolescent star.
Finally, we note that this flare lasted only 1 minute, which implies that there may be flares in the two-minute data that last only one cadence and appear as outliers of a few percent or less. This should not be surprising, as many previous studies with TESS and Kepler data have focused on active stars with flares lasting many minutes (Günther et al., 2020; Medina et al., 2020; Feinstein et al., 2020b) or longer (e.g., Davenport, 2016), but there is an indication that flare energies in the optical correlate with flare duration (Maehara et al., 2015). While it is beyond the scope of this work, TESS data could offer a means to calibrate flare rates of adolescent stars, which may be prone to short duration and low energy flares that appear as a single modest outlier in two-minute cadence. Distinguishing single-cadence flares from instrumental effects is difficult, but a statistical approach may be feasible, particularly given the large number of TESS light curves of both young and old stars.
| TIC 150151262 | |||
| Other | TYC 8905-00810-1 | ||
| identifiers | 2MASS J06114467-6549335 | ||
| WISE J061144.66-654933.1 | |||
| Parameter | Description | Value | Source |
| R.A. | 06:11:44.6729007687 | 1 | |
| decl. | -65:49:33.499607825 | 1 | |
| TESS mag | 9.9059 0.006 | 6 | |
| Tycho mag | 12.10 0.20 | 2 | |
| Tycho mag | 10.84 0.07 | 2 | |
| aafootnotemark: | APASS Johnson mag | 11.701 0.025 | 3 |
| APASS Johnson mag | 10.892 0.016 | 3 | |
| Gaia mag | 10.5785 0.0006 | 1 | |
| APASS Sloan mag | 11.622 **0.000 | 3 | |
| APASS Sloan mag | 10.526 **0.000 | 3 | |
| APASS Sloan mag | 10.182 0.009 | 3 | |
| 2MASS mag | 8.984 0.022 | 4 | |
| 2MASS mag | 8.409 0.042 | 4 | |
| 2MASS mag | 8.313 0.023 | 4 | |
| WISE1 | WISE1 mag | 8.233 0.023 | 5 |
| WISE2 | WISE2 mag | 8.293 0.020 | 5 |
| WISE3 | WISE3 mag | 8.219 0.019 | 5 |
| WISE4 | WISE4 mag | 8.241 0.127 | 5 |
| PM in R.A. (mas yr-1) | -2.929 0.047 | 1 | |
| PM in decl. (mas yr-1) | 31.003 0.044 | 1 | |
| Parallax (mas) | 17.0297 0.0230 | 1 | |
| Systemic RV ( km s-1) | 3.16 0.34 | 1 | |
4 EXOFASTv2 Global Fit
To derive the properties of TOI-712 and its planets, we fit the system with the exoplanet modeling software EXOFASTv2 (Eastman et al., 2019). We used all available 2-minute photometric data from TESS and the ground-based light curves described in Section 2.2 in conjunction with broadband flux measurements (Table 3), the Gaia DR2 parallax, spectroscopic stellar parameters, and the MESA Isochrones and Stellar Tracks (MIST) stellar isochrones (Paxton et al., 2011, 2013, 2015; Choi et al., 2016; Dotter, 2016a). In our Markov Chain Monte Carlo (MCMC) fit, we set priors on the stellar metallicity derived from the CHIRON spectra, the parallax measured by Gaia, and the upper limit on extinction from the dust maps of Schlegel et al. (1998) and Schlafly & Finkbeiner (2011). At each step in the MCMC, the quadratic limb-darkening coefficients are interpolated from the values tabulated by Claret (2017). Following Ford (2006), we require the Gelman-Rubin statistic of all parameters to be and the number of independent draws to exceed 1000 to indicate convergence.
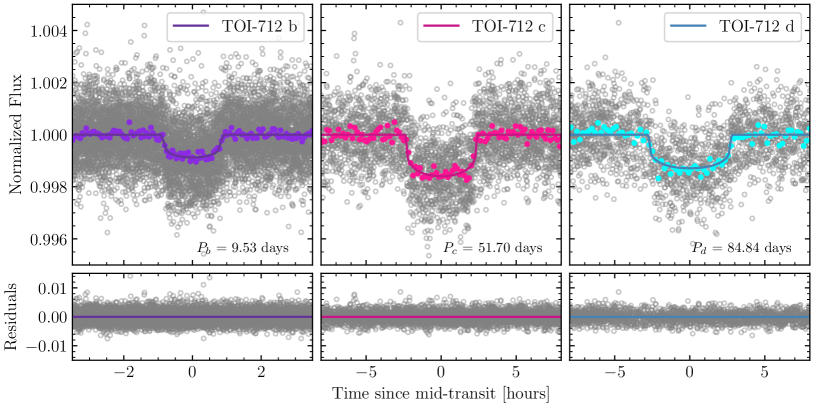
The results of our global fit are reported in Table 4, and the best-fit models are plotted with the phase-folded light curves in Figure 1. Notably, the radii ( , , ) suggest that all three planets are mini-Neptunes, likely to possess significant volatile envelopes. The eccentricities of the outer planets are relatively low, and while the eccentricity of TOI-712 b is not inconsistent with zero, it is poorly constrained. The medians of the marginalized posteriors are reported in Table 4, but the eccentricity posterior for planet b is broad and non-Gaussian. This is important to note, because while we present further analysis based on the broad EXOFASTv2 posteriors, our expectation based on Kepler multi-planet systems is that all three planets will have eccentricities much closer to zero than the medians of the posteriors reported in Table 4 (see, e.g., Moorhead et al., 2011; Van Eylen & Albrecht, 2015; He et al., 2020). While multi-planet systems can exhibit transit time variations due to mutual dynamical interactions, the EXOFASTv2 transit times are consistent with a linear ephemeris.
4.1 Validation of the TOI-712 planets
In the previous section, we presented a model of the planetary system orbiting TOI-712, but have not formally validated the signals as bona fide planets. In particular, we note that while we detect the transits of TOI-712 b and c from the ground in small apertures that localize the transit signal to within a few arcseconds of TOI-712, there is no ground-based transit detection of TOI-712 d. Given the large TESS pixels, the signal could potentially be produced by a faint, nearby eclipsing binary (NEB). Gaia detects 25 stars within 2 pixels (), though the centroid analysis made available in the SPOC Data Validation report rules out NEBs more distant than . The brightest of the remaining stars is 8.1 magnitudes fainter in the TESS bandpass, and therefore contributes a flux fraction of only 0.0006 (0.6 mmag). The transit of TOI-712 d is deeper than 1 mmag, so none of the nearby stars can be responsible for the transit signal. The high resolution imaging and Gaia astrometry discussed in Section 2.4 rule out nearly all stellar companions within 1 arcsecond, and the CHIRON RVs exclude many close, bound eclipsing binaries that would have accelerated TOI-712 during the 600-day observing timespan.
Previous analysis has shown that the overwhelming majority of Kepler candidates in multi-planet systems are real planets, and moreover that systems with more than 2 candidates are even more likely to be real (e.g., Latham et al., 2011; Lissauer et al., 2012). The same cannot be assumed for TESS, mainly because of the increased potential for NEBs due to its large pixels and, in some cases, crowded fields. However, our follow-up observations have excluded the presence of contaminating eclipsing binaries even more confidently than is the case for Kepler candidates. As a result, we consider TOI-712 b, c, and d to be bona fide planets.
| Parameter | Description (Units) | Values | ||
|---|---|---|---|---|
| Stellar Parameters | ||||
| Mass () | ||||
| Radius () | ||||
| Luminosity () | ||||
| Density (cgs) | ||||
| Surface gravity (cgs) | ||||
| Effective Temperature (K) | ||||
| Metallicity (dex) | ||||
| Age (Gyr) | ||||
| Equal Evolutionary Phase1 | ||||
| V-band extinction (mag) | ||||
| SED photometry error scaling | ||||
| Parallax (mas) | ||||
| Distance (pc) | ||||
| Planetary Parameters | b | c | d | |
| Period (days) | ||||
| Radius () | ||||
| Radius of planet in stellar radii | ||||
| Transit depth (fraction) | ||||
| Time of conjunction2 () | ||||
| Optimal conjunction Time3 () | ||||
| Time of Periastron () | ||||
| Time of eclipse () | ||||
| Semi-major axis (AU) | ||||
| Inclination (Degrees) | ||||
| Transit Impact parameter | ||||
| Eccentricity | ||||
| Argument of Periastron (Degrees) | ||||
| Ingress/egress transit duration (minutes) | ||||
| Total transit duration (hours) | ||||
| FWHM transit duration (hours) | ||||
| Incident Flux (109 erg s-1 cm-2) | ||||
| Equilibrium temperature4 (K) | ||||
| Predicted mass5 () | ||||
| Predicted mass ratio5 | ||||
| Predicted RV semi-amplitude5 (m/s) | ||||
| Predicted density5 (cgs) | ||||
| Predicted surface gravity5 | ||||
| Wavelength Parameters | TESS | |||
| linear limb-darkening coeff | ||||
| quadratic limb-darkening coeff | ||||
| Transit Parameters | TESS | |||
| Added Variance | ||||
| Baseline flux | ||||
Note—
1 Corresponds to static points in a star’s evolutionary history. See §2 in Dotter (2016b).
2 Though the time of minimum projected separation is a more correct ”transit time, time of conjunction is commonly reported as the transit time, and is in practice identical in all but the most extreme combinations of eccentricity and viewing angles (see Eastman et al., 2019).
3 Optimal time of conjunction minimizes the covariance between and Period.
4 Assumes no albedo and perfect redistribution, making this identical to a surface-averaged irradiation temperature.
5 Uses measured radius and estimated mass from Chen & Kipping (2017).
4.2 TOI-712.05
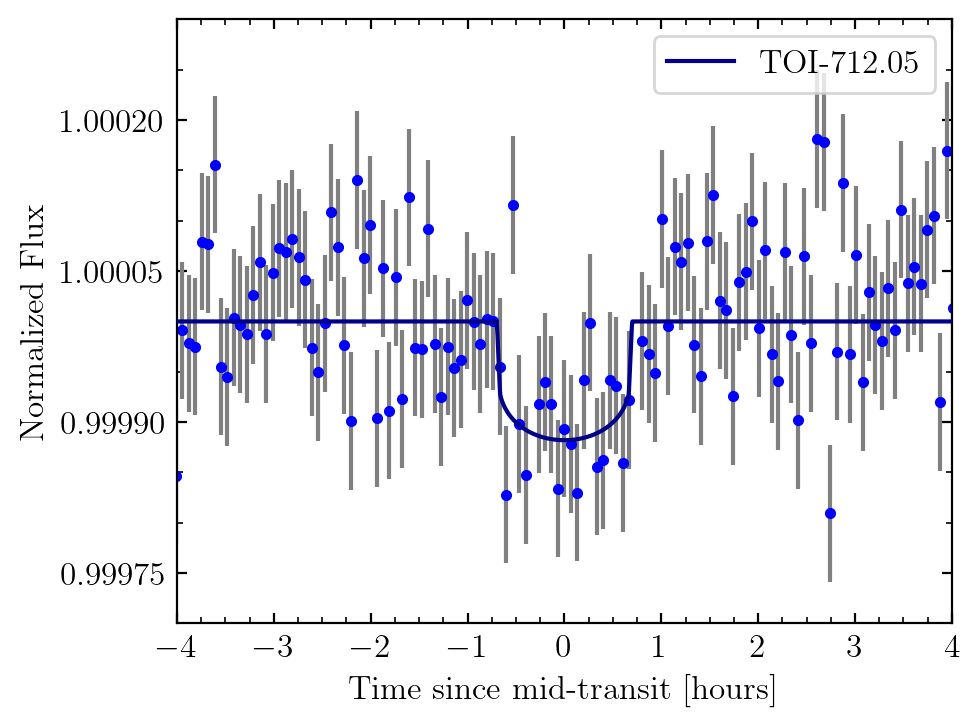
Upon subtracting the best-fit EXOFASTv2 three planet model from the TESS light curve, we perform a Transit Least Squares (TLS, Hippke & Heller, 2019) analysis on the residuals to search for the signature of any additional transiting planets. TLS reveals a 4.32-day candidate signal. We refer to this signal as TOI-712.05. A new EXOFASTv2 fit including all four candidates converged, with no change to the stellar parameters or properties of the other three candidates. The derived properties of this candidate are shown in Table Table 5, and the phase folded TESS light curve is shown in Figure 6. If real, TOI-712.05 would be slightly smaller than the Earth, .
We present the results for TOI-712.05 separately because we have less confidence that it is real. Notably, the signal is not clearly present in the full frame images (FFIs). While this could be due to smearing of the short-duration transit in the 30- and 10-minute cadence data, it may also be due to a difference in the apertures used to produce the FFI and 2-minute light curves. If this were the case, it could suggest that the signal originates on a nearby star at the edge of the 2-minute aperture. To test this possibility, we ran two experiments. First, we extracted FFI light curves for each of the stars within and folded them at the ephemeris of TOI-712.05. None showed signs of an eclipse that would cause the observed signal. Because the sensitivity of the FFIs to a shallow, short duration event may be compromised we also extracted 2-minute light curves using different apertures.
| Parameter | Description (Units) | Values |
|---|---|---|
| Period (days) | ||
| Radius () | ||
| Radius of planet in stellar radii | ||
| Planet-to-star area ratio | ||
| Transit depth in TESS band | ||
| Time of conjunction (BJD) | ||
| Semi-major axis (AU) | ||
| Semi-major axis in stellar radii | ||
| Inclination (Degrees) | ||
| Transit impact parameter | ||
| Eccentricity | 0.0 (fixed) | |
| Argument of Periastron (Degrees) | 90.0 (fixed) | |
| Total transit duration (hours) |
Planetary candidates that are released as TOIs also undergo ephemeris matching against all other signals detected by the pipeline, in order to test for a false positive introduced by a nearby transit-like signal. TOI-712.05 was not released as a TOI, so we performed this test using all signals detected by MIT’s Quick Look Pipeline (QLP; Huang et al., 2020a, b), and we did not find any ephemeris matches.
It is also possible that SPOC introduced the transit signal while processing the light curve since TOI-712 is relatively active. As a check, we ran TLS on the unprocessed SAP light curve to see if the transit is still present. After flattening, and removing the transits from the three planets, the phase folded SAP light curve does show the transit signal for TOI-712.05.
A final concern is that the signal could be introduced by stellar activity. If that were the case, we might expect that the signal would not appear consistent in time due to evolution of the stellar signal, which is apparent by eye in the unflattened TESS light curve. We tested this by comparing the signal in Year 1 to the signal in Year 3. To within the uncertainties, the two are consistent, as would be expected for a transiting object.
While TOI-712.05 passed the above tests, it remains a low signal-to-noise event, so we present it here as a candidate planet. Its planetary nature may be solidified as the signal strength increases in future TESS extended missions, or perhaps by additional analysis of existing data.
5 Habitable Zone and Venus Zone
As described above, the three detected planets in the system are all mini-Neptune in terms of size. While they are too large to expect Earth-like compositions, their locations with respect to the Habitable Zone (HZ) and the Venus Zone (VZ) can motivate further analysis and future observations. The HZ boundaries have been previously calculated from Earth-based climate models that determine the radiative balance conditions for retaining surface liquid water Kasting et al. (1993); Kopparapu et al. (2013, 2014). The conservative HZ (CHZ) is defined by the runaway greenhouse limit at the inner boundary, and the maximum CO2 greenhouse limit at the outer boundary (Kane et al., 2016). The optimistic HZ (OHZ) is an extension to the conservative HZ based on empirical evidence regarding retention of surface liquid water on Venus (inner boundary) and Mars (outer boundary) during their evolutionary histories (Kane et al., 2016). The location of the HZ boundaries are sensitively related to the stellar parameters (Kane, 2014), provided in Table 4. Adopting the methodology of Kopparapu et al. (2014), we calculate the CHZ boundaries for the TOI-712 system as 0.436–0.802 au, and the OHZ boundaries as 0.344–0.846 au. The HZ regions are represented in Figure 7, which shows a top-down view of the TOI-712 system. Because the eccentricities are poorly constrained, we plot circular orbits, though note that modest eccentricities are not ruled out. TOI-712 d lies at the extreme inner edge of the OHZ.
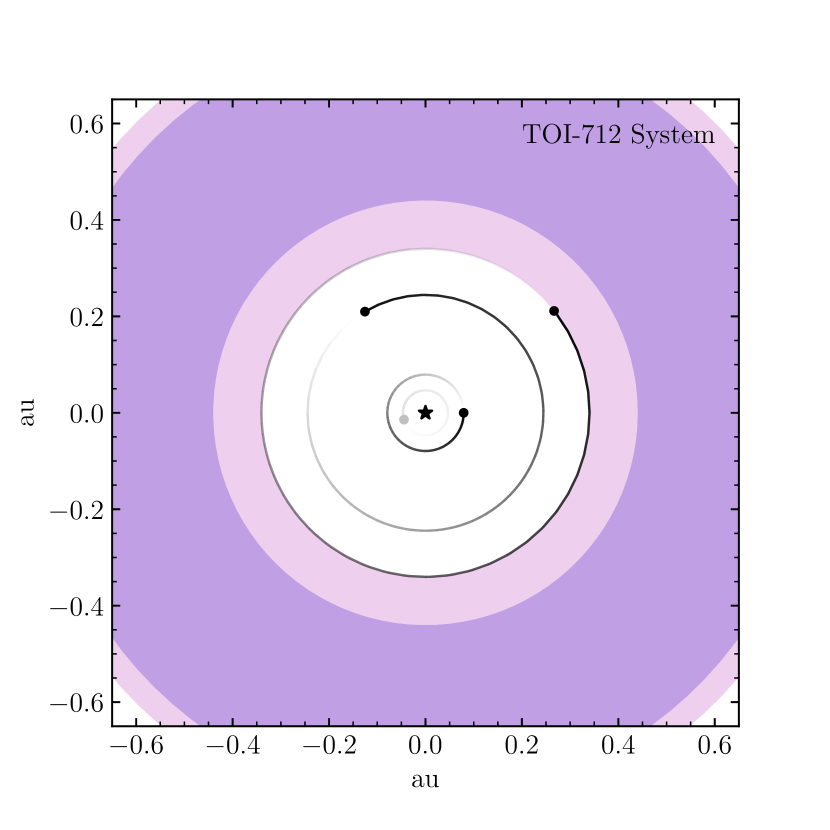
Though none of the TOI-712 planets lie unambiguously within the HZ, they do lie within the VZ, defined as the region interior to the runaway greenhouse limit and exterior to the atmospheric mass loss limit (Kane et al., 2014). Such planets provide exceptionally useful targets for atmospheric characterization, both individually and in the context of describing the processes that occur within the VZ (Kempton et al., 2018; Ostberg & Kane, 2019). The TOI-712 planets are unlikely to have rocky surfaces, but their atmospheric response to the local radiation environment can provide useful information regarding the processes driving atmospheric erosion. Moreover, because the planetary system extends (at least) to the inner edge of the HZ, their presence can place dynamical constraints on the existence of exterior planets that may lie within the HZ.
6 Dynamical analysis
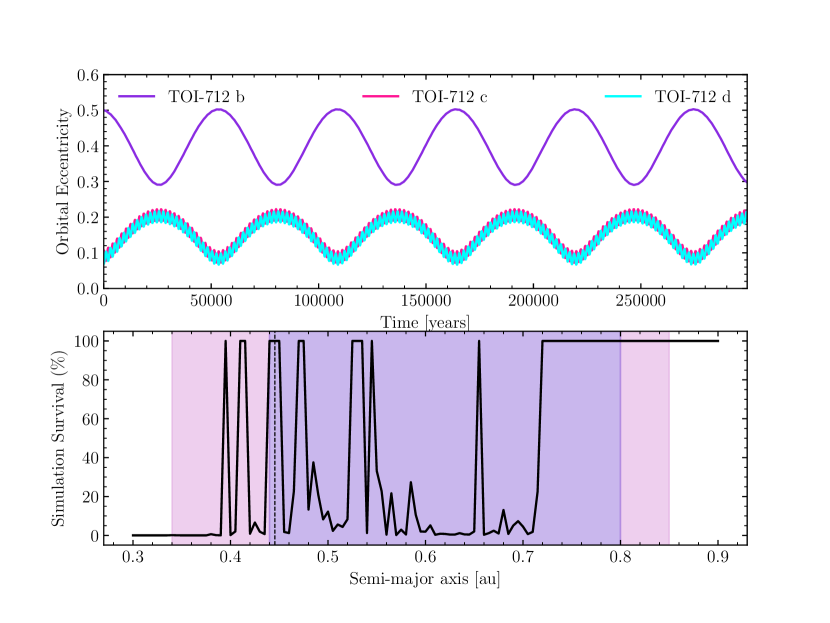
The orbital parameters of the TOI-712 planets (see Table 4) provide an opportunity to examine the orbital dynamics that exists within the system, and the dependence on their proximity to each other. Such dynamical interactions are particularly important for assessing eccentricity constraints for the known planets, and for placing dynamical limits on the presence of other potential planets in the system (Gladman, 1993; Chambers et al., 1996; Hadden & Lithwick, 2018). Sampling from the posteriors of the EXOFASTv2 fit, we performed N-body integrations using the Mercury Integrator Package (Chambers, 1999) and adopted a methodology similar to that described by Kane & Raymond (2014); Kane (2016, 2019). We used a hybrid symplectic/Bulirsch-Stoer integrator with a Jacobi coordinate system (Wisdom & Holman, 1991; Wisdom, 2006), and adopted a time resolution of 0.2 days to adequately sample the orbit of the inner planet. Each of the simulations were executed for a duration of simulation years.
Shown in the top panel of Figure 8 is a 300,000 year segment of the results from a simulation initialized with eccentricities near the median of the posteriors. While the true eccentricities may be closer to zero, the system remains stable even for relatively high eccentricities, and this simulation illustrates some of the mutual interactions experienced by the planets. The outer planets (c and d), which lie near, but not within, the 8:5 mean motion resonance (MMR), exhibit high frequency angular momentum exchanges that cause frequent fluctuations in their eccentricities. In turn, planets c and d interact with the innermost known planet (b), resulting in high amplitude oscillations in their respective eccentricities with a period of 50,000 years. These complex dynamical interactions raise the question of whether the known planets may exclude potential terrestrial planets from residing within the HZ. To test for this, we conducted an exhaustive suite of year dynamical simulations using the same methodology as described above—with initial conditions drawn randomly from the EXOFASTv2 posteriors—but with the insertion of a hypothetical Earth-mass planet located in the semi-major axis range of 0.3–0.9 au, in steps of 0.05 au. The simulations were allowed to run until either the simulation completed, or planet-planet interactions caused the Earth-mass planet to be swallowed by the star or ejected from the system. The bottom panel of Figure 8 shows the results from this simulation in terms of the percentage of the simulations that survived the full years as a function of the semi-major axis for the test locations of the Earth-mass planet, indicated by the solid line. Orbits beyond au are robustly stable, and some planets closer than 0.7 au survive near MMRs. Since there are three interior planets, the locations of MMR are numerous and complicated, but we highlight one example of a resonance stable location corresponding to the 3:2 MMR of an HZ planet with planet d.
7 Discussion
7.1 TOI-712 among known planets
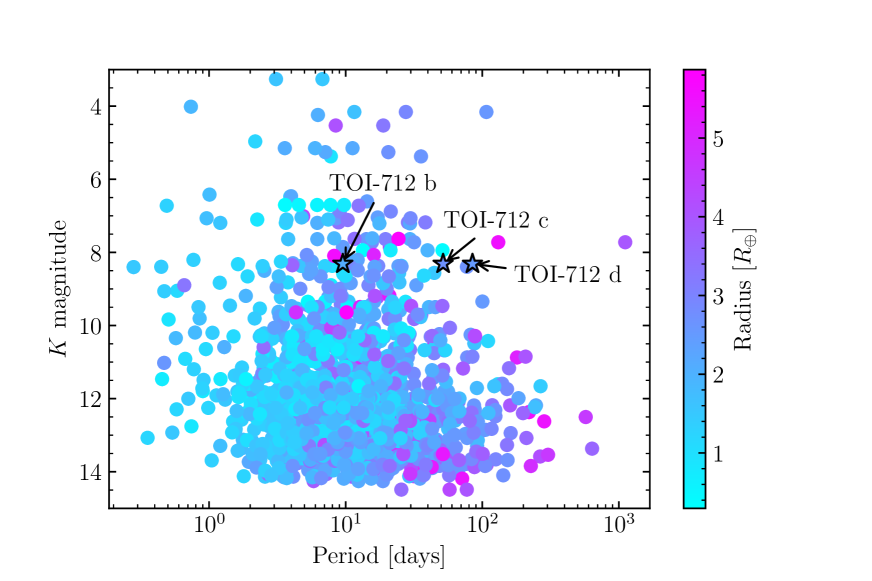
Multi-planet systems provide a laboratory for comparative studies of exoplanets in an environment controlled for stellar properties and age, and the ability to leverage dynamical interactions to constrain planetary masses and orbital architectures. This avenue for characterization is especially important when other methods like radial velocity monitoring are difficult—for example, due to stellar activity, faint host stars, or small or long-period planets that induce low-amplitude orbital motion. Because short-period planets are more likely to transit, relatively few systems include long-period planets, and most that do were discovered by Kepler orbiting faint stars. As a result, TOI-712 stands out as one of the brightest long-period planetary systems currently known (see Figure 9). While many mini-Neptunes transit bright stars, most reside close to their star with high equilibrium temperatures, so TOI-712 represents an opportunity to study temperate mini-Neptunes, which are likely to have experienced different formation environments and evolutionary histories than their short-period counterparts.
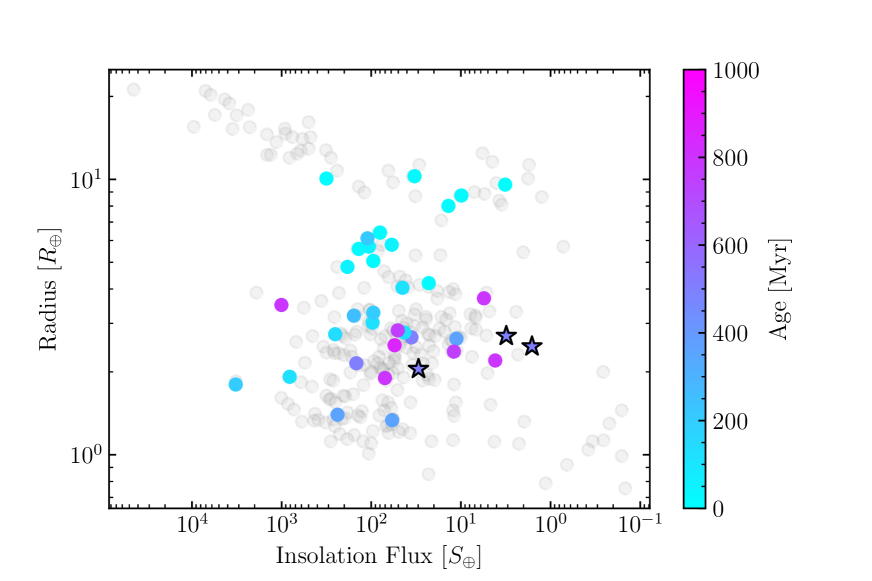
Previous investigations of young planets have suggested that they tend have larger radii than their older counterparts (e.g., Mann et al., 2017; David et al., 2021), which is qualitatively consistent with atmospheric mass loss, but the details of the process and the timescale over which it occurs are not precisely known. Moreover, most known young planets have relatively short orbital periods for which photoevaporation is likely an important process (e.g., Owen & Wu, 2013; Jin & Mordasini, 2018), so whether a mechanism like core-powered mass loss (Ginzburg et al., 2018) drives significant atmospheric evolution in temperate planets is an open question. We illustrate in Figure 10 that the radii of the TOI-712 planets are smaller than the youngest planets, but there are no young planets with insolation fluxes similar to the outer TOI-712 planets.
For TOI-712, it is unclear if the planets are small because they have experienced significant atmospheric loss, or because they simply formed smaller than the young planets discovered to date. The first possibility was discussed in Section 3.2; if they are older than 1 Gyr, their small sizes may not be a powerful constraint. On the other hand, the outer planets should not experience significant mass loss from photoevaporation, and David et al. (2021) show evidence for evolution in the radius gap as late as 2 to 3 Gyr, so even if the planets are Gyr old, core-powered mass loss may operate on long enough timescales that they can provide constraints on the process, particularly at long periods where fewer planets are known. Even at short periods, where the radius valley is well characterized, TOI-712 b is of note. At , it sits near the edge of the radius valley for its size and incident flux. If the timescale for core-powered mass loss is as long as 2 Gyr or more, it could be losing atmosphere now and ultimately be destined to become a rocky world. Future advances in understanding K dwarf gyrochronology and activity may provide a more precise age and a more definitive conclusion about the evolution of these planets.
If TOI-712 is as young as gyrochronology suggests, then the small planet sizes are more likely to reflect the formation process rather than (or in addition to) the mass loss history. In particular, TOI-712 c and d orbit at greater distances from their host star than other known young planets, and may differ in composition. Under the assumption that mini Neptunes form in situ, local conditions in the protoplanetary disk during formation would differ for the long-period TOI-712 planets, the outer of which resides at the edge of the habitable zone. More data, such as transmission spectroscopy, could shed light on the compositional differences between hot and temperate planets. While the brightest examples of such planets are statistically likely to be old, adolescent examples like TOI-712 c and d, for which core-powered mass loss may not have had time to strip significant atmosphere, could provide complementary information about formation by probing primordial compositions.
7.2 Future characterization of TOI-712
As discussed above, young planets—including those orbiting TOI-712—open avenues for observational constraints on the dynamical and physical evolution of planetary systems. While young stars can be challenging to observe, future observations of the TOI-712 system remain promising.
Our modest precision RVs suggest some variation beyond the internal uncertainty estimates, which is consistent with expectations for an adolescent star with rotating surface features. Given the rotation ( km s-1) and the amplitude of photometric modulation (%), we estimate there should be tens of meters per second RV variation from stellar surface features (see, e.g., Saar & Donahue, 1997). Since the predicted RV amplitudes induced by the planets are only a few meters per second (see Table 4), attempts to measure the planet masses with stabilized spectrographs would be difficult without significant advances in stellar activity modeling.
Dynamical interactions between the planets, if detected via transit timing variations or transit duration variations, could help determine their masses and eccentricities. There is currently no evidence for transit timing variations, but TOI-712 will be observed by TESS in future extended missions, providing longer baselines over which to measure TTVs. Moreover, the signal-to-noise ratio (SNR) of the TOI-712.05 transit should increase if it is a real companion, and we can therefore more confidently confirm or refute its existence. Similarly, additional transiting planets in the system may become apparent with the inclusion of more data. In particular, we showed in Section 5 that there are dynamically stable orbits for small planets in the habitable zone of TOI-712. We also know that systems of small planets tend to be packed, so it would not be surprising to find an additional planet between TOI-712 b and c ( days). While planets larger than TOI-712 b () would have likely been detected already, smaller planets may be revealed in future TESS data. Better knowledge of the system architecture and improved measurements of orbital properties will make dynamical modeling more powerful, which also feeds back into improved planetary properties.
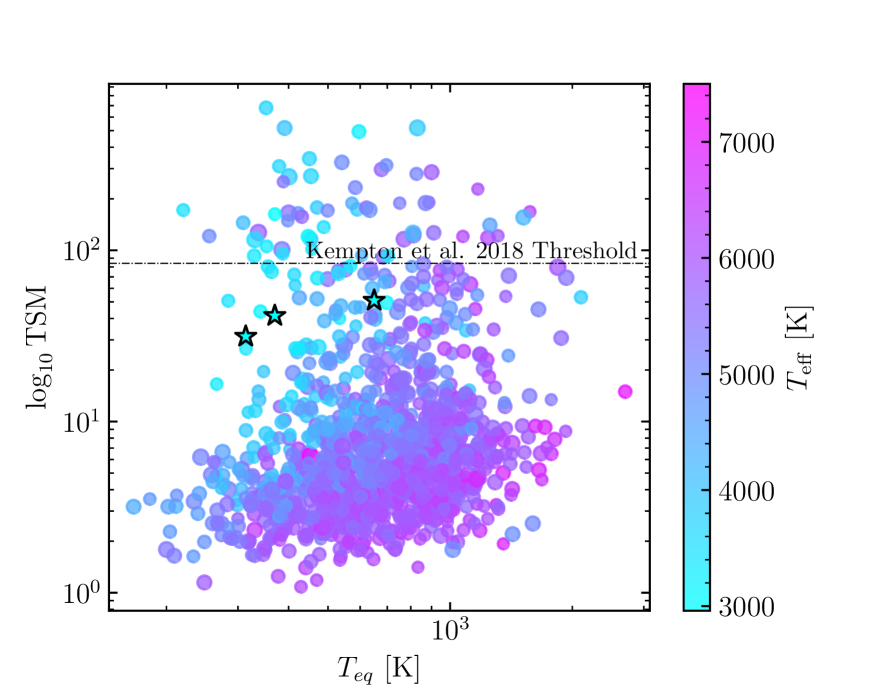
As discussed in Section 7.1, the atmospheric composition of the outer planets could inform our understanding of the formation of temperate mini-Neptunes. We note that TOI-712 is located from the Southern Ecliptic Pole, in the JWST continuous viewing zone, and it stands out as one of the brightest stars hosting long-period transiting planets (Figure 9). The star is relatively small, and as a result, transmission spectroscopy of the planets may be possible. Following Kempton et al. (2018), we calculate the Transmission Spectroscopy Metric (TSM) of the planets to assess the prospect for transmission spectroscopy with JWST. We find , , and . Based on expected yields from TESS, Kempton et al. (2018) suggested that a survey with JWST should adopt a TSM threshold of 92 for planets of this size. However, this threshold is purely based on the SNR and ignores the outsized scientific value of some individual planets that happen to have lower expected SNRs. TOI-712 c and d are examples of planets that would not meet the cutoff for such a survey, but may still be worth observing. Figure 11 shows the TSM values of transiting mini-Neptunes () as a function of equilibrium temperature and stellar effective temperature. It is clear that although the planets lie below the TSM threshold for the predicted TESS yield, they stand out among the real sample as two of the best temperate mini-Neptunes. When also considering the age of the system, these planets become more scientifically valuable and may form the basis for a comparative study of temperate planets as a function of age.
8 Conclusion
Young planetary systems offer a glimpse into planetary evolution, most of which occurs within the first billion years after formation. In this paper, we presented the discovery of three planets transiting the adolescent K dwarf TOI-712. We determine the stellar age from the TESS rotation period, but because adolescent K dwarfs experience stalled spin-down, can only determine its age to be in the range of Myr to Gyr. There is no evidence that it is a part of a moving group, so we conclude that TOI-712 is an adolescent field star.
Our global analysis determined precise planetary radii (, , ), indicating that all three planets likely possess significant volatile envelopes. We identify an additional 4.32-day rocky planet candidate (TOI-712.05; ), but do not claim it as a validated planet due to its low SNR. TOI-712 d orbits at the inner edge of the optimistic habitable zone, making it the first such planet orbiting a young star. As a result of their cool temperatures and relatively bright host star, TOI-712 c and d represent promising targets to study the evolution of temperate small planets, for which thermal mass loss cannot shape planetary atmospheres.
Dynamical simulations of the system reveal it to be stable and find that small planets in the conservative habitable zone could also survive. Future TESS observations may be sensitive to such objects, if they exist, and can confirm or refute the small inner rocky planet candidate.
Acknowledgements
We thank Adina Feinstein for helpful discussion regarding stellar flares in TESS data.
SV and SNQ acknowledge support from the TESS Guest Investigator Program G03268 and NASA grant number 80NSSC21K1056. MNG acknowledges support from the European Space Agency (ESA) as an ESA Research Fellow.
This work makes use of observations from the LCOGT network. Part of the LCOGT telescope time was granted by NOIRLab through the Mid-Scale Innovations Program (MSIP). MSIP is funded by NSF.
Some of the observations in the paper made use of the High-Resolution Imaging instrument Zorro obtained under Gemini LLP Proposal Number: GN/S-2021A-LP-105. Zorro was funded by the NASA Exoplanet Exploration Program and built at the NASA Ames Research Center by Steve B. Howell, Nic Scott, Elliott P. Horch, and Emmett Quigley. Zorro was mounted on the Gemini North (and/or South) telescope of the international Gemini Observatory, a program of NSF’s OIR Lab, which is managed by the Association of Universities for Research in Astronomy (AURA) under a cooperative agreement with the National Science Foundation. on behalf of the Gemini partnership: the National Science Foundation (United States), National Research Council (Canada), Agencia Nacional de Investigación y Desarrollo (Chile), Ministerio de Ciencia, Tecnología e Innovación (Argentina), Ministério da Ciência, Tecnologia, Inovaçõese Comunicações (Brazil), and Korea Astronomy and Space Science Institute (Republic of Korea).
This research received funding from the European Research Council (ERC) under the European Union’s Horizon 2020 research and innovation programme (grant agreement n∘ 803193/BEBOP), and from the Science and Technology Facilities Council (STFC; grant n∘ ST/S00193X/1).
This work makes use of observations from the ASTEP telescope. ASTEP benefited from the support of the French and Italian polar agencies IPEV and PNRA in the framework of the Concordia station program.
Funding for the TESS mission is provided by NASA’s Science Mission directorate. We acknowledge the use of TESS public data from pipelines at the TESS Science Office and at the TESS Science Processing Operations Center. Resources supporting this work were provided by the NASA High-End Computing (HEC) Program through the NASA Advanced Supercomputing (NAS) Division at Ames Research Center for the production of the SPOC data products. This research has made use of the Exoplanet Follow-up Observation Program website, which is operated by the California Institute of Technology, under contract with the National Aeronautics and Space Administration under the Exoplanet Exploration Program. This paper includes data collected by the TESS mission, which are publicly available from the Mikulski Archive for Space Telescopes (MAST).
This work has made use of data from the European Space Agency (ESA) mission Gaia (https://www.cosmos.esa.int/gaia), processed by the Gaia Data Processing and Analysis Consortium (DPAC, https: //www.cosmos.esa.int/web/gaia/dpac/consortium). Funding for the DPAC has been provided by national institutions, in particular the institutions participating in the Gaia Multilateral Agreement.
References
- Abe et al. (2013) Abe, L., Gonçalves, I., Agabi, A., et al. 2013, A&A, 553, A49, doi: 10.1051/0004-6361/201220351
- Agüeros et al. (2018) Agüeros, M. A., Bowsher, E. C., Bochanski, J. J., et al. 2018, ApJ, 862, 33, doi: 10.3847/1538-4357/aac6ed
- Astropy Collaboration et al. (2013) Astropy Collaboration, Robitaille, T. P., Tollerud, E. J., et al. 2013, A&A, 558, A33, doi: 10.1051/0004-6361/201322068
- Ballard & Johnson (2016) Ballard, S., & Johnson, J. A. 2016, ApJ, 816, 66, doi: 10.3847/0004-637X/816/2/66
- Barnes (2007) Barnes, S. A. 2007, ApJ, 669, 1167, doi: 10.1086/519295
- Borucki et al. (2010) Borucki, W. J., Koch, D., Basri, G., et al. 2010, Science, 327, 977, doi: 10.1126/science.1185402
- Briceño et al. (2007) Briceño, C., Preibisch, T., Sherry, W. H., et al. 2007, in Protostars and Planets V, ed. B. Reipurth, D. Jewitt, & K. Keil, 345. https://arxiv.org/abs/astro-ph/0602446
- Brown et al. (2013) Brown, T. M., Baliber, N., Bianco, F. B., et al. 2013, Publications of the Astronomical Society of the Pacific, 125, 1031, doi: 10.1086/673168
- Buchhave et al. (2012) Buchhave, L. A., Latham, D. W., Johansen, A., et al. 2012, Nature, 486, 375, doi: 10.1038/nature11121
- Carleo et al. (2021) Carleo, I., Desidera, S., Nardiello, D., et al. 2021, A&A, 645, A71, doi: 10.1051/0004-6361/202039042
- Chambers (1999) Chambers, J. E. 1999, MNRAS, 304, 793, doi: 10.1046/j.1365-8711.1999.02379.x
- Chambers et al. (1996) Chambers, J. E., Wetherill, G. W., & Boss, A. P. 1996, Icarus, 119, 261, doi: 10.1006/icar.1996.0019
- Chen & Kipping (2017) Chen, J., & Kipping, D. 2017, ApJ, 834, 17, doi: 10.3847/1538-4357/834/1/17
- Choi et al. (2016) Choi, J., Dotter, A., Conroy, C., et al. 2016, ApJ, 823, 102, doi: 10.3847/0004-637X/823/2/102
- Claret (2017) Claret, A. 2017, A&A, 600, A30, doi: 10.1051/0004-6361/201629705
- Collier Cameron (2007) Collier Cameron, A. 2007, Astronomische Nachrichten, 328, 1030, doi: 10.1002/asna.200710880
- Collins (2019) Collins, K. 2019, in American Astronomical Society Meeting Abstracts, Vol. 233, American Astronomical Society Meeting Abstracts #233, 140.05
- Collins et al. (2017) Collins, K. A., Kielkopf, J. F., Stassun, K. G., & Hessman, F. V. 2017, AJ, 153, 77, doi: 10.3847/1538-3881/153/2/77
- Curtis et al. (2019a) Curtis, J. L., Agüeros, M. A., Douglas, S. T., & Meibom, S. 2019a, ApJ, 879, 49, doi: 10.3847/1538-4357/ab2393
- Curtis et al. (2019b) Curtis, J. L., Agüeros, M. A., Mamajek, E. E., Wright, J. T., & Cummings, J. D. 2019b, AJ, 158, 77, doi: 10.3847/1538-3881/ab2899
- Curtis et al. (2020) Curtis, J. L., Agüeros, M. A., Matt, S. P., et al. 2020, ApJ, 904, 140, doi: 10.3847/1538-4357/abbf58
- Cutri & et al. (2014) Cutri, R. M., & et al. 2014, VizieR Online Data Catalog, 2328, 0
- Cutri et al. (2003) Cutri, R. M., Skrutskie, M. F., van Dyk, S., et al. 2003, VizieR Online Data Catalog, 2246, 0
- Davenport (2016) Davenport, J. R. A. 2016, ApJ, 829, 23, doi: 10.3847/0004-637X/829/1/23
- David et al. (2016) David, T. J., Hillenbrand, L. A., Petigura, E. A., et al. 2016, Nature, 534, 658, doi: 10.1038/nature18293
- David et al. (2019) David, T. J., Cody, A. M., Hedges, C. L., et al. 2019, AJ, 158, 79, doi: 10.3847/1538-3881/ab290f
- David et al. (2021) David, T. J., Contardo, G., Sandoval, A., et al. 2021, AJ, 161, 265, doi: 10.3847/1538-3881/abf439
- Donati et al. (1997) Donati, J.-F., Semel, M., Carter, B. D., Rees, D. E., & Collier Cameron, A. 1997, MNRAS, 291, 658, doi: 10.1093/mnras/291.4.658
- Dotter (2016a) Dotter, A. 2016a, ApJS, 222, 8, doi: 10.3847/0067-0049/222/1/8
- Dotter (2016b) —. 2016b, ApJS, 222, 8, doi: 10.3847/0067-0049/222/1/8
- Eastman et al. (2019) Eastman, J. D., Rodriguez, J. E., Agol, E., et al. 2019, arXiv e-prints, arXiv:1907.09480. https://arxiv.org/abs/1907.09480
- Evans (2018) Evans, D. F. 2018, Research Notes of the American Astronomical Society, 2, 20, doi: 10.3847/2515-5172/aac173
- Fabrycky et al. (2014) Fabrycky, D. C., Lissauer, J. J., Ragozzine, D., et al. 2014, ApJ, 790, 146, doi: 10.1088/0004-637X/790/2/146
- Fang & Margot (2012) Fang, J., & Margot, J.-L. 2012, ApJ, 761, 92, doi: 10.1088/0004-637X/761/2/92
- Feinstein et al. (2020a) Feinstein, A., Montet, B., & Ansdell, M. 2020a, The Journal of Open Source Software, 5, 2347, doi: 10.21105/joss.02347
- Feinstein et al. (2020b) Feinstein, A. D., Montet, B. T., Ansdell, M., et al. 2020b, AJ, 160, 219, doi: 10.3847/1538-3881/abac0a
- Findeisen & Hillenbrand (2010) Findeisen, K., & Hillenbrand, L. 2010, AJ, 139, 1338, doi: 10.1088/0004-6256/139/4/1338
- Ford (2006) Ford, E. B. 2006, ApJ, 642, 505, doi: 10.1086/500802
- Foreman-Mackey (2019) Foreman-Mackey, D. 2019, exoplanet: Probabilistic modeling of transit or radial velocity observations of exoplanets. http://ascl.net/1910.005
- Gagné et al. (2021) Gagné, J., Faherty, J. K., Moranta, L., & Popinchalk, M. 2021, ApJ, 915, L29, doi: 10.3847/2041-8213/ac0e9a
- Gagné et al. (2018) Gagné, J., Mamajek, E. E., Malo, L., et al. 2018, ApJ, 856, 23, doi: 10.3847/1538-4357/aaae09
- Gaia Collaboration et al. (2016) Gaia Collaboration, Prusti, T., de Bruijne, J. H. J., et al. 2016, A&A, 595, A1, doi: 10.1051/0004-6361/201629272
- Gaia Collaboration et al. (2018) Gaia Collaboration, Brown, A. G. A., Vallenari, A., et al. 2018, A&A, 616, A1, doi: 10.1051/0004-6361/201833051
- Ginzburg et al. (2018) Ginzburg, S., Schlichting, H. E., & Sari, R. 2018, MNRAS, 476, 759, doi: 10.1093/mnras/sty290
- Gladman (1993) Gladman, B. 1993, Icarus, 106, 247, doi: 10.1006/icar.1993.1169
- Gray (2005) Gray, D. F. 2005, The Observation and Analysis of Stellar Photospheres (Cambridge University Press)
- Guerrero et al. (2021) Guerrero, N. M., Seager, S., Huang, C. X., et al. 2021, ApJS, 254, 39, doi: 10.3847/1538-4365/abefe1
- Guillot et al. (2015) Guillot, T., Abe, L., Agabi, A., et al. 2015, Astronomische Nachrichten, 336, 638, doi: 10.1002/asna.201512174
- Günther et al. (2020) Günther, M. N., Zhan, Z., Seager, S., et al. 2020, AJ, 159, 60, doi: 10.3847/1538-3881/ab5d3a
- Hadden & Lithwick (2014) Hadden, S., & Lithwick, Y. 2014, ApJ, 787, 80, doi: 10.1088/0004-637X/787/1/80
- Hadden & Lithwick (2018) —. 2018, AJ, 156, 95, doi: 10.3847/1538-3881/aad32c
- Hartmann & Noyes (1987) Hartmann, L. W., & Noyes, R. W. 1987, ARA&A, 25, 271, doi: 10.1146/annurev.aa.25.090187.001415
- He et al. (2020) He, M. Y., Ford, E. B., Ragozzine, D., & Carrera, D. 2020, AJ, 160, 276, doi: 10.3847/1538-3881/abba18
- Hedges et al. (2021) Hedges, C., Hughes, A., Zhou, G., et al. 2021, AJ, 162, 54, doi: 10.3847/1538-3881/ac06cd
- Henden et al. (2016) Henden, A. A., Templeton, M., Terrell, D., et al. 2016, VizieR Online Data Catalog, II/336
- Hippke & Heller (2019) Hippke, M., & Heller, R. 2019, A&A, 623, A39, doi: 10.1051/0004-6361/201834672
- Høg et al. (2000) Høg, E., Fabricius, C., Makarov, V. V., et al. 2000, A&A, 355, L27
- Howell et al. (2014) Howell, S. B., Sobeck, C., Haas, M., et al. 2014, PASP, 126, 398, doi: 10.1086/676406
- Huang et al. (2020a) Huang, C. X., Vanderburg, A., Pál, A., et al. 2020a, Research Notes of the American Astronomical Society, 4, 204, doi: 10.3847/2515-5172/abca2e
- Huang et al. (2020b) —. 2020b, Research Notes of the American Astronomical Society, 4, 206, doi: 10.3847/2515-5172/abca2d
- Hunter (2007) Hunter, J. D. 2007, Computing in Science and Engineering, 9, 90, doi: 10.1109/MCSE.2007.55
- Jenkins (2002) Jenkins, J. M. 2002, ApJ, 575, 493, doi: 10.1086/341136
- Jenkins et al. (2020) Jenkins, J. M., Tenenbaum, P., Seader, S., et al. 2020, Kepler Data Processing Handbook: Transiting Planet Search, Kepler Science Document KSCI-19081-003
- Jenkins et al. (2010a) Jenkins, J. M., Caldwell, D. A., Chandrasekaran, H., et al. 2010a, ApJ, 713, L87, doi: 10.1088/2041-8205/713/2/L87
- Jenkins et al. (2010b) Jenkins, J. M., Chandrasekaran, H., McCauliff, S. D., et al. 2010b, in Society of Photo-Optical Instrumentation Engineers (SPIE) Conference Series, Vol. 7740, Software and Cyberinfrastructure for Astronomy, ed. N. M. Radziwill & A. Bridger, 77400D, doi: 10.1117/12.856764
- Jenkins et al. (2016) Jenkins, J. M., Twicken, J. D., McCauliff, S., et al. 2016, in Proc. SPIE, Vol. 9913, Software and Cyberinfrastructure for Astronomy IV, 99133E, doi: 10.1117/12.2233418
- Jensen (2013) Jensen, E. 2013, Tapir: A web interface for transit/eclipse observability, Astrophysics Source Code Library. http://ascl.net/1306.007
- Jin & Mordasini (2018) Jin, S., & Mordasini, C. 2018, ApJ, 853, 163, doi: 10.3847/1538-4357/aa9f1e
- Kane (2014) Kane, S. R. 2014, ApJ, 782, 111, doi: 10.1088/0004-637X/782/2/111
- Kane (2016) —. 2016, ApJ, 830, 105, doi: 10.3847/0004-637X/830/2/105
- Kane (2019) —. 2019, AJ, 158, 72, doi: 10.3847/1538-3881/ab2a09
- Kane et al. (2014) Kane, S. R., Kopparapu, R. K., & Domagal-Goldman, S. D. 2014, ApJ, 794, L5, doi: 10.1088/2041-8205/794/1/L5
- Kane & Raymond (2014) Kane, S. R., & Raymond, S. N. 2014, ApJ, 784, 104, doi: 10.1088/0004-637X/784/2/104
- Kane et al. (2016) Kane, S. R., Hill, M. L., Kasting, J. F., et al. 2016, ApJ, 830, 1, doi: 10.3847/0004-637X/830/1/1
- Kasting et al. (1993) Kasting, J. F., Whitmire, D. P., & Reynolds, R. T. 1993, Icarus, 101, 108, doi: 10.1006/icar.1993.1010
- Kempton et al. (2018) Kempton, E. M. R., Bean, J. L., Louie, D. R., et al. 2018, PASP, 130, 114401, doi: 10.1088/1538-3873/aadf6f
- Kopparapu et al. (2014) Kopparapu, R. K., Ramirez, R. M., SchottelKotte, J., et al. 2014, ApJ, 787, L29, doi: 10.1088/2041-8205/787/2/L29
- Kopparapu et al. (2013) Kopparapu, R. K., Ramirez, R., Kasting, J. F., et al. 2013, ApJ, 765, 131, doi: 10.1088/0004-637X/765/2/131
- Kounkel & Covey (2019) Kounkel, M., & Covey, K. 2019, AJ, 158, 122, doi: 10.3847/1538-3881/ab339a
- Kreidberg (2015) Kreidberg, L. 2015, PASP, 127, 1161, doi: 10.1086/683602
- Küker & Rüdiger (2011) Küker, M., & Rüdiger, G. 2011, Astronomische Nachrichten, 332, 933, doi: 10.1002/asna.201111628
- Latham et al. (2011) Latham, D. W., Rowe, J. F., Quinn, S. N., et al. 2011, ApJ, 732, L24, doi: 10.1088/2041-8205/732/2/L24
- Li et al. (2019) Li, J., Tenenbaum, P., Twicken, J. D., et al. 2019, PASP, 131, 024506, doi: 10.1088/1538-3873/aaf44d
- Lindegren et al. (2018) Lindegren, L., Hernández, J., Bombrun, A., et al. 2018, A&A, 616, A2, doi: 10.1051/0004-6361/201832727
- Lissauer et al. (2011) Lissauer, J. J., Ragozzine, D., Fabrycky, D. C., et al. 2011, ApJS, 197, 8, doi: 10.1088/0067-0049/197/1/8
- Lissauer et al. (2012) Lissauer, J. J., Marcy, G. W., Rowe, J. F., et al. 2012, ApJ, 750, 112, doi: 10.1088/0004-637X/750/2/112
- Livingston et al. (2018) Livingston, J. H., Dai, F., Hirano, T., et al. 2018, AJ, 155, 115, doi: 10.3847/1538-3881/aaa841
- Livingston et al. (2019) —. 2019, MNRAS, 484, 8, doi: 10.1093/mnras/sty3464
- Lomb (1976) Lomb, N. R. 1976, Ap&SS, 39, 447, doi: 10.1007/BF00648343
- Lovis & Mayor (2007) Lovis, C., & Mayor, M. 2007, A&A, 472, 657, doi: 10.1051/0004-6361:20077375
- Maehara et al. (2015) Maehara, H., Shibayama, T., Notsu, Y., et al. 2015, Earth, Planets and Space, 67, 59, doi: 10.1186/s40623-015-0217-z
- Mamajek & Hillenbrand (2008) Mamajek, E. E., & Hillenbrand, L. A. 2008, ApJ, 687, 1264, doi: 10.1086/591785
- Mann et al. (2016a) Mann, A. W., Gaidos, E., Mace, G. N., et al. 2016a, ApJ, 818, 46, doi: 10.3847/0004-637X/818/1/46
- Mann et al. (2016b) Mann, A. W., Newton, E. R., Rizzuto, A. C., et al. 2016b, AJ, 152, 61, doi: 10.3847/0004-6256/152/3/61
- Mann et al. (2017) Mann, A. W., Gaidos, E., Vanderburg, A., et al. 2017, AJ, 153, 64, doi: 10.1088/1361-6528/aa5276
- Mann et al. (2018) Mann, A. W., Vanderburg, A., Rizzuto, A. C., et al. 2018, AJ, 155, 4, doi: 10.3847/1538-3881/aa9791
- Mann et al. (2020) Mann, A. W., Johnson, M. C., Vanderburg, A., et al. 2020, AJ, 160, 179, doi: 10.3847/1538-3881/abae64
- Martín et al. (2018) Martín, E. L., Lodieu, N., Pavlenko, Y., & Béjar, V. J. S. 2018, ApJ, 856, 40, doi: 10.3847/1538-4357/aaaeb8
- McCully et al. (2018) McCully, C., Volgenau, N. H., Harbeck, D.-R., et al. 2018, in Society of Photo-Optical Instrumentation Engineers (SPIE) Conference Series, Vol. 10707, Proc. SPIE, 107070K, doi: 10.1117/12.2314340
- Medina et al. (2020) Medina, A. A., Winters, J. G., Irwin, J. M., & Charbonneau, D. 2020, ApJ, 905, 107, doi: 10.3847/1538-4357/abc686
- Meingast et al. (2019) Meingast, S., Alves, J., & Fürnkranz, V. 2019, A&A, 622, L13, doi: 10.1051/0004-6361/201834950
- Mékarnia et al. (2016) Mékarnia, D., Guillot, T., Rivet, J. P., et al. 2016, MNRAS, 463, 45, doi: 10.1093/mnras/stw1934
- Millholland et al. (2021) Millholland, S. C., He, M. Y., Ford, E. B., et al. 2021, AJ, 162, 166, doi: 10.3847/1538-3881/ac0f7a
- Moorhead et al. (2011) Moorhead, A. V., Ford, E. B., Morehead, R. C., et al. 2011, ApJS, 197, 1, doi: 10.1088/0067-0049/197/1/1
- Newton et al. (2019) Newton, E. R., Mann, A. W., Tofflemire, B. M., et al. 2019, ApJ, 880, L17, doi: 10.3847/2041-8213/ab2988
- Obermeier et al. (2016) Obermeier, C., Henning, T., Schlieder, J. E., et al. 2016, AJ, 152, 223, doi: 10.3847/1538-3881/152/6/223
- Ostberg & Kane (2019) Ostberg, C., & Kane, S. R. 2019, AJ, 158, 195, doi: 10.3847/1538-3881/ab44b0
- Owen & Wu (2013) Owen, J. E., & Wu, Y. 2013, ApJ, 775, 105, doi: 10.1088/0004-637X/775/2/105
- Paulson et al. (2004) Paulson, D. B., Cochran, W. D., & Hatzes, A. P. 2004, AJ, 127, 3579, doi: 10.1086/420710
- Paxton et al. (2011) Paxton, B., Bildsten, L., Dotter, A., et al. 2011, ApJS, 192, 3, doi: 10.1088/0067-0049/192/1/3
- Paxton et al. (2013) Paxton, B., Cantiello, M., Arras, P., et al. 2013, ApJS, 208, 4, doi: 10.1088/0067-0049/208/1/4
- Paxton et al. (2015) Paxton, B., Marchant, P., Schwab, J., et al. 2015, ApJS, 220, 15, doi: 10.1088/0067-0049/220/1/15
- Pepper et al. (2017) Pepper, J., Gillen, E., Parviainen, H., et al. 2017, AJ, 153, 177, doi: 10.3847/1538-3881/aa62ab
- Perryman et al. (1998) Perryman, M. A. C., Brown, A. G. A., Lebreton, Y., et al. 1998, A&A, 331, 81. https://arxiv.org/abs/astro-ph/9707253
- Plavchan et al. (2020) Plavchan, P., Barclay, T., Gagné, J., et al. 2020, Nature, 582, 497, doi: 10.1038/s41586-020-2400-z
- Quinn et al. (2012) Quinn, S. N., White, R. J., Latham, D. W., et al. 2012, ApJ, 756, L33, doi: 10.1088/2041-8205/756/2/L33
- Quinn et al. (2014) —. 2014, ApJ, 787, 27, doi: 10.1088/0004-637X/787/1/27
- Richey-Yowell et al. (2019) Richey-Yowell, T., Shkolnik, E. L., Schneider, A. C., et al. 2019, ApJ, 872, 17, doi: 10.3847/1538-4357/aafa74
- Ricker et al. (2016) Ricker, G. R., Vanderspek, R., Winn, J., et al. 2016, in Society of Photo-Optical Instrumentation Engineers (SPIE) Conference Series, Vol. 9904, Space Telescopes and Instrumentation 2016: Optical, Infrared, and Millimeter Wave, ed. H. A. MacEwen, G. G. Fazio, M. Lystrup, N. Batalha, N. Siegler, & E. C. Tong, 99042B, doi: 10.1117/12.2232071
- Rizzuto et al. (2017) Rizzuto, A. C., Mann, A. W., Vanderburg, A., Kraus, A. L., & Covey, K. R. 2017, AJ, 154, 224, doi: 10.3847/1538-3881/aa9070
- Rizzuto et al. (2018) Rizzuto, A. C., Vanderburg, A., Mann, A. W., et al. 2018, AJ, 156, 195, doi: 10.3847/1538-3881/aadf37
- Rizzuto et al. (2020) Rizzuto, A. C., Newton, E. R., Mann, A. W., et al. 2020, AJ, 160, 33, doi: 10.3847/1538-3881/ab94b7
- Saar & Donahue (1997) Saar, S. H., & Donahue, R. A. 1997, ApJ, 485, 319, doi: 10.1086/304392
- Sato et al. (2007) Sato, B., Izumiura, H., Toyota, E., et al. 2007, ApJ, 661, 527, doi: 10.1086/513503
- Scargle (1982) Scargle, J. D. 1982, ApJ, 263, 835, doi: 10.1086/160554
- Schlafly & Finkbeiner (2011) Schlafly, E. F., & Finkbeiner, D. P. 2011, ApJ, 737, 103, doi: 10.1088/0004-637X/737/2/103
- Schlegel et al. (1998) Schlegel, D. J., Finkbeiner, D. P., & Davis, M. 1998, ApJ, 500, 525, doi: 10.1086/305772
- Shkolnik et al. (2011) Shkolnik, E. L., Liu, M. C., Reid, I. N., Dupuy, T., & Weinberger, A. J. 2011, ApJ, 727, 6, doi: 10.1088/0004-637X/727/1/6
- Stassun et al. (2018) Stassun, K. G., Oelkers, R. J., Pepper, J., et al. 2018, AJ, 156, 102, doi: 10.3847/1538-3881/aad050
- Stumpe et al. (2012) Stumpe, M. C., Smith, J. C., Van Cleve, J. E., et al. 2012, PASP, 124, 985, doi: 10.1086/667698
- Tofflemire et al. (2021) Tofflemire, B. M., Rizzuto, A. C., Newton, E. R., et al. 2021, AJ, 161, 171, doi: 10.3847/1538-3881/abdf53
- Tokovinin (2018) Tokovinin, A. 2018, PASP, 130, 035002, doi: 10.1088/1538-3873/aaa7d9
- Tokovinin et al. (2013) Tokovinin, A., Fischer, D. A., Bonati, M., et al. 2013, PASP, 125, 1336, doi: 10.1086/674012
- Torres et al. (2020) Torres, G., Vanderburg, A., Curtis, J. L., et al. 2020, ApJ, 896, 162, doi: 10.3847/1538-4357/ab911b
- Twicken et al. (2018) Twicken, J. D., Catanzarite, J. H., Clarke, B. D., et al. 2018, PASP, 130, 064502, doi: 10.1088/1538-3873/aab694
- van der Walt et al. (2011) van der Walt, S., Colbert, S. C., & Varoquaux, G. 2011, Computing in Science and Engineering, 13, 22, doi: 10.1109/MCSE.2011.37
- Van Eylen & Albrecht (2015) Van Eylen, V., & Albrecht, S. 2015, ApJ, 808, 126, doi: 10.1088/0004-637X/808/2/126
- Vanderburg et al. (2018) Vanderburg, A., Mann, A. W., Rizzuto, A., et al. 2018, AJ, 156, 46, doi: 10.3847/1538-3881/aac894
- Vanderburg et al. (2019) Vanderburg, A., Huang, C. X., Rodriguez, J. E., et al. 2019, ApJ, 881, L19, doi: 10.3847/2041-8213/ab322d
- Wisdom (2006) Wisdom, J. 2006, AJ, 131, 2294, doi: 10.1086/500829
- Wisdom & Holman (1991) Wisdom, J., & Holman, M. 1991, AJ, 102, 1528, doi: 10.1086/115978
- Zhou et al. (2018) Zhou, G., Rodriguez, J. E., Vanderburg, A., et al. 2018, AJ, 156, 93, doi: 10.3847/1538-3881/aad085
- Zhou et al. (2021) Zhou, G., Quinn, S. N., Irwin, J., et al. 2021, AJ, 161, 2, doi: 10.3847/1538-3881/abba22
- Ziegler et al. (2018) Ziegler, C., Law, N. M., Baranec, C., et al. 2018, AJ, 156, 259, doi: 10.3847/1538-3881/aad80a