Vol.0 (20xx) No.0, 000–000
33email: shilongliao@shao.ac.cn \vs\noReceived 2022 June 08; accepted 2022 December 09
A catalog of quasar candidates identified by astrometric and mid-infrared methods in EDR3
Abstract
Quasars are very important in materializing the reference frame. The excess emission of AGNs (active galactic nuclei) in the mid-infrared band can be used to identify quasar candidates. As extremely distant and point-like objects, quasars also could be further selected by astrometry method. Increasing the number of reliable quasar candidates is necessary in characterizing the properties of astrometric solution and evaluating the reliability of ’s own quasars classification. We identify quasars by using appropriate AllWISE [W1-W2] color and different combinations of astrometric criteria. Together with the contamination and completeness, the magnitude, astrometric properties, density distribution, and the morphological indexes of these selected quasars are evaluated. We obtain a quasar candidate catalog of 1,503,373 sources, which contains 1,186,690 candidates (78.9%) in common with the EDR3_AGN catalog and 316,683 newly identified quasar candidates. The completeness of this catalog is around 80% compared to LQAC5, and the purity of the overall catalog is about 90%. We also found that the purity of quasar candidates selected by this method will decrease in the crowded sky area and the region with less WISE observations.
keywords:
astrometry — catalogs — parallaxes — quasars: general1 Introduction
Quasars, known as one type of the active galactic nuclei (AGNs), are extremely distant and point-like objects. Therefore, quasars are very important in materializing the reference frame. The Third International Celestial Reference Frame (ICRF3), which is the realization of the International Celestial Reference System (ICRS) at radio wavelengths, contains 4588 radio sources obtained with the Very Long Baseline Interferometry (VLBI) (Charlot et al. 2020). The European Space Agency’s mission (Prusti et al. 2016), which aims to provide more than one billion accurate determination of proper motions and parallaxes of stars, has already provided more than one million quasar candidates in the visible part of the electromagnetic spectrum. With a comparable accuracy with VLBI, is dedicated to establishing a new kinematically non-rotating reference frame in the visible wavelengths with its own astrometric measurements of quasars, named the Celestial Reference Frame (-CRF) (Mignard et al. 2018; Gaia Collaboration et al. 2022a). Furthermore, quasars are generally considered as almost zero parallax and proper motion objects, therefore they are vital objects to characterize the astrometric properties, such as the astrometric solution (Liao et al. 2021a, b). With these concepts in mind, it is crucial to maximizing the number of quasars in optical wavelengths.
There have been lots of efforts taken to enlarge the number of quasars. Since the first quasar was identified (Schmidt 1963), over the past decades, surveys such as the Large Bright Quasar Survey (Hewett et al. 1995), the Hamburg Quasar Survey (Hagen et al. 1995), the INT Wide Angle Survey (Sharp et al. 2001), the 2DF Quasar Redshift Survey (2QZ) (Croom et al. 2004) and the quasars from Solan Digital Sky Survey (SDSS) (Pâris et al. 2018; Lyke et al. 2020) contributed the majority of the quasars identified in the optical wavelengths. Together with the new data released from Large Sky Area Multi-Object Fiber Spectroscopic Telescope (LAMOST) (Zhao et al. 2012; Cui et al. 2012; Ai et al. 2016; Dong et al. 2018; Yao et al. 2019), the number of quasars discovered in recent years increased rapidly. These quasars have been compiled into various of catalogs such as Veron-Cetty Veron catalog (VV) (Véron-Cetty & Véron 2010), the Large Quasar Astrometric Catalog (LQAC) (Souchay et al. 2009, 2012, 2015, 2017, 2019), the Known Quasars Catalog (Liao et al. 2019) and the Million Quasars (Milliquas) catalog (Flesch 2015, 2017, 2021).
In spite of the large number of quasars confirmed by their spectra, the number of quasars is far from enough for the establishment of a high-precision celestial reference frame. Based on the excess emission of the AGN in the mid-infrared band (Lacy et al. 2004; Richards et al. 2006), the mid-infrared color criteria selections have been proven to be very effective (Mateos et al. 2012; Stern et al. 2012; Secrest et al. 2015; Assef et al. 2018). With mid-infrared data release from the Wide-field Infrared Survey Explorer (WISE, Wright et al. 2010), Secrest et al. (2015) selected about 1.4 million AGN candidates (MirAGN), which contribute the majority of the quasars used to define the -Celestial Reference Frame in Data Release 2 (DR2) (Lindegren et al. 2018; Mignard et al. 2018). Using only photometric and astrometric data, Bailer-Jones et al. (2019) constructed a supervised classifier based on Gaussian Mixture Models to probabilistically classify extragalactic objects in DR2, in which 690,000 quasars and 110,000 galaxies candidates are identified.
Early Data Release 3 (EDR3) (Lindegren et al. 2021b) provides provisional astrometric and photometric data for more than 1.8 billion sources based on the observations made by . To enlarge the number of quasars, together with the MirAGN catalog, 17 external quasar or AGN catalogs were cross-matched with EDR3. These catalogs include both spectroscopically confirmed quasars and quasar candidates, such as quasars from 2QZ (Croom et al. 2004), Roma-BZCAT release 5 (Massaro et al. 2015), R90 (Assef et al. 2018), the WISE color-selected AGN catalog (Secrest et al. 2015) and SDSS DR14Q (Pâris et al. 2018). Machine learning methods also identified lots of quasar candidates, such as -unwise (Shu et al. 2019). These quasar-like objects, 1,614,173 objects in total, are available in the Archive as the table (hereafter EDR3_AGN catalog) (Lindegren et al. 2021b).
See Table 1, among these 17 external quasar catalogs, we have selected six catalogs with a relatively large number of quasars to investigate the composition of the quasar-like objects in EDR3_AGN catalog. The -unwise catalog contributes most of the quasar-like objects identified in EDR3_AGN catalog, and considerable parts of these targets overlap with catalogs such as R90, the WISE AGN catalog, and SDSS DR14Q catalog. As very distant objects, non-detectable parallax and proper motion are the basic characteristics of quasars. However, the quasar candidates from the color criteria selection only and the machine learning method may include a large number of false identification objects. For example, for the -unwise catalog, 2,610,583 objects are matched to the EDR3, however, only 60.1 of them meet the astrometric criteria to be identified as quasar-like objects in EDR3_AGN catalog, see Table 1. So there are many stars and galaxies in the -unwise catalog, which is probably also the case in the quasar-like objects in EDR3_AGN catalog, especially for the six-parameter solution sample (Liao et al. 2021a, b). Therefore, among the 1.6 million quasar-like objects identified in EDR3_AGN catalog, only 429,249 objects (Frame Rotator Sources, FRS hereafter) are selected to compute the -CRF3. Compared to DR2, the systematic residuals of astrometry have been greatly improved in EDR3. Many studies show that the mean proper motion from the confirmed quasars sample is consistent with zero, and no significant systematic residuals are found in global (Fabricius et al. 2021; Liao et al. 2021a, b). Therefore, the astrometric solution in EDR3 is reliable enough to use in quasar selection. The non-detectable parallax and proper motion feature can purify quasar candidates selected by the mid-infrared method, which has been proven quite effective in our previous quasar selection with APOP (Qi et al. 2015) and AllWISE data (Guo et al. 2018).
Furthermore, using particular variability and characteristic SEDs (Spectral Energy Distributions) of quasars, could identify its own quasar list. In Data Release 3 (DR3), has performed its own quasars classification with the low-resolution spectral data, G band magnitude and astrometric parameters (Gaia Collaboration et al. 2022b). However, for the quasars with low-resolution spectroscopy, their photometric signatures are not enough to distinguish them from stars. As indicated by Claeskens et al. (2006), at redshifts , and , the white dwarfs, F stars and red dwarfs have similar colors with quasars. Testing the degree of stellar contamination, i.e. , the quality of quasars from the -data-only classifications convincingly will be quite essential. Combining different approaches with the near-zero proper motion and parallax, it will be more feasible to distinguish quasars from stellar objects (Mignard & Klioner 2012). The join quasar candidates selected by ’s astrometric data and mid-infrared color data might be the crucial indicator to test the reliability of such quality.
As the first attempt to use EDR3 astrometric data to select quasar candidates with the combination of mid-infrared data, this paper aims to provide a reliable quasar candidate list with ’s own astrometric data and mid-infrared method. These quasar candidates will play an important role in characterizing the properties of the astrometric solution of (see, eg: Fabricius et al. 2021; Liao et al. 2021a, b), the establishment of the reference frame in optical wavelength (Mignard et al. 2018) and the verification of the quasar catalog identified by its spectroscopy data.
In section 2, we describe the selection process of quasar candidates. The contamination, completeness, morphological indexes and astrometric properties of our catalog are evaluated in section 3. In section 4, we discuss the quasar candidates in the Galactic plane and the study of anomalous quasars. Finally, in section 5, we summarize our results and give our conclusions.
| Catalog | Quasars identified in EDR3_AGN catalog/Object matched | Contribution1 |
|---|---|---|
| Roma-BZCAT | 95.6%(3051/3193) | 0.2% |
| R90 | 81.4%(1012323/1243053) | 62.7% |
| -unwise | 60.1%(1569680/2610583) | 97.2% |
| WISE AGN | 89.4%(585287/654690) | 36.3% |
| 2QZ | 99.1%(25134/25375) | 1.6% |
| SDSS DR14Q | 84.0%(308601/367516) | 19.1% |
-
1
The total percentage of this column will exceed 100% because there exits common sources between different catalogs.
2 Data and selection criteria
2.1 Data Used
WISE (the Wide-field Infrared Survey Explorer mission,Wright et al. 2010) is a satellite with a 40 cm aperture launched by NASA in 2009, it has four bands at 3.4, 4.6, 12 and 22 m (hereafter referred to as W1, W2, W3, and W4, respectively), and has angular resolutions of 6.1, 6.4, 6.5 and 12.0 arcseconds in its four bands, respectively. AllWISE catalog (Cutri et al. 2013) is built by combining data from the WISE cryogenic and NEOWISE (Mainzer et al. 2011) post-cryogenic survey, which contains the positions, apparent motions, magnitudes and point-spread function (PSF) profile fit information for about 748 million objects.
EDR3 (Lindegren et al. 2021b), which was released at the end of 2020, is the early releases of Data Release 3 (DR3). EDR3 contains the 5-parameter (positions, parallaxes, and proper motions) astrometric solution for around 585 million sources and the 6-parameter (positions, parallaxes, proper motions and pseudo-colours111The pseudocolour is the astrometrically estimated effective wavenumber of the photon flux distribution in the astrometric (G) band, measured in (https://gea.esac.esa.int/archive/documentation/GEDR3/Gaia_archive/chap_datamodel/sec_dm_main_tables/ssec_dm_gaia_source.html).) astrometric solution for 882 million sources. The magnitude limit is about G 21 mag at the faint end and about G 3 mag at the bright end. In addition, it also provides the 2-parameter (positions) astrometric solution for around 344 million additional sources. For 5-parameter and 6-parameter sources, both position and parallax uncertainties are less than 0.5 mas at G 20 mag, and about 1.0 1.3 mas at G = 21 mag, while the proper motion uncertainties are almost less than 0.5 mas/yr at G 20 mag, and 1.4 mas/yr at G = 21 mag.
2.2 Quasar candidate selection criteria
With their restricted locus in mid-infrared color space, AGNs can be separated from stars and normal galaxies (Lacy et al. 2004; Stern et al. 2005; Richards et al. 2006). With the WISE data, Stern et al. (2012) proposed to use the color information [W1-W2] 0.8 only to select AGNs; Mateos et al. (2012) developed the method of using [W1-W2] and [W2-W3] to define the boundaries of the AGNs located region in mid-infrared color space. In general, these two methods agree with each other. We cross-match the EDR3 AGN catalog with AllWISE catalog and obtain 1,335,906 common sources. Among them, 1,186,690 sources have W1-W2 (mag) values greater than or equal to 0.8, accounting for 88.8%. The cumulative histogram of W1-W2 (mag) values is shown in Fig. 1, which proves that W1-W2 0.8 is a reliable criterion for selecting quasar candidates in EDR3. With the LAMOST DR5 data, our previous study also shows that [W1-W2] 0.8 is a fine balance between low stellar contamination (11.1%) and high completeness (91.4%) (Guo et al. 2018). To be consistent with these studies, we decided to adopt [W1-W2] 0.8 as our mid-infrared color selection criterion. The sources with W1 (or W2) S/N 5 are rejected to ensure the reliability of our selection results.
For the astrometric criterion, Lindegren et al. (2018) proposed a series of criteria to improve the reliability of the AGN catalog in DR2. The matched objects were further selected to have parallaxes and proper motions compatible with zero within five times the respective uncertainty. Similar criteria are used in the -CRF3 quasars selection (Gaia Collaboration et al. 2022a).
Therefore, based on these studies, we propose the criteria for the selection of quasar candidates in EDR3 as follows:
| (1) |
where is Galactic latitude, is the radius for the positional matching between EDR3 and AllWISE. Criterion (ii) selects the objects that have five-parameter or six-parameter solutions; Criterion (iii) takes the global parallax zero point of EDR3 (-17 as) (Lindegren et al. 2021a) into consideration; Criterion (iv) adopts the proper motion criteria from Gaia Collaboration et al. (2022a), where is the covariance matrix of proper motion; Criterion (v) is designed to avoid dense stars near the Galactic Equator during selection, where it is unreliable to select quasars using mid-infrared method; Criterion (vi) sets the maximum radius for cross-matching, and the combination of (v) and (vi) can effectively improve the accuracy of cross-matching (Lindegren et al. 2018).

With these precepts, we obtain a catalog of 1,503,373 quasar candidates (hereafter as QCC), of which 78.9% are in the AGN catalog of EDR3, and other 316,683 sources are newly identified quasar candidates. Table 2 shows the details of our catalog, the astrometric parameters are derived from EDR3, W1 and W2 magnitude are from AllWISE. Fig. 2 shows the density distribution in the sky.

| Label | Type | Units | Detail |
|---|---|---|---|
| source_id | Int | - | Unique EDR3 source identifier |
| WISE_id | Char | - | Unique AllWISE source identifier |
| ra | Double | degree | Right Ascension at J2016.0 |
| ra_error | Float | mas | error of right ascension |
| dec | Double | degree | Declination at J2016.0 |
| dec_error | Float | mas | error of right declination |
| parallax | Double | mas | parallax of the source at J2016.0 |
| parallax _error | Float | mas | error of parallax |
| pm | Float | mas/year | total proper motion |
| pmra | Double | mas/year | proper motion in right ascension direction |
| pmra_error | Float | mas/year | error of proper motion in right ascension direction |
| pmdec | Double | mas/year | proper motion in declination direction |
| pmdec_error | Float | mas/year | error of proper motion in declination direction |
| pmra_pmdec_corr | Float | - | Correlation between pmra and pmdec |
| ngood_AL | Short | - | number of good observations AL |
| G_mag | Float | mag | G-band mean magnitude |
| astrometric_params_solved | Byte | - | 31 for five-parameter solutions, 95 for six-parameter solutions |
| W1_mag-W2mag | Float | mag | AllWISE W1 magnitude - W2 magnitude |
| Class | Char | - | A, B for quasar candidates in QCC-A and QCC-B1 |
| Flag | Char | - | ABQ for abnormal astrometric quasar candidates |
-
1
RQC for the reliable quasar candidates in QCC-B.
3 Characteristic of QCC
In this section, we investigate the completeness and contamination caused by stars and galaxies of the QCC. The morphological indexes of the objects in QCC are calculated to further check the reliability. In addition, we analyze the parallax, magnitude and proper motion distribution of the sources in QCC, and compare them with the AGN catalog in EDR3.
3.1 Reliability and Completeness
We used the fifth release of the Large Quasar Astrometric Catalog (LQAC-5) (Souchay et al. 2019) as a reference to investigate the completeness. To estimate the completeness of QCC, we find 341,987 common sources in LQAC5, EDR3 and AllWISE. To get a robust sample, we remove sources with bad AllWISE parameters (S/N in W1 and W2 5) to obtain a test catalog with 297,527 reliable sources, see Fig. 3. Among them, 238,807(80.3%) sources are found in QCC. Table 3 shows the completeness of QCC compared with LQAC5. Since we have used strict astrometric criteria for the identifying of quasar candidates, the completeness of QCC is lower than the test catalog, which is about 80%.

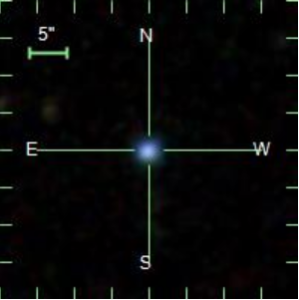
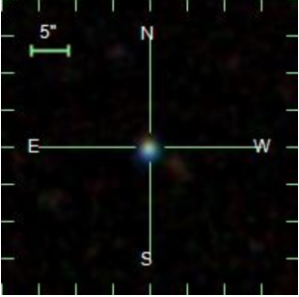
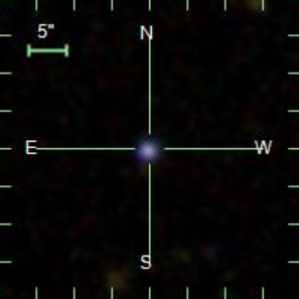
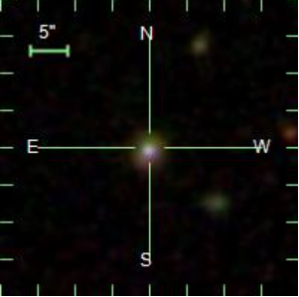
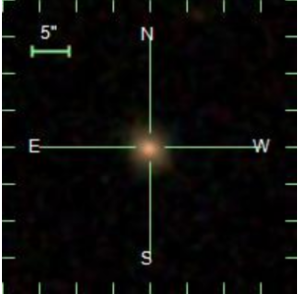
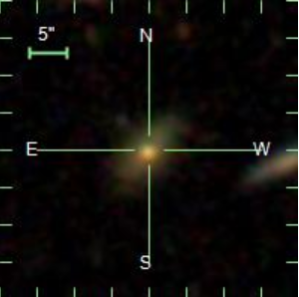
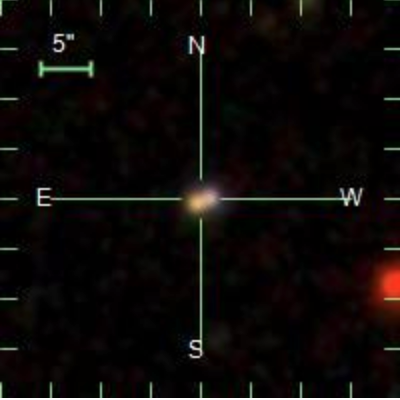
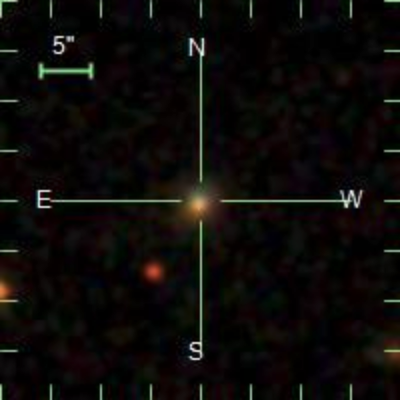
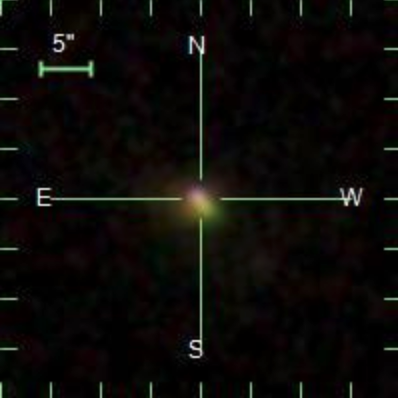
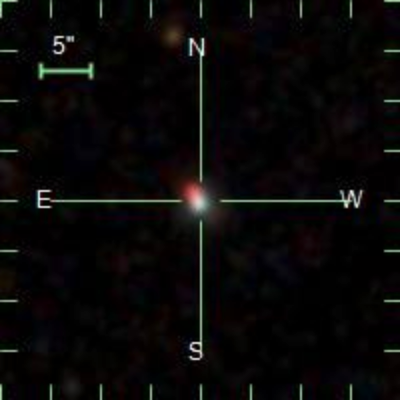
To evaluate the contamination caused by stars and galaxies, we randomly select a region with a center coordinate of Ra = and Dec = . In this test region, 4171 common sources are found in QCC and SDSS DR16 (Ahumada et al. 2020), among them, 3230 sources are identified as quasars in SDSS DR16Q (Lyke et al. 2020). For the remaining 941 sources, we checked the SDSS spectrums of them, the result shows that 1, 9 and 7 of them are classed as star, galaxy and quasar respectively, with no spectrums from SDSS are available for the rest 924 objects. Therefore, for all sources that have spectral classifications, quasars accounted for 99.7% (3237/3247), while stars and galaxies accounted for 0.3% (10/3247), which shows that our quasar candidate catalog identified by astrometry and mid-infrared methods has a very low proportion of contamination. To establish an accurate celestial reference frame, the sources in our final catalog should be point-like sources, Fig. 4 shows the SDSS thumbnails of six candidates in our catalog. Using the same reference region, among the 4171 common sources, 3920 (93.98%) are found to be point-like objects 222The extended and point-like sources are classified by SDSS morphological data, more details could be found in https://www.sdss.org/dr12/algorithms/classify/., with 251 (6.02%) identified as extended sources.
The purity of quasar candidates in a random sky region illustrates the effectiveness of the method. However, the purity may vary widely in different sky regions, just as mentioned in Gaia Collaboration et al. (2022a). Therefore, it is necessary to investigate the purity variation of QCC in the whole sky. To carry out this investigation, we need a high-completeness pure quasar catalog as our reference sample. Gaia Collaboration et al. (2022b) provide a sample of 1.9 million quasar candidates in their Section 8, and the purity of this sample is approximately 95%. We assume that this sample has 100% reliability and 100% completeness, and explore the purity change of QCC by comparing QCC with it. This assumption could indeed be inaccurate, yet convenient to assess how the purity of QCC varies with sky density, Galactic latitude and magnitude. We find that 1,241,033 (82.5%) quasar candidates of QCC are in this pure sample provided by DR3. Fig. 5 shows the purity change with different Galactic latitude and G magnitude. There is a decrease in the purity of QCC where the sources located near the Galactic Equator and at the fainter magnitude. To explore the correlation between purity change and sky density, we propose the concept of purity index. The purity index indicates the number of common sources between the QCC and the reference catalog divided by the number of sources in QCC in each HEALPix (Gorski et al. 1999) sky pixel. See Fig. 6, QCC has relatively low purity near the Galactic Equator and in the area of the Large and Small Magellanic Clouds (LMC and SMC). Although this does not accurately represent the purity distribution of QCC in the sky, it has important implications for our better understanding of quasar selections by mid-infrared and astrometric method.
The lower purity of QCC near the LMC, SMC and the Galactic Center is to be expected, as these regions are very crowded. Selection of quasar candidates in these regions may require more stringent criteria. In addition to these areas, we found that the purity of QCC in some striped areas and anti-Galactic center areas is also relatively low, see Fig. 6. Fewer AllWISE observations may be the main reason for the low purity in these regions. We can find that the area with fewer observations of WISE W2 band in Fig. 7333The detection count represents the number of individual 7.7s exposures on which the source was detected with SNR3 in the WISE profile-fit measurement. coincides well with the low-purity area in Fig. 6. In summary, when selecting quasar candidates using the method mentioned in this paper, the purity of samples will decrease in crowded sky regions and in the regions with fewer WISE observations.
 (A)
(A)
|
 (B)
(B)
|
 (C)
(C)
|
 (D)
(D)
|
 (E)
(E)
|
 (F)
(F)
|


| Resource | Completeness | Quasars found/ALL quasars |
|---|---|---|
| ICRF3 | 81.07% | 2351/2900 |
| FIRST | 75.27% | 10462/13899 |
| 2QZ | 86.65% | 17181/19827 |
| SDSS DR12 | 80.20% | 224440/279845 |
| GSC2.3 | 80.21% | 234142/291901 |
| 2MASS | 71.40% | 19122/26783 |
| V&V | 80.97% | 75880/93717 |
| R90 | 91.47% | 184921/202159 |
| Roma-BZCAT | 70.73% | 1839/2600 |
| EDR3 FRS | 91.66% | 93947/102493 |
3.2 The morphological indexes
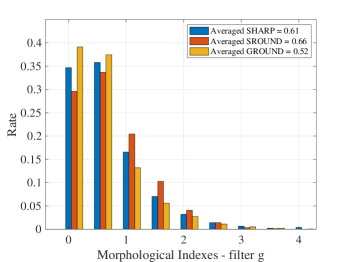
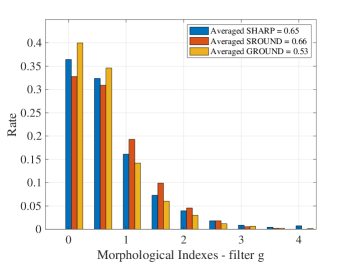
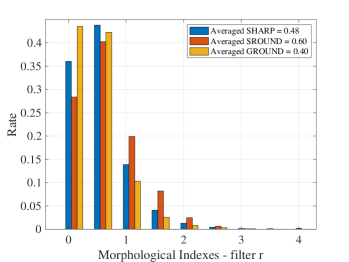
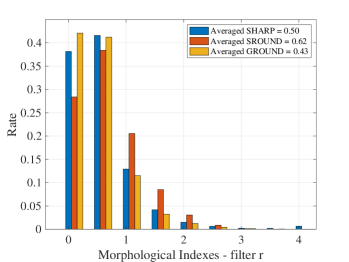
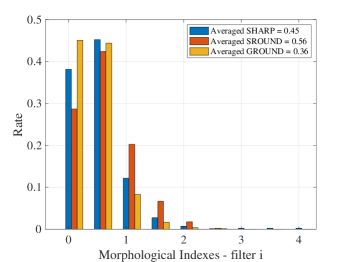
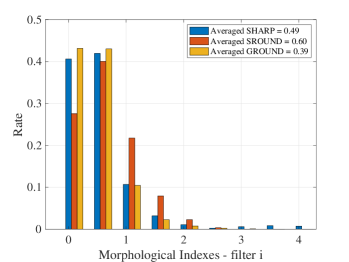
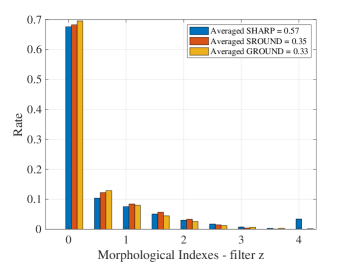
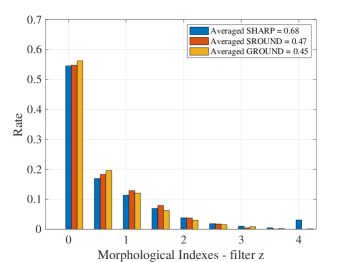
Inspired by LQAC2 (Souchay et al. 2012), we analyzed the morphological indexes of QCC. We apply the photometry function of IRAF to the PSF of each source and compare it to the PSFs of other stars near that source. The optical images used in the calculation process came from SDSS, with a total of 4 bands from blue to infrared, namely g, r, i, z, and the corresponding central wavelengths are 477.0, 623.1, 762.5, and 913.4 nm. The parameters SHARP, SROUND, GROUND determined by IRAF’s DAOFIND provide comprehensive morphological data of each source. The morphological indexes of each source are calculated by Andrei et al. (2012):
| (2) |
where is the morphological index of each source for the parameter P in the colour C, represents the parameter P of quasar Q, is the mean value of parameter P of the stars on the same SDSS field as quasar Q, is the standard deviation of these stars’ parameters.
After matching QCC with SDSS DR16, we obtain 663,087 common sources, among which, 39,785 sources are identified as extended sources by SDSS. We randomly selected 18,400 extended sources and 18,400 point-like sources. See Fig. 8, we plot the percentage histograms of the SHARP, SROUND, and GROUND444SHARP represents the ratio of, the difference between the height of the center pixel of the PSF and the mean of the surrounding non-bad pixels, to the height of the best fit Gaussian function at that point. SROUND computes the ratio of a measure of the bilateral symmetry of the object to a measure of the four-fold symmetry of the object. GROUND measures the ratio of, the difference in the height of the best fitting Gaussian function in x minus the best fitting Gaussian function in y, over the average of the best fitting Gaussian functions in x and y (https://photutils.readthedocs.io/en/stable/api/photutils.detection.DAOStarFinder.html). morphological indexes of these sources. The median values of the morphological indexes of the extended sources in all four bands is slightly larger than that of the point-like sources as expected. In addition, both point-like and extended sources in all bands have small morphological indexes, only about 8% of the sources have a morphological index greater than 2, which means most of them are stellar-like sources.
 (A)
(A)
|
 (B)
(B)
|
 (C)
(C)
|
 (D)
(D)
|
 (E)
(E)
|
 (F)
(F)
|
 (G)
(G)
|
 (H)
(H)
|
3.3 Parallax, Magnitude and Proper motion
As mentioned above, there are 1,186,690 sources in QCC that are also present in the EDR3 AGN catalog, whose astrometric properties can be found in Liao et al. (2021b). Therefore, the astrometric properties of the remaining 316,683 newly identified quasar candidates are worth investigating. Based on this goal, we divided the QCC catalog into two subsamples: the QCC-A subset consisting of 1,186,690 quasar candidates already identified by EDR3, and the QCC-B subset consisting of the newly identified 316,683 quasar candidates. Among QCC-B subset, there are 113,186 (36%) five-parameter sources, and 203,497 (64%) six-parameter sources. After cross-matching QCC-B with other AGN catalogs, we found that 106,928 sources have been identified as quasars (or quasar candidates), and the remaining 209,755 sources are newly identified.
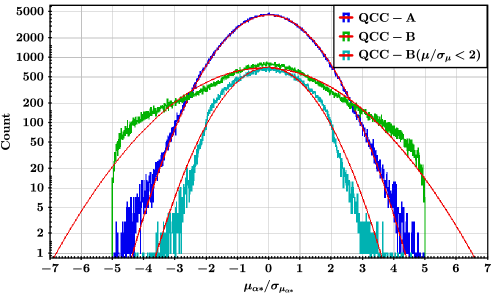
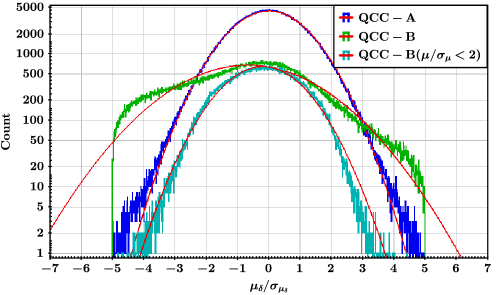
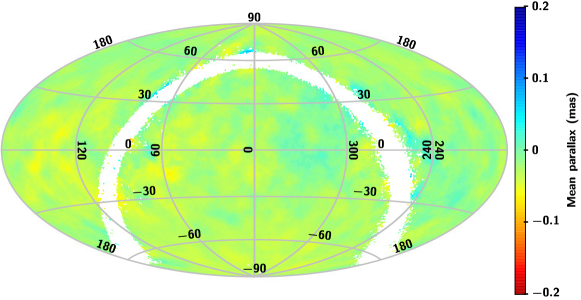
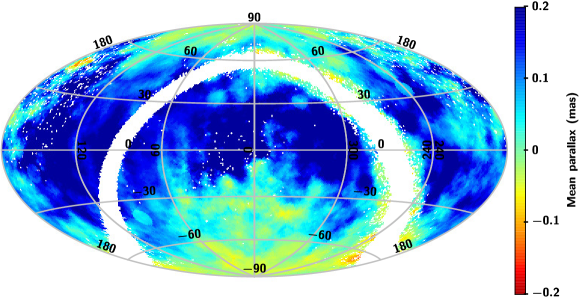
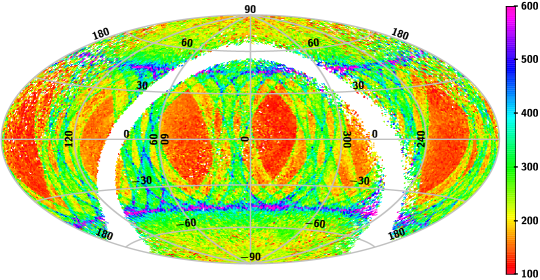
The parallax, G magnitude and proper motion distribution can be found in Fig. 9, Fig. 10 and Fig. 11, respectively. The sources in QCC-B populate the dimmer end. The median of magnitude of the QCC-B sample is 20.49 mag, while for the QCC-A sample, the median of magnitude is 20.00 mag. The average proper motion and parallax are shown in Table 4. The mean parallax and of QCC-B are significantly different from other quasar candidates, and the standard deviations are all very large. One possible reason is that these sources are fainter and less observed, see Fig. 12. As we proposed in (Liao et al. 2021b), the number of good CCD observations along-scan greatly affects the astrometric solution of quasar candidates and cause a bias in the proper motion, especially for the six-parameter sources. Fig. 13 shows the generalized moving mean555The generalized moving mean used the neighboring points on the celestial sphere to smooth each point by using a generalized weighting function (Bucciarelli et al. 1993). To be compared with the smoothed maps and median parallax plot in EDR3 (Lindegren et al. 2021b; Fabricius et al. 2021), the generalized moving mean also calculated each source in a radius region and with more than 50 objects. (GMM hereafter) parallaxes of sources in QCC, the parallax distribution of sources in QCC-A is relatively uniform, but for QCC-B, sources locate within of the ecliptic plane show significant parallax bias. We find most of these sources have less than 200 good AL observations, see Fig. 14.
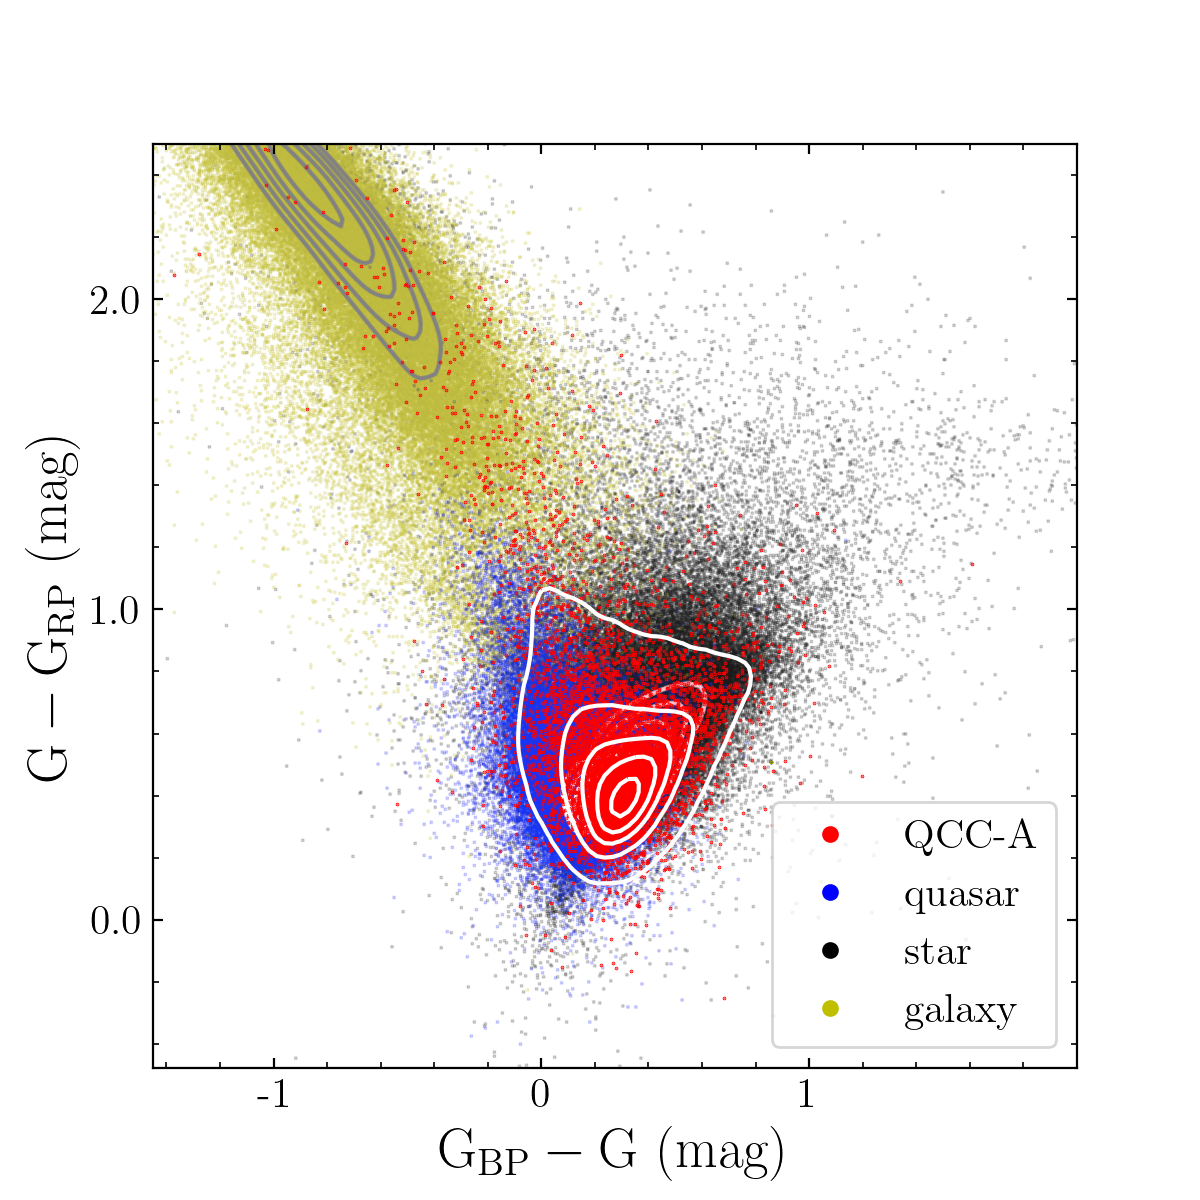
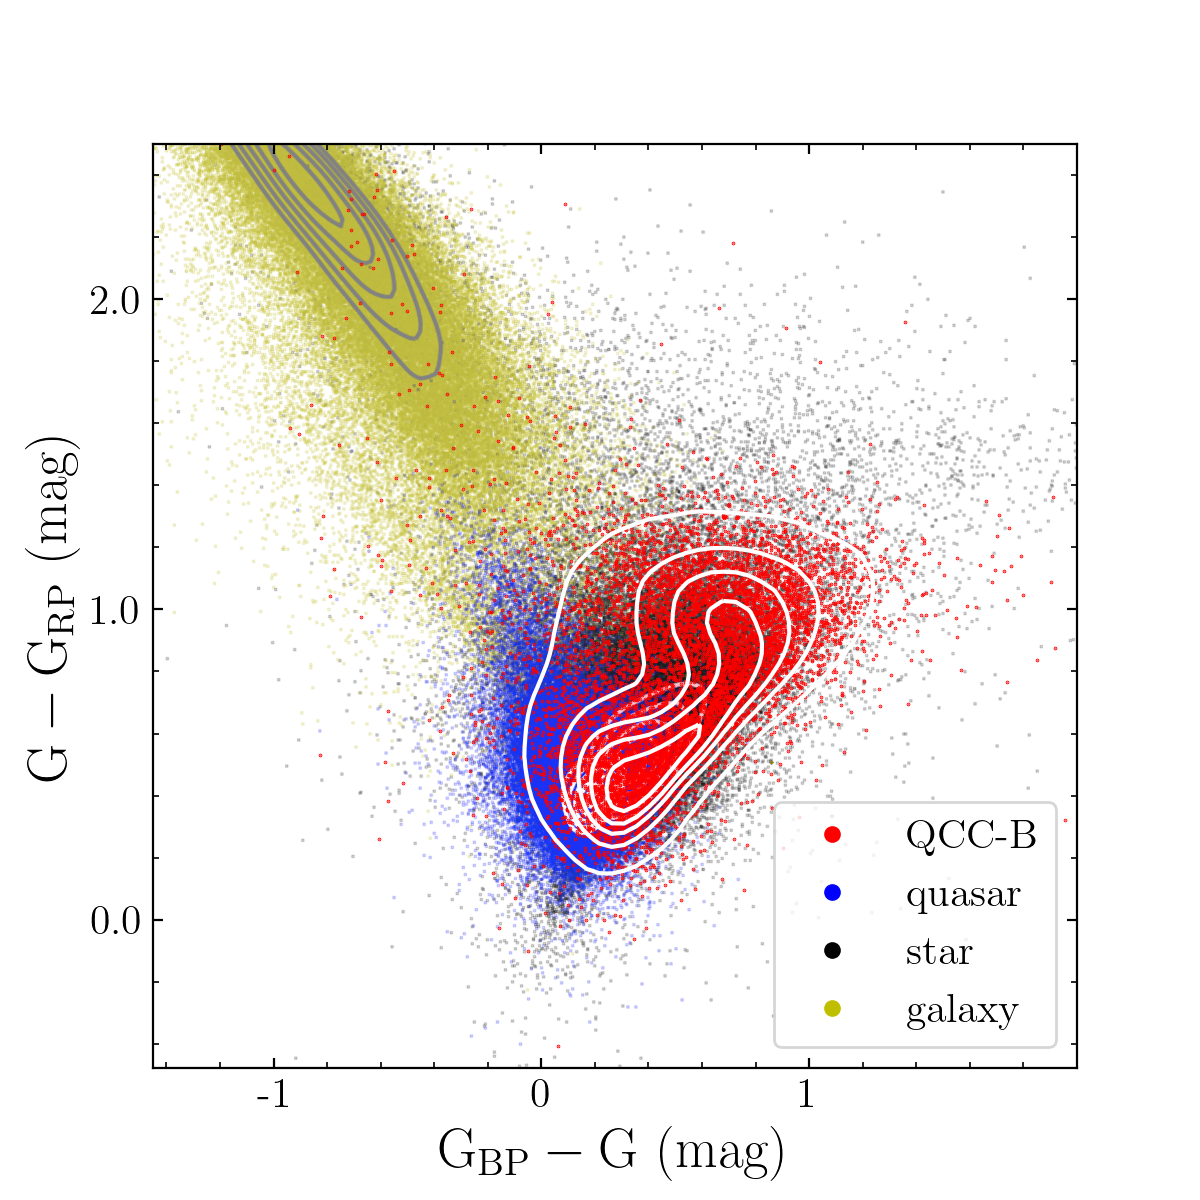
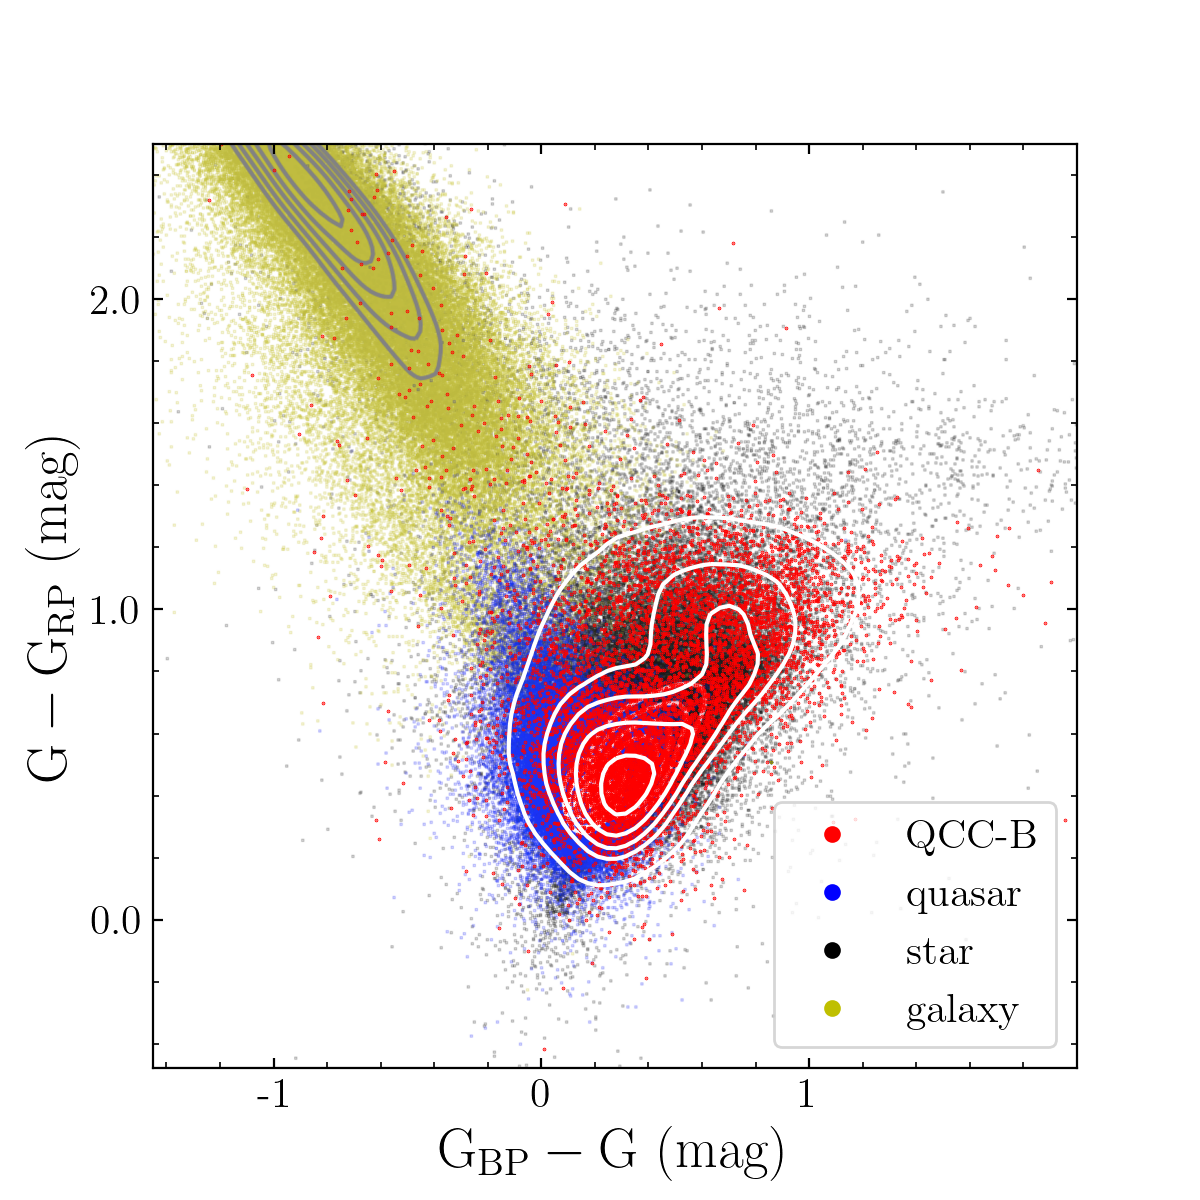
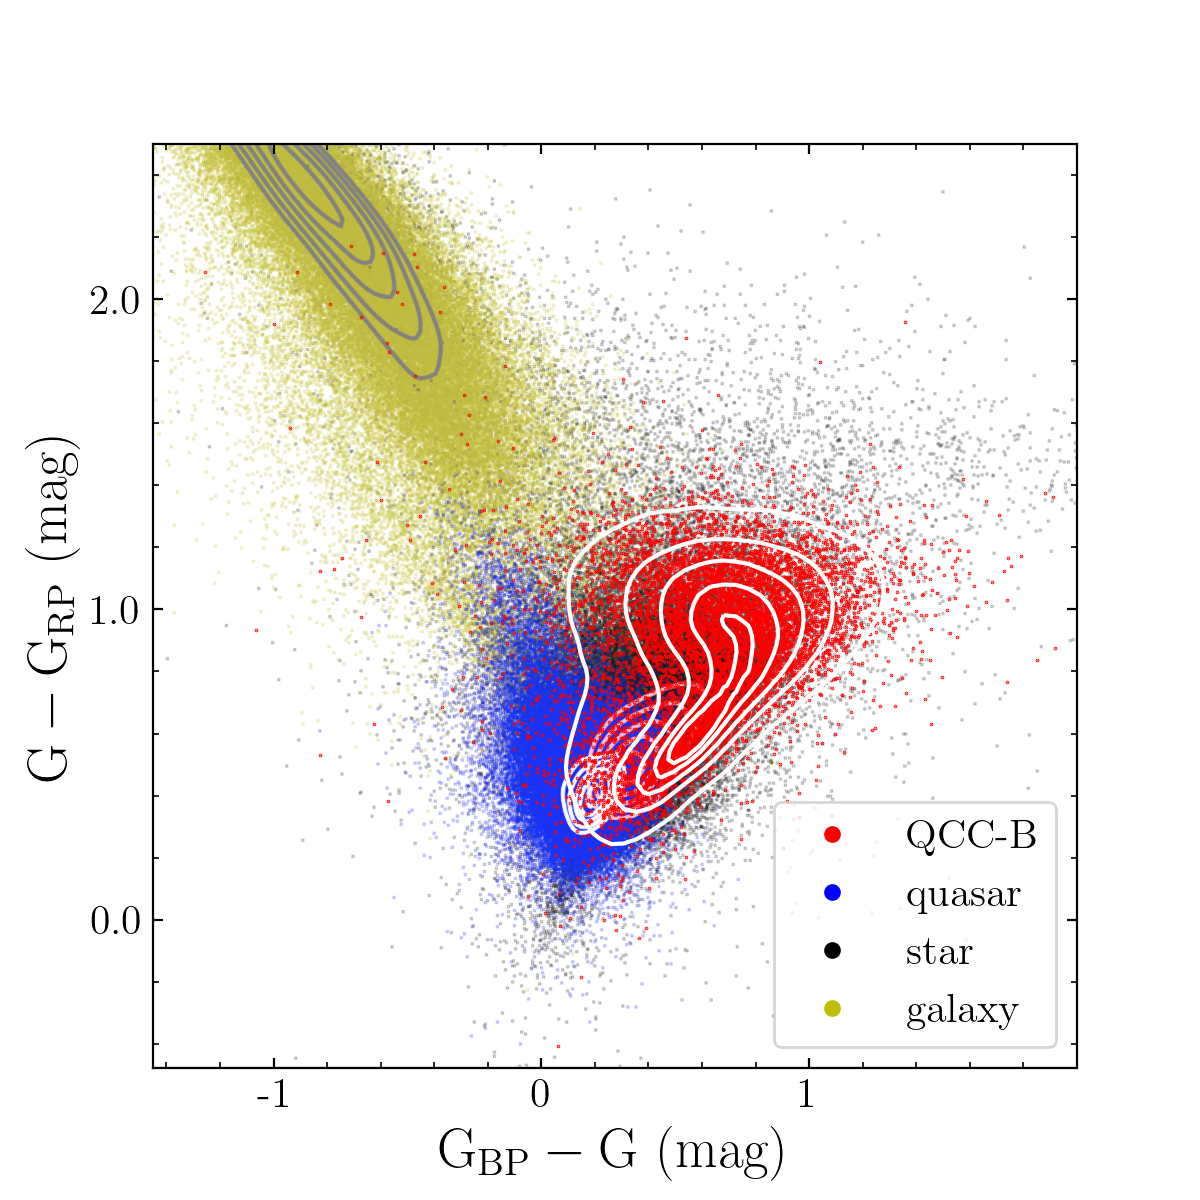
Another cause of the parallax and proper motion bias might be stellar contamination. Bailer-Jones et al. (2019) constructed a supervised classifier based on Gaussian Mixture Models to probabilistically classify extragalactic objects in DR2. See Fig. 15, we plot the colour–colour diagram for our selection to compare with the training set coloured according to the true classes used in Bailer-Jones et al. (2019). We find that for the QCC-B subset, some sources locate at the quasar-star overlap area, which indicates the presence of star contamination. A rough estimate shows that the purity of QCC-B is about 42.2%-58.5% 666Two ways are implemented for the purity testing. A): we cross-matched QCC-B with SDSS DR16 and found that the purity of QCC-B was 58.5%. B): Gaia Collaboration et al. (2022b) provided a low purity (50%-70%) QSO candidate table with 6.6 million sources (QCT hereafter) and a QSO sub-sample with 95% purity (QSS hereafter). For the 316,683 sources in QCC-B, 54,343 sources are found in QSS, 38,266 sources are found in QCT but not in QSS. Then we matched the remaining 224,074 sources with SDSS DR16, and the purity of these sources is about 28% according to the spectroscopic classifications of 79,154 common sources. Based on these results, the purity of QCC-B is estimated to about 42.2%-44.6%. Using the same methods, the purity of the overall QCC is about 87.8%-91.3%, which is consistent with our conclusion in Section 3.1..
According to above investigation, there is obvious stellar contamination in QCC-B, which will lead to confusion when using QCC. So it is necessary to further reduce the stellar contamination and select purer sample. Heintz et al. (2018) came up with an idea that is a more strict and effective criterion for identifying quasars. We investigated the distribution of the quasars in EDR3 AGN catalog, 90% of these quasars have a less than 2. After applying this criteria to QCC-B, we find the mean parallax and proper motion bias is significantly reduced, see Table 4. Moreover, the standard deviations of the best-fit Gaussian distributions in Fig. 9 are 1.055, 1.106 and 1.074 for the QCC-A, QCC-B and QCC-B () subset, respectively. In Fig. 11, the corresponding standard deviations of the best-fit Gaussian distributions are 1.062, 1.840 and 0.990 for , and 1.072, 1.870 and 1.087 for , respectively. Stricter criteria of proper motions significantly reduce the standard deviations of the best-fit Gaussian distributions of parallax and proper motion, and the distribution of the sources with is closer to the quasar region in Fig. 15, which indicates a more reliable quasar candidates. To further reduce stellar contamination in the sample, we select 99,673 sources with and in the QCC-B () subset. And their average parallax, and are 1.648.2 , 0.238.7 and -15.341.0 respectively, which indicates smaller bias and residuals in these astrometric parameters. We have also marked these sources as reliable quasar candidates (RQC) in our catalog, and the purity of RQC we estimated was about 73.1%-85.2% 777Referring to the approach to estimate the purity of QCC-B in this section, the purity of RQC estimated by method A and B is 85.2% and 73.1%-78.9%, respectively..


 (A)
(A)
|
 (B)
(B)
|

 (A)
(A)
|
 (B)
(B)
|
 (A)
(A)
|
 (B)
(B)
|
 (C)
(C)
|
 (D)
(D)
|
| Parameters | EDR3 AGN | QCC-A | QCC-B | QCC-B |
|---|---|---|---|---|
| Number | 1614173 | 1186690 | 316683 | 175168 |
| Median of Gmag (mag) | 20.06 | 20.00 | 20.49 | 20.49 |
| Weighted average of parallax (as) | -21.89.6 | -22.010.1 | 90.487.1 | 33.271.0 |
| Weighted average of (as/yr) | -0.311.3 | -0.611.5 | -2.5247.8 | 0.567.0 |
| Weighted average of (as/yr) | -1.510.4 | -1.110.4 | -224.2254.1 | -51.490.2 |
4 Discussion
4.1 Quasar candidates in the Galactic plane
As seen in Eq 1, to lower the possibility of stellar contamination, the quasar-like objects identified in EDR3 and QCC have ruled out the objects within the Galactic plane (). The coolest brown dwarfs and the most heavily dust-reddened stars will exhibit similar WISE colors as quasars near the Galactic plane (Stern et al. 2012). Kirkpatrick et al. (2011) showed that stars of spectral class later than T1 dwarfs have W1-W2 0.8 mag, which means that the color selection criterion from the WISE data is not working effectively near the Galactic plane. The most reliable way to identify a quasar near the Galactic is the spectrum method, such as LAMOST Spectroscopic Survey of the Galactic Anti-center (LSSGAC) (Liu et al. 2013). With the spectral data, Huo et al. (2017) presented a sample of 151 quasars discovered in an area near the Galactic Anti-Center. Machine learning is another important method. Fu et al. (2021) synthesized quasars and galaxies behind the Galactic plane and applied the XGBoost algorithm to Pan-STARRS1 (PS1) (Flewelling et al. 2020) and AllWISE photometry for quasar classification, in which they obtained the Quasars behind the Galactic Plane (GPQ) candidate catalog with 160,946 sources located at . Since the quasars are very important, under the situation of lacking spectrum data, we intend to check the reliability of these quasar candidates by analyzing their astrometric solutions.
Cross matching near the Galactic Equator is heavily affected by the confusion sources, which may lead to problematic cross-matching (Gaia Collaboration et al. 2022a). Therefore, we carefully matched with the PS1 source_id provided by GPQ and the provided by Archive. Note that although this will improve the accuracy of the match, the problematic matching may still exist. We obtained 133,798 common sources of GPQ and EDR3. Among them, there are 76,225 five-parameter sources and 37,684 six-parameter sources in the magnitude range from 6 to 21 Gmag. For comparison, we have selected the quasar candidates near the Galactic plane () in FRS, all candidates from EDR3_AGN catalog and spectroscopic confirmed quasars from LAMOST DR7 (LAMOST DR7Q hereafter) (http://dr7.lamost.org/v2.0/). See Table 5 and Table 6 for the mean parallax and proper motion of each quasar sample. Except for GPQ, the mean parallaxes of five-parameter sources for each sample are consistent with each. Additionally, for the six-parameter sources, the mean parallaxes of GPQ and LAMOST DR7Q are obviously different from EDR3_AGN catalog. And for the mean proper motions of these samples, GPQ is evidently different from other catalogs in both 5-parameter and 6-parameter sources. Assuming that quasars in different Galactic latitudes have similar astrometric system errors, the significant positive mean parallax and negative mean proper motion of GPQ six-parameter sources might be caused by stellar contamination. We will discuss the systematic errors in different sky regions in detail in Appendix A.
The team provided a parallax bias correction model, which proposes that the parallax bias is at least related to the g-band magnitude G, ecliptic latitude and photometric parameter . For the faint sources, this model is derived from the quasar candidates of EDR3 AGN (Lindegren et al. 2021a). To investigate the effectiveness of this model in the Galactic plane, we apply it to the GPQ and LAMOST DR7Q quasar samples. Again, we use FRS and EDR3_AGN catalog as comparisons. See Table 5, for the five-parameter sources, the parallax biases of the FRS and LAMOST DR7Q samples are corrected to about 5 , while 26.5 and 0.5 for the GPQ and EDR3 AGN catalog, respectively. For the six-parameter sources, the parallax biases of GPQ and LAMOST DR7Q samples deviate significantly from zero, suggesting the correction model is not working effectively. These results indicate that (i) The crowded sky near the Galactic Equator may have caused significant GPQ matching errors; (ii) There might be a stellar contamination with the GPQ sample, especially in the six-parameter sources; (iii) Compared to high Galactic latitude regions, the photometric data obtained from the Galactic plane follow different probability distribution. Therefore, the parallax bias correction model provided by the team is not working effectively in the Galactic plane.
| Parallax (as) | Parallax after correction (as) | |||||
| Number | weighted average | median | weighted average | median | ||
| GPQs | 5-parameter | 76225 | 5.6 | -6.7 | 26.5 | 10.4 |
| 6-parameter | 37684 | 25.0 | 13.7 | 43.7 | 32.9 | |
| -FRS ( <) | 5-parameter | 5844 | -19.4 | -15.0 | 5.4 | 5.7 |
| LAMOST DR7Q | 5-parameter | 38016 | -16.2 | -22.5 | 7.4 | -3.5 |
| 6-parameter | 4379 | -35.6 | -45.5 | -19.4 | -32.2 | |
| EDR3 AGN | 5-parameter | 1215942 | -21.2 | -17.8 | 0.5 | 0.2 |
| 6-parameter | 398231 | -27.5 | -28.5 | -8.9 | -9.1 | |
| (as/yr) | (as/yr) | |||||
| Number | weighted average | median | weighted average | median | ||
| GPQs | 5-parameter | 76225 | -10.1 | -15.4 | -80.1 | -8.4 |
| 6-parameter | 37684 | -222.0 | -61.5 | -382.8 | -70.7 | |
| -FRS ( <) | 5-parameter | 5844 | 0.1 | 3.7 | 0.3 | 3.7 |
| LAMOST DR7Q | 5-parameter | 38016 | -3.1 | -2.0 | 0.4 | -1.9 |
| 6-parameter | 4379 | 2.4 | 6.4 | 4.3 | 3.0 | |
| EDR3 AGN | 5-parameter | 1215942 | -0.3 | -0.1 | -1.3 | -1.3 |
| 6-parameter | 398231 | -0.6 | -2.2 | -4.4 | -4.0 | |
4.2 Quasar candidates with abnormal astrometric behavior
There are lots of spectroscopically identified quasars contained in the catalogs listed in Table 1 and Table 3. However, the astrometric parameters of some quasars are significantly abnormal. For example, some quasars have large bias in proper motion and parallax, or have obvious position difference between DR2 and EDR3. This indicates that ’s high-precision observations could detect the jitter of these quasars, or as mentioned in Shen et al. (2021) and Chen et al. (2022), they might be special quasars, such as quasar pairs and lensed quasars, which are important in exploring the evolution of galaxies and finding double black holes. On the other hand, these quasars are not suitable for establishing the celestial reference frame. Therefore, it is necessary to exclude them from the quasar candidates used for the celestial reference frame.
We made a preliminary attempt to select such abnormal astrometric quasars. We have selected SDSS quasars with more than one corresponding source in EDR3 within . These quasars may be affected by nearby sources, therefore, they have large positional errors. For the sources with a single matched within a radius of the SDSS position, inspired by Lindegren et al. (2021b), we have selected some abnormal astrometric quasar candidates based on several astrometric parameters. These parameters with large values indicate a bad fit of each source or probably are unsolved double stars. We checked the SDSS images of these spectroscopically confirmed quasars with such astrometric behavior and found that most of them are extended-source obviously. Fig. 16 shows four sources of such quasars: (A) and (B) are SDSS quasars with two matches within radius, while (C) and (D) are two arbitrary quasars among sources selected based on the above parameters. Among them, Fig. 16 (D) is an image of J013958.43+321631.6, whose corresponding values are 10.673754 mas, 5.370112 for and , respectively. Although most of them have near-zero parallaxes and proper motions, their positions are not reliable due to the large astrometric jitter observed by or the presence of other sources very close to them ( 1 arcsec). Therefore, we should remove these sources when establishing the celestial reference frame. More details could be found in (Wu et al. 2022). Based on this study, we have found 284 abnormal astrometric quasars in QCC and flagged them in our catalog.
 (A)
(A)
|
 (B)
(B)
|
 (C)
(C)
|
 (D)
(D)
|
4.3 Limitation of this work
Selecting quasar candidates with astrometric and mid infrared data has been proved to be effective and reliable. Based on this, we have selected millions of quasar candidates with Gaia and AllWISE data. These quasar candidates with high completeness and purity will be important in the process of realizing the celestial reference frame.
However, there are still some limitations in our approach. First of all, as we emphasized in Section 3.3, Gaia EDR3 use only 34 months observations, which greatly affects the astrometric solutions. These results will affect the purity of the quasar sample selected by astrometric methods. With longer observations in the future, this situation will be improved. Secondly, the number of quasars identified by this method heavily depend on the number of objects with infrared data provided by AllWISE, which means our quasar candidate catalog ruled out many sources that not been observed by AllWISE. As discussed in Section 3.1, the completeness and purity will decrease with fewer WISE observation. Therefore, our quasar sample is less complete and pure than the quasar candidates provided by Gaia (Gaia Collaboration et al. 2022a). Thirdly, due to the heavy dust in the crowded areas such as the Galactic plane and LMC/SMC, the WISE color loses its effectiveness to distinguish brown dwarfs and the dust-reddened stars from quasars. In such cases, the selection results with our method should be used with caution. Further efforts are required to identify quasars in these crowded areas. Implementing spectroscopic surveys to these areas is the most reliable way. And using machine learning methods with explicit account for the Galactic extinction and reddening to provide external catalogues specially for the Galactic plane is also a feasible approach.
As claimed by Høg (2014), astrometric detection of quasars, i.e. to identify quasars only from the characteristics of zero proper motion and parallax, which is unbiased by any assumptions on spectra, might lead to discovery of a new kind of extragalactic point sources (Heintz et al. 2015). This issue can be verified with more observations and more accurate astrometry data in the future.
5 Summary and Conclusions
Quasars are one type of active galactic nuclei. Because of their bright centers and point-like appearances, quasars are the perfect objects to establish the celestial reference frame. The 3rd realization of the International Celestial Reference Frame (ICRF3) is established by 4588 sources at radio wavelengths, there are about 22% of sources show great offset in optical and radio positions (Charlot et al. 2020). With the high-precision astrometric parameters for more than 1.8 billion sources of Early Data Release 3 (EDR3), lots of quasar candidates can be identified. To establish a non-rotating celestial reference frame in the optical band, we need a reliable catalog with a large number of quasars. In this paper, we used the astrometry data of EDR3 and color data of AllWISE to identify quasar candidates and made a comprehensive evaluation of them.
A quasar candidate catalog (QCC) of 1,503,373 sources (about 90% purity) is obtained by astrometric and mid-infrared methods in EDR3, which has 1,186,690 (78.9%) candidates in common with EDR3’s AGN catalog. The purity of 316,683 newly identified quasar candidates is about 42.2%-58.5%. Compared with LQAC5, the completeness of our catalog is around 80%, and we randomly select 4171 common sources of our catalog and SDSS DR16, according to the spectrums of SDSS, about 99.7% of which are quasars, 94.0% are point-like sources. Compared to the previous similar research (Guo et al. 2018), we have selected more quasar candidates (1,503,373 versus 662,753) with higher purity (90% versus 77%). Star contamination is present in the newly identified subset and the purity of this subset improved significantly after we used more stringent astrometric and color conditions. In addition, we found that the purity of quasar candidates selected by mid-infrared and astrometric data decreases around the LMC/SMC, area near the Galactic Equator and at the fainter magnitude.
We find that the parallax correction model of EDR3 cannot be directly applied to sources near the Galactic plane, especially to the 6-parameter sources. We also select the quasars with abnormal astrometric behavior, which are not suitable for establishing the celestial reference frame and should be excluded from the quasar candidates for such purpose. We can foresee that with the future release of data, the identification of quasars using astrometric methods will have increasing reliablity.
Although have provided more than six millions quasar candidates in DR3 (Gaia Collaboration et al. 2022b), the reliability of the quasar candidate list needs to be tested by the quasar catalog obtained by other methods. The quasar candidate catalog obtained by astrometric and mid-infrared methods will play an essential role to verify the future release of data.
Acknowledgements.
We thank the anonymous reviewers for their valuable suggestions. We used data from AllWISE to achieve this work: AllWISE makes use of data from WISE, which is a joint project of the University of California, Los Angeles, and the Jet Propulsion Laboratory/California Institute of Technology, and NEOWISE, which is a project of the Jet Propulsion Laboratory/California Institute of Technology, WISE and NEOWISE are funded by the National Aeronautics and Space Administration. And this work has made use of data from the European Space Agency (ESA) mission (https://www.cosmos.esa.int/gaia), processed by the Data Processing and Analysis Consortium (DPAC, https://www.cosmos.esa.int/web/gaia/dpac/consortium). Funding for the DPAC has been provided by national institutions, in particular the institutions participating in the Multilateral Agreement. We are also very grateful to the developers of the TOPCAT (Taylor 2005) software. This work has been supported by the Youth Innovation Promotion Association CAS, the grants from the Natural Science Foundation of Shanghai through grant 21ZR1474100, and National Natural Science Foundation of China (NSFC) through grants 12173069, and 11703065. We acknowledge the science research grants from the China Manned Space Project with NO.CMS-CSST-2021-A12 and NO.CMS-CSST-2021-B10.References
- Ahumada et al. (2020) Ahumada, R., Prieto, C. A., Almeida, A., et al. 2020, The Astrophysical Journal Supplement Series, 249, 3
- Ai et al. (2016) Ai, Y., Wu, X.-B., Yang, J., et al. 2016, The Astronomical Journal, 151, 24
- Andrei et al. (2012) Andrei, A. H., Souchay, J., Martins, R. V., et al. 2012, IAU Joint Discussion, 31
- Assef et al. (2018) Assef, R., Stern, D., Noirot, G., et al. 2018, The Astrophysical Journal Supplement Series, 234, 23
- Bailer-Jones et al. (2019) Bailer-Jones, C. A., Fouesneau, M., & Andrae, R. 2019, Monthly Notices of the Royal Astronomical Society, 490, 5615
- Bucciarelli et al. (1993) Bucciarelli, B., Lattanzi, M., & Taff, L. 1993, The Astrophysical Journal Supplement Series, 84, 91
- Charlot et al. (2020) Charlot, P., Jacobs, C., Gordon, D., et al. 2020, Astronomy & Astrophysics, 644, A159
- Chen et al. (2022) Chen, Y.-C., Hwang, H.-C., Shen, Y., et al. 2022, The Astrophysical Journal, 925, 162
- Claeskens et al. (2006) Claeskens, J.-F., Smette, A., Vandenbulcke, L., & Surdej, J. 2006, Monthly Notices of the Royal Astronomical Society, 367, 879
- Croom et al. (2004) Croom, S. M., Smith, R., Boyle, B., et al. 2004, Monthly Notices of the Royal Astronomical Society, 349, 1397
- Cui et al. (2012) Cui, X.-Q., Zhao, Y.-H., Chu, Y.-Q., et al. 2012, Research in Astronomy and Astrophysics, 12, 1197
- Cutri et al. (2013) Cutri, R., Wright, E., Conrow, T., et al. 2013, VizieR Online Data Catalog: II/328
- Dong et al. (2018) Dong, X., Wu, X.-B., Ai, Y., et al. 2018, The Astronomical Journal, 155, 189
- Fabricius et al. (2021) Fabricius, C., Luri, X., Arenou, F., et al. 2021, Astronomy & Astrophysics, 649, A5
- Flesch (2017) Flesch, E. 2017, VizieR Online Data Catalog, VII
- Flesch (2021) Flesch, E. 2021, VizieR Online Data Catalog, VII
- Flesch (2015) Flesch, E. W. 2015, Publications of the Astronomical Society of Australia, 32, e010
- Flewelling et al. (2020) Flewelling, H. e., Magnier, E., Chambers, K., et al. 2020, The Astrophysical Journal Supplement Series, 251, 7
- Fu et al. (2021) Fu, Y., Wu, X.-B., Yang, Q., et al. 2021, The Astrophysical Journal Supplement Series, 254, 6
- Gaia Collaboration et al. (2022a) Gaia Collaboration, Klioner, S.A., Lindegren, L., Mignard, F., & et al. 2022a, A&A
- Gaia Collaboration et al. (2022b) Gaia Collaboration, Bailer-Jones, C., Teyssier, D., et al. 2022b, Astronomy & Astrophysics
- Gorski et al. (1999) Gorski, K. M., Wandelt, B. D., Hansen, F. K., Hivon, E., & Banday, A. J. 1999, arXiv preprint astro-ph/9905275
- Guo et al. (2018) Guo, S., Qi, Z., Liao, S., et al. 2018, Astronomy & Astrophysics, 618, A144
- Hagen et al. (1995) Hagen, H.-J., Groote, D., Engels, D., & Reimers, D. 1995, Astronomy and Astrophysics Supplement Series, 111, 195
- Heintz et al. (2015) Heintz, K. E., Fynbo, J. P., & Høg, E. 2015, Astronomy & Astrophysics, 578, A91
- Heintz et al. (2018) Heintz, K., Fynbo, J., Høg, E., et al. 2018, Astronomy & Astrophysics, 615, L8
- Hewett et al. (1995) Hewett, P. C., Foltz, C. B., & Chaffee, F. H. 1995, The Astronomical Journal, 109, 1498
- Høg (2014) Høg, E. 2014, arXiv preprint arXiv:1408.2190
- Huo et al. (2017) Huo, Z.-Y., Liu, X.-W., Shi, J.-R., et al. 2017, Research in Astronomy and Astrophysics, 17, 032
- Kirkpatrick et al. (2011) Kirkpatrick, J. D., Cushing, M. C., Gelino, C. R., et al. 2011, The Astrophysical Journal Supplement Series, 197, 19
- Lacy et al. (2004) Lacy, M., Storrie-Lombardi, L., Sajina, A, e., et al. 2004, The Astrophysical Journal Supplement Series, 154, 166
- Liao et al. (2019) Liao, S.-L., Qi, Z.-X., Guo, S.-F., & Cao, Z.-H. 2019, Research in Astronomy and Astrophysics, 19, 029
- Liao et al. (2021a) Liao, S., Qi, Z., Cao, Z., & Tang, Z. 2021a, Publications of the Astronomical Society of the Pacific, 133, 024501
- Liao et al. (2021b) Liao, S., Wu, Q., Qi, Z., et al. 2021b, Publications of the Astronomical Society of the Pacific, 133, 094501
- Lindegren et al. (2018) Lindegren, L., Hernández, J., Bombrun, A., et al. 2018, Astronomy & Astrophysics, 616, A2
- Lindegren et al. (2021a) Lindegren, L., Bastian, U., Biermann, M., et al. 2021a, Astronomy & Astrophysics, 649, A4
- Lindegren et al. (2021b) Lindegren, L., Klioner, S., Hernández, J., et al. 2021b, Astronomy & Astrophysics, 649, A2
- Liu et al. (2013) Liu, X.-W., Yuan, H.-B., Huo, Z.-Y., et al. 2013, Proceedings of the International Astronomical Union, 9, 310
- Lyke et al. (2020) Lyke, B. W., Higley, A. N., McLane, J., et al. 2020, The Astrophysical Journal Supplement Series, 250, 8
- Mainzer et al. (2011) Mainzer, A., Bauer, J., Grav, T., et al. 2011, The Astrophysical Journal, 731, 53
- Massaro et al. (2015) Massaro, E., Maselli, A., Leto, C., et al. 2015, Astrophysics and Space Science, 357, 1
- Mateos et al. (2012) Mateos, S., Alonso-Herrero, A., Carrera, F. J., et al. 2012, Monthly Notices of the Royal Astronomical Society, 426, 3271
- Mignard & Klioner (2012) Mignard, F., & Klioner, S. 2012, Astronomy & Astrophysics, 547, A59
- Mignard et al. (2018) Mignard, F., Klioner, S., Lindegren, L., et al. 2018, Astronomy & astrophysics, 616, A14
- Pâris et al. (2018) Pâris, I., Petitjean, P., Aubourg, É., et al. 2018, Astronomy & Astrophysics, 613, A51
- Prusti et al. (2016) Prusti, T., de Bruijne, J., Vallenari, A., et al. 2016, Astronomy & Astrophysics, 595, A1
- Qi et al. (2015) Qi, Z., Yu, Y., Bucciarelli, B., et al. 2015, The Astronomical Journal, 150, 137
- Richards et al. (2006) Richards, G. T., Lacy, M., Storrie-Lombardi, L. J., et al. 2006, The Astrophysical Journal Supplement Series, 166, 470
- Schmidt (1963) Schmidt, M. 1963, Nature, 197, 1040
- Secrest et al. (2015) Secrest, N., Dudik, R., Dorland, B., et al. 2015, The Astrophysical Journal Supplement Series, 221, 12
- Sharp et al. (2001) Sharp, R., McMahon, R., Irwin, M., & Hodgkin, S. 2001, Monthly Notices of the Royal Astronomical Society, 326, L45
- Shen et al. (2021) Shen, Y., Chen, Y.-C., Hwang, H.-C., et al. 2021, Nature Astronomy, 5, 569
- Shu et al. (2019) Shu, Y., Koposov, S. E., Evans, N. W., et al. 2019, Monthly Notices of the Royal Astronomical Society, 489, 4741
- Souchay et al. (2012) Souchay, J., Andrei, A., Barache, C., et al. 2012, Astronomy & Astrophysics, 537, A99
- Souchay et al. (2017) Souchay, J., Andrei, A. H., Barache, C., et al. 2017, Proceedings of the International Astronomical Union, 12, 75
- Souchay et al. (2009) Souchay, J., Andrei, A. H., Barache, C., et al. 2009, Astronomy & Astrophysics, 494, 799
- Souchay et al. (2015) Souchay, J., Andrei, A., Barache, C., et al. 2015, Astronomy & Astrophysics, 583, A75
- Souchay et al. (2019) Souchay, J., Gattano, C., Andrei, A., et al. 2019, Astronomy & Astrophysics, 624, A145
- Stern et al. (2005) Stern, D., Eisenhardt, P., Gorjian, V., et al. 2005, The Astrophysical Journal, 631, 163
- Stern et al. (2012) Stern, D., Assef, R. J., Benford, D. J., et al. 2012, The Astrophysical Journal, 753, 30
- Taylor (2005) Taylor, M. B. 2005, in Astronomical data analysis software and systems XIV, Vol. 347, 29
- Véron-Cetty & Véron (2010) Véron-Cetty, M.-P., & Véron, P. 2010, Astronomy & Astrophysics, 518, A10
- Wright et al. (2010) Wright, E. L., Eisenhardt, P. R., Mainzer, A. K., et al. 2010, The Astronomical Journal, 140, 1868
- Wu et al. (2022) Wu, Q.-Q., Liao, S.-L., Ji, X., et al. 2022, Frontiers in Astronomy and Space Sciences, 9
- Yao et al. (2019) Yao, S., Wu, X.-B., Ai, Y., et al. 2019, The Astrophysical Journal Supplement Series, 240, 6
- Zhao et al. (2012) Zhao, G., Zhao, Y.-H., Chu, Y.-Q., Jing, Y.-P., & Deng, L.-C. 2012, Research in Astronomy and Astrophysics, 12, 723
Appendix A The astrometric system error of different sky regions
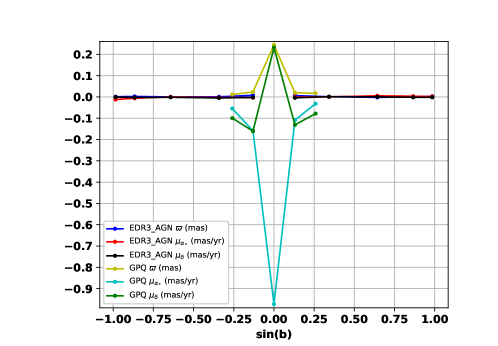
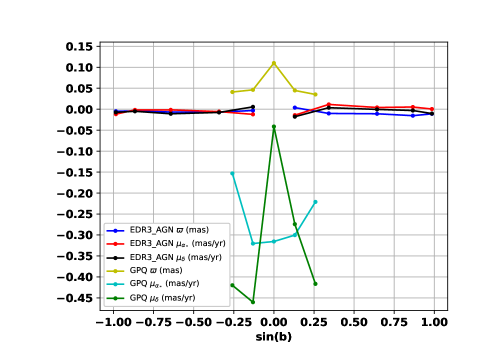
In Section 4.1, we found possible stellar contamination in GPQ, especially the six-parameter sources in this catalog. These conclusions are based on the assumption that sources in different sky regions possess similar systematic errors. The sources in GPQ are close to the Galactic Equator, so we investigated the variation of astrometric system error with Galactic latitude. We found that most of the sources in GPQ are located at the region of , and only 3993 (3.51%) sources have a Galactic Latitude less than (and larger than ). This means that the GPQ and EDR3_AGN catalogs have some overlapping sky regions, which is (overlap-region here after). Therefore, we calculated the mean proper motion and corrected parallax of sources at different Galactic latitudes. Fig. 17 shows the distributions of astrometric system errors. Firstly, both 5-parameter and 6-parameter sources with in GPQ have a obvious systematic errors. The number of sources in these regions is very small (about 3,000), which makes the average value of system errors easy to be significantly affected by some extreme values, so these system errors might be unreliable. Secondly, at the overlap-region, the systematic errors of most sources in GPQ is larger than that of sources in EDR3_AGN, especially for 6-parameter sources. Thirdly, for EDR3_AGN, the systematic error of the sources has no obvious change at high Galactic latitude.
 (A)
(A)
|
 (B)
(B)
|