Constraining AGN feedback model with SZ profile
Abstract
Relativistic jets from AGN have a wide range of impacts on galaxy groups and clusters and are key for understanding their formation and physical properties. However, this non-gravitational process is not well understood. Galaxy groups with shallow gravitational potentials are ideal laboratories to study and constrain the AGN feedback model. We studied hot gas in 66,000 SDSS LRG halos with an average halo mass of M⊙ using the Planck tSZ map. We have detected their average tSZ radial profile at 17 and compared it with the cosmo-OWLS cosmological hydrodynamical simulations with different AGN feedback models. The best agreement has been obtained for the AGN 8.0 model in the simulations. We have also compared our measured tSZ profile with the prediction from the universal pressure profile assuming the self-similar relation and found them consistent if the model accounts for the clustering of neighboring haloes via a two-halo term.
1 Introduction
A power-law relation between the electron (or gas) pressure and mass, , is valid under the assumption that the galaxy-formation process is dominated by gravity, called self-similar relation. Any deviation from this relation points to the presence of more complex processes such as baryonic feedback effects. X-ray and SZ observations demonstrate that massive galaxy clusters almost follow the self-similar scaling relation Planck2013b . On the other hand, numerous X-ray observations find a deficit of baryonic gas inside low-mass halos compared to the cosmic average baryon fraction Gastaldello2007 ; Pratt2009 ; Sun2009 ; Gonzalez2013 , implying the deviation from the self-similar scaling relation. The gas deficit may be caused by AGN feedback: the response of the intracluster medium (ICM) to the relativistic plasma ejected by the active galactic nuclei (AGN) Gitti2012 . The AGN feedback is key for understanding the evolution of galaxies and the formation of large-scale structures; however, not well understood.
2 Stacking map centered on LRGs
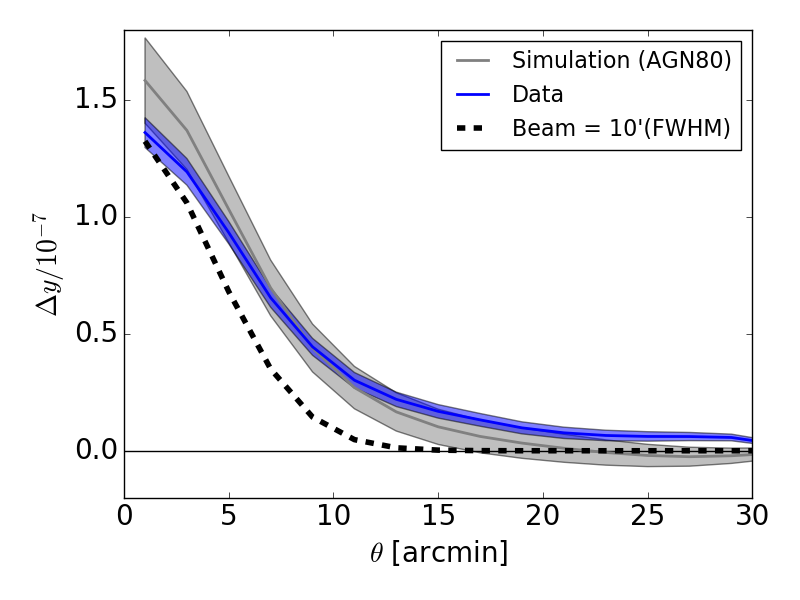
We performed a stacking analysis using the Planck map Planck2016-XXII for Sloan Digital Sky Survey (SDSS) data release 7 (DR7) luminous red galaxies (LRGs) at Blanton2005 , which are considered to be mostly central galaxies in dark matter halos Reid2009 . We constructed an average profile centered on the 66,479 LRGs with the stellar mass111The stellar masses of the LRGs are provided in the New York University Value-Added catalogue (NYU-VAGC) at http://sdss.physics.nyu.edu/vagc/ of , roughly corresponding to halo masses of . We detected a significant signal at out to 30 arcmins well beyond the extent of the 10 arcmin beam of the Planck map in Fig. 1.


3 Comparison with the cosmo-OWLS hydrodynamic simulations
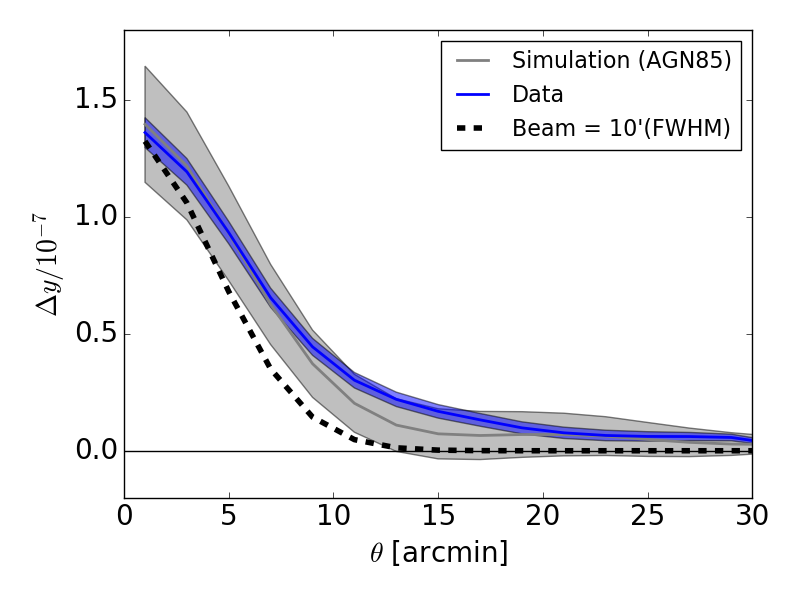
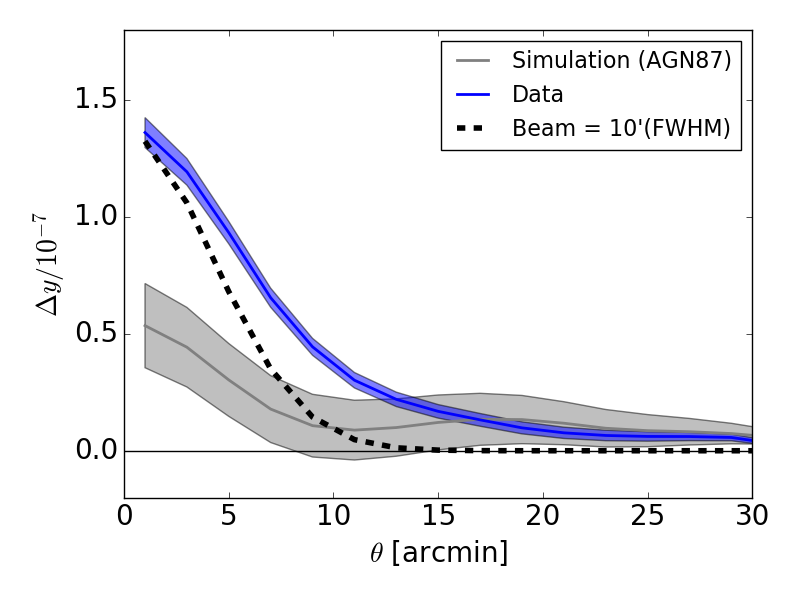
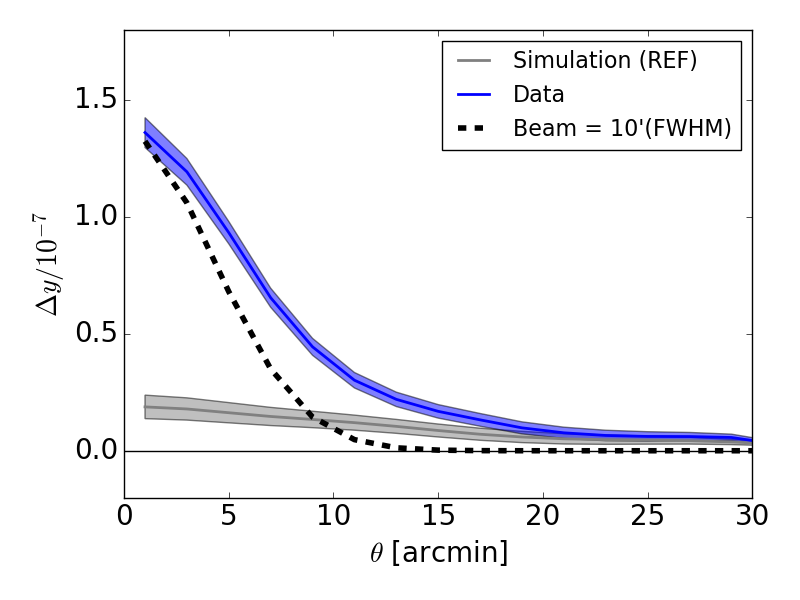
We compared the average profile around LRGs with predictions from the cosmo-OWLS cosmological hydrodynamical simulations Brun2014 ; Daalen2014 ; McCarthy2014 . The simulations are designed with cluster cosmology and large-scale structure surveys in mind. They consist of box-periodic hydrodynamical simulations and have volumes of 400 with baryonic and dark matter particles. They simulated five different models (Table. 1), which are compared with our measured profile in Fig. 2.
In the comparison, a clear difference between the data and REF model can be seen. In general, energy released from the center of a halo heats cluster gas, this in turn prevents cooling and thus the star formation around the central region. Therefore, if we consider halos of the same total mass, the stellar mass of the central galaxy is decreased as the power of the central AGN is increased. Since we select central galaxies based on stellar mass, lower-mass halos are selected in the REF model compared to the models that include AGN feedback. This is apparent as the lower central peak value of the simulated profiles in the REF model compared to the AGN models. We also see a visible trend in that the higher the power of AGN feedback, the lower the peak of profile. This is due to the fact that the AGN feedback ejects gas from the center of halos outward and the overall gas density is lowered.
In summary, this comparison agrees best with simulations that include AGN feedback (AGN 8.0) but not with simulations that do not include it (REF) or with simulations with very violent AGN feedback (AGN 8.7). The reduced values are 1.0 (AGN 8.0), 1.3 (AGN 8.5), 9.9 (AGN 8.7), and 75.9 (REF), respectively. This result is consistent with other studies showing that the AGN 8.0 model reproduces a variety of observed gas features in optical and X-ray data (e.g., Brun2014 ).
| Simulation | Cooling | Star formation | SN feedback | AGN feedback | |
|---|---|---|---|---|---|
| NOCOOL | No | No | No | No | … |
| REF | Yes | Yes | Yes | No | … |
| AGN 8.0 | Yes | Yes | Yes | Yes | K |
| AGN 8.5 | Yes | Yes | Yes | Yes | K |
| AGN 8.7 | Yes | Yes | Yes | Yes | K |


4 Halo model prediction with the UPP
The average profile around the LRGs is also compared with a prediction using the halo model with the halo mass function and halo bias Tinker2010 and a universal pressure profile (UPP) Planck2013-V in Fig. 3. The stellar masses of the LRGs are converted to halo masses using the stellar-halo mass relation from either Coupon2015 (C15-SHM) or Wang2016 (W16-SHM), estimated using gravitational lensing measurements. Then, the UPP is scaled to different masses of halos, assuming a self-similar relation. The predicted profile is consistent with the data, but only if we account for the two-halo clustering term in the model and if we assume the stellar-halo mass relation from C15-SHM or W16-SHM. This consistency may imply that the UPP, estimated for massive galaxy clusters in the mass range of M⊙, can be applied even in low-mass halos down to M⊙ in a self-similar manner.
5 Conclusion
According to the study with the cosmo-OWLS simulations Brun2015 , the AGN 8.0 simulation predicts more extended pressure profiles around low-mass halos than the UPP. However, the AGN 8.0 model also reproduces our observed profile, supporting a self-similar assumption. This apparent inconsistency is explained by the fact that the deviations from the self-similar relation in the AGN 8.0 simulation are mainly confined to halo masses below M⊙, which roughly corresponds to the average mass of our sample. Furthermore, the impact of coarse angular resolution of the Planck map is not negligible in our analysis: the UPP and AGN 8.0 pressure distributions only differ significantly on scales of in the simulations, in which they are compared without the beam. Thus, data from higher-resolution tSZ maps (such as those from ACT or SPT with FWHM of order an arcminute) would be necessary in this regard.

Acknowledgement
This research has been supported by the funding for the ByoPiC project from the European Research Council (ERC) under the European Union’s Horizon 2020 research and innovation programme grant agreement ERC-2015-AdG 695561.
References
- (1) Planck Collaboration, A&A, 557, A52 (2013)
- (2) Gastaldello, F., et al., ApJ, 669, 158 (2007)
- (3) Pratt, G. W., et al., A&A, 498, 361 (2009)
- (4) Sun, M., et al., ApJ, 693, 1142 (2009)
- (5) Gonzalez, A. H., et al., The Astrophysical Journal, 778, 14 (2013)
- (6) Gitti, Myriam, et al., Advances in Astronomy, 2012, 950641 (2012)
- (7) Planck Collaboration, A&A, 594, A22 (2016)
- (8) Blanton, Michael R., et al., AJ, 129, 2562-2578 (2005)
- (9) Reid, B. A., et al., AJ, 698, 143-154 (2009)
- (10) Le Brun, Amandine M. C., et al., MNRAS, 440, 1270-1290 (2014)
- (11) van Daalen, M. P., et al., MNRAS, 441, 2997-3010 (2014)
- (12) McCarthy, I. G., et al., MNRAS, 440, 3645-3657 (2014)
- (13) Tinker, Jeremy L., et al., ApJ, 724, 878-886 (2010)
- (14) Planck Collaboration, A&A, 550, A131 (2013)
- (15) Coupon, J., et al., MNRAS, 449, 1352-1379 (2015)
- (16) Wang, W., et al., MNRAS, 456, 2301-2320 (2016)
- (17) Le Brun, Amandine M. C., et al., MNRAS, 451, 3868-3881 (2015)