The Straw Tracking Detector for the Fermilab Muon Experiment
Abstract
The Muon Experiment at Fermilab uses a gaseous straw tracking detector to make detailed measurements of the stored muon beam profile, which are essential for the experiment to achieve its uncertainty goals. Positrons from muon decays spiral inward and pass through the tracking detector before striking an electromagnetic calorimeter. The tracking detector is therefore located inside the vacuum chamber in a region where the magnetic field is large and non-uniform. As such, the tracking detector must have a low leak rate to maintain a high-quality vacuum, must be non-magnetic so as not to perturb the magnetic field and, to minimize energy loss, must have a low radiation length. The performance of the tracking detector has met or surpassed the design requirements, with adequate electronic noise levels, an average straw hit resolution of , a detection efficiency of 97% or higher, and no performance degradation or signs of aging. The tracking detector’s measurements result in an otherwise unachievable understanding of the muon’s beam motion, particularly at early times in the experiment’s measurement period when there are a significantly greater number of muons decaying. This is vital to the statistical power of the experiment, as well as facilitating the precise extraction of several systematic corrections and uncertainties. This paper describes the design, construction, testing, commissioning, and performance of the tracking detector.
1 Introduction
The Muon Experiment (E989) at the Fermi National Accelerator Laboratory (Fermilab) aims to measure the muon magnetic anomaly, , to high precision. Analysis of the Run-1 data has determined to 462 parts per billion (ppb) [1, 2, 3, 4] with a systematic uncertainty of 157 ppb and has confirmed the previous result from the Brookhaven National Laboratory Experiment (E821) [5, 6, 7]. The Fermilab experiment’s sensitivity to a muon electric dipole moment (EDM) will be two orders of magnitude beyond the limit set by E821 [8].
Essential to achieving these goals are the experiment’s two straw tracking detector stations. They provide non-destructive, time-dependent beam-profile measurements, by extrapolating the reconstructed trajectories of the positrons emitted when the muons decay. The experiment determines [1] by measuring two quantities: the spin precession frequency of the muons [3, 2] circulating in the storage ring and the magnetic field [4] that confines the muons to the storage ring and causes their spin to precess relative to their momentum. The beam-profile measurements from the tracking detector are integral to the precise extraction of both these quantities and, therefore, the precise measurement of . They have contributed significantly to the overall understanding of the necessary systematic corrections and uncertainties, and allow the data from the experiment’s electromagnetic calorimeters to be fit from an earlier time than would be otherwise possible, resulting in the ability to capitalize on the higher number of positrons that are detected earlier in the measurement period. Horizontal and vertical betatron frequencies of the muon beam motion are extracted from the time dependence of beam profile measurements [2]. The combined beam profile and magnetic field measurements determine the average magnetic field traversed by the muons [4].
The requirements of the detector to adequately perform these measurements are significantly defined by the experimental environment. They must have an acceptable radiation length to avoid significant degradation of the positron energy measurement by the downstream calorimeters, have a low leak rate despite thin straw walls to maintain a high-quality vacuum, and must be nonmagnetic to ensure they do not perturb the highly uniform magnetic field. The tracking detector stations were installed in the experiment in 2017 and have operated successfully without any significant issues since that time.
This paper focuses on design and construction of the tracking detector. The design of the tracking detector is described in Section 2, followed by details of the construction in Section 3 and the frontend electronics/data acquisition system in Section 4. Section 5 describes the testing and installation of the detector, and the subsequent commissioning and experimental performance are detailed in Section 6.
2 Design
2.1 Detector Principles and Location
The tracking detector provides non-destructive, time-dependent measurements of the stored muon beam-profile that are crucial to the experiment’s determination of and for the extraction of , and paramount for its sensitivity to a muon EDM. The primary analysis outputs of the tracking detector are positron trajectories from the decays of a high-rate of muons, henceforth referred to as ‘tracks’. The tracks are reconstructed from positron hits in the tracking detector and are used to obtain associated properties such as momentum and position. Hits are recorded in the detector for s, commencing 2 s after the muon beam enters the storage ring, with the beam arriving in 16 separate spills over a 1.4 s period. All track times are measured relative to the injection time of the muon beam into the storage ring.
Extrapolation of tracks back to the point of azimuthal tangency gives an estimate the position of the parent muon at the time of decay. Extrapolation at the accuracy needed requires multiple measurements (at a high rate) of the particle’s three-dimensional position along a number of points. These measurements define the track, from which its momentum can also be determined due to the presence of the magnetic field. The fundamental design objective of the detector is to maximize the number of reconstructed tracks and the precision with which the track properties are determined, whilst minimizing any detrimental effects on other systems.
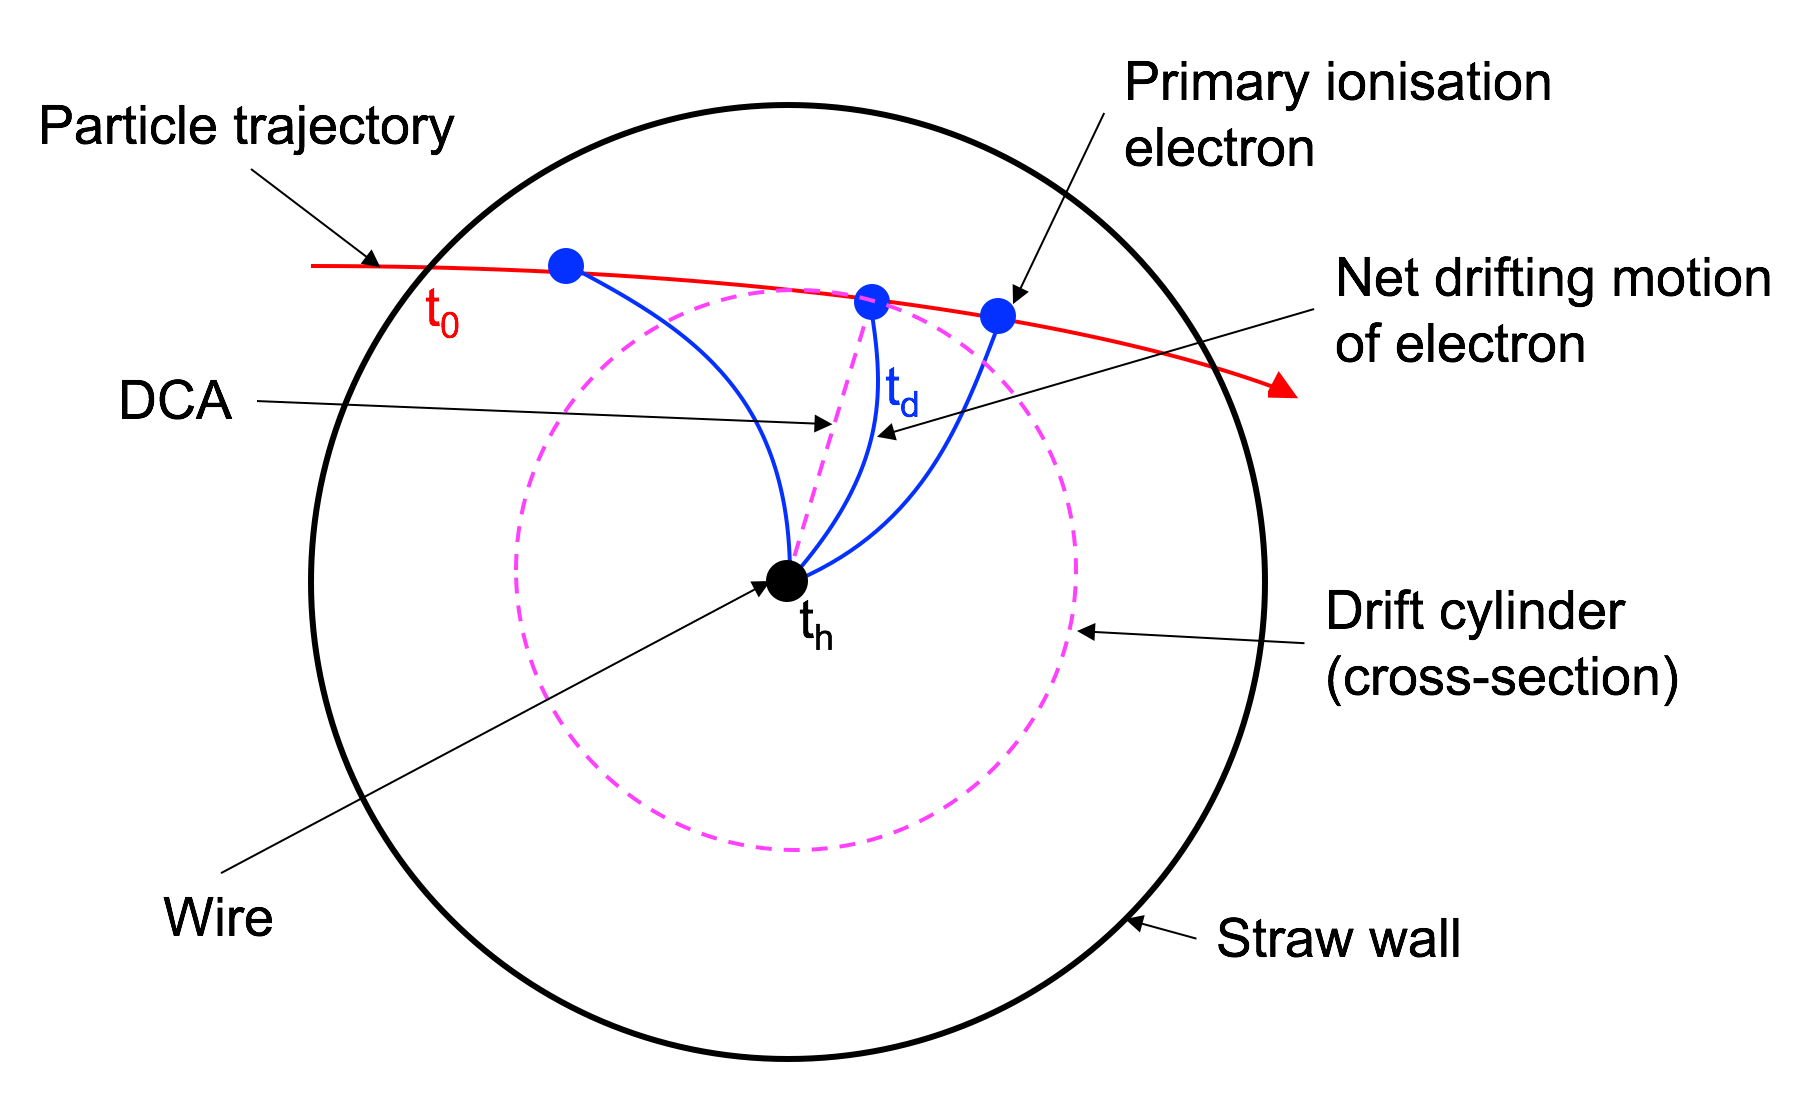
To meet the physics goals and design constraints, the tracking detector is built from straw chambers arranged in planes oriented to optimize measurement of the positron tracks in their horizontal bending plane. The straws in the tracking detector layers detect electrons and ions produced when a decay positron passes through a gas-filled straw.555Multiple electrons may be produced in a single collision, with the resulting free electrons referred to as a cluster. Each straw contains a central wire held at high voltage (HV) acting as an anode; the grounded straw walls acting as a cathode. Ionization electrons initially drift radially inward in the resulting electric field, but are deflected by the storage ring’s magnetic field. The signal induced in the wire by drifting electrons and the avalanches they create in the high field indicates the passage of the charged particle.666Primary electrons produced by ionization from the traversing decay positron incur subsequent ionization of the gas producing secondary electrons, and so on. Ions produced in the avalanche also induce a delayed ( relative to the electrons) signal in the wire which is safely suppressed by the electronics to avoid interference.
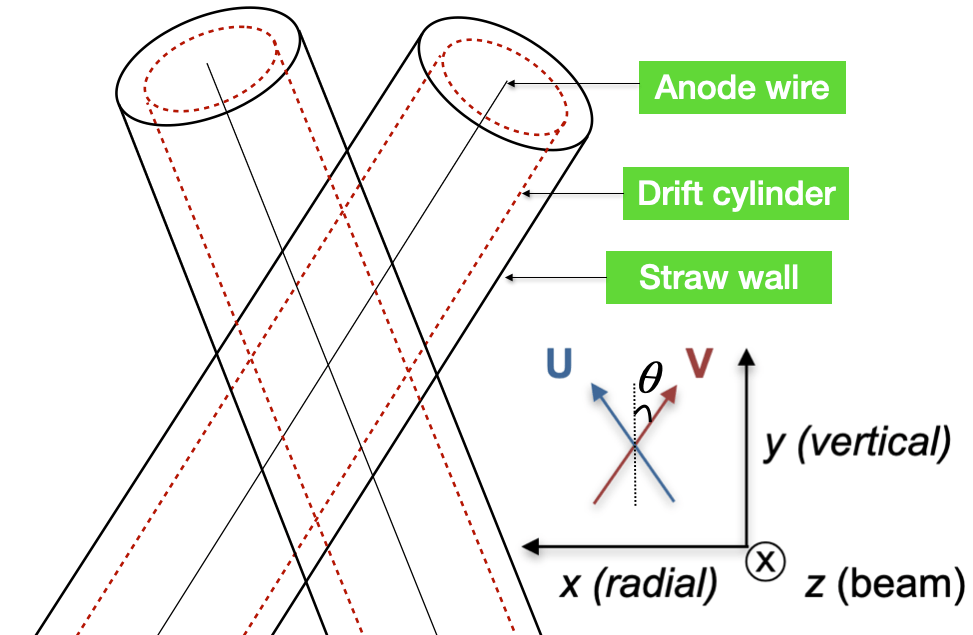
When the shaped fast electron signal in a given straw exceeds a configurable threshold, the readout electronics record the hit time, . This his time includes both the time that the charged particle traversed the straw and the drift time it took the primary ionization electrons to drift to the wire, cause an avalanche and trigger the electronics. The drift time yields the distance of closest approach (DCA) of the charged particle to the wire, shown in Figure 1. This distance measurement is a magnitude with no directional information, and thus specifies a cylinder around the wire that the traversing particle intersected at a single point. The track reconstruction combines the drift cylinders produced by a single charged particle, and the stereo angle between neighboring straw planes allows the determination of the full 3D particle trajectory.
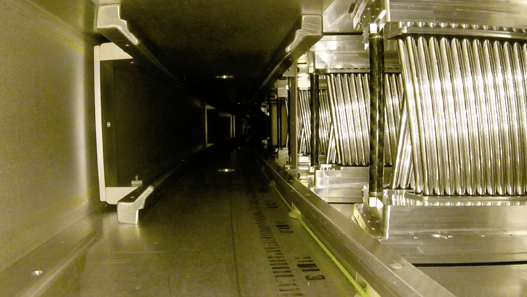
The tracking detector stations are positioned inside the experiment’s vacuum chambers, upstream of a calorimeter [9, 10, 11] within the storage ring vacuum, but outside of the region where the muons circulate. Tracking detector stations were installed in two of the three available locations that provide an unobstructed view of the muon storage region: at 180∘ and 270∘ with respect to the muon injection point, as shown in Figure 2. The multiple tracking detector stations provide redundancy, cross-checks and complementary information for tuning and optimizing the stored muon beam.
With the tracking detector stations positioned in only two locations in the ring, they measure two azimuthal regions. Measurement of closed-orbit distortions due to azimuthal variation in the experiment’s main dipole field requires at least two stations. Each tracking detector station accepts positron decays over a (3 m) azimuthal range. Initial studies indicated that, to determine the beam profile, the tracking detector needed to measure the radial position of the tracks per detection plane with a resolution of m. The demands on vertical resolution are more relaxed as the bending is predominantly in the horizontal plane.

2.2 Detector Requirements
The decay positron momenta follow a boosted muon-decay spectrum with an end point of 3.09 GeV/, the momentum of the stored muons. As such, the tracking detector must detect as many decay positrons as possible in a momentum range up to this limit (with the ability to cope with the initial hit rates at beam injection) and reconstruct their tracks with enough fidelity to determine the muon beam profile at the millimeter level after extrapolation.
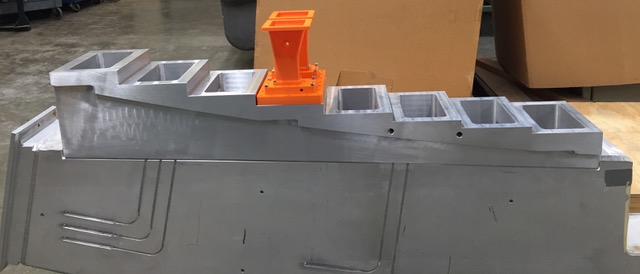
To reduce the uncertainty on decay position from scattering through material, the tracking detector stations reside inside the muon vacuum chamber in scalloped sections. These sections were specifically modified to accommodate the stations immediately upstream of a calorimeter and to locate them as close as possible to the stored muon beam. A fixture welded onto the scalloped vacuum chamber section, as shown in Figure 3, supports the detector modules in each tracking station. Being located inside the vacuum chamber imposes the requirement that the tracking detector must function in the vacuum of Torr. Their vacuum load on the system must fall below Torr L/s to avoid compromising the performance of the pulsed HV electric quadrupoles and kicker magnet [12] (see [2] for further details of these systems).
The vacuum chambers are installed in the 180 mm gap between the magnet pole pieces and are surrounded on three sides by the ring magnet [13]. As such, the tracking detector modules reside in the magnetic fringe field region of the storage ring as shown in Figure 4, resulting in specific requirements on the design. The detector must perform in this field, the significant nonuniformity of which should also not affect the reconstruction algorithm. Additionally, perturbations that the tracking detector modules make to the magnetic field due to material or electrical currents must be below 10 parts per million (ppm) at the center of the storage region over an azimuthal extent of greater than 2∘. Any perturbations due to transient currents on time scales below ms must be below ppb since these cannot easily be monitored by the NMR probes.
Two factors drive the number and positioning of the detector planes. Shorter low momentum tracks must traverse enough planes to allow their reconstruction, while higher momentum tracks require coverage over as large an azimuthal extent possible to provide the lever arm needed for accurate determination of the muon beam profile. Although positioning the tracking detector stations as close as possible radially to the storage region maximizes the overall acceptance, the introduced material must not significantly disrupt the muon beam or degrade the performance of the calorimeters. Consequently, and to minimize multiple scattering, each tracking plane had a radiation length material budget. To cover the beam aperture of mm, the tracking detector acceptance must be sensitive to 100 mm in height at the storage region.


2.3 Detector Design
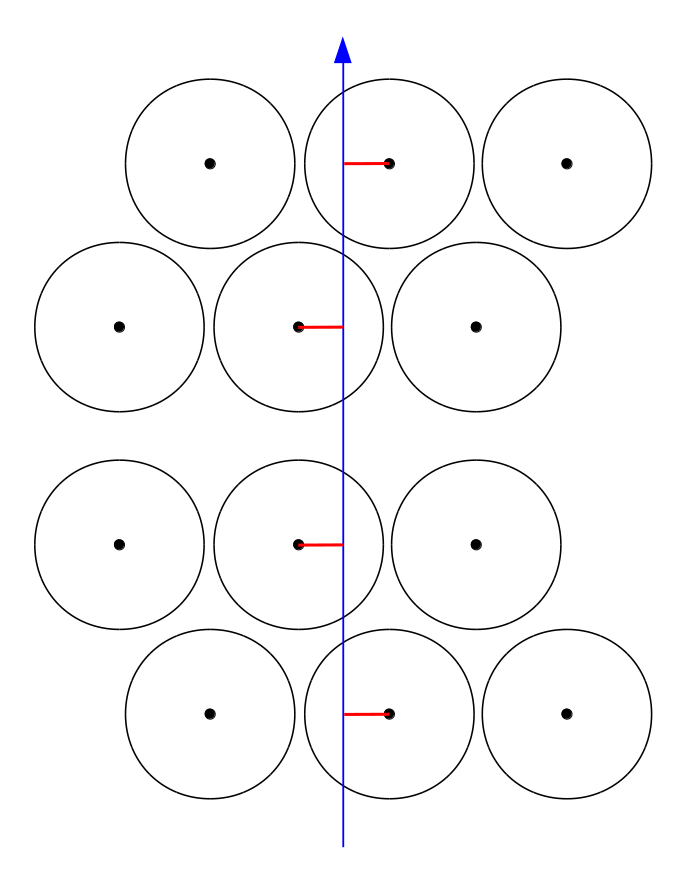
Each tracking detector station consists of 8 identical tracking ‘modules’, one of which is shown in Figure 5(a). Each module consists of four layers of 32 straws, grouped into two pairs of ‘UV’ layers. The layer pairs are staggered by half a tube diameter with respect to each other to minimize ‘dead’ regions and to aid in the resolution of left-right ambiguities in the track pattern recognition. In one pair of layers, straws are oriented at stereo angles of and , as shown in Figure 6. This geometry allows the straw readout to be located above and below the path of most positrons, whilst permitting the determination of the vertical position of the tracks with sufficient precision without compromising the measurement in the bending plane.



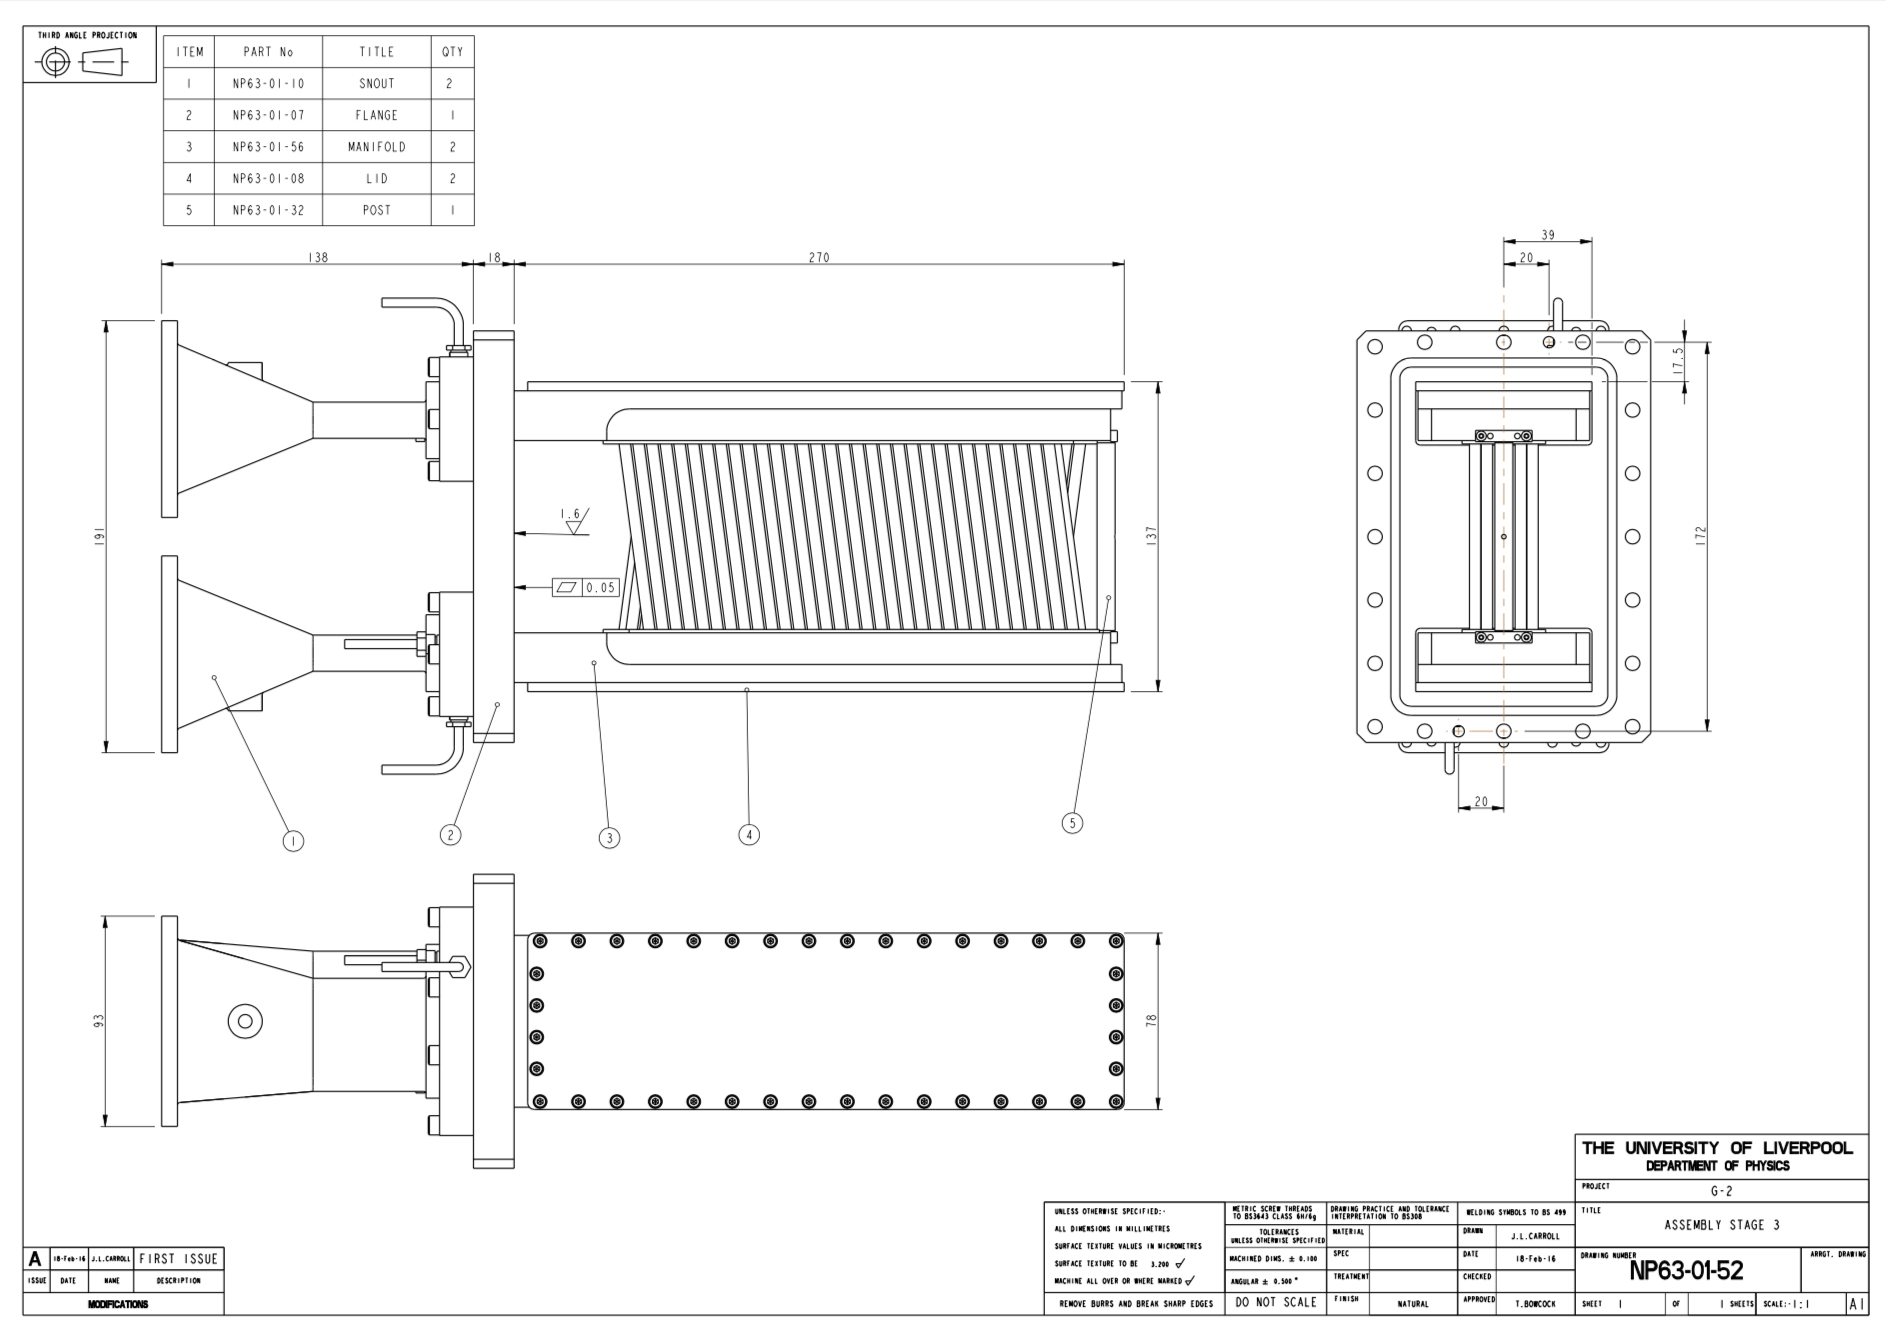
As shown in Figure 5(a), two aluminum manifolds support the straws, and house the frontend electronics and feed the gas mixture into the straws. The top and bottom manifolds are supported by an aluminum flange at one end and by a carbon fiber post at the end closest to the stored muon beam. The post avoids deflection of the manifolds when the straws are under tension. The use of carbon fiber minimizes the material in front of the calorimeters [15]. The eight modules insert through holes in the wall of the vacuum chamber, with the installed modules shown in Figure 5(c). The step-like structure shown in Figure 3 and Figure 5(d), enable the use of identical modules at each position, minimizing cost and manufacturing time.
The readout electronics and HV connect directly to the wire ends. To cool the electronics boards within the manifolds, each manifold includes a cylindrical cooling channel with a concentric internal cylinder, that allows cooling water to be pumped in and extracted within the same channel. Copper bars and silicone-based thermal pads form a thermal connection between the water-cooled manifold and the electronics [16]. Digital readout signals on flexicables and HV cables exit the manifolds via channels through the flange. Beyond the flange, these openings expand as aluminum “snouts” (see Figure 5(a)) until they terminate in a feedthrough electronics board to which the downstream electronics connect. Section 4 discusses the electronics in detail.
The snouts also contain the gas connections, with the gas entering one manifold through its snout, flowing through the straws, and exiting the opposite manifold and its snout. The snouts extend the connections radially inwards away from the storage ring to clear the magnet pole pieces whilst maintaining the gas seal and providing an unbroken Faraday cage for the electronics, thereby shielding them against RF noise. The straw gas, a 50:50 mixture of argon-ethane (Ar:C2H6 50:50), provides good resolution performance and a minimal leak rate. Argon provides a relatively inexpensive but effective ionization medium. Ethane, the quencher gas, provides good absorption of ionization photons that could otherwise trigger new avalanches. Together, Ar:C2H6 50:50 provides a saturated drift velocity. Ar:CO2 in an 80:20 ratio mixture, an inflammable alternative tested with detector prototypes, exhibited a weaker gain plateau and an unacceptable leak rate compared with the permeation rate of Ar:C2H6 50:50 through aluminized Mylar. Rate-of-rise tests in a vacuum chamber (see Section 5.2) confirmed the reduced leak rate of Ar:C2H6 50:50.
3 Construction
The technical design of a tracking detector module is shown in Figure 7. All stages of module construction were performed in ISO 5 (Class 100 and Class 10000) clean rooms, with all staff fully equipped and trained for the process.
3.1 Machining of Module Components
The initial stage of construction involved the machining of the low-magnetization aluminum manifolds, flanges, manifold lids and snouts form Grade 6061 aluminum. Treatment with no-color Alocrom 1000 (Alodine) prevented oxidization without adding or impeding the function of the material. The manifolds sit in a flange that bolts into the vacuum chamber. Two snouts on the other end of the flange connect the manifolds to the crate that houses the backend readout electronics.
Figure 8 shows the stages of machining. The manifolds in Figure 8(a) were first machined on a 5-axis computer numerical control (CNC) machine to manufacture the flange end, create a datum face on both ends, provide precise placement details such as alignment holes for dowel pins, and enable mounting for subsequent machining cycles. Letterbox features to link to an electronics pocket allow the necessary electronics to pass through to the flange face. Shown in Figure 8(b), the large electronics pocket itself was then rough-machined on a 4-axis CNC. A break in machining between this stage and the next allowed time for the material to relax before further critical machining was carried out. The precise finishing of the electronics pocket and all angled straw holes (helically bored to a tolerance of 10m and spaced so each straw is 6 mm apart any neighboring straw) were then completed on the 5-axis CNC, including a shelf for cooling within the pocket, two troughs for glue to well into around the straws, and an O-ring groove in the top face for the lid to seal. Separate operations on the 5-axis CNC finished the bottom with wells for glue, as well as the flange end and tail end.
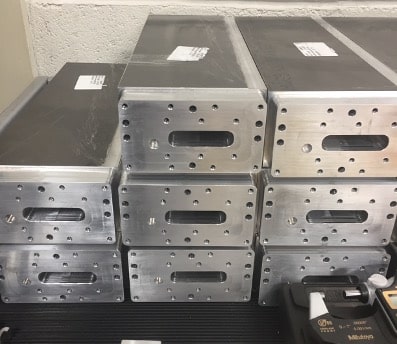
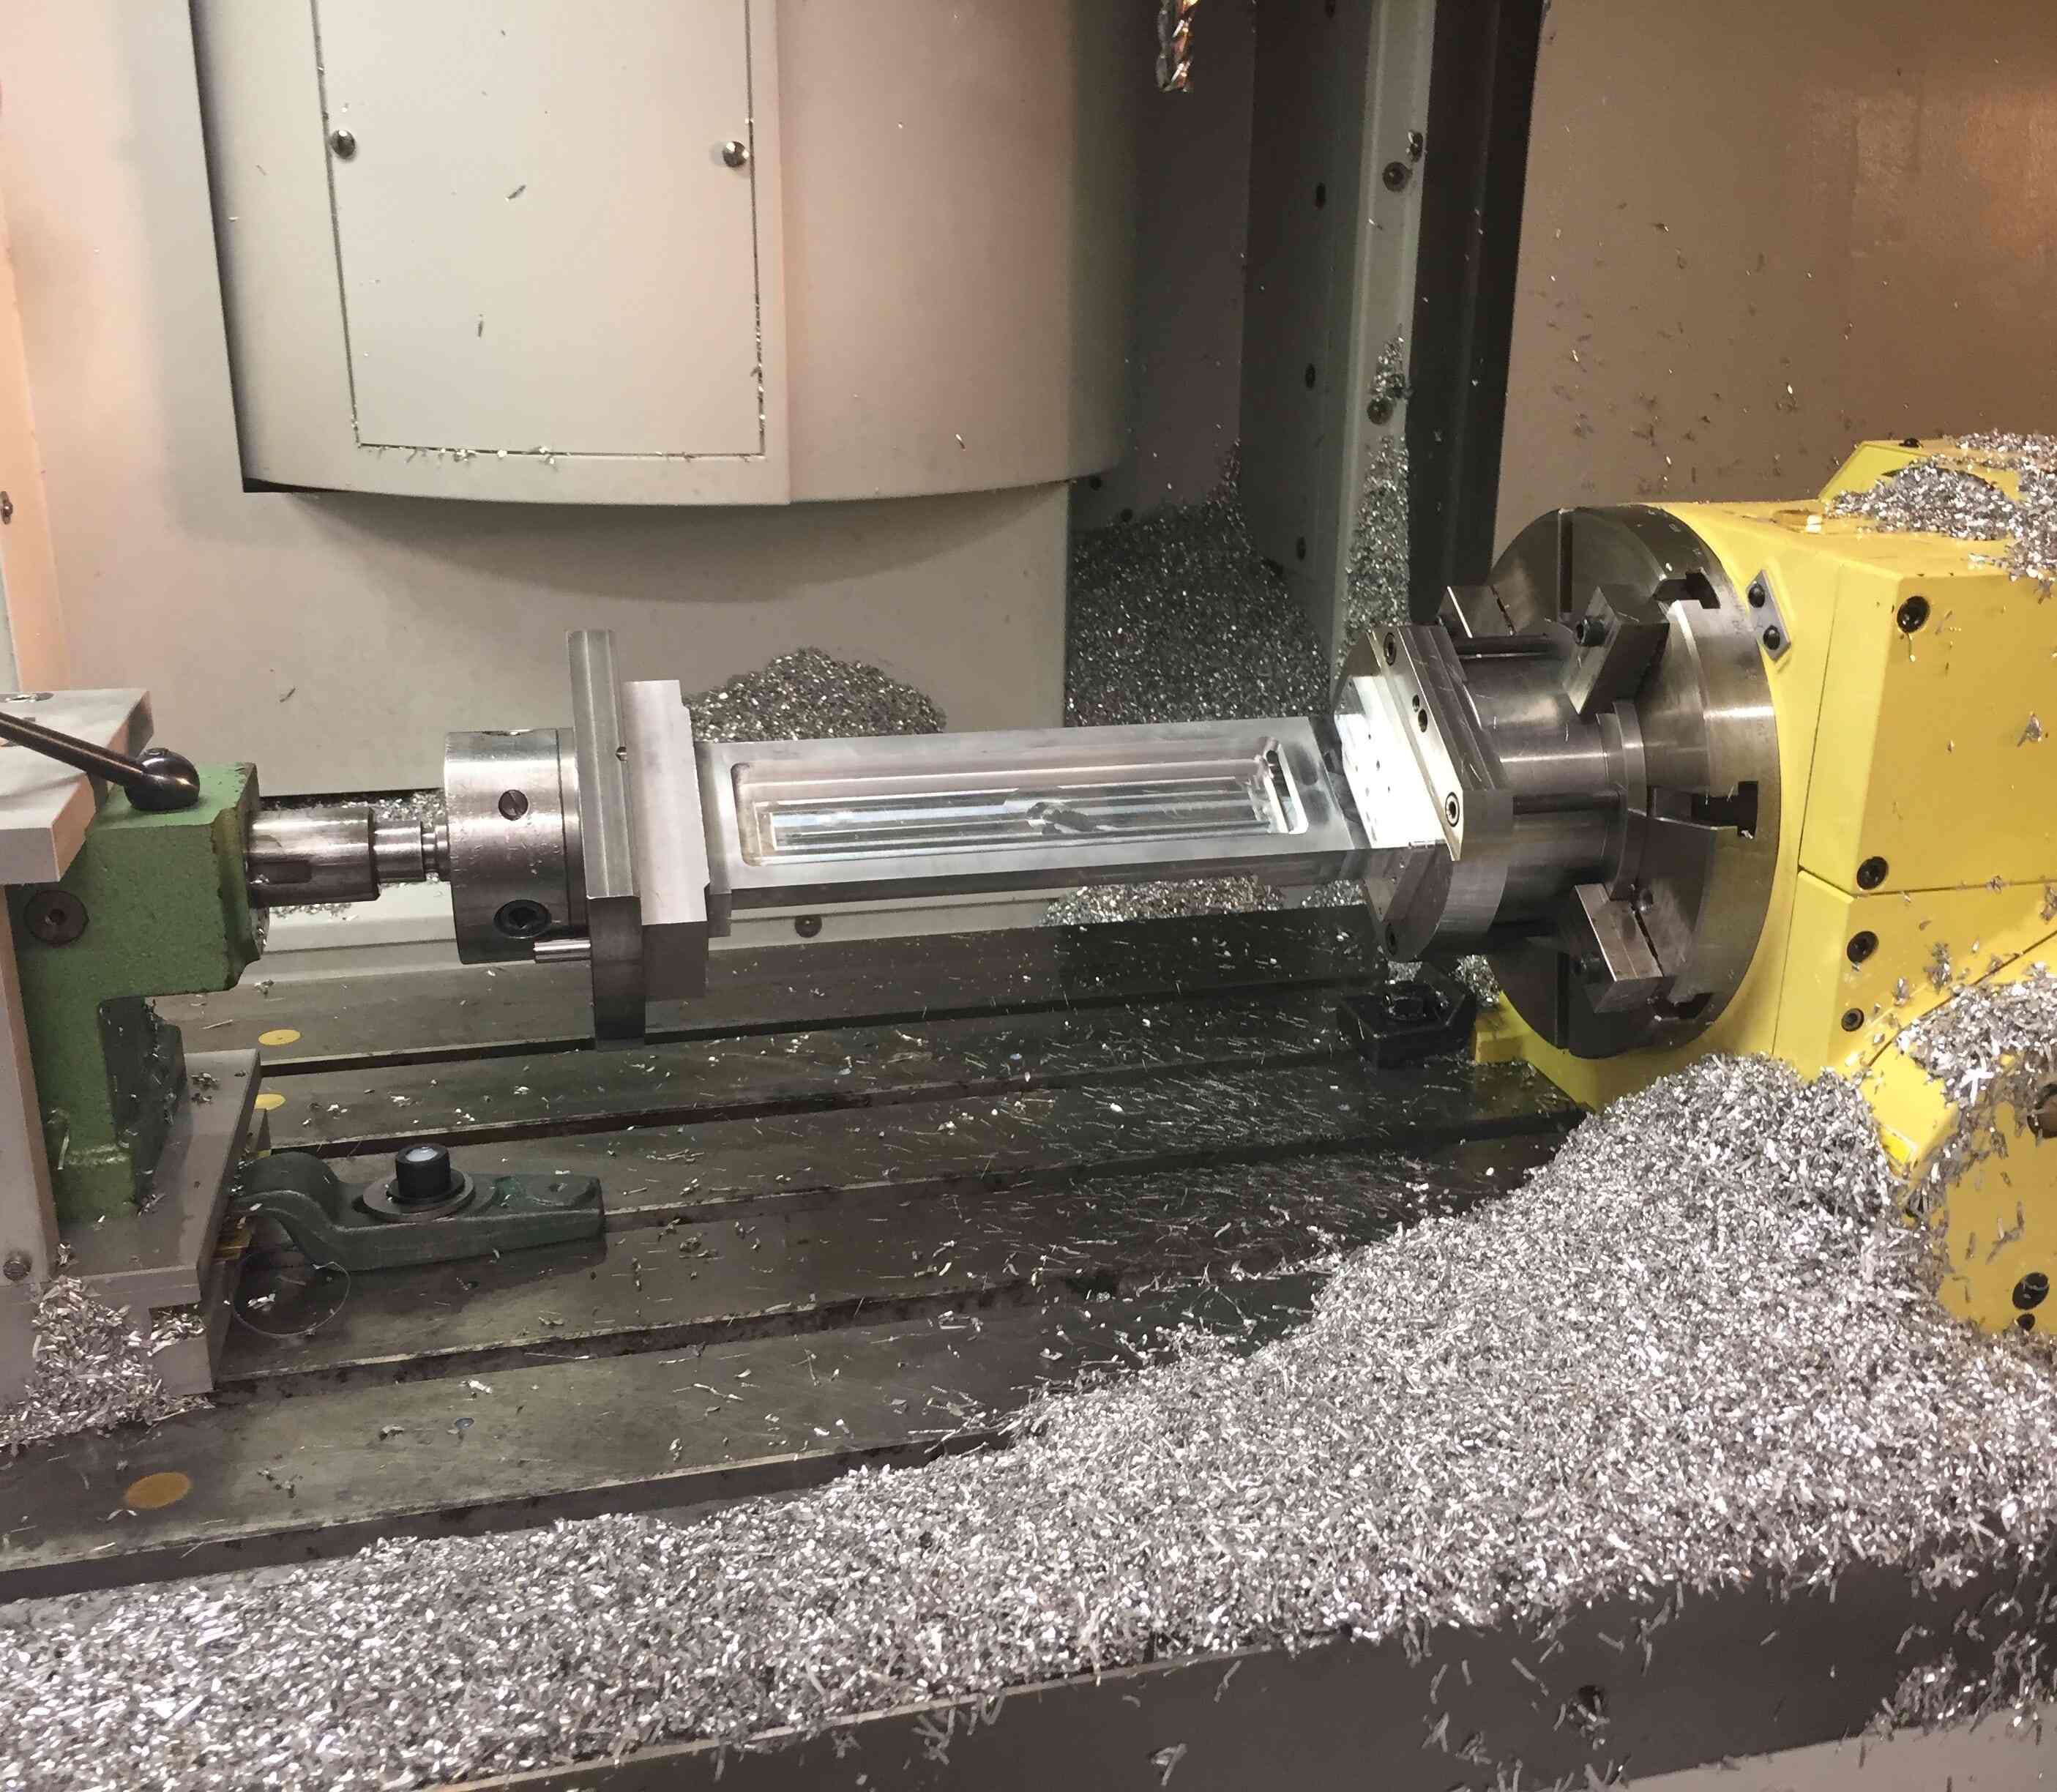
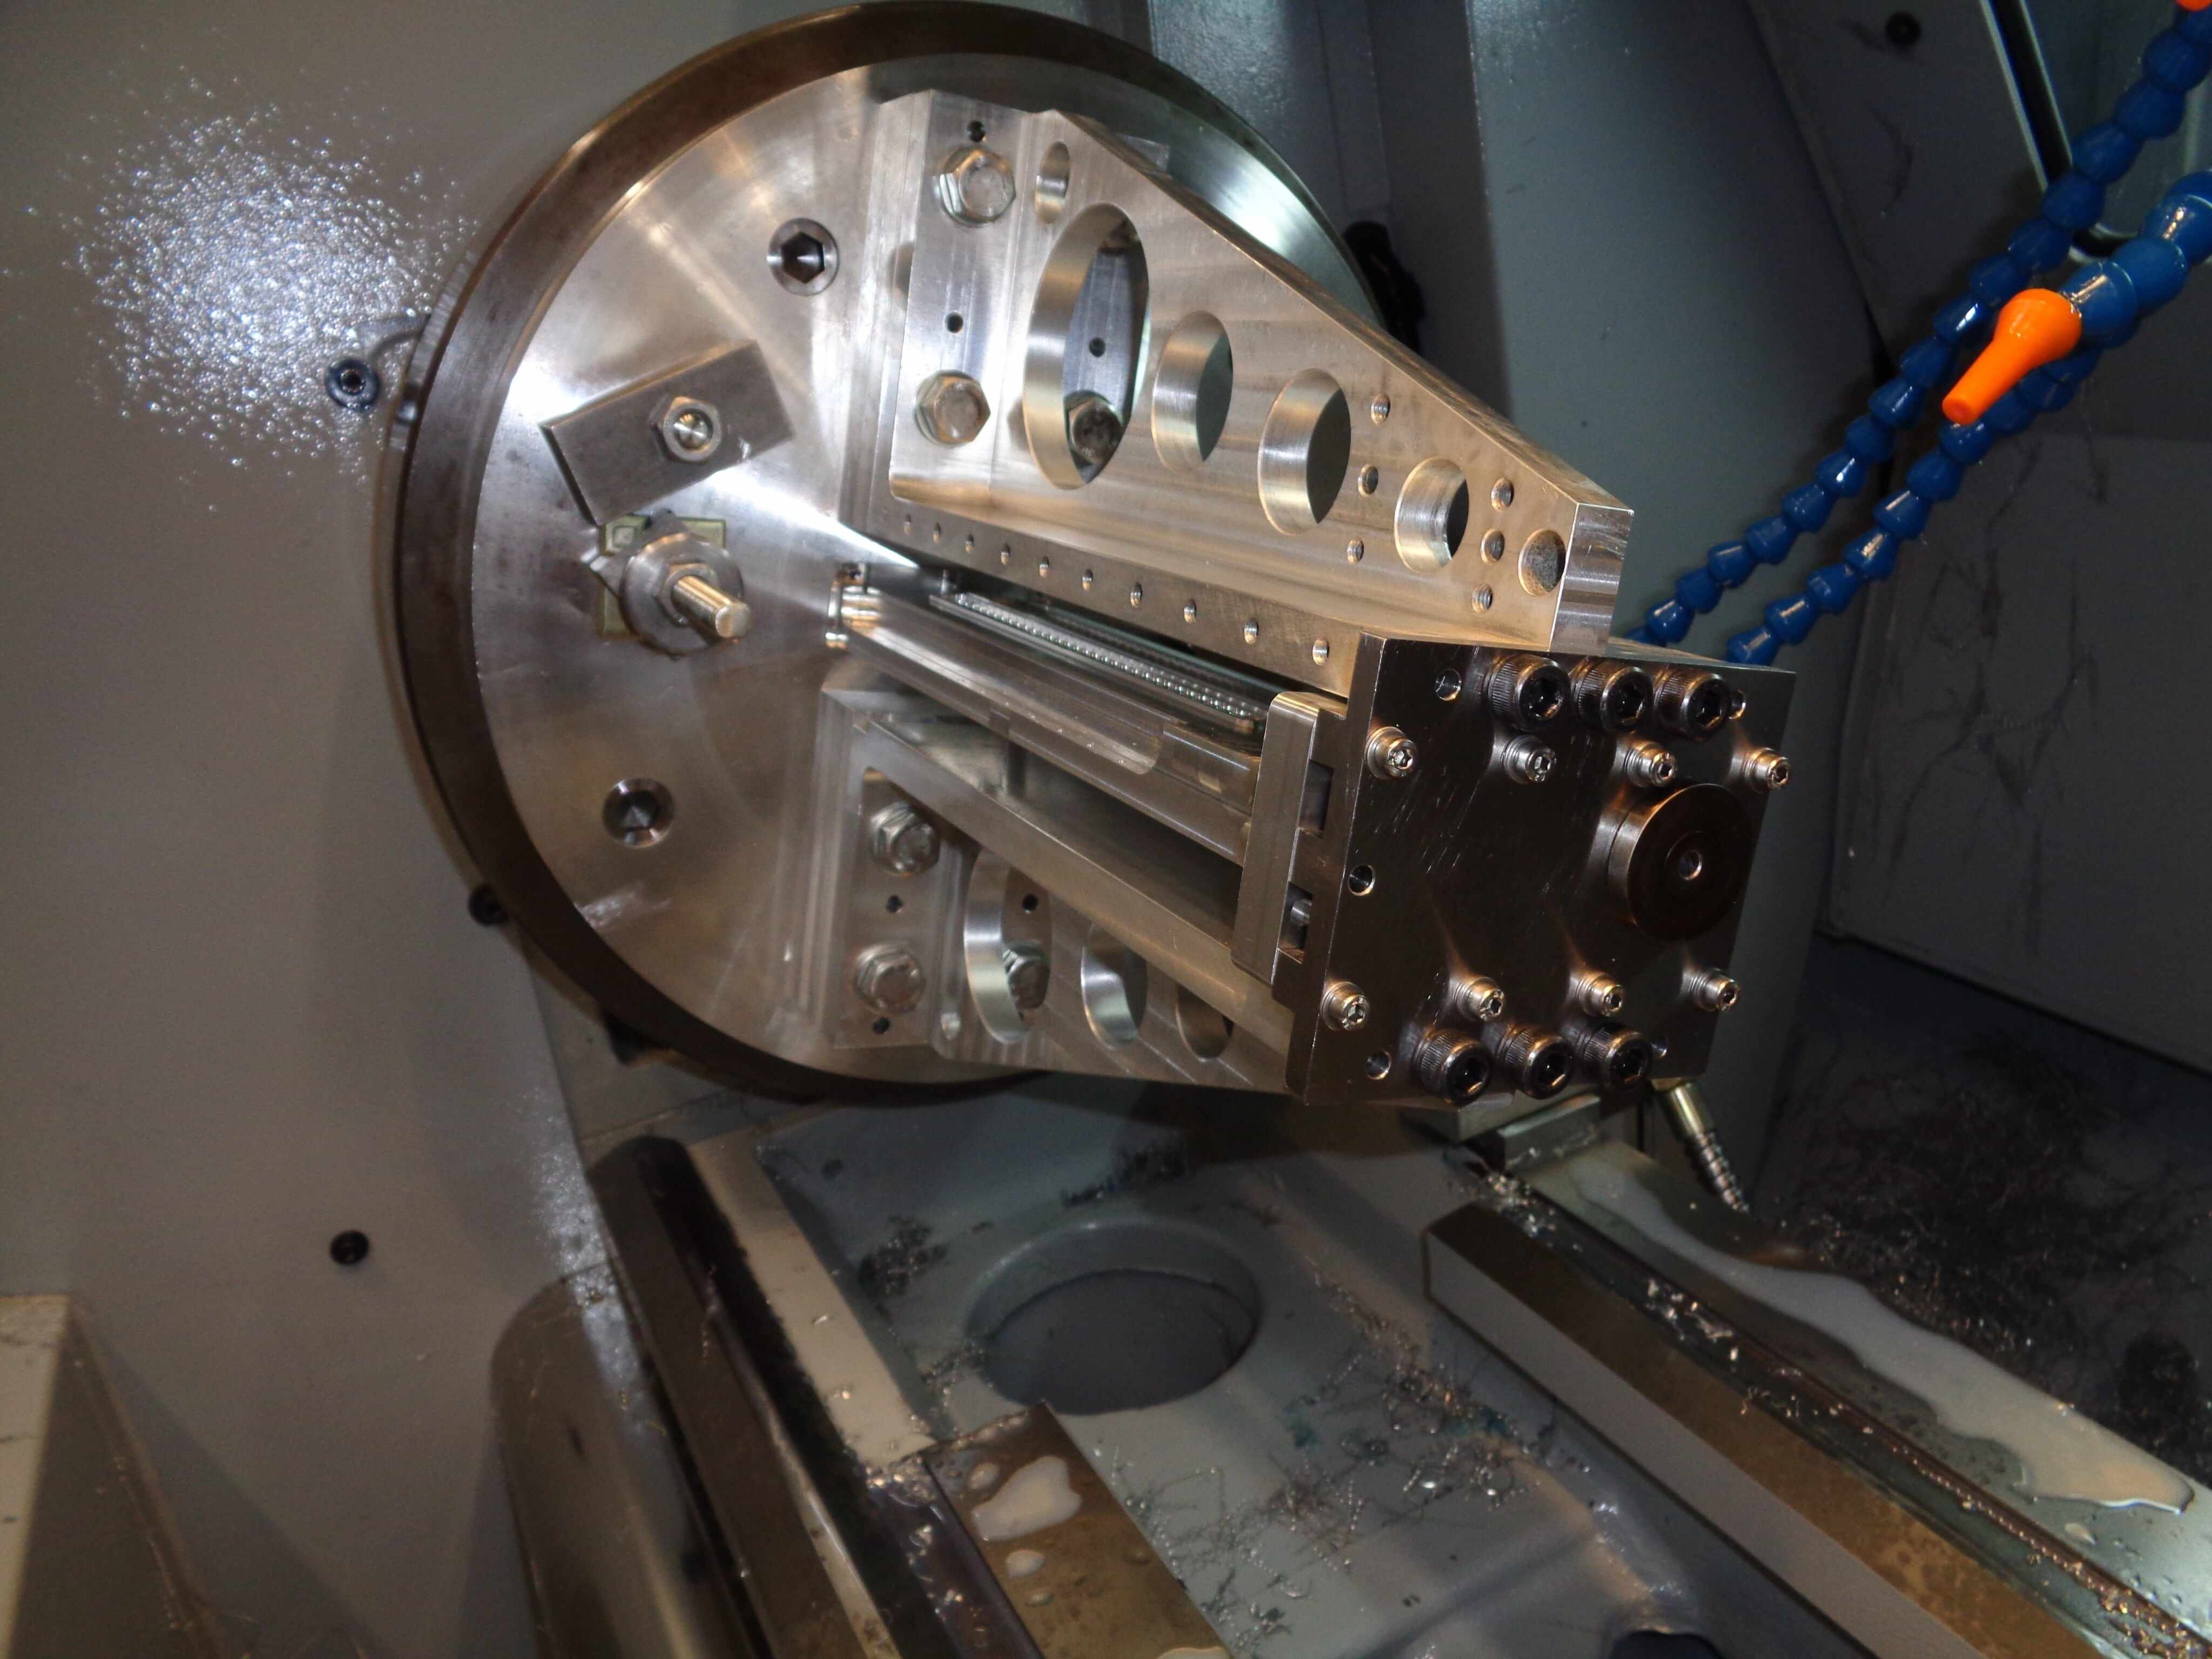
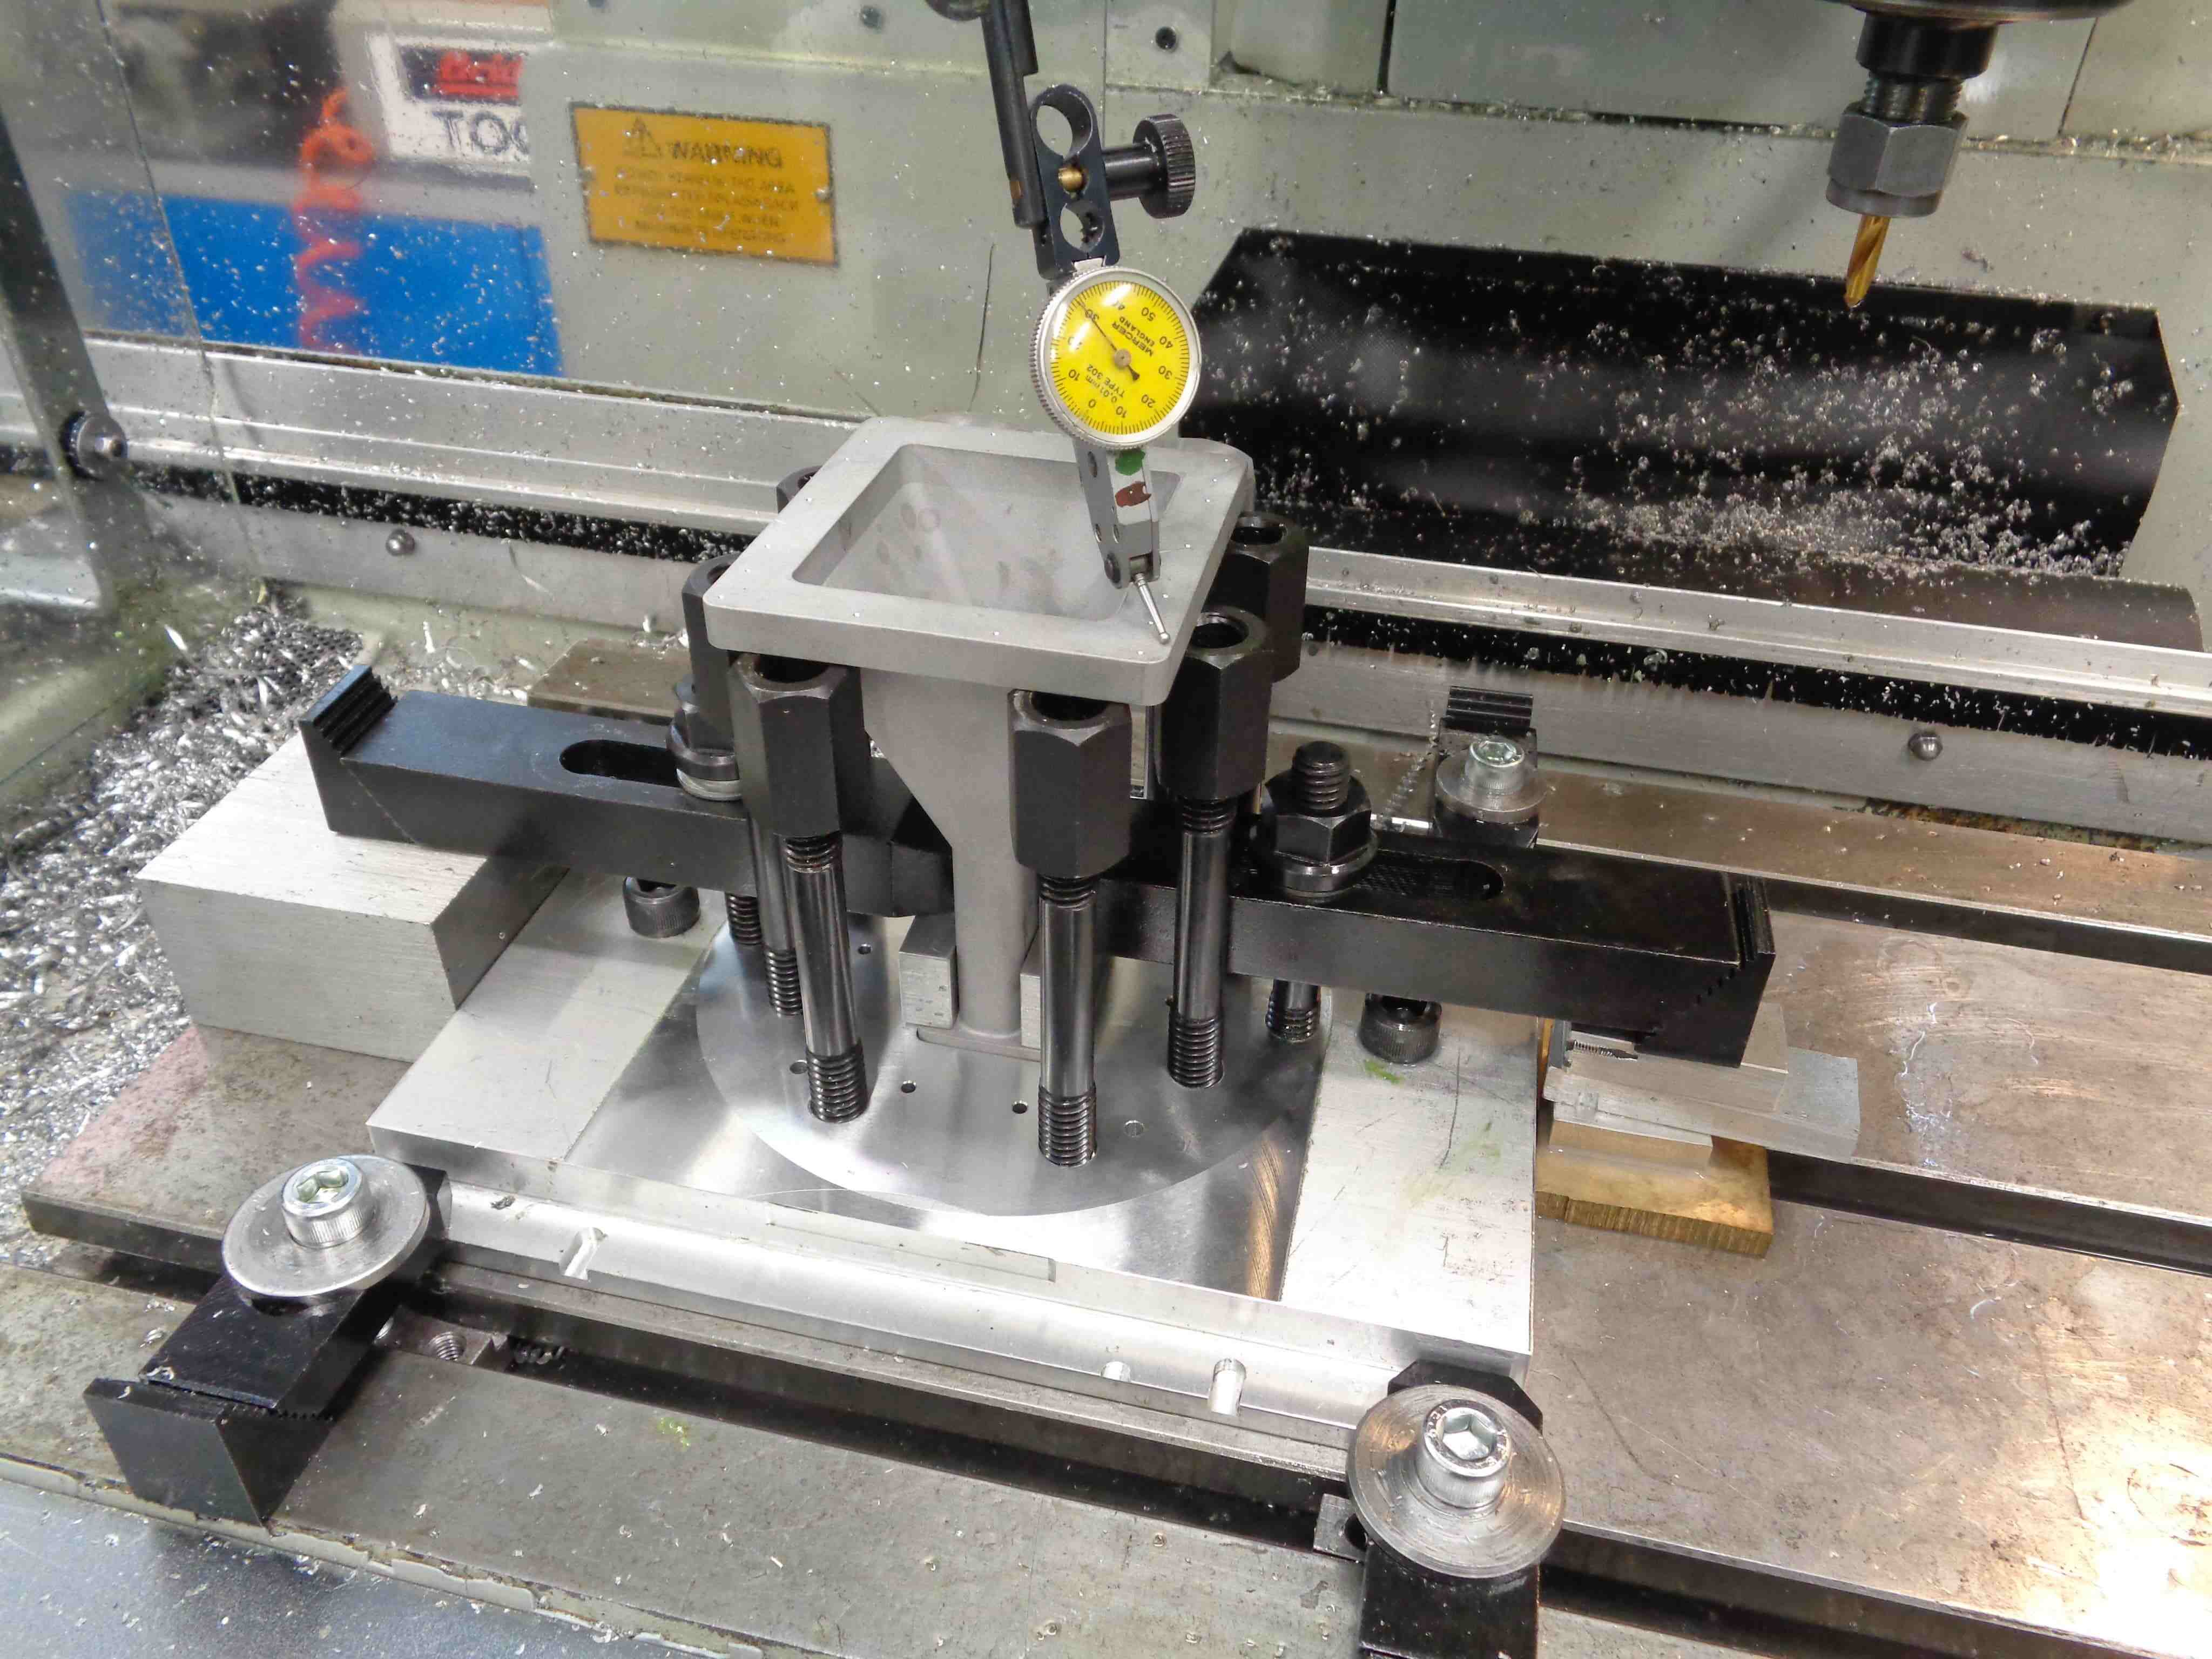
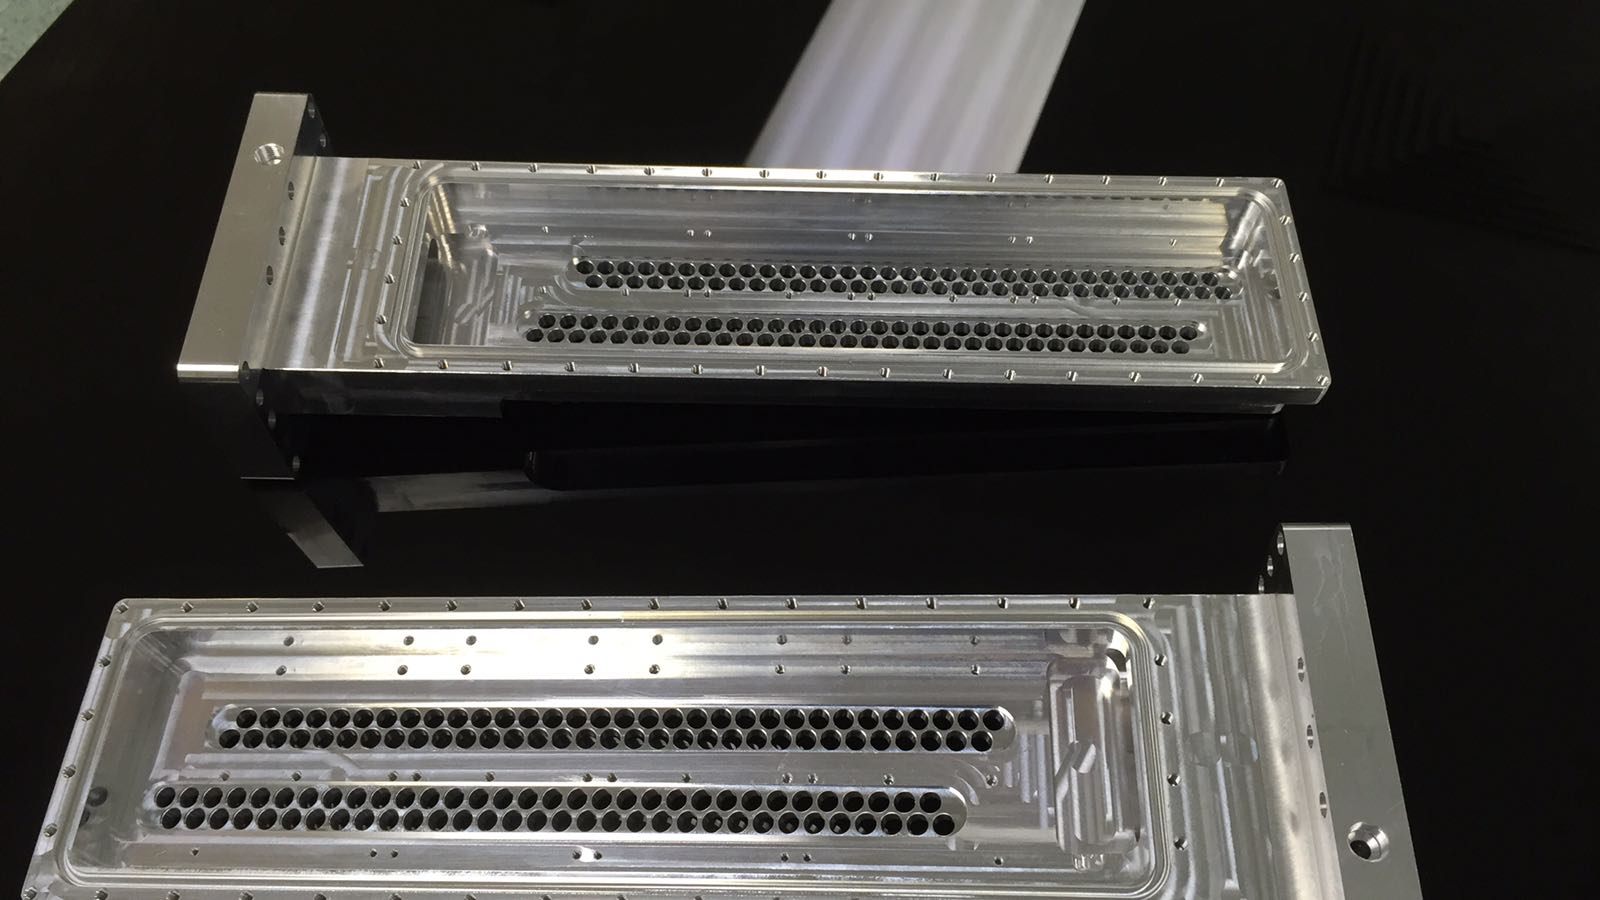
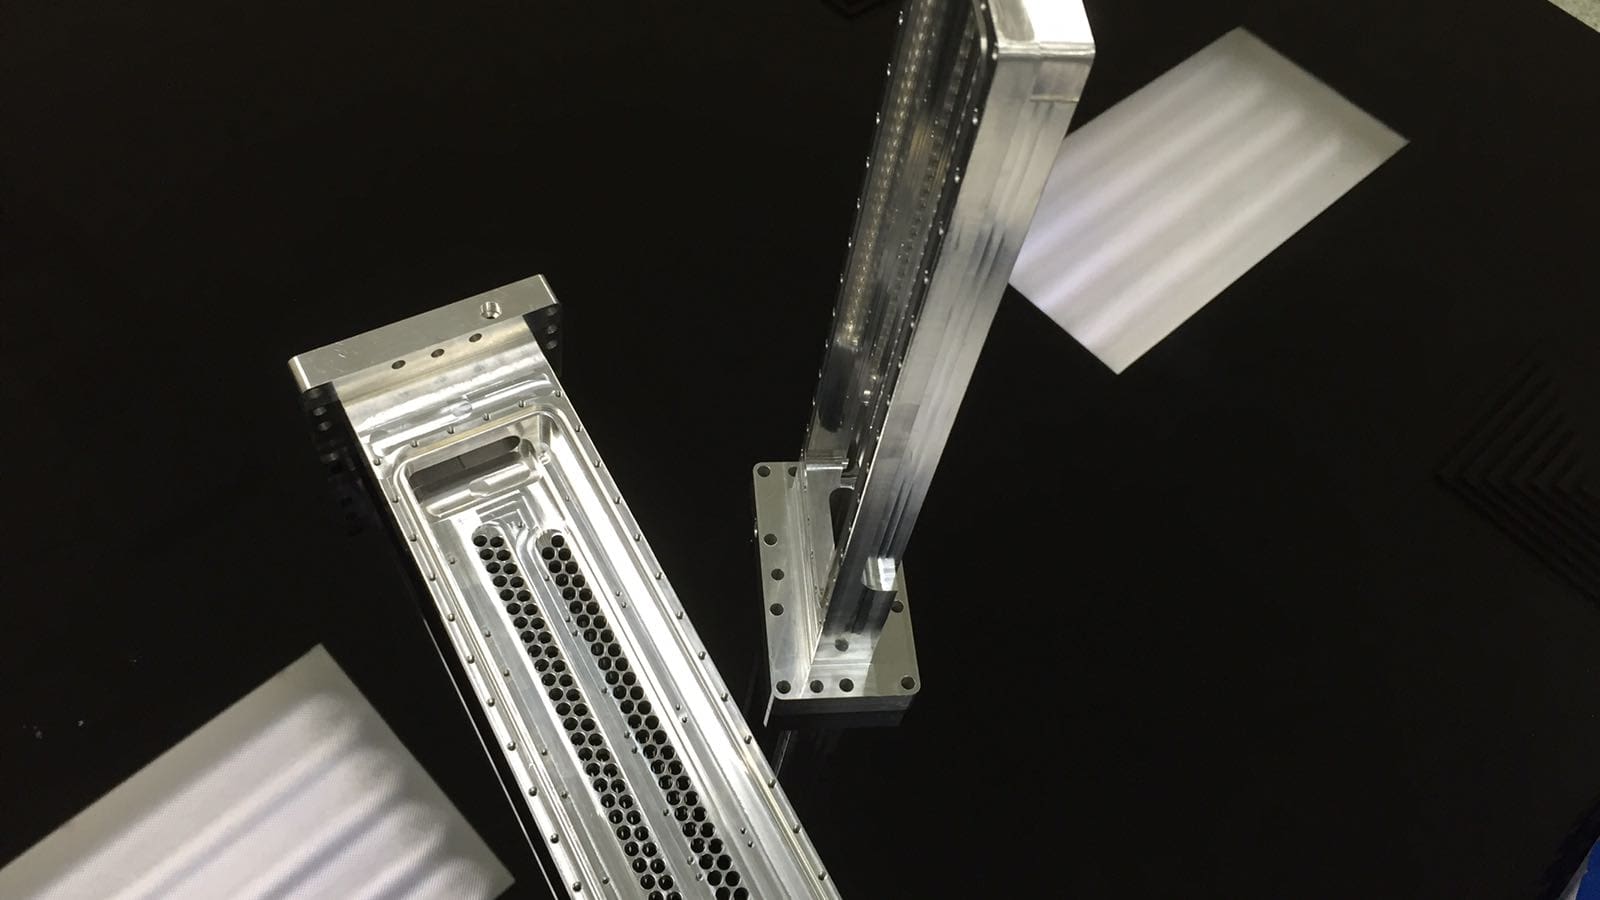
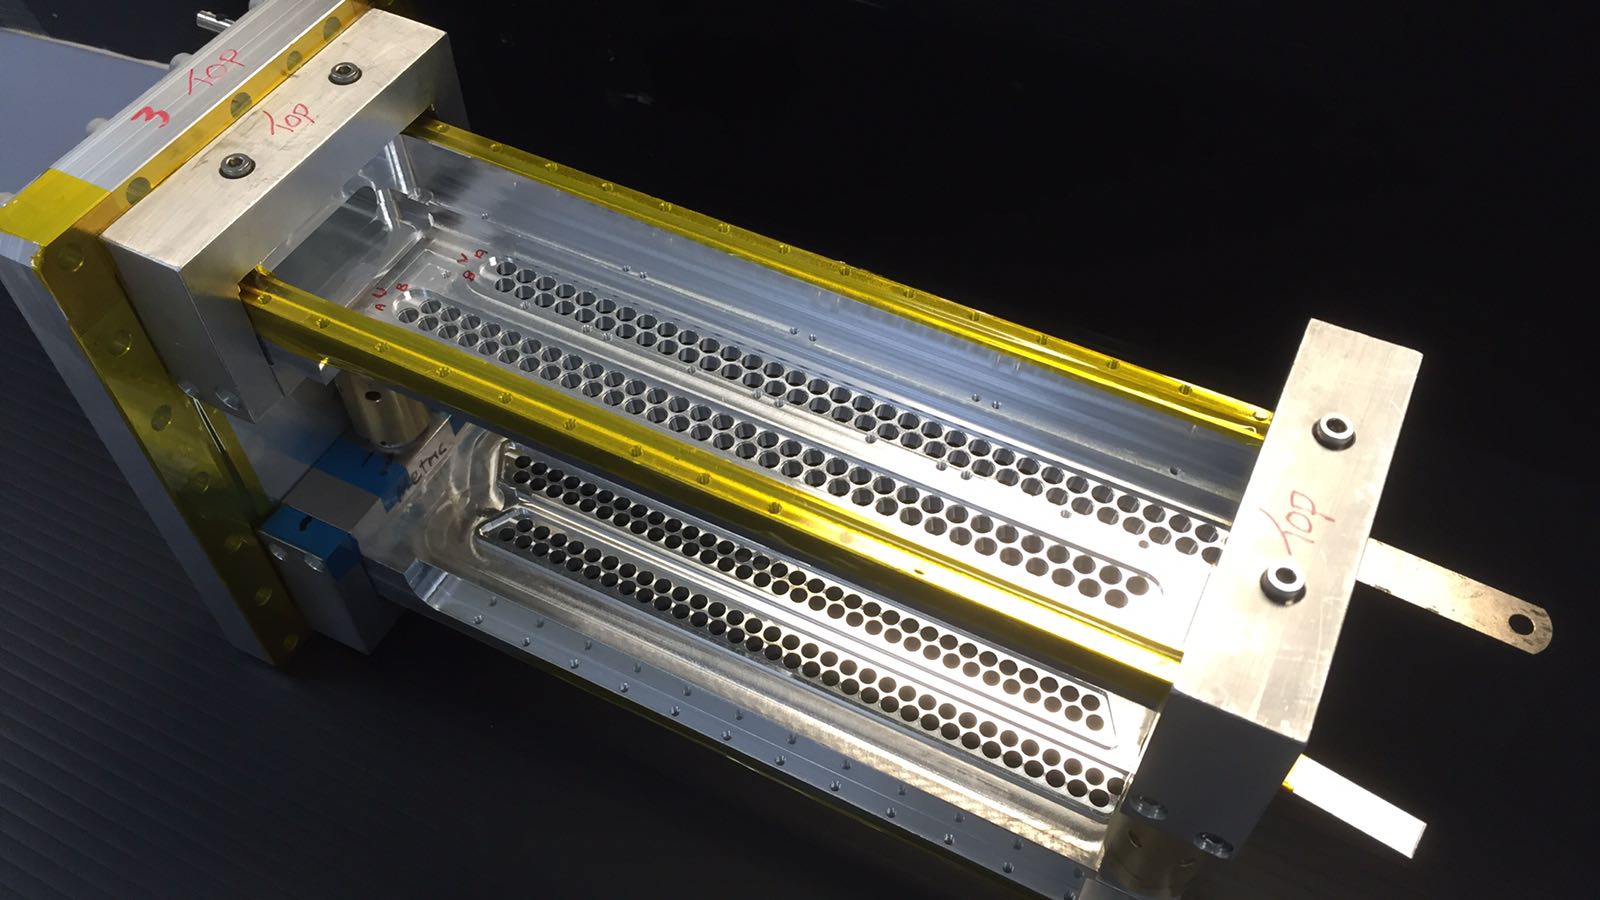
A lathe drilled a mm deep cooling hole down the length of the manifold block, providing space for a plastic pipe to transport cooling water along the length of the manifold to remove heat generated by the internal electronics.777Original attempts to use copper piping resulted in galvanic corrosion. Plastic tubes, the alternative, had a lower flow rate than copper, but still adequate for the required heat transfer. In this stage, shown in Figure 8(c), the drilling runout could not exceed 0.5mm as this would break through into the pocket housing the electronics. Final details were added by hand, including polishing and deburring the straw holes to remove any imperfections that could damage the straws on insertion. The snouts, shown in Figure 8(d), were cast and then machine finished. Full details of the manifold production are documented in [17].
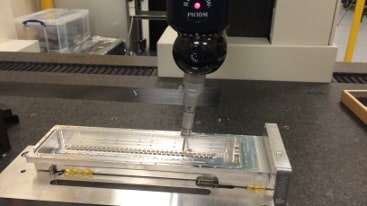
All machined pieces of the tracking detector modules underwent a metrology survey (using CAD models and a contact probe with a coordinate-measuring machine) before assembly to ascertain how accurately the parts had been machined and assess if they lie within acceptable tolerances. All manifold faces, o-ring planes, dowel holes, straws holes, etc. were surveyed as part of this process. Manifolds were paired with a flange based on the offsets measured from the flange surveys and any alterations to the machined pieces of equipment based on the acquired data were carried out. The metrology process is depicted in Figure 8(g). Full details of the metrology survey can be found in [18].
3.2 Straw Testing and Assembly
The straws never left the clean room environment during assembly. They are made from two layers of spiral-wound aluminized Mylar with an outer diameter of 5 mm. The straw wall is made of two layers of 6 Mylar with a 3 layer of adhesive between. The inner surface has 500 of aluminum overlaid with 200 of gold to act as a cathode. The outer surface has 500 of aluminum to reduce the permeation rate of gas through the straw walls and provides increased electrostatic shielding. The straws have the same specification as the 1.3 m straws to be used by the Mu2e experiment [19] and arrived from the vendor, DuPont [20], cut to this length specification with a supportive layer of paper inside. Quality control procedures were performed prior to handling on all acquired straws. Two different batches of straws were used in the production of the detectors. The first batch had an average wall thickness of 15 and diameter of 5.07 mm, whilst the second batch had an average wall thickness of 12 and diameter of 4.92 mm. The average resistance was measured from one end of each uncut straw to the other. The resistance of the second batch was found to be lower than the first batch (before and after paper removal), but acceptable overall. The average resistance was found to be m-1, with 98% of all straws found to have an adequate resistance of .
Prior to being used in the tracking detector modules, the straws underwent a rigorous leak-testing procedure.888This procedure was developed by the Mu2e experiment, since straws of identical design and manufacture will be used in both experiments. For optimal vacuum performance, it was required that each module had a leak rate of Torr L/s, with a worst-case threshold of Torr L/s. The leak testing chamber, shown in Figure 9(a) and Figure 9(b), consists of two copper tubes of approximately 1.5 m in length, the ends of which are connected to either a small bridging tube or electronics box. A fan installed in the electronics box ensures gas circulation. There are two bidirectional valves in the chamber. One connects the chamber to the gas line, and the other is used to switch the chamber between the ‘open’ configuration (where the gas flows from the inlet around both pipes of the chamber and is then exhausted after a single circuit) and the ‘closed’ configuration (where the chamber is sealed at both ends and the fan blows the gas around the entire volume).

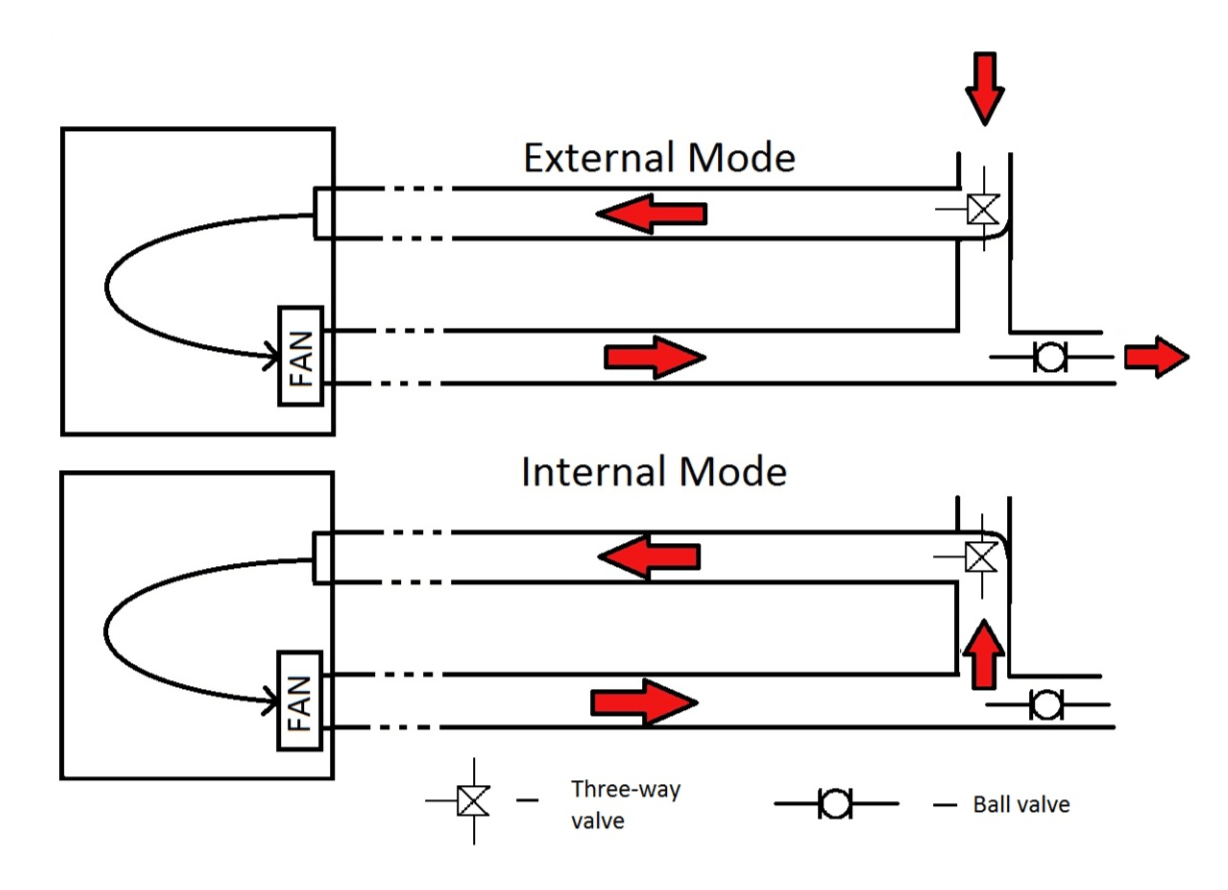
The leak rate of every straw was measured in the custom-built leak-testing chamber before being cut to size. The purpose of these tests was to measure the permeation rate of the individual straws over two hours to ensure that they would not surpass the maximum permeation rate of an entire module. During testing, any “real” leak or hole in a straw that was not caught during an initial visual inspection stage was immediately identifiable as the leak testing chamber would immediately fill with CO2. In these cases, the test would be stopped immediately and the straw discarded.
Approximately 5 cm of Viton tubing was attached to an injection-molded straw end-piece, one of which was inserted into either end of the straw to be leak tested. The diameter of the end-piece was slightly smaller than the straw diameter in order for it to be inserted into the straw without damaging it. The end-pieces were glued into the straws using a generous amount of rapid Araldite to ensure a good gas seal. The straw was then left in a preparation tray for up to 3 hours. Once the glue had cured, the straw was carefully transferred into a metal leak-testing tray. The tray had higher walls than the straw height in order to protect it during its time in the leak testing chamber, and was flat at either end where the viton tubing rested. A CO2 gas line was connected to one end of the straw and the straw was flushed with CO2 for 30 s. After flushing, a barbed plug was used to seal the other end of the straw and stop the flow of CO2
The straws in the storage ring vacuum experience a pressure of 15 psi, and so were leak tested at a relative pressure of 15 psi above atmospheric pressure (30 psi absolute pressure). However, the straws must be able to withstand up to 25 psi (relative) to ensure they would not be damaged in the event of a problem with the gas supply (a relief valve in the experimental setup directs the gas away from the straws if the pressure in the system exceeds 25 psi). To this end, the pressure of the CO2 inside the straw was increased to 25 psi and held for 1 minute before being reduced to 15 psi for the leak test. When the pressure reached 15 psi, the Viton tubing was clamped to isolate the straw from the gas line, and then cut between the clamp and the gas line. A second barbed plug was inserted into the open end of the tubing and the clamp was released. The straw was secured in its metal tray using Kapton tape and was then inserted into the leak testing chamber, which continued to be flushed with nitrogen at a rate of 2.5 L/min. The nitrogen flush was continued for 2 minutes after the straw was inserted to remove any residual air that was introduced with the straw and tray. The chamber was then switched to the ‘closed’ configuration and the nitrogen line removed before running the leak test.
Each straw was filled with Ar:CO2 50:50, and the leak rate measured using a CO2 detector inside the testing chamber. Although the gas used in the experiment is Ar:C2H6 50:50, it was acceptable to test the leak rates using CO2 since it is known to permeate through Mylar at a greater rate than ethane. The exact conversion between the leak rates of the two gases was determined on the first fully completed module after production by measuring the rate-of-rise using the different gases, with Ar:C2H6 50:50 being found to have a times smaller leak rate than 100% CO2.999An original threshold for the straw leak rate was set prior to this. A less stringent threshold was safely established later defined by the average leak rate of the straws per tracking detector station (see Figure 10). Due to the thinner walls, the leak rates for the second batch of straws were significantly higher than the first, as shown in Figure 10, but both batches met the specifications for the required vacuum performance. The pass rate was for the first batch of straws at the original threshold and for the second batch at the relaxed threshold. The full leak testing procedure is documented in [21].

In addition to the testing in the chamber, each straw was visually inspected to look for manufacturing imperfections. Other QA procedures were performed on a subset of spare straws, prior to the production procedure. Repeated pressure tests were performed, where the pressure on an individual straw was increased and decreased repeatedly to demonstrate robustness of the straws under cycles of the vacuum in the experiment. Over-pressure tests were performed to test that the straws would survive any sudden failures in the gas supply system that could cause the straws to experience a relative pressure of 30 psi. The straws were leak-tested before and after having tension applied to them to demonstrate that the leak rates would be unaffected by the tension applied to the manifolds. Finally, tests were performed to measure the hygroscopic properties of the straw, by measuring the mass before and after being stored in a humid environment. These tests revealed that the straws should be stored in a dry nitrogen environment.
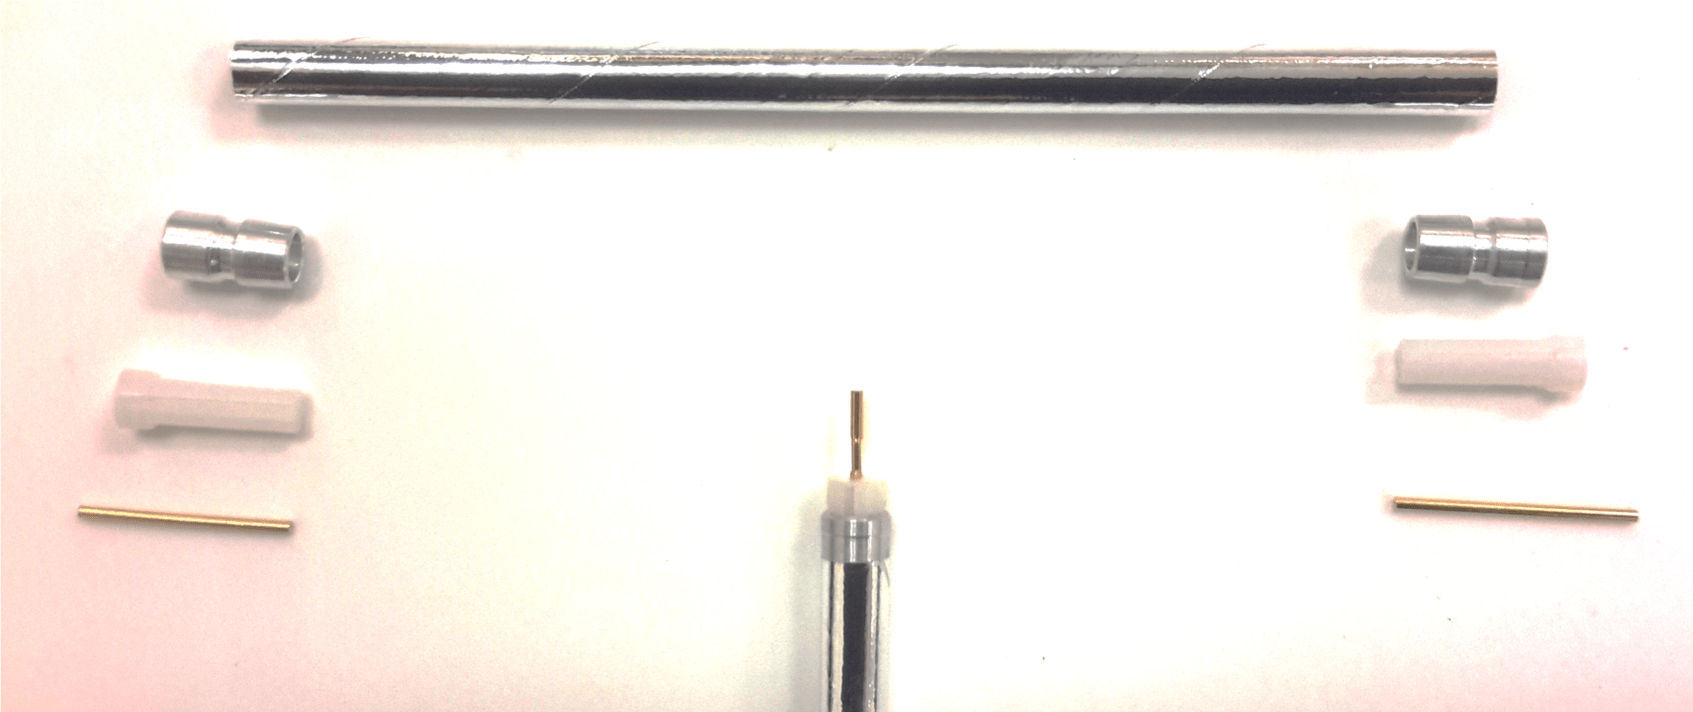
The component parts of a straw can be seen in Figure 11. The straws were cut to a length of 90.8 mm using a custom designed and built guillotine. They were glued and sealed into the top and bottom aluminum manifolds with green dyed Araldite 2020 (for its radiation hardness and high viscosity properties) and with conductive silver epoxy to ensure a good ground connection between the straw and the module. An additional thick layer of structural epoxy was also applied to provide a gas seal between the outside of the straw and the manifold. A gold-plated tungsten-rhenium sense wire, with a diameter of 25 m, is held at the center of the straw by two gold crimp pins (one at each end). Each straw is readout from only one end. The pins at the end that is seated into the electronics cards are slightly longer than the pins at the other end. The pins were inserted into injection-molded plastic inserts that were themselves inserted into the straw aluminum end-pieces. On either side of the plastic insert is a channel to enable the flow of gas through the straw. The inserts were not glued into the aluminum end-pieces allowing an individual wire to be removed if it breaks.
3.3 Module Assembly
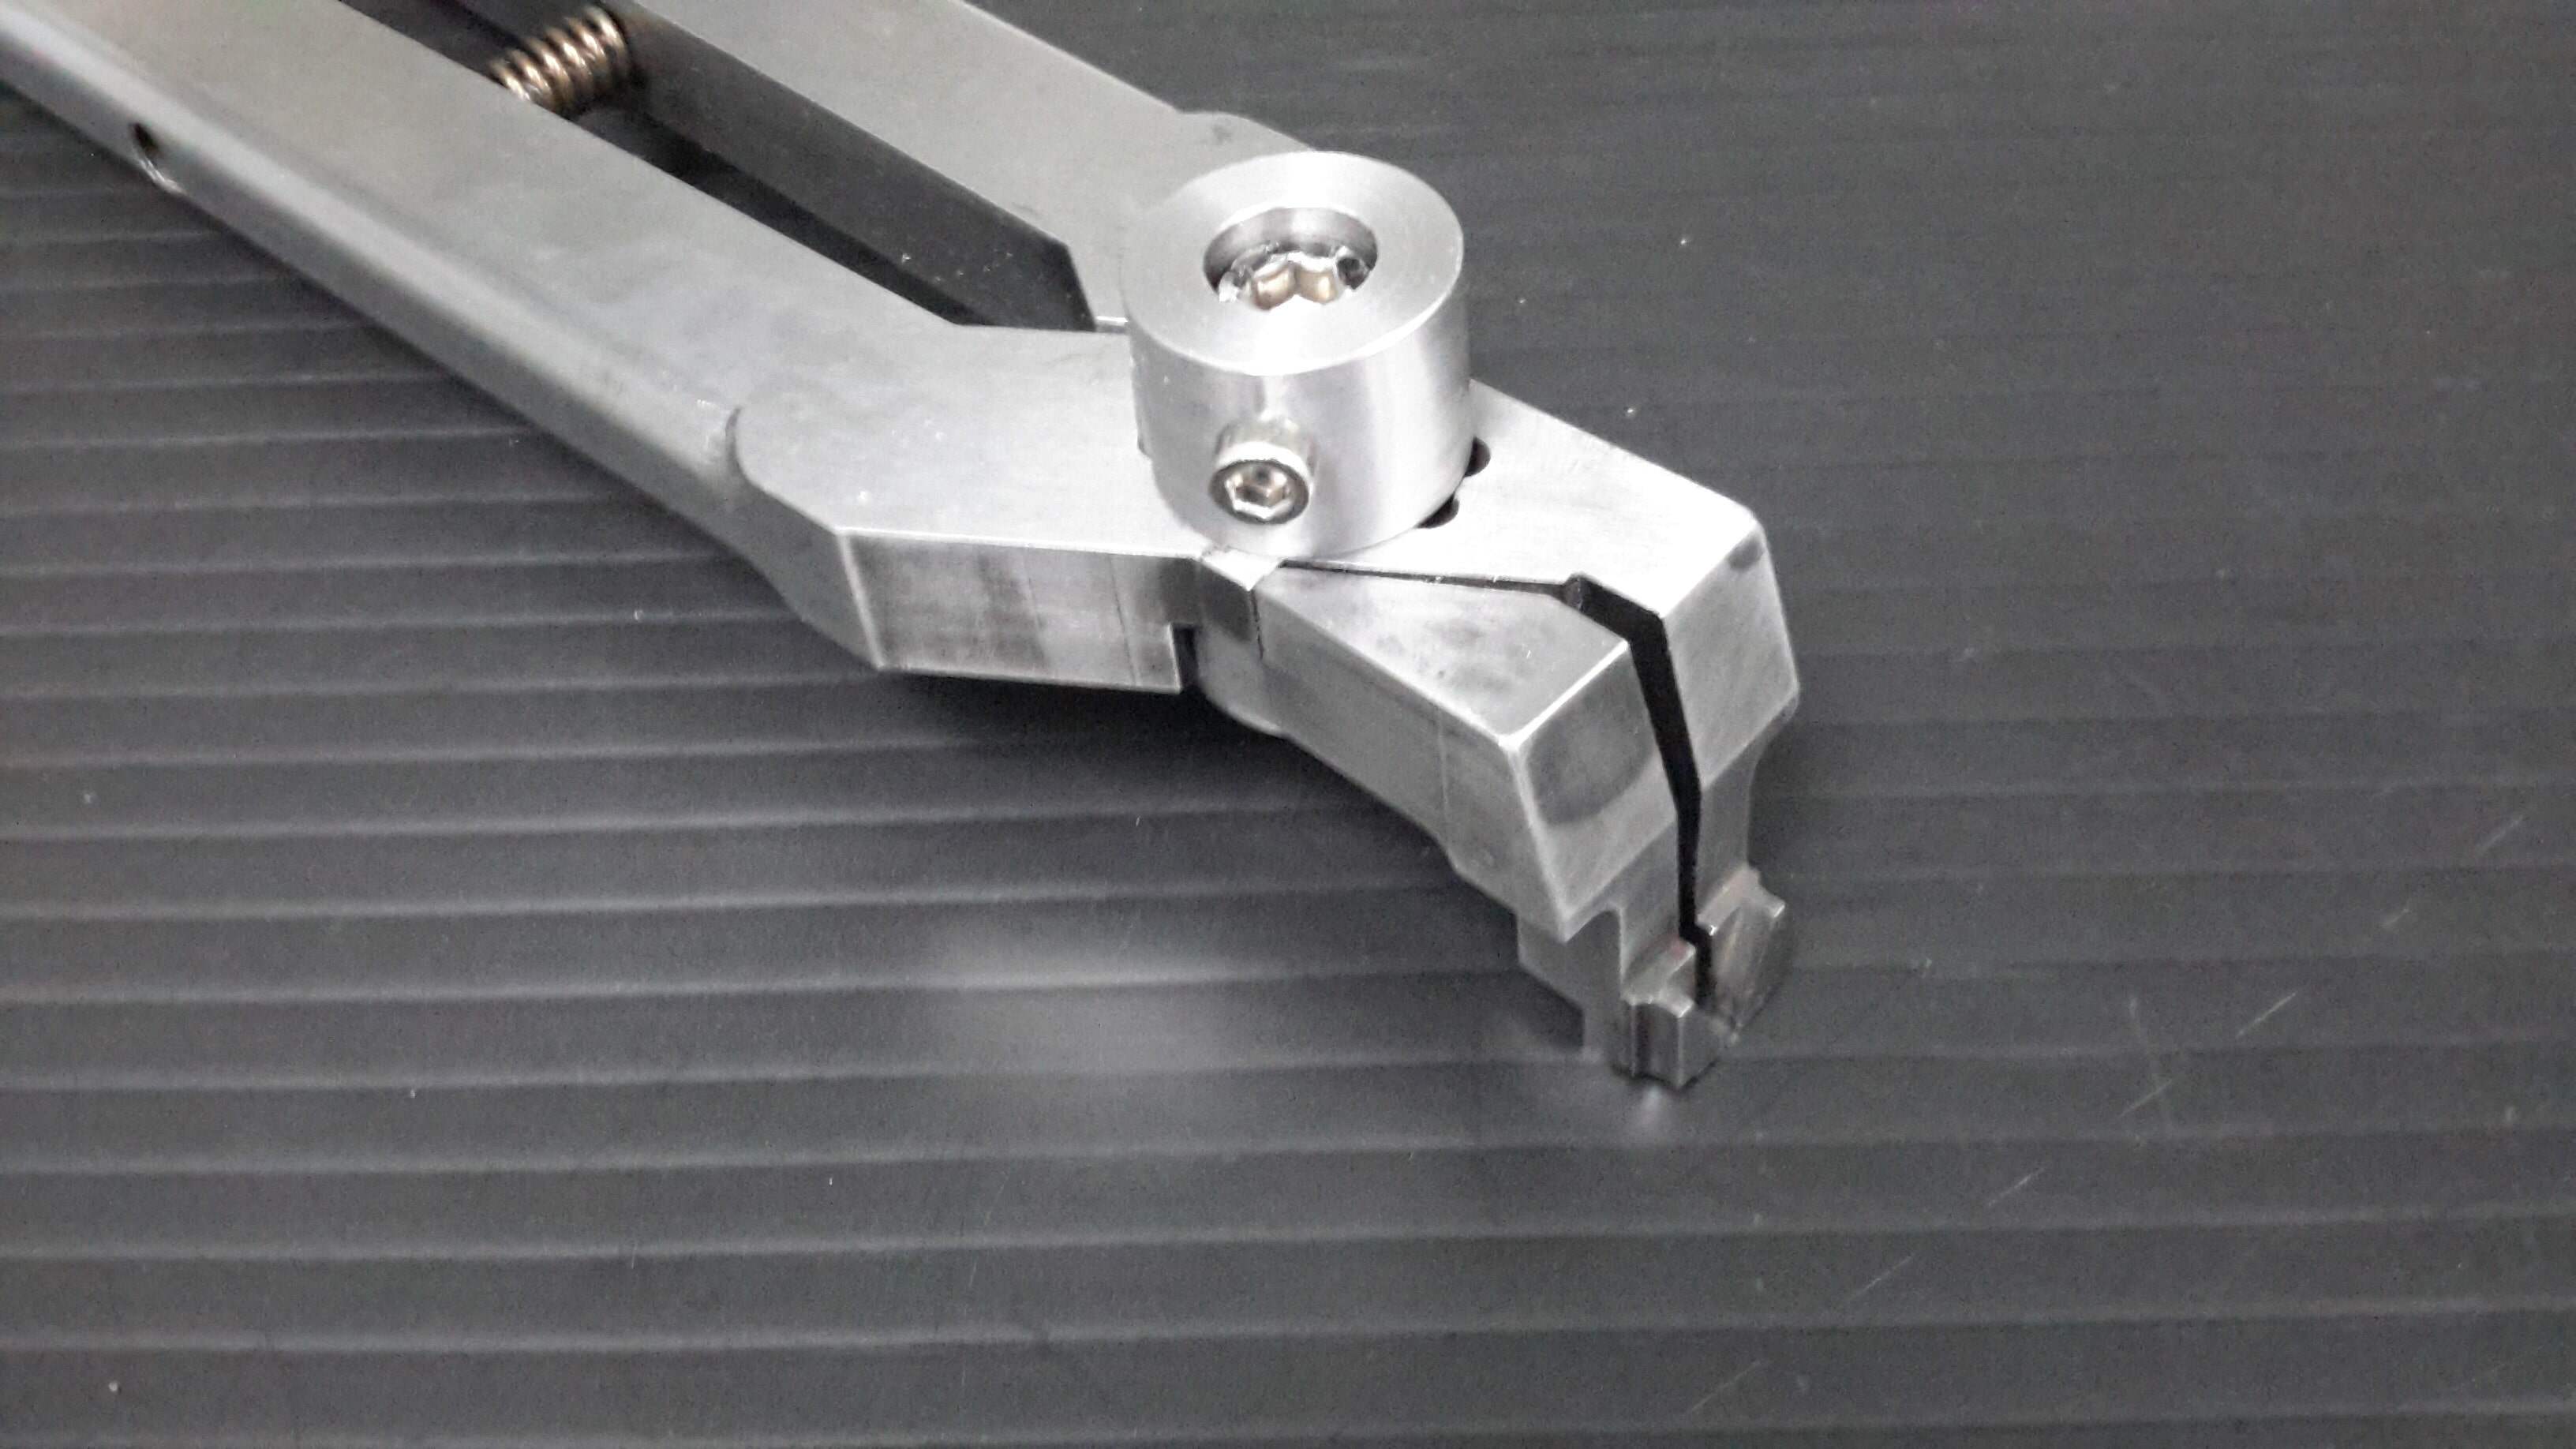
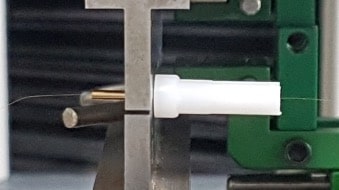
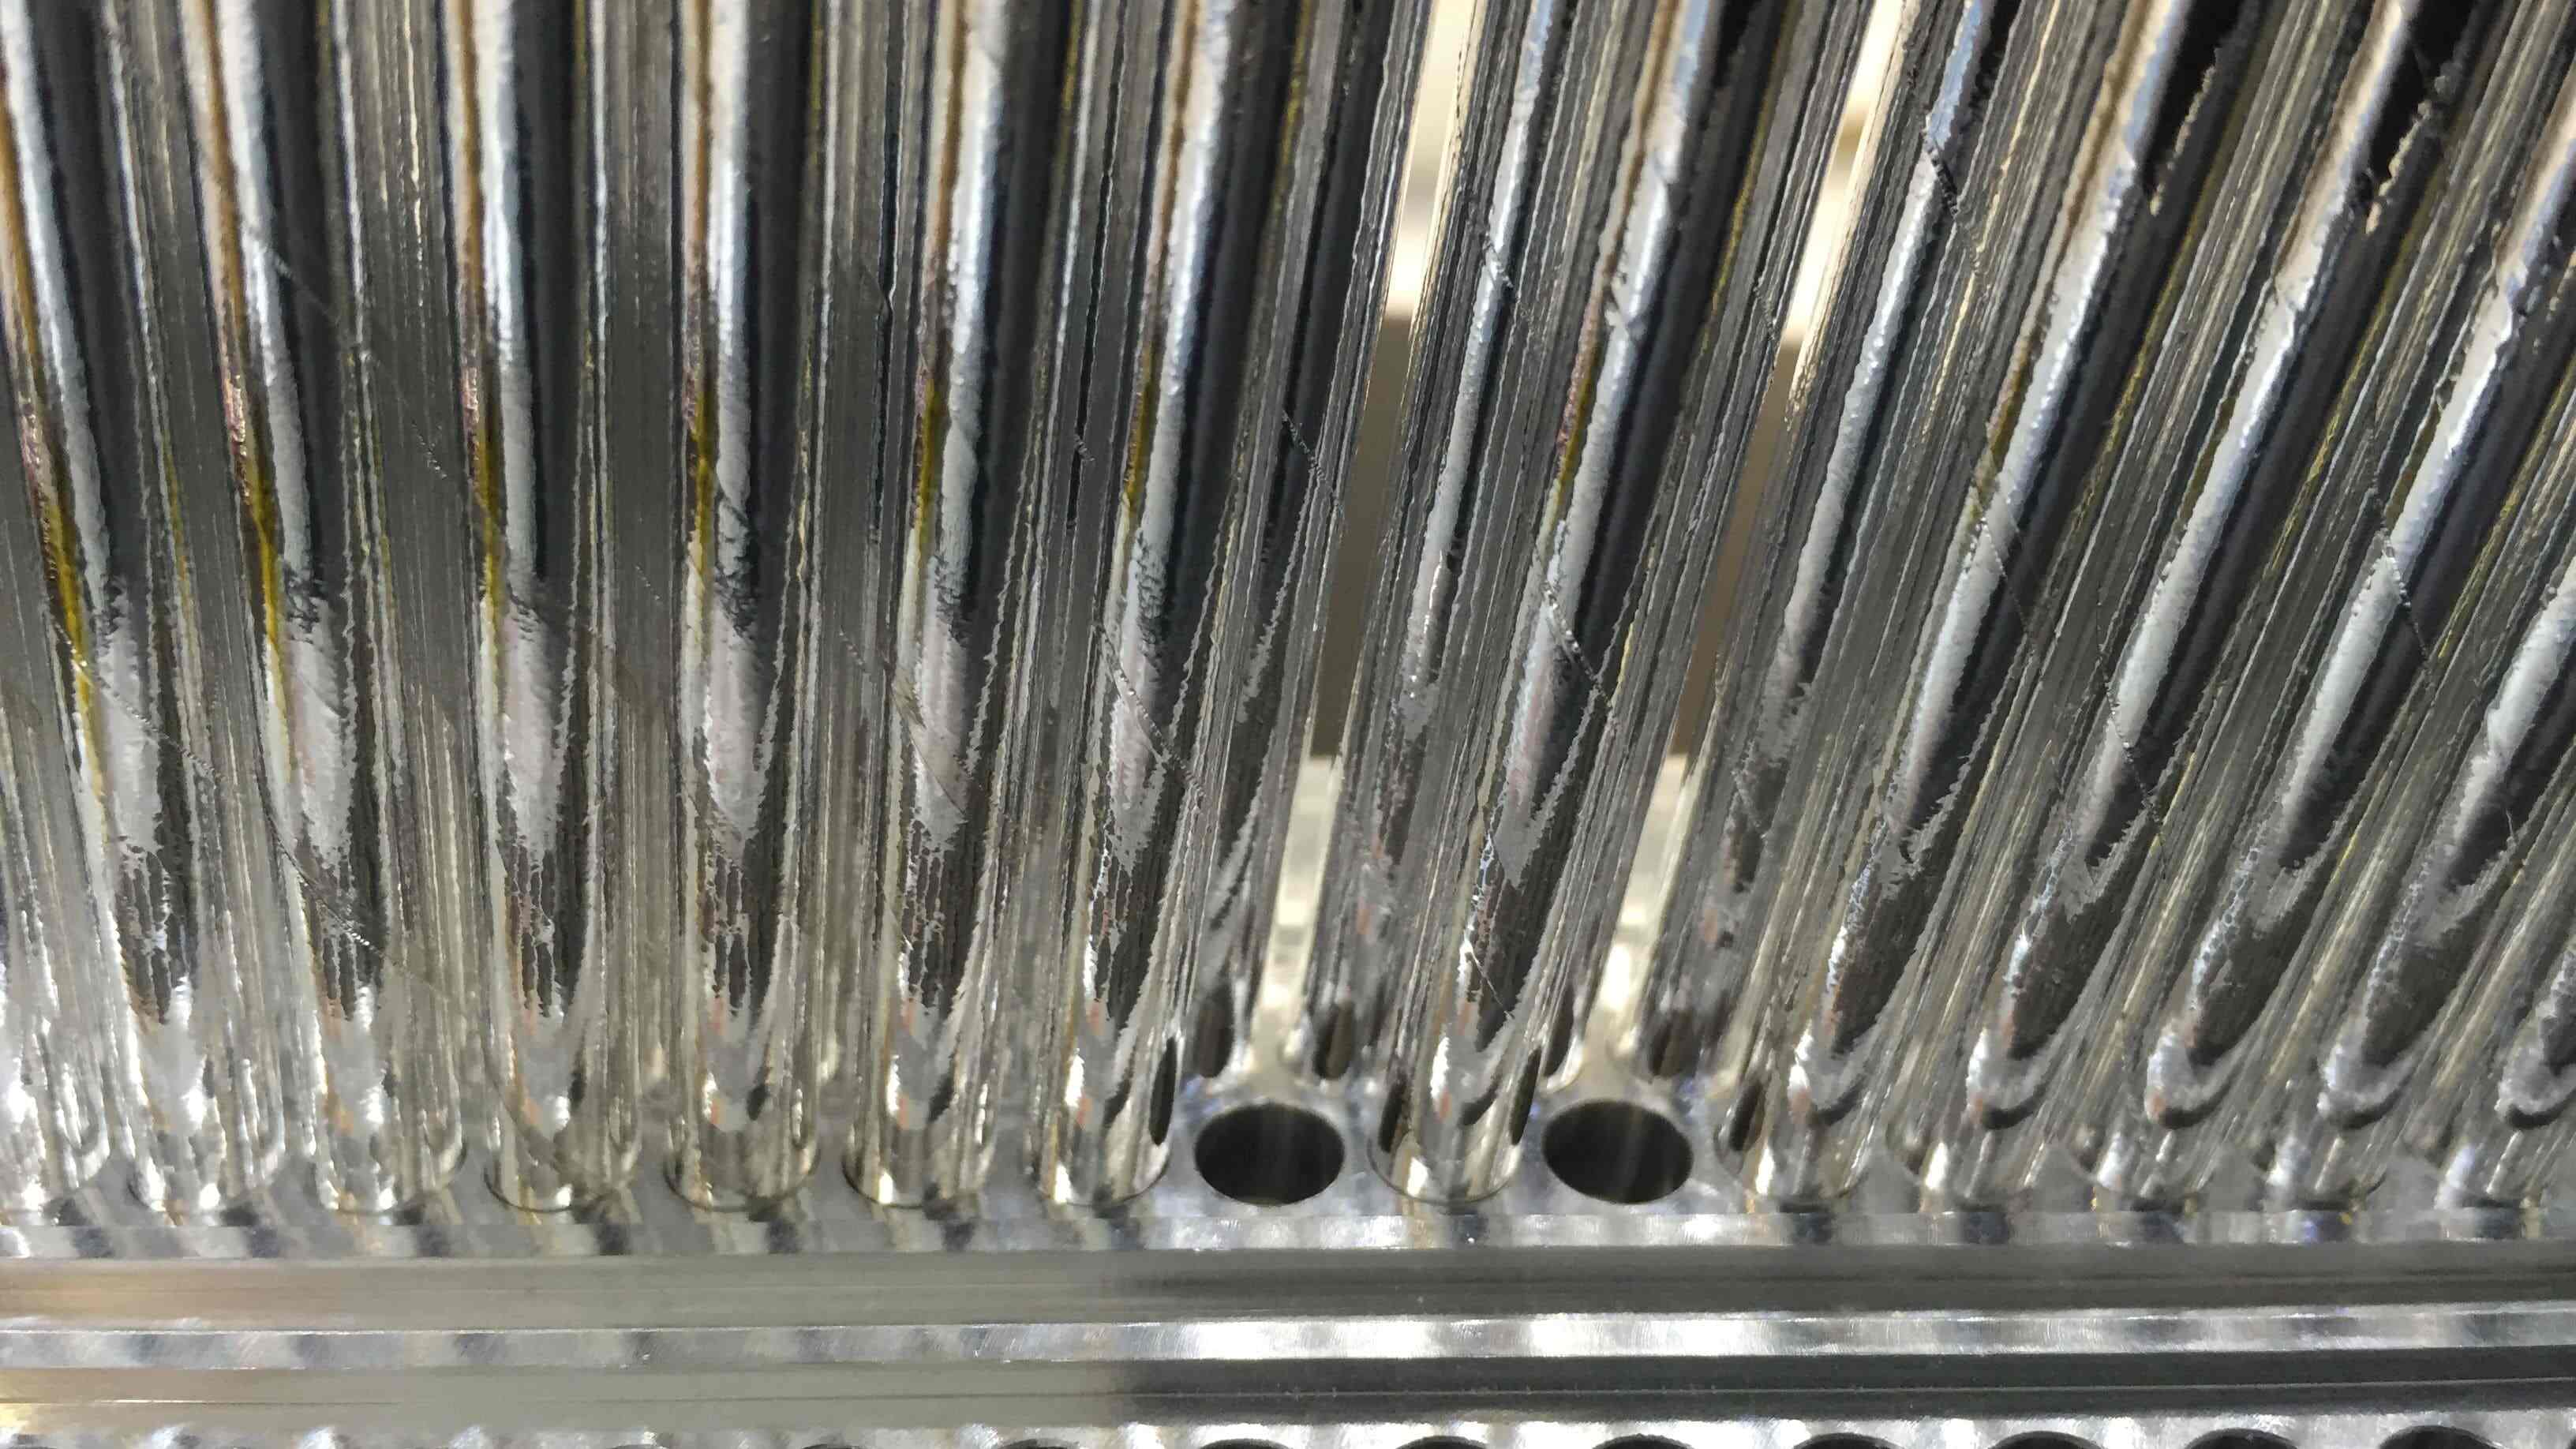
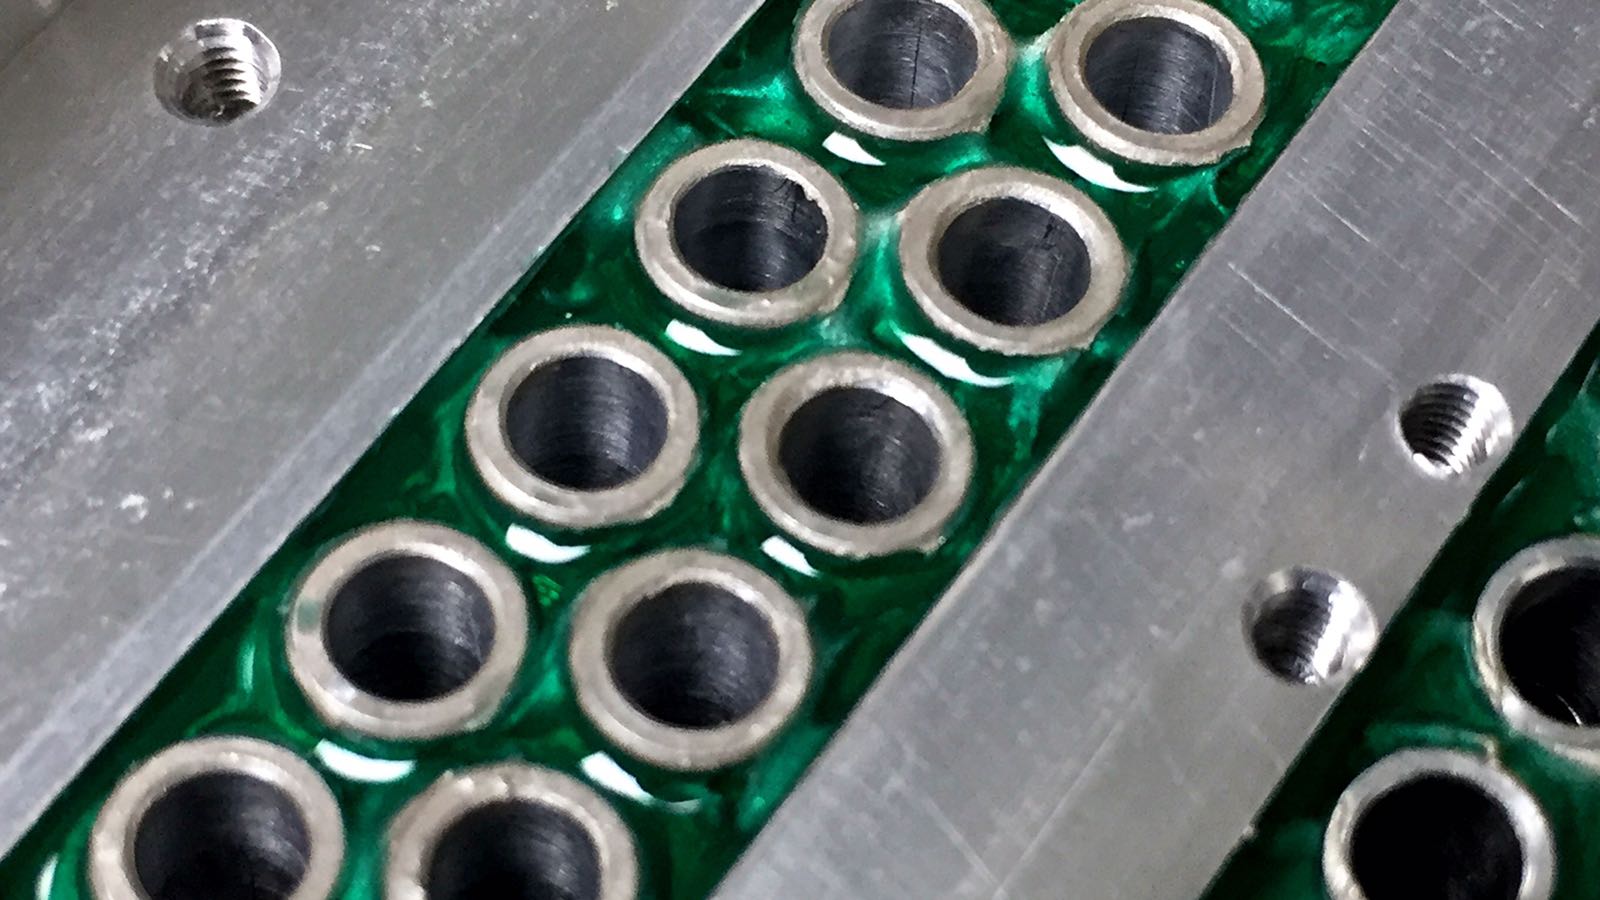
The straws inserted and glued into the modules are shown in Figures 12(c)-12(e). All straws are separated such that the straw centers are spaced 6 mm from each other. Before being inserted into the module, the ‘long’ pins were crimped onto the wire using a custom tool constituting a set of jaws attached to a tension machine. Images of this procedure are shown in Figure 12. A force of 1 kN was applied between the jaws to crimp the pin securely onto the wire, without snapping or damaging the wire inside the pin. The wires were then threaded down the straws and the plastic insert seated in place in one end of the straw. The wires were strung and crimped with an applied tension of 0.3–0.5 N (30 g) to remove any kinks or sharp bends that could be discharge hazards. While under tension, the plastic insert was carefully placed in the aluminum end-piece, and then the pin was pushed into the insert and secured with a small amount of epoxy. The crimping method allows good control over the location of the wire in the straw, and each pin could be worked on independently without risk of damage to neighboring pins. After the pin was crimped, the excess wire was cut off and a small amount of glue (50% epoxy, 50% rapid Araldite) was applied to the end of the pin to smooth over the cut piece of wire.
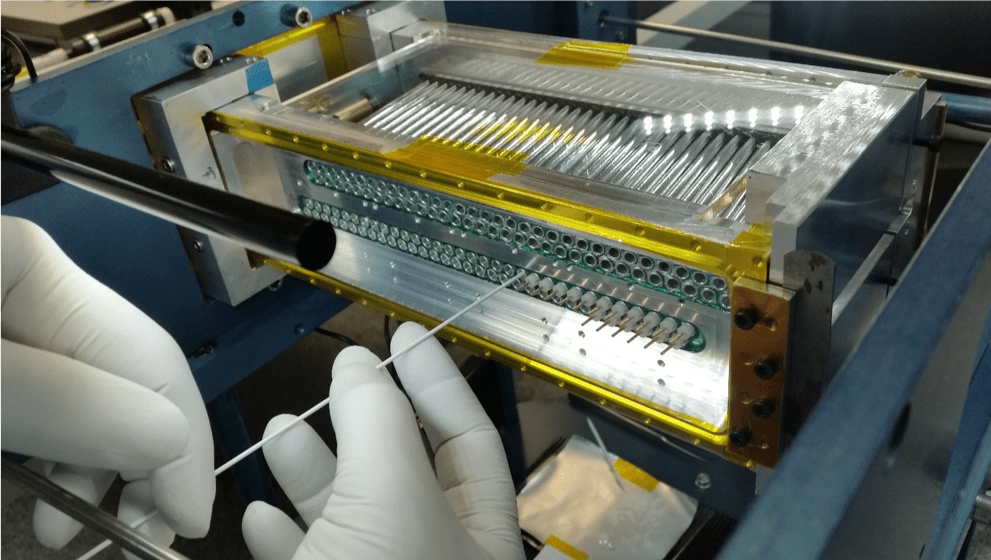
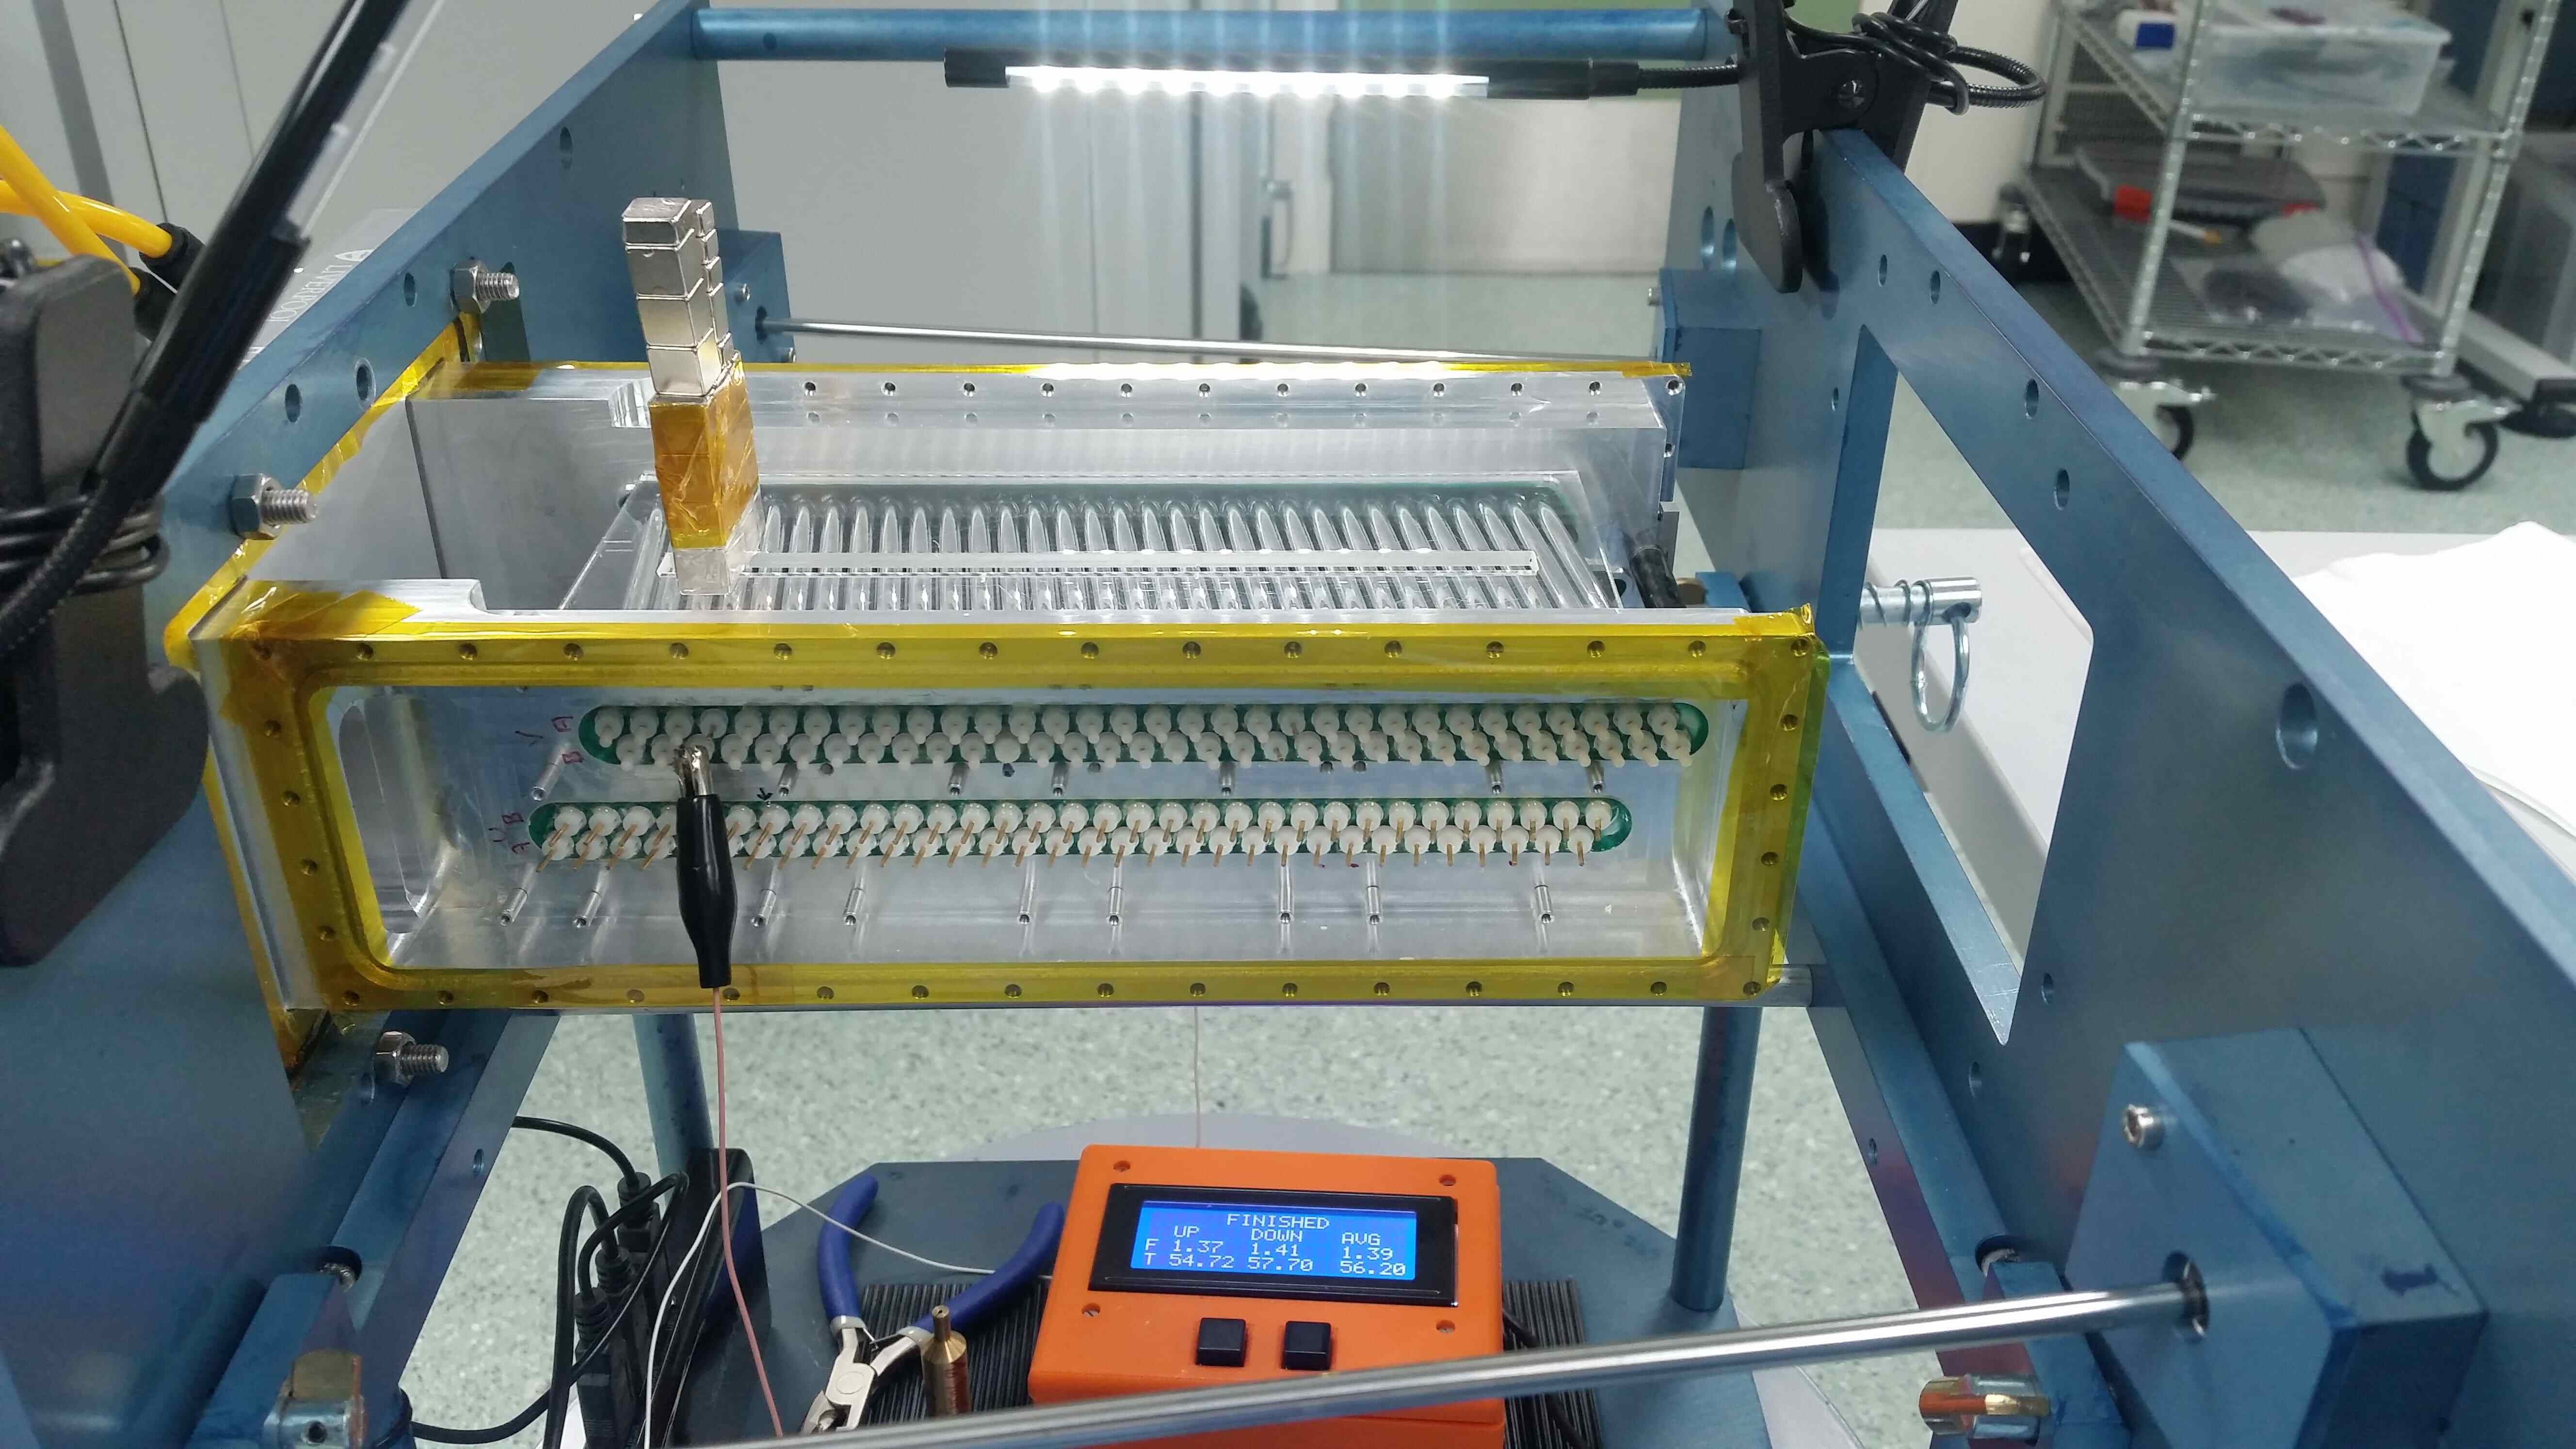
Before the electronics were installed, the manifolds were pulled apart by 50 using a jack in order to ensure an overall 50 g tension was applied equally to the straws and wires. This removed any kinks or creases in the straw walls such that every individual drift tube has a constant radius, and there are no sharp points which could cause discharges, and allowed for compensation for expansion under vacuum during experimental operation. The tension had to be applied very carefully in order not to damage the straws or introduce small holes from which gas could leak. As part of a series of quality assurance tests, a resistance test was carried out on each strung wire under tension. Each should be within the range of – . If wires were outside this range, they would be removed, re-strung and re-tested. At the edge of the straw module furthest from the flange is a 5 mm-diameter carbon fiber post, which supports the manifolds and ensures that they remain a fixed distance apart for the entire length of the module, such that the tension across every straw and wire is constant. The post is made from carbon fiber as this has a comparatively high strength-to-density ratio, reducing the risk of multiple scattering while enabling sufficient support to the module.
After the module had been tensioned and the carbon fiber support post had been installed, custom-built tension-testing devices were used to survey the straws and wires to ensure none were damaged during the tensioning process. The wire tensions were measured by placing a magnet above the wire, sending a current through the wire and measuring the amplitude of the wire oscillations. The current was changed until the resonant frequency was found, and the tension deduced from that resonant frequency. Assuming no wires needed to be replaced, the module was then inserted into a vacuum chamber, which was pumped down to a value of Torr and left in the chamber for 24 hours to ensure it could hold the required pressure. Rate-of-rise tests were done to check for slow leaks. During the early stages of construction, six of the straws were found to leak. As it was not possible to repair these in situ, the end caps were plugged and were deemed inactive. As an additional check, a light-transmission testing stage was added to the process, after which no more straws required plugging. Electrical performance tests were also performed to ensure the module could hold HV for a sustained period and that the straws could detect hits either from cosmic rays or a radioactive source. No wires were broken during transport, testing or installation. Further details on the procedures and tests described here are documented in [17]. The testing of fully constructed tracking detector modules is discussed in Section 5.
For the purpose of handling the completed modules, custom Perspex shields were constructed to reduce any risk of potential damage, e.g., inadvertently changing a module’s resistance. The Perspex was custom cut to fit in the gap beneath the manifolds, with one piece placed on either side. This allowed, among other things, for safe transport of the modules to Fermilab and the ability to clean the modules with isopropyl alcohol without damaging the straws.
4 Electronics and Data Acquisition
4.1 Frontend Readout Electronics
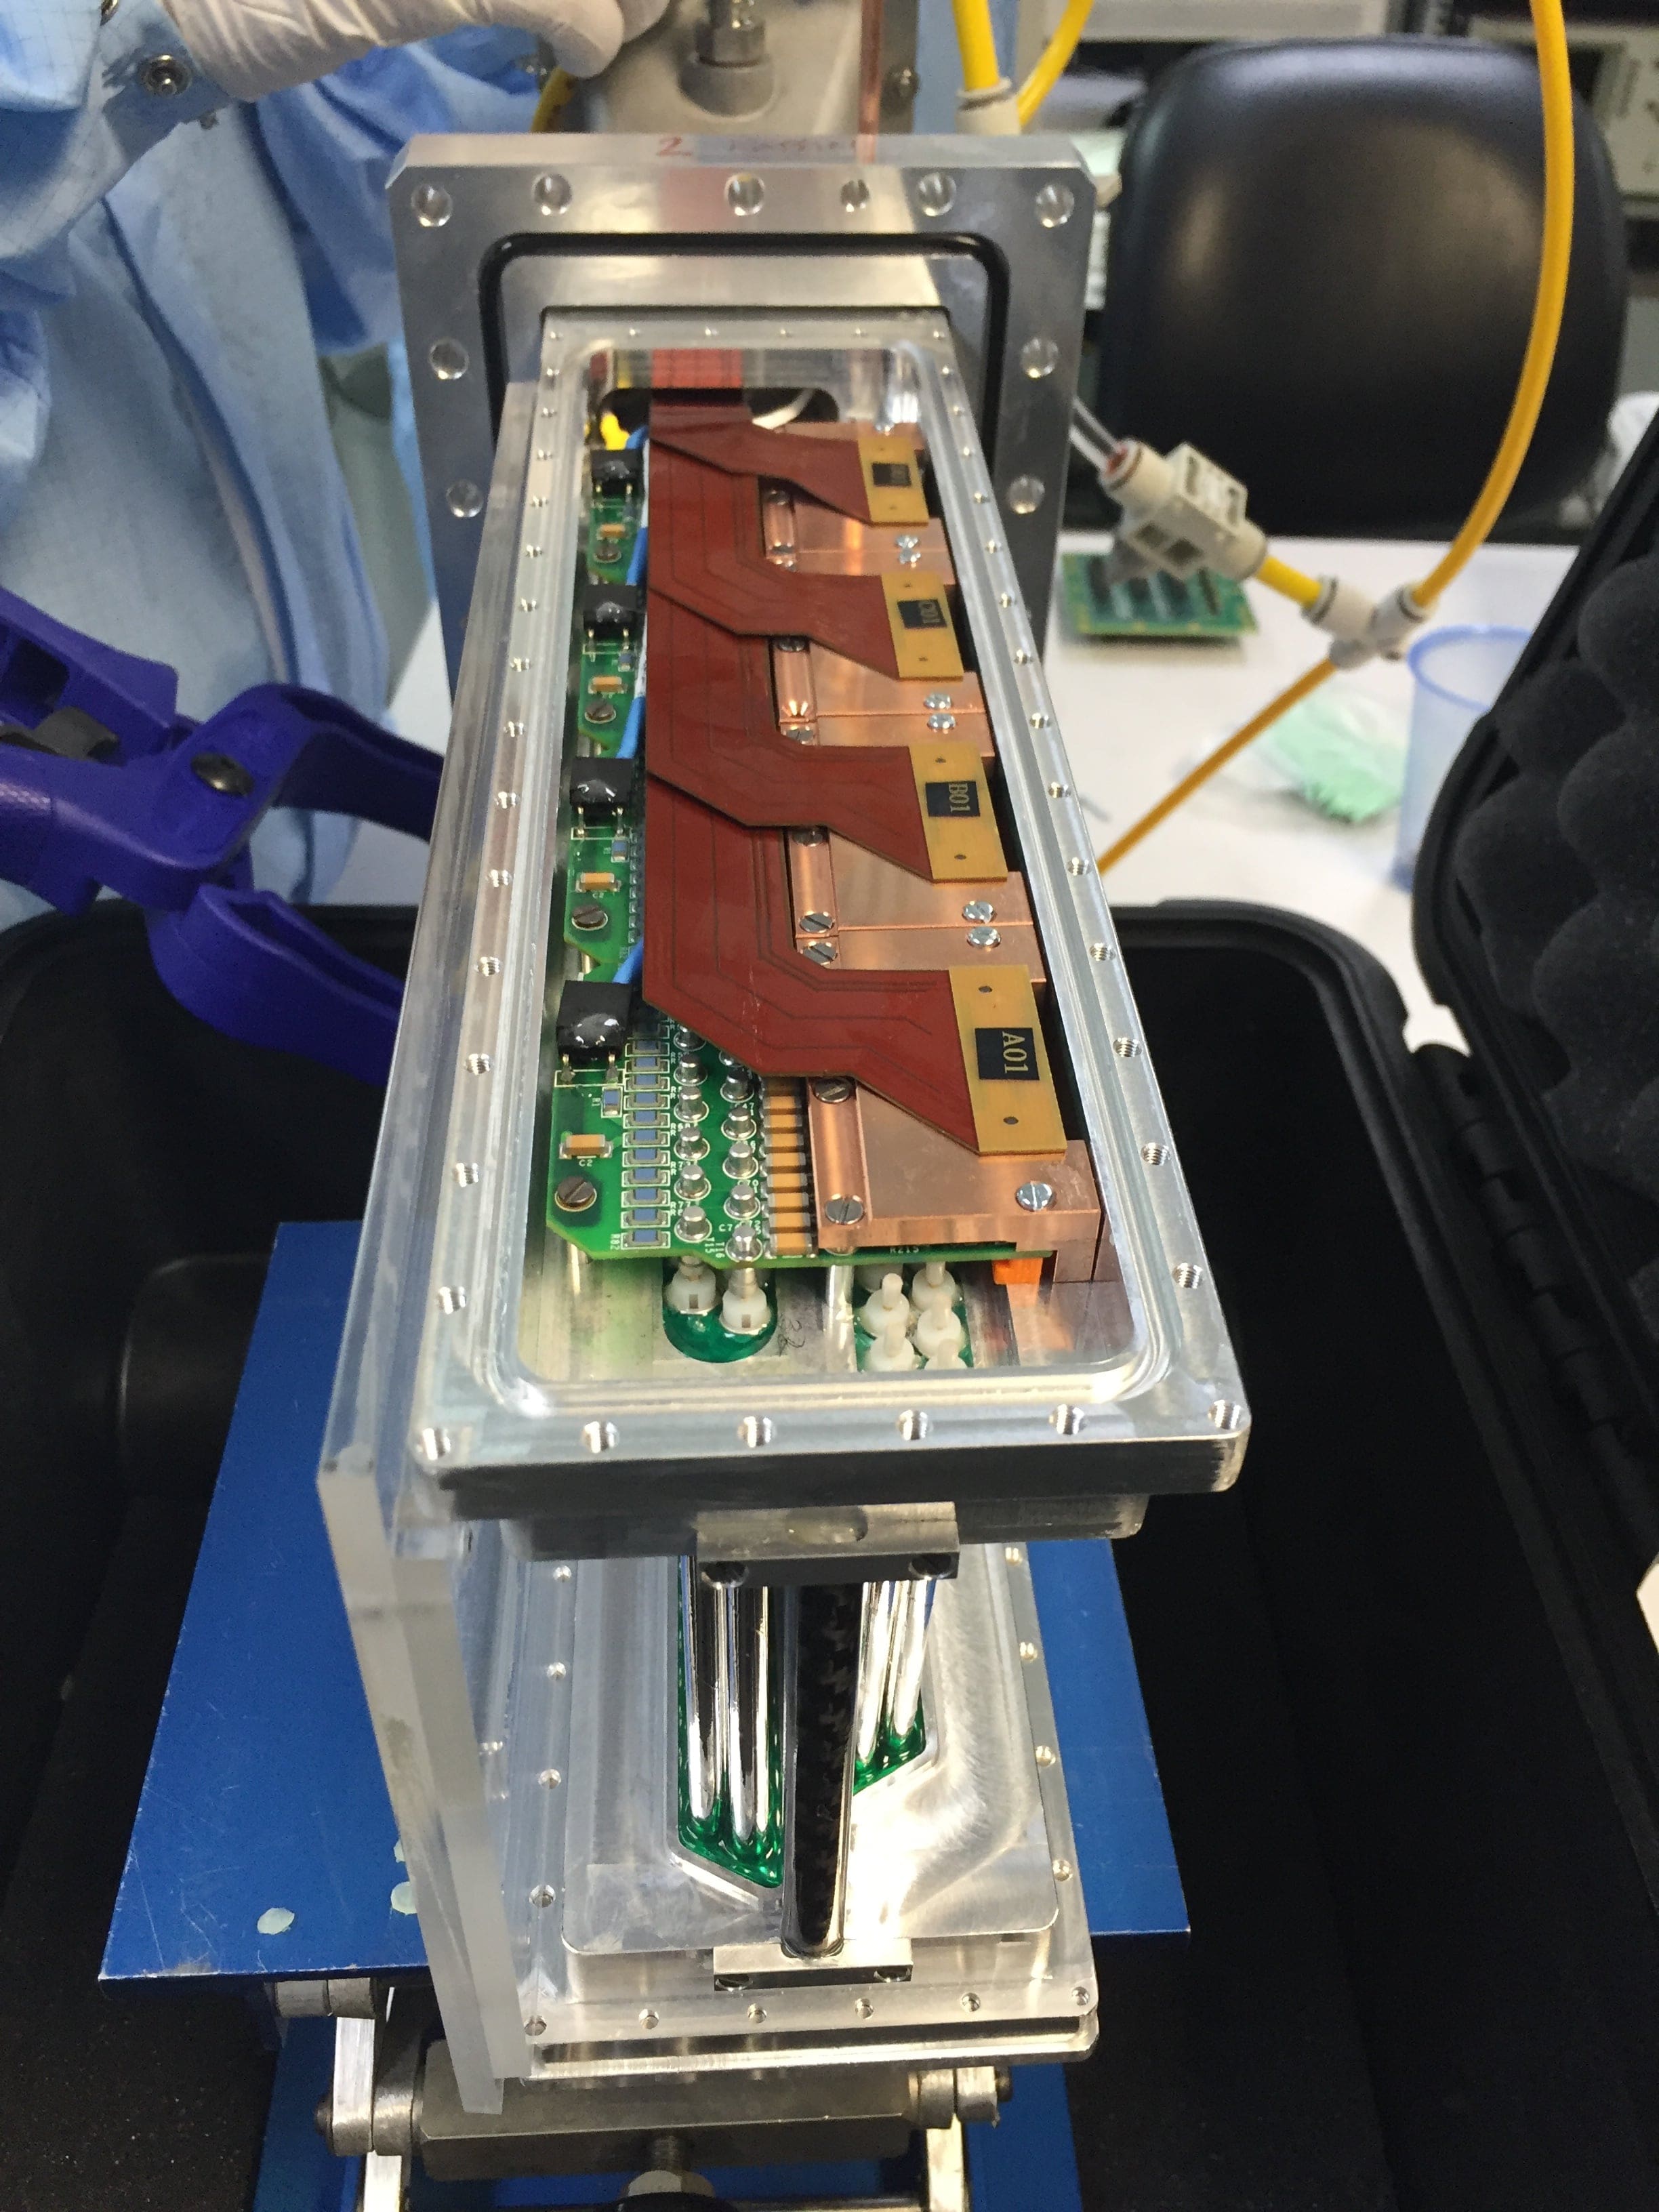
The frontend readout electronics consist of six different board types with the schematic design shown in Figure 13. The ASDQ (amplifier shaper discriminator with charge (Q)) boards, shown in Figure 14(a), are connected directly to a group of 16 straws and housed in the manifold of the tracking detector module, as shown in Figure 15. Each board contains two eight-channel ASDQ ASICs (application-specific integrated circuit) which were originally developed for the CDF Central Outer Tracking Detector [22, 23]. These ASICs provide amplification, shaping, a discriminator and charge measurement. They meet the design requirements for the tracking detector with fast charge collection (8 ns), good double pulse resolution (30 ns), low power (40 mW/ch) and low threshold (2 fC). They also provide baseline restoration and ion tail compensation using a pole-zero cancellation technique. The discriminator threshold for the leading edge can be adjusted. In addition, the width of the signal can be altered by changing the drain current into the integrating capacitors in the discriminator circuit. It is also possible to inject realistic input pulses using the calibration circuits, allowing the circuit delay time and pulse width-to-input charge relationship to be determined on a channel-by-channel basis. The boards are cooled by a silicone-based thermal pad and copper cooling finger attached to the water cooling line described in Section 3. After assembly, the ASDQ chip heights were measured and only boards within a tolerance of 30 were used to ensure good contact with the cooling finger. The temperature on each board is monitored with a Maxim Integrated DS18B20 digital thermometer [24]. The digitization and readout were found to increase the noise level, so measurements are only performed in between muon fills when no data are stored.
The output of each ASDQ chip is eight LVDS (Low Voltage Differential Signal) pairs, where the leading edge represents the time the threshold was crossed, and the width is proportional to input charge. These are transferred through flexicables through a feedthrough board (Figure 14(b)) to one of two TDC boards (Figure 14(c)). The flexicables also carry power, reference voltages and calibration signals to the ASDQs. The feedthrough board provides a gas seal, allows for signals to be passed in and out of the gas volume and acts as a backplane for all other frontend boards. The TDC implementation stamps transitions with a coarse 400 MHz counter and is extended to fine precision (625 ps LSB) by a hand placed 4-phase sampler circuit. Each TDC board has two Altera Cyclone III Field-Programmable Gate Arrays (FPGA) [25] which digitize up to 2016 hits per trigger to the accuracy of 625 ps. It receives an external 10 MHz clock which is multiplied up internally to 400 MHz for time measurements and internal operation. After receiving a trigger, the TDC starts a readout cycle for a given time window according to programmable delay and width parameters.


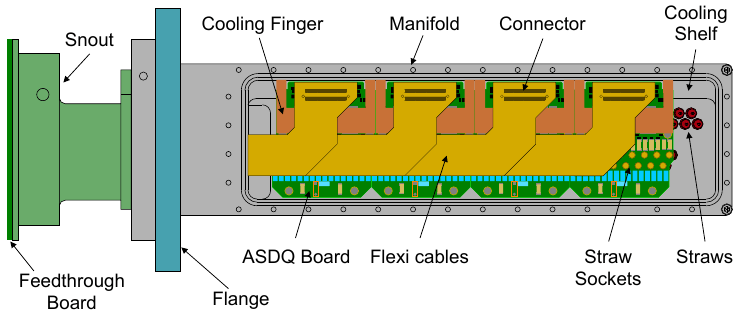
The data from the two TDC boards are transferred to a logic board (Figure 14(d)) which assembles the event and sends it to the backend electronics in 8b/10b format [26] at 125 Mbits/sec over optical fiber. The logic board contains a Xilinx Spartan-6 FPGA [27] which can buffer up to five spills from each TDC and can be remotely reprogrammed. It receives an external 10 MHz clock with control and trigger signals encoded using the C5 clock-command combined carrier coding [28] which it multiplies and distributes to the TDCs. It has a mezzanine board that regulates the external power and supplies the reference voltages required by the ASDQs, with temperature, voltage and current sensors which can be monitored.
There are also two HV boards for each tracking detector module. Each of these boards filters an external supply of four HV channels, passing them via the feedthrough board to the ASDQ boards along a separate cable. The ASDQ boards further filter the HV and provide it to each straw through a 100 current-limit resistor. Each straw has an 0.49 nF blocking capacitor to isolate the HV from its ASIC input.
4.2 Backend Readout Electronics
The backend readout uses FC7 advanced mezzanine cards (AMC), originally developed for the CMS experiment [29], to provide the clock and control signals to the logic boards and receive the hit data back. They are housed in a TCA (micro Telecommunications Computing Architecture) crate, with up to 12 slots available, and connected to an AMC13 controller module [30] via the backplane. The crate also has a commercial TCA Carrier Hub (MCH) controller which provides the Intelligent Platform Management Interface (IPMI) functionality and Gb ethernet. The FC7 board has a Xilinx Kintex-7 FPGA [31] and can accommodate two FPGA Mezzanine Cards (FMC).
The clock, control and readout data are transmitted between the FC7s and the logic boards via fiber optic cables which has the benefit of decoupling the clock/control/data-readout signals from the low voltage (LV). One FC7 is sufficient to readout a single tracking detector station since each of the 16 logic boards will communicate with the FC7 with a single fiber pair (via a small form-factor pluggable (SFP) transceiver) and each of the two FMCs on the FC7 can accommodate eight fiber pairs. The FC7s required to readout the entire tracker detector can therefore be comfortably housed within one TCA crate, with space for spares to allow for quick recovery should an FC7 fail. The FMCs containing the 16 SFPs is the CERN EDA-02707 [32] which is also used for the Trigger, Control and Distribution System (TCDS) at CMS. The configurations for the AMC13 and FC7 boards are sent over the ethernet connection using the IPBus communication tools developed by CMS [33].
The clock and control signals are sent over the backplane from the AMC13 to the FC7s where they are encoded into C5 and transmitted to the logic boards on a 10 MHz clock. The 8b/10b data from the logic boards are formatted in the FC7 to match the requirements of the AMC13. The FC7 has 30 MB of clock RAM which is more than an order of magnitude larger than the data volume expected from one spill in a single tracking detector module.
4.3 Data Acquisition System (DAQ)
The DAQ system is triggerless. Hits in the straw tracking detector are recorded for approximately 700 s commencing 2 s after muon beam injection. The beam arrives in 16 separate spills over a 1.4 s period. There are 8 spills separated by 10 ms, a 197 ms gap, a further 8 spills separated by 10 ms, and then a 1063 ms gap.
The data collected by the AMC13 are transferred to the PC over IPBus [33] in 32 kB blocks, which is sufficient given the low data rate from the tracking detector. Functionality to transfer the data using 10GbE optical fiber links also exists. The DAQ software is based on the MIDAS package [34] that was developed at the Paul Scherrer Institute and is now maintained at TRIUMF. It consists of function templates and library routines for processes that handle the communication with the backend electronics, event building and data logging. The DAQ frontend code packages the detector data into a MIDAS bank and passes it to the event builder where the banks from all other detector systems are combined into a single MIDAS event.
The experimental configurations are stored in the MIDAS online database (ODB). The ODB can be accessed from the web page to adjust the parameters as required and can be read from or written to via the frontend code. This contains configurations for each individual board, as well as global settings, with the most important parameters displayed on a custom web page. There are also buttons for turning the low and HV supplies on and off which can be used by nonexperts.
In addition to the fast frontend collecting the data, there are two slow control frontends, asynchronous from the event builder. These run periodically to monitor information about the boards and low and HV supplies such as temperatures and currents, storing the values in both the ODB and a PostgreSQL database. Alarms can be thrown based on the values of the parameters stored in the ODB.
The data are also passed to an online analysis layer using an art-based analyzer [35] together with JavaScript to publish plots of the data in real time to a web server. As the analysis process is slower than the data rate, it is designed such that it always processes the most recent event. The plots show both basic information (number of hits per straw, total data size, found errors) and complex results, such as the reconstructed straw drift time distributions, which have been found to be highly sensitive to issues with the HV, gas or detector timing. In addition, full track reconstruction is performed on a smaller subset of the data and the reconstructed beam profile can be monitored. Alarms are thrown to the MIDAS DAQ system in case any errors are found.
5 Testing and Installation
5.1 Test Stand and Quality Assurance
As part of a dedicated quality control and quality assurance plan, a radioactive source test stand was designed, constructed and installed at Fermilab [15]. The purpose of the completed stand, shown in Figure 16, was to evaluate the performance of each tracking detector module: straw response, gain, and position of each straw and wire. The frame was constructed from extruded aluminum, with a tracking detector module mounted into an aluminum flange identical to the mounting flanges on the storage ring vacuum chambers. Horizontal and vertical motion is achieved with a Velmex XSlide traverse system controlled with VXM motor controllers [36], which was measured to have a positional accuracy of m [37]. The two-dimensional motion system mounts to an inverted “U”-shaped aluminum bracket that contains a radioactive source holder on one side of the module and an Eljen EJ200 plastic scintillator [38] read out by a SenSL MicroFJ-SMPTA-30035 silicon photomultiplier (SiPM) [39] on the other side. The source is highly collimated and mounting pins enabled the orientation to be shifted from the vertical to match the straw stereo angle. Extensive optimization was performed on the test stand’s physical dimensions, collimator size, and event rate [37].
This arrangement permitted scans of the entire active area of each module with either an 55Fe -ray or a 90Sr -ray source, as well as data quality assurance tests of hits registered from cosmic muons. The 55Fe source provides a nearly-monoenergetic ray that deposits a fixed amount of energy in the straw. This source can be used to measure the gain of each straw, which is defined as the ratio of charge produced at the sense wire to the initial charge at ionization. Once the modules are constructed, there is no direct way of measuring the charge on the sense wire. Instead, the ASDQ discriminator threshold was used as a proxy. Independent measurements using the discharge of a small capacitor determined the response of the electronics to a given input charge deposited in a few nanoseconds, providing the conversion from discriminator threshold to Coulombs. A change in threshold of mV is equivalent to fC.

The 55Fe source was placed in the source holder at a constant distance away from the straw and remained at this distance for all measurements. The low energy photons from this source are fully absorbed by the argon and produce the initial ionization. There are three photon energies produced, corresponding to keV X-rays, keV X-rays and the keV escape peak [40]. In practice, only two peaks are observed as the two X-rays are only resolved as a single peak. The discriminator threshold was gradually increased starting from the noise floor and the number of hits per trigger recorded until no hits were observed. A typical scan is shown in Figure 17(a). The noise at low threshold energy was fit with an exponential, and two complementary error functions (the integral of a Gaussian) were used to model the response to the different initial charges from the X-ray and escape peaks. The equivalent Gaussian and exponential functions are shown for clarity in Figure 17(b).


The number of electrons in a single ionization cluster from 55Fe X-rays is significantly larger than that expected from an ionization from a typical signal positron. In order to maintain a reasonable signal amplitude, the measurements are made at a lower HV setting than normal running, ranging from V in steps of V. The mean of the higher energy peak was compared with that expected from a Garfield++ simulation [41] for each voltage setting. As shown in Figure 18(a), this was found to be in excellent agreement (following normalization with a single scale parameter). The simulation can be used to extrapolate the gain to the operating voltage.
The 90Sr/Y source releases a -ray with an end-point energy of MeV and was used to measure the functionality of each straw and its readout electronics. Measurements, shown in Figure 18(b) for Ar:CO2 80:20 and Ar:C2H6 50:50 mixtures, were carried out to find the optimal operational wire voltage for the modules. Measuring the event rate versus the applied wire voltage produces plateau curves, indicating that in plateau regions all beta particles traveling through the straw are detected by the wire as hits. The plateau for the intended Ar:C2H6 50:50 mixture resulted in a chosen operating wire voltage of 1650 V. The gas gain at the nominal straw conditions during experimental operations is estimated to be .
In addition to measuring the plateau voltage, a scan across the chamber provided information on the position and angle of each straw. Figure 19(a) shows a two-dimensional distribution of event rate for a single straw. Measurements with different horizontal and vertical source positions allow the confirmation of the straw stereo angle. Using the 90Sr source with a trigger from the plastic scintillator and silicon photomultiplier provides additional timing information. In this way, both the wire position and the time to drift distance relationship can be measured. A scan of average drift time versus horizontal source position is shown in Figure 19(b). The wire position can be extracted from a fit to these data and multiple scans at different heights allow the measurement of the wire angle. All measurements were consistent with the nominal wire position within a resolution m.


5.2 Gas System
The experimental hall is an enclosed space containing a large cryogenic magnet and the tracking detector gas system, which is supplied in standard high-pressure industrial cylinders. The tracking detector gas is Ar:C2H6 50:50. As such, the gas mixing system for the tracking detector is designed to flow 50% ethane and 50% argon by volume. To mitigate and reduce the corresponding flammable gas and oxygen deficiency hazard (ODH) risks inside the Muon experimental hall, a gas storage shelter containing the supply system (and where almost all the gas inventory is located) was constructed outdoors external to the experimental hall, with lockout and appropriate flammable hazard warnings. The shelter contains two ethane gas canisters, each containing 410 standard cubic feet (SFC) of ethane and a manifold of four canisters of argon, each containing 300 SCF of argon. The ethane is two-phase depending on the outdoor temperature and the pressure inside the cylinder. The ethane canisters are connected in parallel with two isolation valves controlled by programmable logic controllers (PLC).
Due to the flammable nature of ethane, multiple safety mechanisms were implemented to store and distribute the tracking detector gas. The system was designed to provide a continuous flow to the tracking detector during gas canister replacement, and permit the isolation of single points of failure such as a burst straw. When pressure readings from the ethane supply canister in use drops below 25 psig, PLC logic automatically switches both valves to open the second ethane gas canister while closing the empty canister. Spent ethane canisters can be replaced individually by the gas supplier without interruption of experiment operation, as the control system only permits flow from a single cylinder at a time. When the PLC senses low pressure on the current ethane canister in operation, manual valve controls allow the technician to vent any excess air from the line and install a new ethane canister, Using the low volume flow rate of 720 std. cc/min allows for canister replacement every 4 to 5 weeks of experiment operation. When the bank of four argon cylinders is emptied, a backup cylinder is automatically used allowing the four empty cylinders to be exchanged.
Both the ethane and argon supply lines penetrate the experimental hall for mixing, routing, and delivery. Mass flow controllers each supply 50% of the flow by volume of argon gas and ethane, with the PLC automatically adjusting the flow set point to the modules to supply 30 standard cubic centimeters per minute of Ar:C2H6. The argon and ethane are combined in a swirling in-line mixer that proceeds through a control volume buffer along with both carbon and membrane filters. Sample valves are available at this location to test the quality and ratios of mixed Ar:C2H6. The dry supply is then passed through a chilled isopropyl alcohol bubbler at a temperature of C. The supply line then splits, sending the gas mixture around the outside of the ring to the two separate tracking detector stations. If none of the stations are configured to receive gas, then there is routing to directly vent from the supply to the exterior of the building. An integrated pressure control valve and flow indicator monitors the gas flow through the entire tracking detector station. At the station, a manifold breaks the single supply into the eight separate lines for the individual tracking detector modules. Each module can be isolated from the manifold through PLC solenoids that must be energized to stay open. Control logic from vacuum monitors and pressure transducers may shut the solenoids to prevent unwanted contamination in the vacuum chamber due to a burst straw or other tracking detector module failure.
Manual flow metering valves are used to monitor and control the gas flow to individual tracking detector modules. The gas flows into the top module manifold, over the electronics, through the Mylar straws and out past the electronics in the bottom manifold. Pressure transducers positioned after the flow to the module further monitor significant pressure drops (e.g., a broken straw causes vacuum to draw on the gas supply line) confirming the structural integrity of the tracking detector straws. Visual flow indicators are also used for observing gas flow rates at the tracking detector module exit. After passing through the second isolation solenoid, the eight module lines are recombined in a manifold to a sequence of exhaust bubblers. The first bubbler in the sequence is empty to provide protection from drawing mineral oil into the vacuum chamber. In the event of a catastrophic failure, the empty bubbler provides the PLC with sufficient time to close solenoids before the mineral oil could be drawn into the tracking detector and damage other components inside the vacuum chamber. The second bubbler is filled with mineral oil at a sufficient height ( cm) to maintain a positive pressure difference with atmosphere of psia at the ventilation exit. The used tracking detector gas is vented to atmosphere outside of the experimental hall.
As part of both start-up and safety protocols, the multiple PLC valve connections permit tracking detector module isolation in the event of a straw failure and gas selection of either dry nitrogen (from the main LN2 supply) or the operational Ar:C2H6 50:50 mixture to flow within the lines. Dry nitrogen is used rather than the Ar:C2H6 50:50 mixture during routine maintenance to systems, or when the vacuum system is brought up to atmospheric pressure. The dry nitrogen system permits purging the flammable ethane gas in the event that a tracking detector module needs to be replaced, and is more economical if there is a significant interruption to data collection. Importantly, the ability to transition rapidly from Ar:C2H6 50:50 to nitrogen reduces the potential for damage to the components inside of the vacuum chamber from the flammable gas. A full gas volume change in all eight modules of a tracking detector station, including transitioning from nitrogen to the operational Ar:C2H6 50:50 mixture, takes approximately ten minutes. The valve isolation of the gas occurs at multiple levels: (i) the building supply from the storage shelter can be closed; (ii) each tracking detector module can be filled with either nitrogen or Ar:C2H6, as needed for repairs, or diagnostic tasks; and (iii) individual modules can be isolated to prevent gas flowing into the vacuum chamber using the PLC solenoids.
The overall leak rate of a tracking detector station, including permeation through the straws and from the gas distribution system, is Torr L/s, below the storage ring vacuum load requirement of Torr L/s. Under normal operation of Ar:C2H6 50:50, the contribution to the total leak rate from either permeation through the straws or from the gas distribution system is comparable.
5.3 Installation
The first straw tracking detector modules were installed into Muon Experiment in June 2016. Before installation, each module underwent a noise-threshold scan (described in Section 6), ensuring that the connections to the ASDQs remained and no noise was observed above a fC threshold. Each module was then placed in the test stand (see Section 5.1), raised to the operating voltage and tested again with a 55Fe source to ensure the channels were operating as desired.
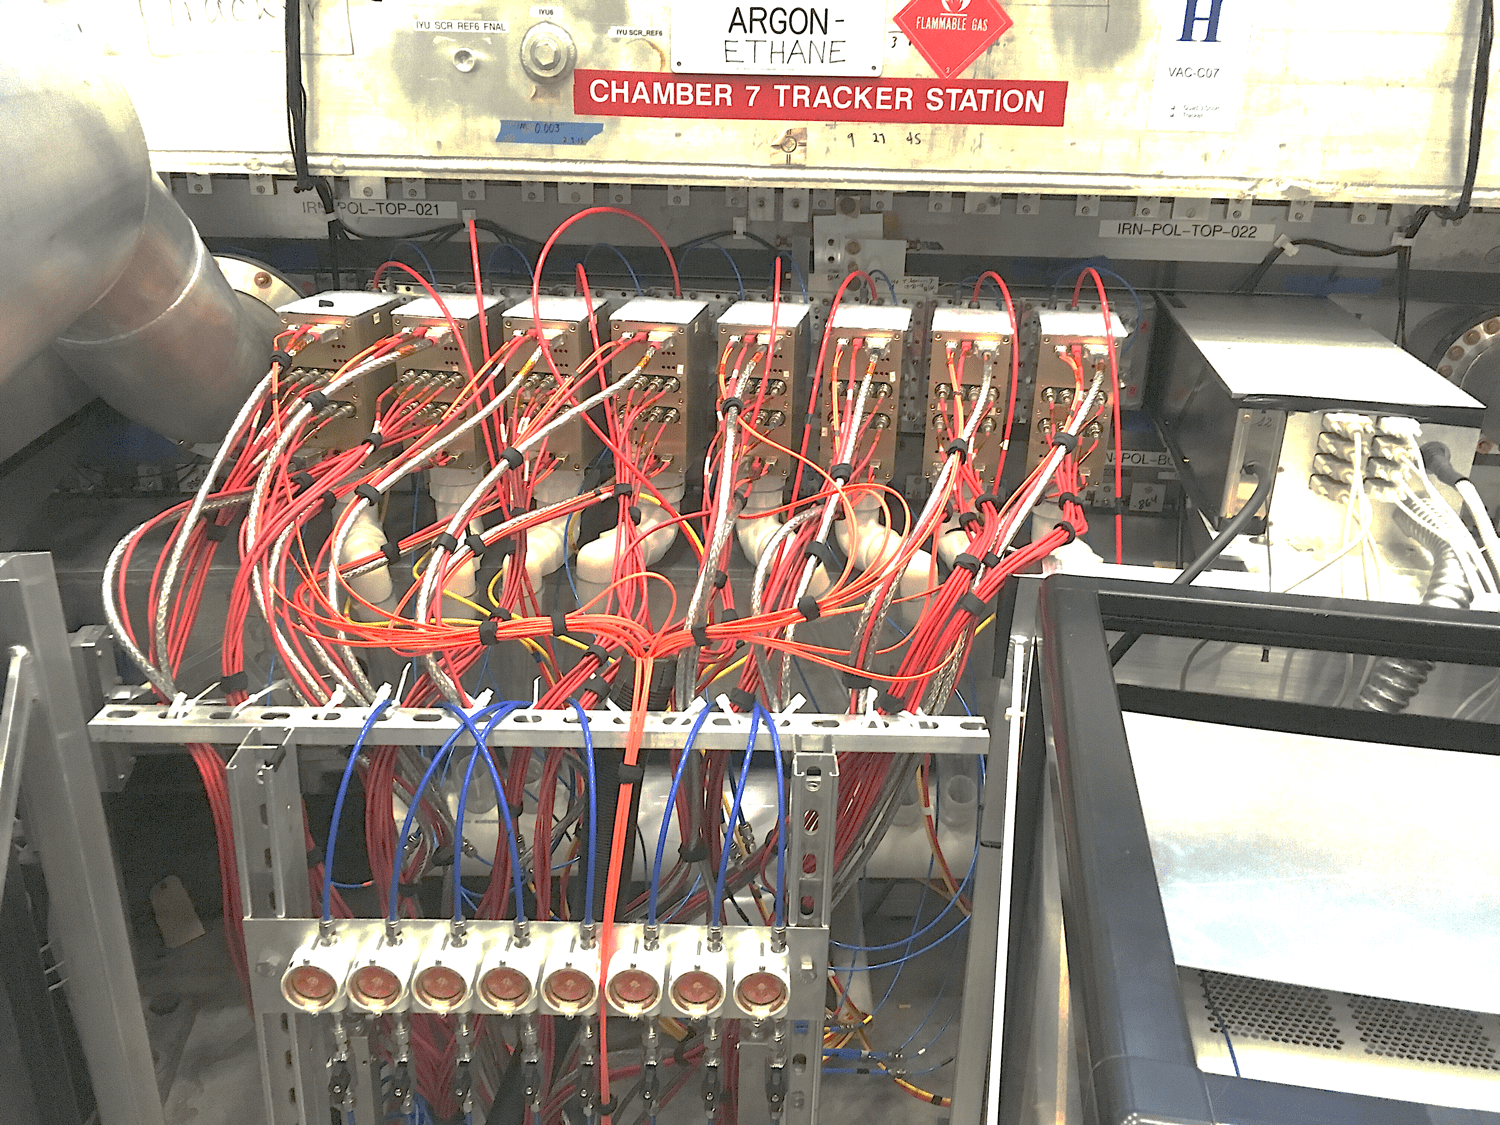
Additionally, modules were again vacuum tested to check for any leaks that could have occurred in transit to Fermilab or developed during storage—none were found. The surfaces of the manifolds were cleaned using ethyl alcohol to remove impurities that would jeopardize the quality of the vacuum. During this process, the straws were kept behind the custom Perspex shields to ensure they did not come into contact with the alcohol. After passing the vacuum test, each module to be installed was purged with nitrogen for a minimum of 4 hours and sealed during the short transport from the test area to the experimental hall. The modules were bolted into the modified vacuum chambers through matching holes in the vacuum flanges and tightened using a torque-wrench to ensure consistent seals. The vacuum seal is provided by a nitrile-rubber o-ring, which sits between the module flange and the vacuum chamber. One of the installed tracking detector stations connected to all its services is shown in Figure 20.
It is possible to swap the modules in and out of the different positions in the vacuum chamber. However, in general, swapping is kept to a minimum so as not to risk damaging the delicate straws. In order to install a module, the vacuum inside the storage ring must be at atmosphere. During any period when the storage ring is at atmosphere, the storage ring is purged with nitrogen for a minimum of 2 hours. This is done to minimize impurities on the walls of the vacuum chamber and to avoid water contamination on the chamber walls being attracted to the straws, which would otherwise affect the leak rate and quality of the vacuum. Deionized water is used to cool the electronics in the manifolds and is supplied to each station through plastic water inlets. The system is designed as a closed loop cooling system that keeps the supply flow to the tracking detector at an ambient temperature. The flow of this cooling water to each of the tracking detector stations is monitored with flowmeters to ensure that the flow is consistent, and the electronics do not overheat (the temperatures of the ASDQs are read out during operation).
The HV and slow control boards housed on the inside of the storage ring are air-cooled, with one pump per station that sucks air through all the modules, splitting to each individual module under the storage ring (the filters are replaced every three months). Initially, the modules were installed into the T2 position (as shown in Figure 2) and filled from the position closest to the calorimeter first, with the later modules installed into the T1 position. All 16 modules, comprising 2 tracking detector stations, were in place by November 2017 which was before the experiment’s first data-taking run.
The HV is provided by two CAEN Mod. SY 127 power supply systems per station, filled with CAEN A333 HV boards. The two systems together can supply 80 channels, which allows sufficient spares for the 64 channels required per station. The HV is monitored throughout data-taking and recorded every 5 minutes. The trip currents are set to A. In general, the ability of the tracking detector to hold HV has been exceptional—only two HV trips were recorded during the first year of data taking. The operating voltages are set to V as described in Section 5.1. The supplied voltage typically varies by V and each channel is calibrated separately.
After installation and periodically thereafter, the global alignment of the tracking detector is measured with dedicated laser surveys. A high-precision inter-module alignment is extracted using fitted tracks, which establishes 10-m-level corrections to the assumed detector position. To this end, the Millipede-II alignment framework [42] is employed for each data-taking run of the experiment and whenever a significant positional change to a component of the tracking detector occurs (e.g. when replacing a tracking detector module). The use of this software for the tracking detector has been fully validated by simulation. Performing both radial and vertical alignment of the tracking detector modules results in an increased number of reconstructed tracks, as well as improvements in the track fits. An in-depth description of the internal alignment of the trackers is given in [43].
6 Commissioning and Performance
6.1 Straw Performance
With a straw tracking detector, the lowest possible detection threshold is desirable as this increases the likelihood of detecting the first ionization cluster arrival which in turn improves the individual hit resolution. The limitation for the detection threshold is the electronics noise floor. In order to assess the noise level in each channel, the hit rate was measured as a function of discriminator threshold. A typical result is shown in Figure 21(a). Setting the threshold at a level of 3.5 fC (21,850 ) results in a noise level of hit per straw per muon fill.
As previously mentioned, six straws contained no active gas due to high leak rates. The other 2042 out of 2048 channels of the detector had uniform performance in terms of efficiency and noise. The number of hits in each channel over a three-day data-taking period is shown in Figure 21(b). The differences in the channels are due to the geometry of the detector and proximity of each straw to the stored muon beam. No channels have many more or many fewer hits than their neighbors, indicating that the noise level achieved is satisfactory.
Crosstalk occurs when unwanted electrical couplings in the system generate fake hits in the straws. This can cause issues in track reconstruction and should therefore be minimized. Crosstalk occurs dominantly in the straw components (e.g., straw-to-straw coupling), but also in the electronics (e.g. ASDQ boards). Crosstalk is identified in % of all hits (% from the straws, % from the electronics). These are removed in analysis by identifying tracks that have neighboring hits and removing those hits. Any remaining instances of crosstalk following this are removed by a cut.
The best estimate of hit resolution of each straw comes from a comparison of the measurement position with the prediction from interpolated tracks reconstructed using the algorithm described in Section 6.2. The distribution of these residuals for straws that are excluded from the fit is shown in Figure 22. The data are consistent with a mixture of two Gaussian distributions: a main core with and a smaller contribution from tails with . Including both contributions, the rms of the distribution is . This measured value is broadened by the resolution of the fitted track prediction, which is estimated using Monte Carlo simulations to be approximately . Removing this extra resolution leads to an estimated average straw hit resolution of . This value can vary by up to m depending on the straw layer and analysis choices.


Similarly to hit resolution, the position of the interpolated tracks can be used to estimate the straw detection efficiency as a function of track distance from the wire. The measured straw efficiency for one layer of straws is shown in Figure 23. The efficiency decreases at the edge of the straw, where a sharp edge is degraded by the track prediction resolution. If a track passes within of the wire, then the detection efficiency is greater than 97%. This drop is dominated by missed tracks at the edge of the straw, where the path length through the gas is too short for ionization. The efficiency in the main body of the straw is 99.3%, with a decrease of less than 2% at the wire. This is attributed to multiple ionizations that do not arrive close enough in time to jointly pass the discrimination threshold.

The tracker operates in a high-rate environment. No performance degradation is observed up to the hit rates of standard operation. No signs of aging have been observed to date, and the efficiency and resolution are the same as during commissioning.
6.2 Track Reconstruction and Extrapolation
The track reconstruction flow undergoes the following stages: (i) track finding where straw hits are grouped into track candidates, (ii) estimating the distance of closest approach for each hit based on the measured time, (iii) track fitting of candidates, and (iv) extrapolating the optimal track back to the muon decay point.
The track finding stage uses pattern recognition routines in order to group individual hits into separate sets corresponding to individual tracks. It starts by first grouping hits into time islands where the difference between hits must be less than 80 ns, which is more than the maximum drift time for a straw hit. Within the time islands, spatial and temporal information are used to group hits into track candidates. After a first pass, a second iteration further splits the candidates if there are large gaps in time or space between the hits. A typical example of multiple track candidates from the same time island is shown in Figure 24. If hits are shared among multiple track candidates, then these hits are dropped from all candidates. All the identified track candidates are passed to the next stage of reconstruction where the drift distance from each hit is estimated.
The track arrival time is measured for each candidate by exploiting the correlation between drift time values in adjacent tracking detector layers. An approximation to the angle of the track is used along with the sum of hit times in adjacent layers to estimate an entry time for each pair of hits. The mean of these gives the arrival time estimate, which has a typical resolution of ns. Using this time, the drift time for each hit can be calculated to give an estimate of the distance of closest approach of the track to the wire.101010As the straws are short (¡ 10 cm), propagation of the signal along the length of the wire is not a concern. This is because the signal propagation time is small compared to the hit time resolution, and calibration is performed using tracks from data which, to first order, averages out any bias between the top and bottom of the straws. The drift-time-to-distance calibration is performed once per experimental data run using interpolated tracks where the hit in question has been removed from the fit. Each straw is parameterized independently using data similar to that in Figure 25.


The track fitting stage [44] is based off the GEANE method [45] (Geometry and Error Propagation) that was used successfully in E821. A set of track hits defining objects such as transport matrices, error matrices, and predicted parameter vectors are generated within the full Geant4 [46, 47, 48] simulation from initial guesses. This has the advantage of direct access to both the geometry and material of the tracking detector as well as the magnetic field that the decay positrons experience as they curl inward. This is important as the tracking detector is located in a region of high field non-uniformity as shown in Figure 4. These track objects are then passed to a global chi-squared minimization algorithm that produces an optimal state vector at the track entry point. This minimization is performed in the same reference frame as the straw stereo angle, which reduces parameter correlations and improves the fitting. The final optimized state vector is then passed to the extrapolation stage.
The track extrapolation stage [21] utilizes a fourth-order Runge-Kutta Nyström algorithm [49, 50] to extrapolate tracks either back through the varying magnetic field into the storage region until the approximate position of the muon decay point is reached, or forwards to the calorimeter face. This is done within the full Geant4 [46, 47, 48] simulation utilizing the same geometry and field information as the track fitting. Track parameters from the fitting and the corresponding covariance matrix are propagated in discrete steps. At each step, the position of the extrapolated track is compared to the geometry in order to ensure that tracks that pass through material are reconstructed taking into consideration the degradation in resolution at the storage region. Because there is no fixed interaction point in the storage region, tracks are extrapolated backwards to the point of tangency where the radial momentum is equal to zero, which is a reliable proxy for the decay point. Extensive simulation studies were done to verify that this approximation for the muon decay point was sufficient. By applying a momentum-independent mm radial correction to the point of tangency, the muon decay point can be determined [21].
6.3 Measurement of the Stored Muon Beam
The data from the tracking detector are passed through the reconstruction stages described above to measure distributions of the stored muon beam. Examples of the most important distributions are shown in Figure 26. The arrival time of tracks with momentum above 1.8 GeV (Figure 26(a)) shows exponential decay with a boosted muon lifetime of s and the characteristic oscillation due to precession of the muon spin [3]. The main role of the tracking detector is to measure the muon beam’s spatial profile, which is shown in Figure 26(b) along with projections in the radial and vertical directions (Figures 26(c) and 26(d) respectively). These distributions are used to extract the correctly weighted magnetic field experienced by the muons [4]. The vertical distribution is also used to extract the Pitch correction to the measured value of [2]. The stored beam has a larger average radius than the design goal, which would be at 0 mm in Figure 26(c), due to a lower strength magnetic field provided by the injection kicker. This leads to an average stored muon momentum fractionally higher than intended [2].


The beam position is not constant in time, but rather oscillates at the betatron oscillation frequency [2]. The tracking detector measures these oscillations in both the radial and vertical directions as shown in Figure 27. During the measurement period, it is intended that this oscillation frequency is constant. However, during Run-1 of the Muon Experiment, analysis of the reconstructed beam data from the tracking detector revealed that this frequency was changing over the course of each muon fill. Subsequent investigation revealed the cause to be faulty resistors in the electrostatic quadrupole system. The same issue also caused the beam to move slowly downwards over the course of each fill. This couples to detector acceptance and causes a systematic shift in the extraction of the anomalous precession frequency [2]. Tracking detector measurements of the changing oscillation frequency and the motion of the beam, in addition to the average spatial profile, were therefore essential inputs to analysis of Run-1 data and will provide vital cross-checks of the data quality in the other runs.
7 Conclusions
The Muon Experiment’s straw tracking detector is essential to the experiment achieving its high precision uncertainty goals. The experiment employs two tracking detector stations which are located inside of the muon beam vacuum chamber upstream of a calorimeter and inside the magnetic field region of the muon storage ring. Each station consists of eight modules with four layers of 32 straws at a stereo angle of .
The tracking detector reconstructs positron trajectories from muon decays and extrapolates those trajectories to estimate the position of the parent muon at the time of decay. In doing so, the detector provides non-destructive, time-dependent measurements of the muon beam-profile. The tracking detector detects as many decay positrons as possible and reconstructs their tracks with enough fidelity to determine the muon beam profile at the millimeter level after extrapolation. It functions in a vacuum of Torr and has a vacuum load on the system below Torr L/s. The detector performs in a non-uniform storage ring magnetic field without affecting the reconstruction algorithm and without perturbing magnetic field itself. It has multiple detection planes to ensure an adequate acceptance (covering the beam aperture of mm and sensitive to 100 mm in height at the storage region) with material below radiation length so as not to disrupt the muon beam or degrade the performance of the calorimeters.
All design choices for the tracking detector (e.g., straw material, straw gas, operating voltage, electronics) were assessed prior to and after construction. All stages of tracking detector module construction were performed in an ISO 5 (Class 100) clean room, with rigorous testing and quality assurance (e.g., gas leak rate) procedures at every stage. Transport to Fermilab was achieved without damage to any components. On arrival at Fermilab, all modules were subject to a dedicated test stand and radioactive source tests for data quality assurance. For the straw wires, these tests resulted in an operating voltage of 1650 V for the Ar:C2H6 50:50 gas mixture occupying the straws.
The gas delivery system was designed and tested to mitigate and reduce flammable gas and oxygen deficiency hazard (ODH) risks inside the Muon experimental hall. Both the ethane and argon supply lines penetrate the experimental hall for mixing, routing, and delivery. The system, controlled by programmable control logic, is designed to provide a continuous flow to the tracking detector during gas canister replacement without interruption to experimental operation, and to isolate single points of failure such as a burst straw. In case of significant interruption to data collection, the need to purge the flammable ethane gas, or when the vacuum system is brought up to atmospheric pressure, the system is designed to flow dry nitrogen instead of Ar:C2H6 50:50. This, in particular, is done to minimize impurities on the walls of the vacuum chamber and to avoid water contamination which would otherwise affect the quality of the vacuum. On installation, all modules again undergo significant testing and quality assurance procedures and are globally and internally aligned.
The Muon straw tracking detector has operated successfully since installation in 2017 and performed excellently. Electronic noise levels are found to be adequate across all channels, with crosstalk assessed and minimized. The average straw hit resolution is . The detection efficiency ranges from 97% at the edge of the straw to 99.3% in the main body of the straw, with a decrease of less than 2% at the wire. Since the beginning of operation, no degradations in performance or signs of aging have been observed.
The tracking detector’s measurements of the spatial and temporal motion and the average spatial profile of the stored muon beam have been invaluable to the Muon Experiment’s first result [1, 2, 3, 4]. In particular, they have contributed significantly to the overall understanding of the necessary systematic corrections and uncertainties. The determination of two of the largest systematic corrections described in [1, 2]: the pitch correction, ppb, and the phase-acceptance correction, ppb, together comprise of 25% of the total Run 1 systematic uncertainty of 157 ppb and would not have been possible without the tracking detector. Furthermore, a detailed understanding of the beam motion during the first few rotations of the storage ring when the majority of the muons decay is critical to enhancing the statistical precision of the measurement. Without the information from the tracking detectors of this early motion, the overall uncertainty of the measurement would be larger since it would be necessary to either ignore the early data, thus increasing the statistical uncertainty, or rely on simulation to extract the details of the beam motion with an attendant increase in the systematic uncertainty. As such, the tracker detector will continue to be crucial for all future results from the Muon Experiment at Fermilab, particularly when the measurement transitions to becoming dominated by the systematic uncertainties.
Acknowledgments
We would like to pay our gratitude and respect to our friend and colleague, Dr. Barry T. King of the University of Liverpool, who sadly passed away in January 2019. He and his unwavering enthusiasm were integral to the successes of this work. We would also like to thank the dozens of BU and NIU undergraduate students who contributed to this work and the staff of the Fermilab Test Beam Facility.
This document was prepared by the Muon Experiment using the resources of the Fermi National Accelerator Laboratory (Fermilab), a U.S. Department of Energy, Office of Science, HEP User Facility. Fermilab is managed by Fermi Research Alliance, LLC (FRA), acting under Contract No. DE-AC02-07CH11359. Additional support for this work was provided by the Department of Energy offices of HEP and NP (USA), the National Science Foundation (USA), the Science and Technology Facilities Council (UK) and the European Union’s Horizon 2020 research and innovation programme under the Marie Skłodowska-Curie grant agreement No. 690835 and No.734303 (MUSE).
References
- [1] B. Abi et al. [Muon Collaboration], Phys. Rev. Lett. 126 (2021) 141801.
- [2] T. Albahri et al. [Muon Collaboration], Phys. Rev. Accel. Beams 24 (2021) 044002.
- [3] T. Albahri et al. [Muon Collaboration], Phys. Rev. D 103 (2021) 072002.
- [4] T. Albahri et al. [Muon Collaboration], Phys. Rev. A 103 (2021) 042208.
- [5] G. W. Bennett et al. [Muon Collaboration], Phys. Rev. Lett. 89 (2002) 101804.
- [6] G. W. Bennett et al. [Muon Collaboration], Phys. Rev. Lett. 92 (2004) 161802.
- [7] G. W. Bennett et al. [Muon Collaboration], Phys. Rev. D 73 (2006) 072003.
- [8] G. W. Bennett et al. [Muon Collaboration], Phys. Rev. D 80 (2009) 052008.
- [9] A. T. Fienberg, L. P. Alonzi, A. Anastasi, R. Bjorkquist, D. Cauz, R. Fatemi, C. Ferrari, A. Fioretti, A. Fankenthal and C. Gabbanini, et al., Nucl. Instrum. Meth. A 783 (2015) 12-21.
- [10] J. Kaspar, A. T. Fienberg, D. W. Hertzog, M. A. Huehn, P. Kammel, K. S. Khaw, D. A. Peterson, M. W. Smith, T. D. Van Wechel and A. Chapelain, et al., JINST 12 (2017) P01009.
- [11] A. Anastasi et al. [Muon Collaboration], JINST 14 (2019) P11025.
- [12] A. P. Schreckenberger, D. Allspach, D. Barak, J. Bohn, C. Bradford, D. Cauz, S. P. Chang, A. Chapelain, S. Chappa and S. Charity, et al., Nucl. Instrum. Meth. A 1011 (20 21) 165597.
- [13] G. T. Danby et al. Nucl. Instrum. Meth. A 457 (2001) 151-174.
- [14] Opera-3D User Guide, Vector Fields Limited, Oxford, England, 2004.
- [15] A. Behnke, Structural Analysis and Quality Control of a Muon Beam Tracker, Master’s thesis, Northern Illinois University, 2016.
- [16] G. Luo, Flow and Thermal Management Inside of Muon Tracker Within Vacuum, Master’s thesis, Northern Illinois University, 2015.
- [17] W. Turner, The Construction and Commissioning of the Straw Tracking Detector in the New Muon Experiment at Fermilab, PhD thesis, University of Liverpool, 2018.
- [18] T. Halewood-Leagas, Measurement of vertical betatron oscillations using the straw tracking detectors for the E989 Muon experiment at Fermilab, PhD thesis, University of Liverpool, 2019.
- [19] L. Bartoszek et al. [Mu2e Collaboration], Mu2e Technical Design Report, arXiv:1501.05241.
- [20] DuPontTM, https://www.https://www.dupont.co.uk/.
- [21] S. Charity, Beam profile measurements using the straw tracking detectors at the Fermilab Muon experiment, and a study of their sensitivity to a muon electric dipole moment, PhD thesis, University of Liverpool, 2018.
- [22] W. M. Bokhari et al., IEEE Nuclear Science Symposium Conference Record 1 (1998) 445.
- [23] B. Bevensee et al., IEEE Trans. Nucl. Sci. 43 (1996) 1725.
-
[24]
Maxim Integrated,
https://www.maximintegrated.com/en/products/sensors/DS18B20.html. -
[25]
Altera Corporation,
https://www.intel.com/content/dam/www/programmable/us/en/pdfs/
literature/hb/cyc3/cyclone3_handbook.pdf. - [26] A. Widmer et al., IBM J. Res. Dev. 27 (1983) 05440.
-
[27]
Xilinx Inc.,
https://www.xilinx.com/products/silicon-devices/fpga/spartan-6.html. - [28] H. Sadrozinski and J. Wu, “Applications of Field-Programmable Gate Arrays in Scientific Research”, Taylor and Francis, 2010.
- [29] M. Pesaresi et al., JINST 10 (2015) C03036.
- [30] E. Hazen et al. JINST 8 (2013) C12036.
-
[31]
Xilinx Inc.,
https://www.xilinx.com/products/silicon-devices/fpga/kintex-7.html. -
[32]
N. Loukas (2013),
https://alpha.physics.uoi.gr/NLoukas_public/
Results_of_the_TCDS_FMC_serial_link_tests.pdf. - [33] C. Ghabrous Larrea, K. Harder, D. Newbold, D. Sankey, A. Rose, A. Thea and T. Williams, JINST 10 (2015) C02019.
-
[34]
Maximum Integrated Data Acquisition System (MIDAS),
https://midas.triumf.ca/MidasWiki/index.php/Main_Page. - [35] C. Green, J. Kowalkowski, M. Paterno, M. Fischler, L. Garren and Q. Lu, J. Phys. Conf. Ser. 396 (2012) 022020.
- [36] Velmex Inc., https://www.velmex.com/.
- [37] A. Epps, A Dedicated Quality Control Test Stand for the Tracker System, Master’s thesis, Northern Illinois University, 2017.
- [38] Eljen Technology, https://eljentechnology.com/.
- [39] On Semiconductor, https://https://www.onsemi.com/.
- [40] Z. Ahmed et al., JINST 9 (2014) P01009.
-
[41]
H. Schindler and R. Veenhof,
Garfield++ — simulation of ionisation based tracking detectors,
http://garfieldpp.web.cern.ch/garfieldpp/ - [42] V. Blobel, ‘Linear least squares fits with a large number of parameters’, http: //www.desy.de/ blobel/Mptwo.pdf (2007).
- [43] G. Lukicov, Alignment of the straw tracking detectors for the Fermilab Muon experiment and systematic studies for a muon electric dipole moment measurement, PhD thesis, University College London, 2020.
- [44] N. Kinnaird, Muon spin precession frequency extraction and decay positron track fitting in Run 1 of the Fermilab Muon Experiment, PhD thesis, Boston University, 2020.
- [45] V. Innocente, M. Maire and E. Nagy, Proceedings, MC91: Detector and event simulation in high energy physics, 58-78.
- [46] J. Allison, K. Amako, J. Apostolakis, H. Araujo, P. A. Dubois, M. Asai, G. Barrand, R. Capra, S. Chauvie and R. Chytracek, et al., IEEE Trans. Nucl. Sci. 53 (2006) 270.
- [47] S. Agostinelli et al. [GEANT4], Nucl. Instrum. Meth. A 506 (2003) 250.
- [48] J. Allison, J. Apostolakis, S. B. Lee, K. Amako, S. Chauvie, A. Mantero, J. I. Shin, T. Toshito, P. R. Truscott and T. Yamashita, et al., Nucl. Instrum. Meth. A 835 (2016) 186.
- [49] C. Runge, Math. Ann. 46 (1895) 167–178.
- [50] E. J. Nyström Acta Societatis Scientiarum Fennicae 50 (1925) 13.