Light yield and field dependence measurement in PandaX-II dual-phase xenon detector
Abstract
The dual-phase xenon time projection chamber (TPC) is one of the most sensitive detector technology for dark matter direct search, where the energy deposition of incoming particle can be converted into photons and electrons through xenon excitation and ionization. The detector response to signal energy deposition varies significantly with the electric field in liquid xenon. We study the detector’s light yield and its dependence on the electric field in the PandaX-II dual-phase detector containing 580 kg liquid xenon in the sensitive volume. From our measurements, the light yield at electric fields from 0 V/cm to 317 V/cm is obtained for energy depositions up to 236 keV.
1 Introduction
In recent years, dual-phase xenon detectors have been driving the dark matter direct detection sensitivity by several orders of magnitudes [1, 2, 3, 4, 5, 6, 7]. When an incident dark matter particle scatters with liquid xenon target, certain amount of energy will be deposited in the detector and prompt scintillation light () and ionized electrons are produced. The scintillation light with a wavelength of 175 nm [8] travels in the liquid or gaseous xenon, gets reflected by polytetrafluoroethylene (PTFE) reflectors and is eventually collected by photo-multiplier tubes (PMTs) at the top and bottom of the detector. The ionized electrons move upward to the liquid xenon surface under the electric field. They are subsequently extracted into the gaseous xenon and converted into secondary scintillation light () by a stronger extraction electric field. In the energy region of a few tens keV to several hundreds keV, the signals are triggered by . The following is paired with the triggered and they form a complete physics event. Based on the light pattern on the top PMT array and the time difference between and signals (drift time), 3-D position information of a physics event can be reconstructed [2]. The corresponding energy deposition is reconstructed using and with the formula
| (1.1) |
where PDE, EEE, and SEG are photon detection efficiency, electron extraction efficiency, and single electron gain, respectively.
The integrated charge of produced by energy deposition in liquid xenon is one of the key parameters of the xenon detector response. We can define the xenon light yield as the number of photons per unit energy deposition (keV),
| (1.2) |
where PDE follows Ref. [4].
For a given energy deposition, there are several factors affecting the light yield. Part of the energy of nuclear recoil (NR) events will transfer to the atom motion [9]. This effect yields less light signal for NR, and that did not show in electron recoil (ER). The electron-ion recombination probability also depends on the strength of drift electric field. A stronger field is expected to give a smaller light yield. Recent large-scale dual-phase xenon experiments include PandaX-II with 580 kg xenon [3, 4], XENON1T [6] with 2 tonne and LUX with 180 kg [5]. For the optimization of detector operation, the three experiments chose different high voltages on the detector electrodes. The corresponding strengths of drift electric fields are 317 V/cm (PandaX-II), 81 V/cm (XENON1T) and 180 V/cm (LUX). For the low energy WIMP search region, Ref. [10, 11] (PandaX-II), Ref. [12, 13] (XENON1T) and Ref. [14, 15, 16] (LUX) have described the detector responses and signal yields of these three experiments.
In this paper, we report a measurement of xenon light yield under various electric fields using PandaX-II detector, from 0 V/cm to 317 V/cm. The energy points include 9.4 keV, 32.1 keV, 41.5 keV, 164 keV and 236 keV. The results are compared with other experiments and also a widely used model, NEST model [17].
2 Monoenergetic event selection
In order to measure the light yields in different energy regions, activated xenon states and Kr calibration sources were injected into the PandaX-II detector in February 2019, after scientific data taking accomplished [4], yielding monoenergetic ER data covering energy from 9.4 keV to 236 keV. These ER events were taken under four electric field conditions, 317 V/cm, 180 V/cm, 81 V/cm and 0 V/cm, as summarized in Table 1. For non-zero field conditions, identical quality cuts are inherited from Ref. [4] and applied to the data. While for the zero field condition, only relevant quality cuts are applied. To select these monoenergetic data as clean as possible, the fiducial volume (FV) cut is also applied. For 317 V/cm condition, the FV is the same with Run 11 FV in Ref. [4], i.e., drift time and . For other non-zero field conditions, they share the same range cut and the drift time confinements are scaled by the maximum drift times. Specially, range is unlimited in zero field data due to the lack of signal and an equivalent drift time cut is developed and applied, which is discussed in section 2.2.
| Drift field strength | 317 V/cm | 180 V/cm | 81 V/cm | 0 V/cm |
|---|---|---|---|---|
| Duration(Kr) | 17 hours | 204 hours | 272 hours | 174 hours |
| Event number(Kr) | ||||
| Duration(Act. Xe) | 190 hours | 204 hours | 272 hours | — |
| Event number(Act. Xe) | — | |||
| Maximum drift time | 360 | 387 | 435 | — |
2.1 Activated xenon
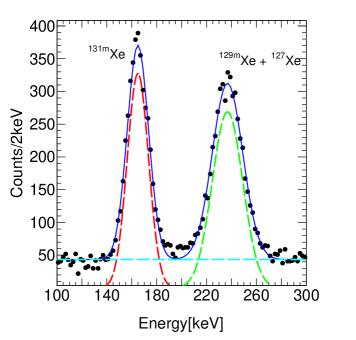
One bottle of xenon was stored on the ground surface and exposed to cosmic ray for around three months, containing approximately 18 kilograms of xenon. This bottle of xenon was injected into the PandaX-II detector through the circulation system. Due to the neutron activation, natural xenon can be transformed to radioisotopes, like 127Xe, Xe and Xe. They produce monoenergetic ER events in the detector, of which 164 keV originates from the Xe de-excitation and 236 keV is from both Xe and 127Xe contributions [18].
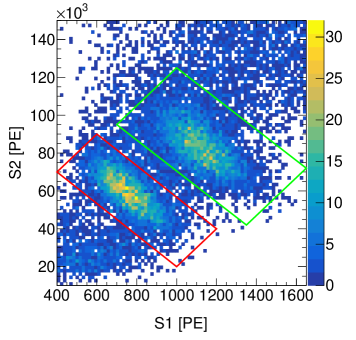
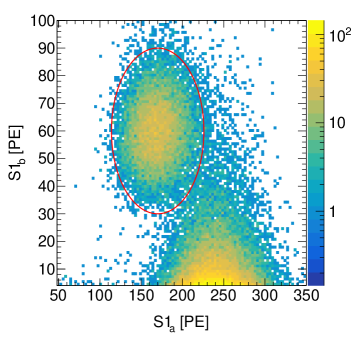
From the energy reconstruction formula, monoenergetic events are expected to have an anti-correlation relationship between and , as shown in the - distribution of activated xenon events in Fig. 1, where the two distinguishable ellipse-shaped contours are from 164 keV and 236 keV gammas, respectively. Based on this relationship, we select those monoenergetic events. The reconstructed energy spectrum shows the two energy peaks clearly as well (see Fig. 1).
We should note that such a data selection approach is only valid for non-zero drift electric field, because the ionized electrons would not drift to the gaseous xenon region and produce the signature if the drift electric field is not applied. For the zero electric field case, it is difficult to identify the unpaired signal of activated xenon from the background. Instead, we rely on the Kr isotopes whose characteristic decay mode provides a unique signature to select the signals, as described in section 2.2.
2.2 Kr
Kr is an effective short-lived calibration source, which is usually prepared through 83Rb decay with a half-life of 86.2 days [19, 20, 21, 22]. The decay product Kr has , and de-excites to a state and then the ground state, releasing 32.1 keV and 9.4 keV energy, respectively. The half-life of the first decay is 1.8 hours, and that of the second is only 156.9 ns [23].
The typical signal waveform width is at a level of microseconds, so the two sets of ionized electrons from Kr cascade decays are overlapping with each other and unable to be separated. For prompt scintillation light with a width of several nanoseconds, there is probability to observe two signals in the detector [4, 19, 20, 21, 22]. Figure 2 shows the Kr event - distribution, most of the events have two s merged as one, but some of them have smaller corresponding to 32.1 keV decay. It indicates that there is another smaller from 9.4 keV decay following it. The reconstructed energy spectrum shows a similar behavior (see Fig. 2). Therefore, from Kr cascade decay, there exist signals corresponding to three energy points: 9.4 keV, 32.1 keV and 41.5 keV, which can be selected to study the light yields.
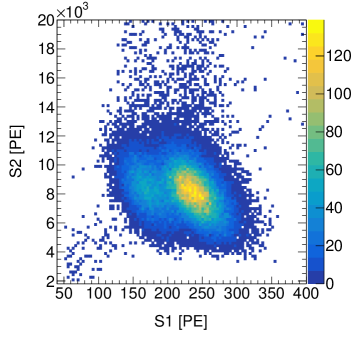
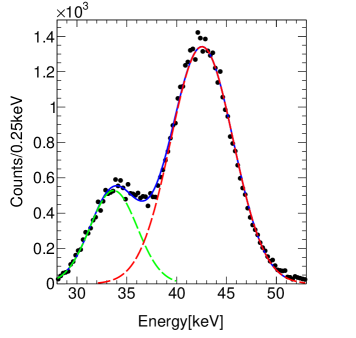
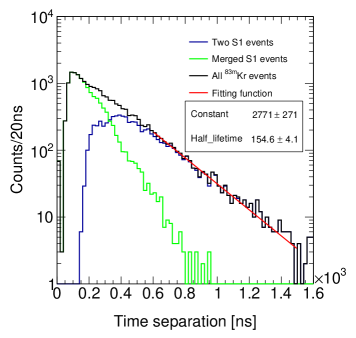
Figure 3 shows the event pair distribution, with as the largest in the event, and as the second largest one following . Double events from Kr are indicated as the circled region in the figure. The time separation of the two peaks in figure 3 obeys the exponential law and the fitted half life is ns which is consistent with the NNDC data [23].
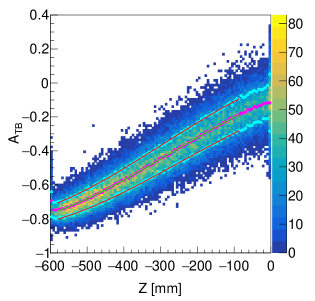
These Kr events can be selected through the double s feature even in zero field condition, although there is no signal. Without , the event position can not be reconstructed accurately. However the normalized ratio of charge collected in the top PMT array to that in the bottom array,
reflects the event position in vertical direction Z, as demonstrated in Fig. 4 which gives A-Z distribution of Kr events under non-zero electric field conditions. A cubic polynomial function is fitted to the mean values of Z slices of the band to build the relationship between vertical position and normalized top-bottom ratio , which has no significant discrepancy at three non-zero electric field conditions. This function is used for zero field condition to derive the detector correction factors in the vertical direction for signals. Also it is obvious that the A-Z relation gives an extra uncertainty on vertical position in zero field data due to fluctuation. And it is quantified by the Gaussian widths of Z slices as Fig. 4 shows.
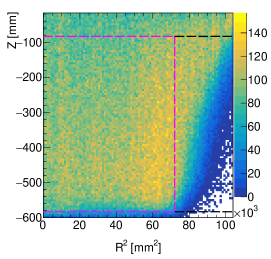
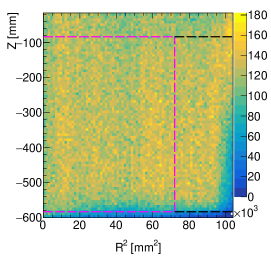
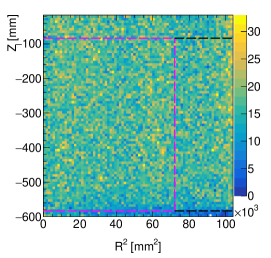
Shortly after injection, the krypton atoms get distributed uniformly in the detector. Inside FV, our COMSOL simulation [24] predicts that the field uniformity is better than 1% and the electric field values uncertainties are neglected in this analysis. However, near the edge of detector, there could exist deformation of electric field which yields a radial component along with the dominant vertical component . Also the inhomogeneity in this region is larger than 6% in our simulation. Therefore, given the large statistics of the Kr events, the reconstructed horizontal position distribution can reflect the component of the drift electric field. The longer the drift distance is, the more distortion the reconstruction horizontal position would have. Figure 5 shows the reconstructed position distributions of Kr events under various electric fields. The FV boundary is shown in dashed magenta lines. And an extended fiducial volume (EFV) is confined by the dashed black lines which removes the range confinement. For events close to the detector bottom (Z mm), the horizontal reconstructed positions shift to smaller radii. The signal yields of these edge events would fluctuate more and may bias our results, because a stronger electric field forbids more recombination and reduces the signal and a weaker one has the inverse effect. In Fig. 6, data within FV and EFV are compared. The spectra of 83mKr data show a good consistency. This good result comes from the low background of the selection region in figure 3 and indicates that edge field distortion does not affect the final results. Thus it is convinced that the constrain is negligible for 83mKr data in zero field condition. However, for activated xenon data, the mean values of the Gaussian functions are biased by the events from the surface (figure 6(d) and 6(e)). The consequence uncertainty will be discussed later.
3 Results and discussion
For a dual phase xenon detector, the light yield is an intrinsic parameter that evaluates the detector response. In previous sections, the components of these monoenergetic events are selected precisely. In this kind of large detector (646 mm in diameter and 600 mm in height), due to geometry non-uniformity, the signal yields can vary with event positions. A 3-D position-based correction is applied to improve the resolution. The correction mapping follows Run 11 mapping in Ref. [4]. And all of the charges are normalized to the mean value of mapping inside FV. Also the 131mXe mapping used for Run 9 data in Ref. [4], and the different position reconstruction method introduced by Ref. [25], are selected for uncertainty estimation in this analysis. Different mappings and reconstruction methods result in little measurement difference.
Besides position correction, the baseline suppression(BLS) non-linearity, another hardware limitation will affect the signal yield. In a standard way, a fixed threshold is set to ignore noise which comes from baseline fluctuation. When the PMT’s gain is high enough, every hit originating from physics event will be recorded as it is amplified larger than the threshold significantly. However, this effect results in smaller detected than the true especially for the low energy signal when some of the PMTs’ gains are relatively low in 2019. A novel PMT gain calibration methodology is applied to these low gain PMTs as Ref. [4] introduced. Following Ref. [4], the BLS non-linearity also can be quantified and it is applied to this analysis.
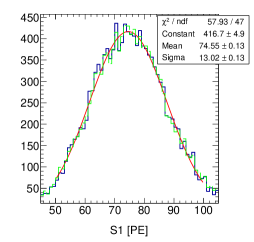
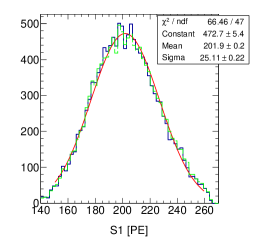
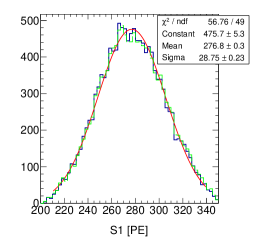
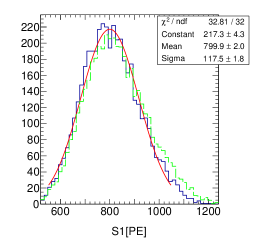
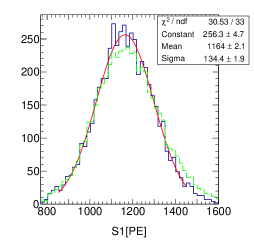
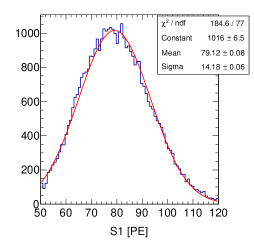
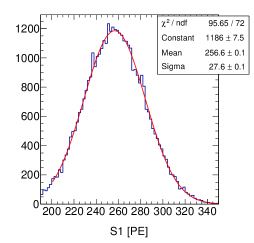
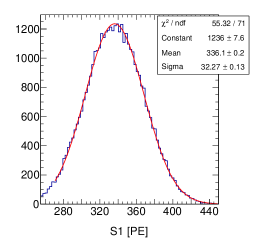
After position-based correction and BLS correction, each spectrum is fitted by a Gaussian function and the mean value of the fitting result represents the mean response in light yield formula (1.2). Figure 6 and 7 show the spectra of various energy points at 317 V/cm and zero drift electric fields respectively. In association with PDE and the true energy of the decay, the light signal yield is obtained.
The dominant systematic uncertainties originate from the event selection methodology, Gaussian function fitting range, PDE (4% uncertainty) and ATB-Z relation. Both box and ellipse selection regions are tried for these monoenergetic ER events. Little difference is found. However the selection regions in Fig. 1 and 3 could be more strict and that yields 1% uncertainty. The spectra of activated xenon events become non-Gaussian when surface background events contaminate it. Then Gaussian function fitting range could yield another 1% uncertainty. For the zero field data, the ATB-Z relation introduces extra 3% systematic uncertainty. Compared with all these above, the statistic uncertainty is negligible. The results are summarized in Tab. 2.
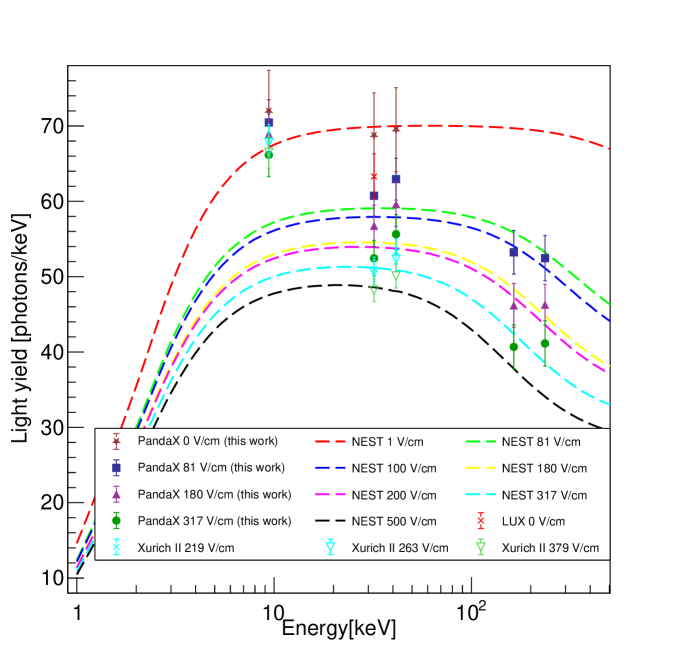
In dual-phase noble elements based experiments, NEST model as presented in Ref. [26, 27, 17], has been widely used for signal prediction. It is worthwhile measuring the light yields at several energy points to validate the NEST model. The measured light yields of these monoenergetic points are plotted in Fig. 8, overlaid with results from other experiments [14, 28] and NEST model (v2.1.0) predictions [27]. The comparison shows a good consistency in general between the measurement and NEST model for various energies except the 9.4 keV energy point from Kr cascade decay, which is to be discussed in the next paragraph.
| Energy deposition (keV) | 317 V/cm | 180 V/cm | 81 V/cm | 0 V/cm |
|---|---|---|---|---|
| 9.4 | 66.1 2.9 | 68.9 3.0 | 70.5 3.0 | 72.0 5.4 |
| 32.1 | 52.4 2.4 | 56.8 2.7 | 60.7 2.7 | 68.7 5.7 |
| 41.5 | 55.6 2.6 | 59.6 2.9 | 62.9 2.8 | 69.5 5.6 |
| 164 | 40.7 2.9 | 46.2 2.9 | 53.2 2.9 | — |
| 236 | 41.1 3.0 | 46.3 2.7 | 52.4 3.0 | — |
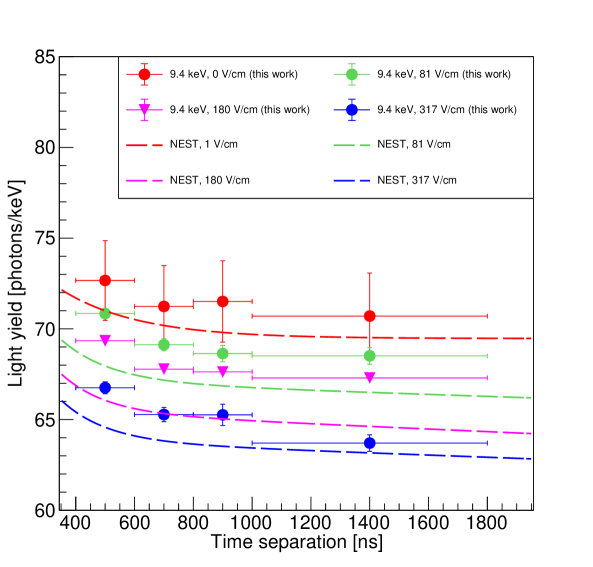
The second decay in Kr cascade has quite different light yield from other energies, which were observed in other experiments as well [29, 28, 30]. One possible interpretation is that the local high xenon ion density caused by the first decay energy deposition can enhance the ion-electron recombination rate of the surrounding second decay significantly and results in a much higher light yield than general gamma responses. The half-life of Kr atom() is 156.9 ns. Given the large separation, we can expect that the second decay will have less enhancement from the first one. Figure 9 shows the dependence of 9.4 keV light yield on the time separation. Also the NEST model has a similar trend as the measurement. The dominated PDE uncertainty is not shown in this figure and may account for the discrepancy between data and NEST model.
4 Summary and outlook
After PandaX-II detector accomplishes its scientific mission [4], two kinds of gaseous calibration sources, activated xenon and Kr, are injected into the detector. In total, five energy points are reconstructed under four different electric drift field conditions. The signal yields are studied and show a great agreement with the NEST model. Also, this study provides valuable experience for the next-generation experiments, like XENONnT [31], LZ [32], Darwin [33], PandaX-4T [34, 7] and its successor [35, 36].
Acknowledgments
This project is supported in part by a grant from the Ministry of Science and Technology of China (No. 2016YFA0400301), grants from National Science Foundation of China (Nos. 12090060, 12005131, 11905128, 11925502, 11775141), and by Office of Science and Technology, Shanghai Municipal Government (grant No. 18JC1410200). We thank supports from Double First Class Plan of the Shanghai Jiao Tong University. We also thank the sponsorship from the Chinese Academy of Sciences Center for Excellence in Particle Physics (CCEPP), Hongwen Foundation in Hong Kong, and Tencent Foundation in China. Finally, we thank the CJPL administration and the Yalong River Hydropower Development Company Ltd. for indispensable logistical support and other help.
References
- [1] PandaX collaboration, Low-mass dark matter search results from full exposure of the PandaX-I experiment, Phys. Rev. D 92 (2015) 052004 [1505.00771].
- [2] PandaX collaboration, Dark Matter Search Results from the Commissioning Run of PandaX-II, Phys. Rev. D 93 (2016) 122009 [1602.06563].
- [3] PandaX-II collaboration, Dark Matter Results From 54-Ton-Day Exposure of PandaX-II Experiment, Phys. Rev. Lett. 119 (2017) 181302 [1708.06917].
- [4] PandaX-II collaboration, Results of dark matter search using the full PandaX-II exposure, Chin. Phys. C 44 (2020) 125001 [2007.15469].
- [5] LUX collaboration, Results from a search for dark matter in the complete LUX exposure, Phys. Rev. Lett. 118 (2017) 021303 [1608.07648].
- [6] XENON collaboration, Dark Matter Search Results from a One Ton-Year Exposure of XENON1T, Phys. Rev. Lett. 121 (2018) 111302 [1805.12562].
- [7] Y. Meng, Z. Wang, Y. Tao et al., Dark Matter Search Results from the PandaX-4T Commissioning Run, arXiv:2107.13438.
- [8] K. Fujii, Y. Endo, Y. Torigoe, S. Nakamura, T. Haruyama, K. Kasami et al., High-accuracy measurement of the emission spectrum of liquid xenon in the vacuum ultraviolet region, Nuclear Instruments and Methods in Physics Research Section A: Accelerators, Spectrometers, Detectors and Associated Equipment 795 (2015) 293.
- [9] G. Plante, E. Aprile, R. Budnik, B. Choi, K. L. Giboni, L. W. Goetzke et al., New Measurement of the Scintillation Efficiency of Low-Energy Nuclear Recoils in Liquid Xenon, Phys. Rev. C 84 (2011) 045805 [1104.2587].
- [10] W. Ma et al., Internal calibration of the PandaX-II detector with radon gaseous sources, JINST 15 (2020) P12038 [2006.09311].
- [11] PandaX-II collaboration, Determination of responses of liquid xenon to low energy electron and nuclear recoils using a PandaX-II detector, Chin. Phys. C 45 (2021) 075001 [2102.09158].
- [12] E. Aprile et al., Simultaneous measurement of the light and charge response of liquid xenon to low-energy nuclear recoils at multiple electric fields, Phys. Rev. D 98 (2018) 112003 [1809.02072].
- [13] XENON collaboration, XENON1T dark matter data analysis: Signal and background models and statistical inference, Phys. Rev. D 99 (2019) 112009 [1902.11297].
- [14] LUX collaboration, Tritium calibration of the LUX dark matter experiment, Phys. Rev. D 93 (2016) 072009 [1512.03133].
- [15] LUX collaboration, Signal yields, energy resolution, and recombination fluctuations in liquid xenon, Phys. Rev. D 95 (2017) 012008 [1610.02076].
- [16] LUX collaboration, Low-energy (0.7-74 keV) nuclear recoil calibration of the LUX dark matter experiment using D-D neutron scattering kinematics, 1608.05381.
- [17] M. Szydagis et al., A Review of Basic Energy Reconstruction Techniques in Liquid Xenon and Argon Detectors for Dark Matter and Neutrino Physics Using NEST, Instruments 5 (2021) 13 [2102.10209].
- [18] D. S. Akerib et al., Radiogenic and Muon-Induced Backgrounds in the LUX Dark Matter Detector, Astropart. Phys. 62 (2015) 33 [1403.1299].
- [19] L. W. Kastens, S. B. Cahn, A. Manzur and D. N. McKinsey, Calibration of a Liquid Xenon Detector with Kr-83m, Phys. Rev. C 80 (2009) 045809 [0905.1766].
- [20] A. Manalaysay et al., Spatially uniform calibration of a liquid xenon detector at low energies using 83m-Kr, Rev. Sci. Instrum. 81 (2010) 073303 [0908.0616].
- [21] LUX collaboration, Kr calibration of the 2013 LUX dark matter search, Phys. Rev. D 96 (2017) 112009 [1708.02566].
- [22] D. Zhang et al., Rb83/Kr83m production and cross-section measurement with 3.4 MeV and 20 MeV proton beams, arXiv:2102.02490.
- [23] E. McCutchan, Nuclear Data Sheets for A = 83, Nuclear Data Sheets 125 (2015) 201.
- [24] COMSOL, “COMSOL Multiphysics.” https://cn.comsol.com.
- [25] D. Zhang, A. Tan, A. Abdukerim, W. Chen, X. Chen, Y. Chen et al., Horizontal Position Reconstruction in PandaX-II, arXiv:2106.08380.
- [26] M. Szydagis et al., NEST: A Comprehensive Model for Scintillation Yield in Liquid Xenon, JINST 6 (2011) P10002 [1106.1613].
- [27] M. Szydagis et al., Noble element simulation technique, June, 2020. 10.5281/zenodo.3905382.
- [28] L. Baudis, Y. Biondi, C. Capelli, M. Galloway, S. Kazama, A. Kish et al., A Dual-phase Xenon TPC for Scintillation and Ionisation Yield Measurements in Liquid Xenon, Eur. Phys. J. C 78 (2018) 351 [1712.08607].
- [29] L. Baudis, H. Dujmovic, C. Geis, A. James, A. Kish, A. Manalaysay et al., Response of liquid xenon to Compton electrons down to 1.5 keV, Phys. Rev. D 87 (2013) 115015 [1303.6891].
- [30] A. G. Singh et al., Analysis of 83mKr prompt scintillation signals in the PIXeY detector, JINST 15 (2020) P01023 [1911.03999].
- [31] XENON collaboration, Projected WIMP sensitivity of the XENONnT dark matter experiment, JCAP 11 (2020) 031 [2007.08796].
- [32] B. J. Mount et al., LUX-ZEPLIN (LZ) Technical Design Report, 1703.09144.
- [33] DARWIN collaboration, DARWIN – a next-generation liquid xenon observatory for dark matter and neutrino physics, PoS ICRC2021 (2021) 548.
- [34] PandaX collaboration, Dark matter direct search sensitivity of the PandaX-4T experiment, Sci. China Phys. Mech. Astron. 62 (2019) 31011 [1806.02229].
- [35] P. Juyal, K.-L. Giboni, X.-D. Ji and J.-L. Liu, On proportional scintillation in very large liquid xenon detectors, Nucl. Sci. Tech. 31 (2020) 93 [1910.13160].
- [36] K. L. Giboni, P. Juyal, E. Aprile, Y. Zhang and J. Naganoma, A LN2-based cooling system for a next-generation liquid xenon dark matter detector, Nucl. Sci. Tech. 31 (2020) 76 [1909.09698].