ArchABM: an agent-based simulator of human interaction with the built environment. and viral load analysis for indoor air quality
Abstract
Recent evidence suggests that SARS-CoV-2, which is the virus causing a global pandemic in 2020, is predominantly transmitted via airborne aerosols in indoor environments. This calls for novel strategies when assessing and controlling a building’s indoor air quality (IAQ). IAQ can generally be controlled by ventilation and/or policies to regulate human-building-interaction. However, in a building, occupants use rooms in different ways, and it may not be obvious which measure or combination of measures leads to a cost- and energy-effective solution ensuring good IAQ across the entire building. Therefore, in this article, we introduce a novel agent-based simulator, ArchABM, designed to assist in creating new or adapt existing buildings by estimating adequate room sizes, ventilation parameters and testing the effect of policies while taking into account IAQ as a result of complex human-building interaction patterns. A recently published aerosol model was adapted to calculate time-dependent carbon dioxide () and virus quanta concentrations in each room and inhaled and virus quanta for each occupant over a day as a measure of physiological response. ArchABM is flexible regarding the aerosol model and the building layout due to its modular architecture, which allows implementing further models, any number and size of rooms, agents, and actions reflecting human-building interaction patterns. We present a use case based on a real floor plan and working schedules adopted in our research center. This study demonstrates how advanced simulation tools can contribute to improving IAQ across a building, thereby ensuring a healthy indoor environment.
keywords:
agent-based modeling, indoor air quality, building ventilation, aerosol model, building design, simulation1 Introduction
1.1 Motivation
Evidence is growing that the virus SARS-CoV-2 that caused a global pandemic in 2020 can be transmitted via inhalation of virus-containing aerosols [1, 2, 3] and recent studies point towards increased infection risk indoors [4, 5, 6, 7]. For these reasons, the concept of indoor air quality (IAQ) is currently under scrutiny. IAQ is typically determined by air temperature, humidity, and pollutant concentration in closed environments [8, 9]. Due to SARS-CoV-2’s significant impact on population health around the globe, authors are calling for taking into consideration the concentration of airborne pathogens or quanta (viral load, i.e., a physical measure of infectious material being present, [10]) when evaluating IAQ [11, 12, 13]. Further, official bodies and organizations are updating their guidelines, standards, and regulations in this regard [9, 14, 15]. It is therefore evident that IAQ will need to play a more important role when designing a new building or adapting an existing building. After all, one room with bad IAQ alone may lead to a significant health risk for building occupants.
IAQ is ultimately a product of human interaction in a closed environment as temperature, humidity, and pollutants will rise with the number of occupants and with time if no measure is taken. Generally, IAQ can be controlled via engineering measures (ventilation, air filtration, air disinfection, larger rooms, etc.) or by applying policies or conventions to regulate human interaction in a room (restrict access, limit residence time, etc.). However, all these measures come at a cost or have external constraints, and it is not always obvious which combination of measures will lead to a cost and energy-effective solution that ensures good IAQ throughout the entire building given its use. Novel tools and innovative approaches are therefore necessary [6] to design future buildings and adapt already existing buildings such that they can provide significantly improved IAQ, thereby ensuring a healthy, comfortable and productive indoor environment.
To address this challenge, we propose ArchABM, a novel agent-based simulator designed to assist architects, engineers, and building managers to estimate adequate room sizes, determine adequate ventilation parameters or test the effect of policies while taking into account IAQ across the entire building as a result of complex human-building interaction patterns. In addition, ArchABM can assist in simulating various scenarios to make more informed decisions. Its agent-based engine allows for simulating complex interaction patterns of agents (i.e., occupants) in various rooms, taking into account daily schedules, policies/conventions, and a random factor of agents deciding when to go where and with whom.
To address the call for an ”updated” IAQ taking into account airborne virus transmission, we adapted a recently published aerosol model tuned to SARS-CoV-2 [16] and can compute time-dependent carbon dioxide () concentrations and virus quanta levels [3] produced by occupants in rooms. Further, the amount of inhaled by an agent throughout the day and the number of quanta inhaled by each agent are calculated to reflect a potential physiological response. Both result from the interaction patterns created by all agents acting and interacting in the defined environment. The level calculations for a specific room were validated by using a well-documented case study from the literature [17] that reported accurate concentrations over the course of a day in an office.
ArchABM is flexible with regard to the aerosol model thanks to its modular architecture, which allows for the implementation of further models calculating other metrics of interest such as temperature, humidity, or even transmission metrics for other types of viruses. Furthermore, ArchABM is dynamic in the sense that any number of rooms (”places”), agents (”people”) and actions (”events”) can be defined in a configuration file in order to reflect various human-building-interaction patterns. Aggregation categories for places (”building”) and people (”departments”) exist as well. Relevant examples could include buildings designed for any type of work, hospitals or nursing homes, or buildings from the educational sector, to name a few. Note that one ArchABM simulation simulates how agents (occupants) follow or take part in events (activities) occurring in various places as defined in the configuration file over the course of one day. This means that long-term effects from one day to another are not modelled. However, as there is a random component associated with agents’ actions and interactions throughout the day, simulation output parameters such as inhaled and virus quanta levels for individual agents as well as accumulated and virus levels for individual places will differ from simulation to simulation, even if the configuration file is not changed. The simulation engine that powers ArchABM is event-driven, resulting in higher computational performance compared to traditional continuous time-stepped ABMs, as an unnecessary update of all components (agents and their environment) at each time step is avoided – components are only updated when an event is triggered. This allows running a high number of simulations (i.e. simulate a high number of individual days of agents interacting in the given environment) for a given configuration file, enabling in-depth statistical analyses of output parameter distributions when comparing different simulation scenarios.
To demonstrate ArchABM’s capabilities, we present a human-building-interaction use case for an office scenario with 14 rooms and 60 agents, based on an real floor plan and close-to-real working schedules adopted in our research center. We thereby investigate the impact of a) building-related measures, b) policy-related measures, and c) a building-policy combined case on IAQ in individual locations and the overall building, as well as their effects on individual people in terms of inhaled and virus quanta.
ArchABM is ready for use as an open source Python library, is available to the public on the official Python Package Index (PyPI) repository111https://pypi.org/project/archABM/ [18] and comes with a full documentation222https://vicomtech.github.io/ArchABM/ [19]. All data generated in this study is openly accessible via Mendeley Data333https://data.mendeley.com/datasets/cx3byrjx7b/1 [20].
1.2 Related work
Agent-based models (ABMs) can simulate actions and interactions of autonomous agents within a pre-defined computational environment to calculate outcomes describing how the overall system behaves [21]. Since the onset of the pandemic induced by SARS-CoV-2, many studies have been published employing ABMs to model virus transmission dynamics, thereby mainly focused on simulating the effects of policy changes or strategies such as the implementation of social distancing measures or travel restrictions. Most of these studies, however, focus on larger, macro-scale scenarios, in which agents act and interact within an environment representing an entire country, a region, or a city [22, 23, 24].
Regarding indoor environments, studies involving ABMs have predominantly analyzed university buildings and campuses, supermarkets, or public spaces such as museums, yet mainly apply exposure-time and contact-distance-based or traditional compartmental SEIR (Susceptible, Exposed, Infected, Recovered) [10, 25] virus transmission models to calculate the number of infected people after a given time [26, 27, 28, 29, 30]. IAQ and, specifically, possible airborne transmission via aerosols is often not taken into account. Some other studies apply (pedestrian) movement models to simulate indoor movement patterns without taking into account virus-related parameters [31, 32]. When simulating indoor environments, only a few recent studies explicitly address airborne transmission via aerosols in their ABM [33, 34, 35, 36]. While these studies use sophisticated aerosol models, most of them focus on modeling one single room as the simulation environment (simplified supermarket, choir practice, restaurant, classroom) without taking into account the complex human-building-interaction patterns that may emerge when agents move around a building to different rooms for carrying out diverse activities while being in contact with other agents. Furthermore, most of these studies investigate the impact of policy-based measures (such as wearing a mask) on infection risk and do not analyze the impact of building-related measures on IAQ, such as natural or mechanical ventilation [9], or varying ventilation rates or room sizes.
In the building domain, ABMs have been employed to model building occupants’ energy use [37, 38] and IAQ in terms of and other parameters [39, 40, 41]. However, again these studies are typically constrained to simulating one single room which agents can enter and leave and do not consider possible airborne virus transmission. ArchABM tries to address these issues by providing an easy-to-use and easy-to-install, fast, and flexible agent-based simulator that can simulate complex human-building-interaction patterns while calculating relevant IAQ parameters that take potential airborne virus transmission into account.
2 Methods
2.1 Agent-based simulator
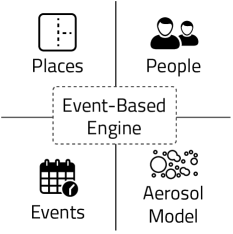
In this article, a novel event-based multi-agent simulation framework is proposed to simulate complex human interaction patterns with and within the built environment and to calculate IAQ metrics and physiological responses. This section summarizes the key features of the proposed framework and formalizes its main components: events, places, people and aerosol model.
Agent-based simulators can be implemented in two ways: a) continuous simulation and b) event-based simulation. Continuous simulations have a fixed time-step, and the system state is updated in every step. For these simulations, it is critical to select an appropriate period parameter, which indicates how much time elapses between state updates. Furthermore, these simulations can be highly inefficient, as there may not be any changes from one step to the next. Conversely, in discrete event-based simulations, the system is only updated when a new event occurs. The simulator processes new events in sequential order as they are fired or triggered by the simulated entities or agents. An event-based approach is followed for this work.
Engine
The simulator was implemented using Python 3.7.9 [42]. An object-oriented paradigm was adopted, where each agent is a class instance. The engine was developed on top of the SimPy 4.0.1 [43] library, a process-based discrete-event simulation framework. Under this paradigm, processes are used to model the behavior of active components, such as users. Processes live in an environment and interact with the environment and with each other via events. The most important event type for our application is the timeout, which allows a process to sleep for the given time, determining the duration of the activity. Events of this type are triggered after a certain amount of simulated time has passed.
Components
The simulator’s core is composed of a discrete event-based engine that manages every activity carried out by the agents during their life-cycle using a priority event queue, ordered by time. The main building blocks of the simulator are depicted in Figure 1. The event-based engine is at the core of the simulator and is fed by events produced by the agents. During the simulation execution, events are handled sequentially, in chronological order. Whenever any agent does an action or takes a decision, it generates and inserts new events into the priority queue. As actions and activities occur, each event is registered on the simulation history to be further exploited for visualization and data analysis purposes.
The workflow of the simulator is described as follows: first, Simpy’s environment is created, and the provided configuration data is used to generate events, places, and people, as well as to initialize the aerosol model. People are introduced into the environment at the start of the day, and their goal is to complete events until the end of the day arrives.
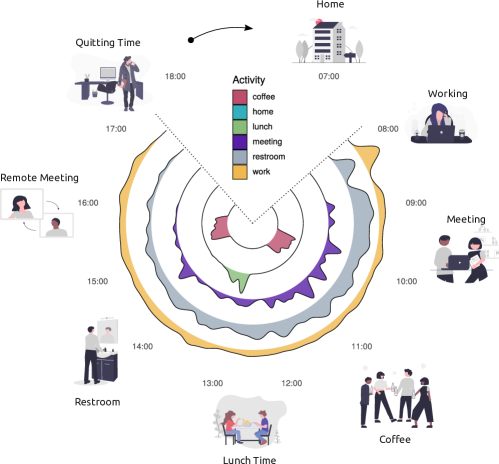
An event is an activity that takes place at a specific physical location for a finite time. Event models (for example: work, meeting, coffee, lunch, etc.) are restricted to a schedule, a set duration, and a number of repetitions. The schedule specifies the times when an activity is permitted to take place. Lower and upper bounds apply to both the duration and the number of repetitions. Concerning the aerosol model, the mask efficiency is also indicated for each activity. Activities invoked by an individual but involving many people, such as meetings, can also be defined. These are called collective events.
The event generation process selects the next activity based on the priority values of each event model. Priority values are used to weigh the importance of each event model rather than sampling from a uniform discrete distribution. The priority value is determined by a piecewise linear function (Figure 2), which is parametrized by the a) minimum number of repetitions , b) maximum number of repetitions , and c) the event repetition count .
A place is an enclosed section of a building designed for specific activities and is defined by the following parameters: building, departments allowed to enter, area and height (or volume), capacity , and natural and mechanical ventilation rates. Note that in the following we understand natural ventilation as the introduction of outdoor air into a building driven by naturally produced pressure differentials [9], opposed to mechanical ventilation, i.e., recirculation of indoor air by mechanical means such as air conditioning (AC) but without outdoor air supply.
Regarding the people dimension, specific departments or groups need to be defined, each one associated with a building and some people. Finally, the aerosol model estimates the indoor aerosolized virus quanta concentration, based on adjustable parameters such as room size, number of exposed subjects, inhalation volume, and aerosol production from breathing and vocalization, among others. The aerosol model is thoroughly explained in Section 2.2.
Performance
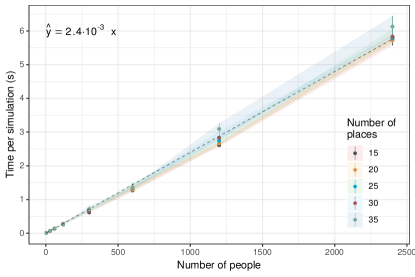
In order to analyze ArchABM’s computational performance, several simulations were computed with a different number of people and places, as illustrated in Figure 4. A grid of values for the number of people {6, 30, 60, 120, 300, 600, 1200, 2400} and the number of places {15, 20, 25, 30, 35} was established. The computational time required to compute 24h of simulated time is measured. In order to yield stable results, the simulations are repeated 20 times. The number of people is indeed the most influential parameter concerning the simulator’s performance. Using the number of people as the predictor, the univariate linear regression model applied to the response variable time yields a slope parameter of 2.4 seconds per person. Thus, on average, ArchABM is able to run 24h of simulated time with 1000 people and 20 places in approximately 2.4 seconds.
2.2 Aerosol model
Several models have been proposed to simulate the airborne transmission of SARS-CoV-2, [44, 45, 16]. Among these models, the model developed by Peng et al. at the University of Colorado, [16], calculates both the virus quanta concentration and the mixing ratio present in a specific place. The virus quanta is defined as the dose of airborne droplet nuclei required to cause infection in 63% of susceptible people [3], and the mixing ratio refers to the amount of , measured in parts-per-million (ppm), present in the air. These two metrics provide an overall picture of IAQ, which is why this model was selected for ArchABM.
2.2.1 Standard model by Peng and Jimenez [16]
Recent studies suggest that indoor measurements hold promise to be used as a proxy for the mass monitoring of indoor aerosol transmission risk for SARS-CoV-2 and other respiratory viruses, [16, 46, 47, 48]. The aerosol model presented by Peng and Jimenez[16] derives analytical expressions of based risk proxies, assuming the social distance is maintained. The relative infection risk in a given environment scales with excess level, and thus, keeping as low as possible is essential to reducing the likelihood of infection.
The aerosol model [16] considers some parameters to be constant across the entire building, as shown in Table 1. These constant values, breathing or virus related, are based on the study undertaken by Peng and Jimenez, [16]. On the contrary, certain parameters are specified for each place, such as volume, ventilation, or the number of people present, as shown in Table 2.
| Notation | Units | Value | |
| Building related | |||
| Background concentration | 415 | ||
| Pressure | P | 0.95 | |
| Temperature | T | 20 | |
| Breathing related | |||
| Mean breathing flow rate | 0.52 | ||
| emission rate (1 person) at 273 K and 1 atm | 0.005 | ||
| SARS-CoV-2 virus related | |||
| Quanta exhalation rate | 25 | ||
| Decay rate of virus | 0.62 | ||
| Deposition to surfaces | 0.3 | ||
| Quanta enhancement due to variants | - | 1 | |
| Simulation related | |||
| Fraction of people using mask | 100 | ||
| Notation | Units | |
| Building related | ||
| Volume of place | ||
| Outdoor, or natural, air exchange rate | ||
| Recirculating, or mechanical, air exchange rate | ||
| Simulation related | ||
| Mask efficiency | ||
| Number of people | - | |
| Number of infected people | - | |
| Time of exposure | ||
From the infection probability point of view, the model considers enclosed spaces, in which virus-containing aerosols are assumed to be rapidly uniformly mixed compared to the time spent by the occupants in the spaces [16]. It states that the probability for a single person to be infected is related to the number of quanta of virus inhaled, and according to the Wells-Riley model of aerosol infection [49] can be calculated as . When is low, as it should be for a safe environment, the use of the Taylor expansion for an exponential allows approximating as .
The inhaled per person (in units) considers the average concentration [], the mean breathing flow rate defined in Table 2, as well as the exposed time , the mask efficiency, , and the fraction of people using masks, :
| (1) |
Note that assuming a constant = 100 = 1 as defined in Table 1 means that one can control whether masks are being used by setting either to 0 (no masks used) or to a value referring to low (0.3), medium (0.5) or high (0.75) mask efficiency, following [16] and [45]. The aerosol concentration increases with time from an initial value of zero following a function, which is the standard dynamic response of a well-mixed indoor volume to a constant input source, [50]. The average concentration, , is calculated as follows:
| (2) |
where is the net emission rate in [quanta/h] units, and the total first order loss rate in [] units:
| (3) |
| (4) |
in Equation 4 is the recirculating, or mechanical, ventilation, and has to do with the flow rate of the AC system, , the filter efficiency, , the removal in ducts, , and additional removal measures, :
| (5) |
The model also calculates the mixing levels reached within the specified area, given that there are no other significant sources or sinks, i.e., indoor excess production, relative to the outdoor background level, is only due to human exhalation and its loss is ventilation, [16]:
| (6) |
The represents the total amount of emitted by all people present, and is calculated by taking into account the emission rate for one person as defined in Table 1, at nominal temperature and pressure conditions (273 K, 1 atm). This value should be adjusted to the pressure and temperature of the building being simulated and multiplied by the number of people present:
| (7) |
2.2.2 Extended model for ArchABM
The model developed by Peng and Jimenez [16] provides equations for a single event of a given duration. However, ArchABM simulates an entire day through short-term events. As a result, there must be some continuity, i.e., a transition from a static model that assumes an initial clean environment towards a dynamic and continuously adapting model that considers how the previous state affects the next state.
According to Equation 2, the concentration can only increase during an event. However, in the scenario presented by ArchABM, people are moving between different locations and when no contagious people are present the concentration should decay (see Equation 8), due to the total removal rate, , which takes into account the ventilation rates, and , as well as the decay rate of the virus, , along with its deposition rate to surfaces, (see Equation 4). Equation 2 was adapted to account for this fact:
| (8) |
The inhaled per person is calculated as in Equation 1, but considering the updated expression for the in Equation 8.
The level formulated in Equation 6 follows a similar adaptation process. In the original aerosol model, the concentration can only increase when people are present and are breathing for a specified time. However, when simulating a day through short-term events, the model should also consider the scenario of these people leaving the room and the effect of the ventilation. The concentration rates should decrease if the ventilation continues and the room is empty. Therefore, the extended mixing equation now takes the previous state into account:
| (9) |
With these modified equations, the ArchABM simulator can estimate the mixing ratio level [ppm] at each place as well as the concentration [quanta/], providing an overall picture of the IAQ distribution per room throughout the day.
2.3 Simulator input and outputs
In order to run a simulation, information about the event types, people, places, and the aerosol model must be provided to the ArchABM framework:
-
–
Events input parameters: name (string), schedule (list of tuples), duration range (integer, integer), number of repetitions (integer, integer), mask efficiency (float), and collective (boolean).
-
–
Places input parameters: name (string), activity (string), building (string), department (list of strings), area (float), height (float), capacity (int), natural ventilation (float), and mechanical ventilation (float).
-
–
People input parameters: name (string), building (string), and department (string).
- –
Regarding ArchABM’s output, whenever a new event occurs, the simulator saves the state of each person and each place in the simulation history data structure. The following attributes are stored:
-
–
Places output metrics: place ID (int), number of people (int), number of infected people (int), level (float), and level (float).
-
–
Person output metrics: person ID (int), simulation time (float), place ID (int), event ID (int), level at current place (float), and inhaled during the event (float).
In this way, ArchABM provides full tractability of the places visited by every person, their physiological responses as well as the instantaneous IAQ at each place.
2.4 Experimental setup
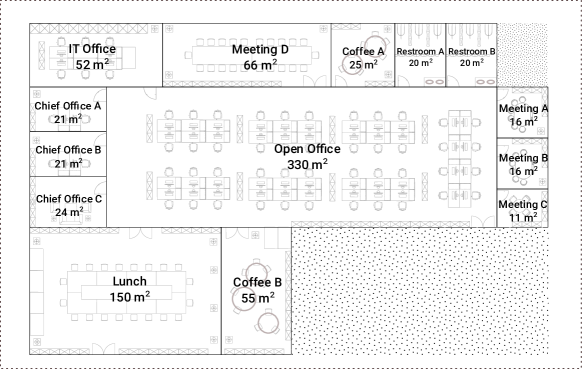
The simulated configuration is based on the real floor plan of one building of our research center, as shown in Figure 5. It should be noted that the floor plan is only shown for illustration purposes and is not required to run the simulator. As explained in Section 2.1, the simulator only requires information about the types of events that can occur, places’ spatial parameters (area & capacity), the number of people initially present and the aerosol model physical parameters. The events and places defined for this simulation are summarized in Table 3 and Table 4. There are five types of events: work, meeting, coffee, restroom, and lunch. Meetings and lunch activities are regarded as collective events. Each event model is limited to a certain schedule, duration , and a number of repetitions. For each event model, the mask efficiency is also defined.
The floor area of each location was measured, and the volume was estimated assuming a height of 2.7 m. The initial number of people present , the maximum number of people that can fit in the room, and the ventilation rates (both mechanical , i.e., without outdoor air supply, and natural , i.e., with outdoor air supply) are also defined. Meeting rooms A, B, C, and restrooms A and B are subject to poor natural ventilation, as they are oriented towards the interior of the building and do not have direct access to a window.
There are 60 people distributed in 7 different departments: D1, D2, and D3 have 16 people each; D4 refers to 7 Information Technology (IT) workers, and D5, D6, D7 hold the head of departments and the Chief Executive Officer (CEO), with 2, 2, and 1 people respectively. Each place is only accessible to people from specific departments. This is determined by the ”departments allowed” parameter on Table 4. The IT office, for example, is only accessible to members of the IT department D4. Due to accessibility limitations (no unisex bathrooms), one of the restrooms (restroom B) is open to all departments except D7 (CEO). Note that departments D1-D4 can work in the open office for extended periods of time throughout the day, whereas managers (departments D5-D7) can only walk through and cannot work or meet with employees from departments D1-D4 in the open office. The number of infected people is set to 3 in all the proposed scenarios. The aerosol model parameters are described in Section 2.2.1.
| Activity | Schedule |
|
|
|
Collective | ||||||
|---|---|---|---|---|---|---|---|---|---|---|---|
| Work | 8:00 - 17:00 | 0.5 - 1 | 0 - | 0 | |||||||
| Meeting | 9:00 - 16:00 | - 1.5 | 0 - 5 | 0 | ✓ | ||||||
| Coffee |
|
- 0.25 | 0 - 2 | 0 | |||||||
| Restroom | 8:00 - 17:00 | 0.05 - 0.1 | 0 - 4 | 0 | |||||||
| Lunch | 13:00 - 15:00 | - 0.75 | 1 - 1 | 0 | ✓ |
| Area [] | People | Capacity [people] | [] | [] |
|
Activity | |||
| Offices | Work | ||||||||
| Open Office | 330 | 48 | 60 | 1.5 | 0 | D1,D2,D3,D4 | |||
| IT Office | 52 | 7 | 10 | 1.5 | 0 | D4 | |||
| Chief Office A | 21 | 2 | 5 | 1.5 | 0 | D5,D6,D7 | |||
| Chief Office B | 21 | 2 | 5 | 1.5 | 0 | D5,D6,D7 | |||
| Chief Office C | 24 | 1 | 5 | 1.5 | 0 | D5,D6,D7 | |||
| Meeting rooms | Meeting | ||||||||
| Meeting Room A | 16 | - | 6 | 0.5 | 0 | All except D4 | |||
| Meeting Room B | 16 | - | 6 | 0.5 | 0 | All except D4 | |||
| Meeting Room C | 11 | - | 4 | 0.5 | 0 | All except D4 | |||
| Meeting Room D | 66 | - | 24 | 1.5 | 0 | All | |||
| Coffee rooms | Coffee | ||||||||
| Coffee A | 25 | - | 10 | 1.5 | 0 | All | |||
| Coffee B | 55 | - | 20 | 1.5 | 0 | All | |||
| Restrooms | Restroom | ||||||||
| Restroom A | 20 | - | 4 | 0.5 | 0 | All | |||
| Restroom B | 20 | - | 4 | 0.5 | 0 | All except D7 | |||
| Lunch room | |||||||||
| Lunch | 150 | - | 60 | 1.5 | 0 | All | Lunch | ||
2.4.1 Measures
The following section describes what actions can be implemented to control indoor air quality and reduce and concentration levels.
Building-related
Architects and engineers can increase the space’s area and/or height during the design stage and create open spaces or more separated workspaces. The ventilation strategy can also be changed through mechanical systems like air conditioning (AC) or portable high-efficiency particulate air (HEPA) filters, or through natural ventilation, obtaining outdoor air exchange through windows or doors.
Company policy-related
Physical measures include mandatory masks, locking / restricting access to small rooms, or renting additional rooms. Other measures entail reducing the number of people working from the office through remote shifts, reducing the number or duration of meetings, restricting movements between buildings or departments, and, in some cases, prohibiting eating lunch in the office to avoid no-mask scenarios. This latter possibility, however, may be unrealistic.
2.4.2 Experiments
ArchABM can help to quantify the impact of some of these building- and company policy-related measures. Therefore, the proposed experiments are defined in this section.
Baseline case - no measures
A baseline case with no measures and reduced ventilation is first studied. The events’ parameters are summarized in Table 3, where an schedule is set for each event type, along with their minimum and maximum duration , and the number of repetitions. The mask is not used anywhere (). Meetings and the lunch activity are considered to be collective events.
Places’ parameters are summarized in Table 3. The capacity refers to the maximum number of people that can be present in that specified space. A low natural ventilation rate is established (, and for poor ventilated rooms) and there is no mechanical ventilation ().
Building-related
-
1.
Larger building: each room’s area (and thus each room’s volume) is increased by 20. This measure needs to take into account the increase in costs, which according to [51] would mean an increase of almost in the final construction costs as well.
-
2.
Separate workspaces: the open office is divided into three identical offices, each one with 110 , 16 people (48/3), and a capacity of 20 (60/3).
-
3.
Better natural ventilation: windows are opened everywhere except in restrooms for better outdoor air supply. is increased up to 5 .
-
4.
Better mechanical ventilation: the flow rate of the AC system is incremented, assuming a 20% filter efficiency , a 10% of removal in ducts and no additional removal measures. According to [51], adding AC to the building would mean an increase of 14% in the building overall costs. According to Equation 5, the values resulting for are summarized in Table 5:
[] [] Offices Open Office 1000 0.337 IT Office 300 0.641 Chief Office A 300 1.587 Chief Office B 300 1.587 Chief Office C 300 Meeting rooms Meeting Room A 300 Meeting Room B 300 Meeting Room C 300 Meeting Room D 1000 1.68 Coffee Coffee A 300 Coffee B 1000 Restrooms Restroom A 0 0 Restroom B 0 0 Lunch Lunch 1000 Table 5: Parameters for a better mechanical ventilation experiment involving AC with air recirculation, but no outdoor air supply
Policy-related
-
1.
Shifts between workers: this would imply a reduction in the number of people present in each room. For this experiment, the population is reduced by 40%, resulting in 29 people in the open office, 4 in the IT Office, and 1 in each chief office, summing up to 36 people. This measure also entails a non-quantifiable cost to the company.
-
2.
Limit duration of events: the duration of meetings is limited to a maximum of 30 minutes, setting . The duration of coffee breaks would be limited to 5 minutes, meaning , and lunch would be of 20 minutes, .
-
3.
Use of masks: in this case, the mask use is mandatory, meaning that and the mask efficiency, , is set to 0.75 in the offices and meeting rooms, to 0.5 in the restrooms, to 0.3 for coffee breaks and leaving it at 0 for lunch breaks, representing the absence of masks while eating.
Combined case
Finally, in order to quantify the impact of implementing both building and policy measures, the experiments of better natural ventilation and limit events duration are combined in a new experiment.
2.5 Statistical analysis
The results of the described experiments are evaluated with regard to three levels: places, people (i.e., departments), and the entire building. In terms of outcome parameters related to IAQ at the place-level, the maximum level (concentration in ppm) and the maximum virus level (concentration in ppm) reached during the day per place are calculated. In terms of physiological response outcome at person-level, the time-weighted average inhaled over the day and the maximum inhaled at the end of the day per person are used. At the building level, volume-weighted average maximum is reported in terms of IAQ parameters per experiment, where volume refers to the volume of each place. To summarize physiological response parameters on the building level, the maximum level at the end of the day is averaged over all people.
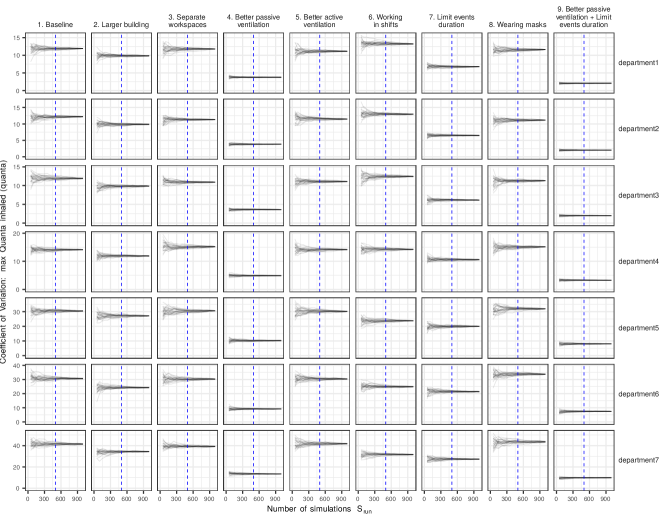
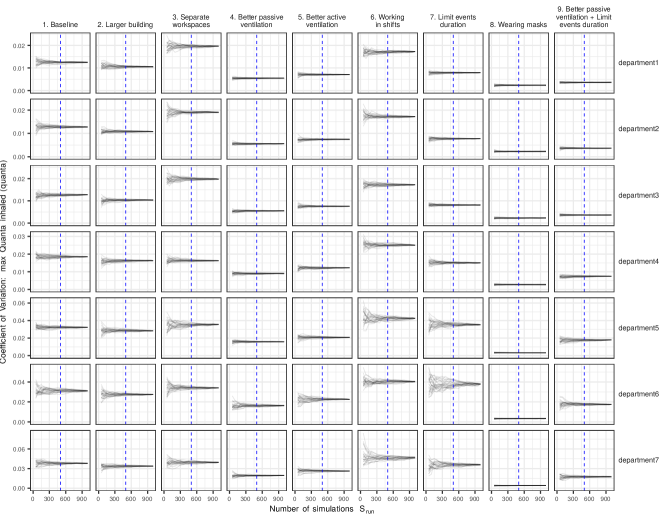
Prior to further statistical analyses of these outcome parameters, we conducted a set of trial simulations to determine an adequate number of simulation runs . Note that one simulation, i.e. one simulation run refers to simulating agents’ actions and interactions in the given environment as defined in the input configuration file over the course of one day. Certain ABMs are prone to be statistically underpowered as they may require much computational time and effort to complete one single simulation [52]. This promotes Type-I errors of not detecting an actual effect. ArchABM is computationally efficient and takes less than a second on a standard laptop to complete one simulation with the given baseline configuration, which could encourage running many simulations. This, however, may lead to overpowered analyses, promoting Type-II errors of detecting a non-existent effect. For this, we ran each of the nine experimental configurations from = 10 up to = 1000 simulations in unitary steps and repeated each setting 100 times (e.g., we computed a set of 100 simulations for each ). For every single simulation, we computed further the coefficient of variation () [53], defined as the ratio of the standard deviation of a sample to its mean for each of the four critical outcome parameters (maximum and level per place and mean inhaled and inhaled per department). Low consecutive s imply the stability of the results. Therefore, s were plotted for all simulation sets over for all outcome parameters, and convergence of towards a stable range was visually assessed. The resulting plots are detailed in the A. Following this analysis, the adequate was 500 for all experiments.
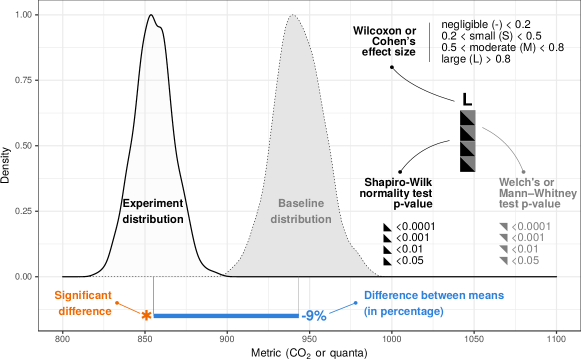
Each experimental configuration is compared to the baseline experiment to determine whether significant differences were achieved for all four outcome parameters. We hypothesized for each of the experimental configurations that the respective measures would positively impact IAQ and physiologic response, i.e., would yield lower and levels in places and lower inhaled and amounts in people compared to baseline. To test this hypothesis, we first apply the Shapiro-Wilk test of normality to the respective distributions. Then, for normally distributed data, Welch’s t-test is used to compute a p-value, and the effect size [54] is calculated using Cohen’s . For not normally distributed data, Mann-Whitney U-test is used to compute a p-value, and the Wilcoxon test is used to calculate the effect size. Finally, the percentage difference between means is reported. A statistically significant difference between distributions, however, is only assumed whenever the p-value is below 0.001 and the effect size is moderate (between 0.5 and 0.8) or large (greater than 0.8). Figure 6 provides a visual summary of the statistical analyses performed. All statistical tests are performed using R v3.6.3 [55].
Note that for all quanta-related outcome parameters calculated in places, all simulation runs that yield a final level of zero at the end of the day are excluded from all experiments. The reason is that otherwise, the level distributions end up being bi-modal, with a skew towards zero. This happens predominantly for the chief offices if no infected person ever enters the office throughout the day. Having run each experimental configuration for many runs, we assume this to occur in the same frequency throughout all experiments - including the baseline experiment - which makes each experiment comparable to baseline when removing these simulations. In this way, only relevant simulations in which levels rose due to an infected being present are considered.
3 Results and Discussion
3.1 Validation experiment
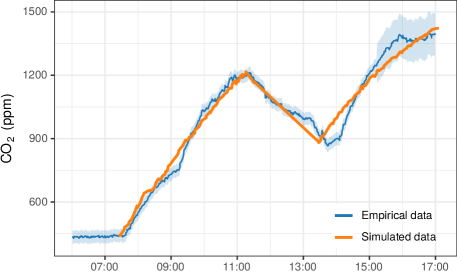
Recently, efforts have been made to analyze levels inside buildings, and many studies can be found in the literature [46, 39, 17]. The study of Candanedo et al. [17], presents measurements444https://github.com/LuisM78/Occupancy-detection-data of during a day in an office with two people present. Replicating their presented parameters for office room area and volume, timetable, and people present, we compare their data, which is available, to the results produced by ArchABM. This comparison is presented in Figure 7. In the real measurements, the level begins to rise shortly before 8:00 a.m., when the room is first occupied. When the second occupant arrives just past 9:00 a.m., the slope of the readings increases. Between 11:00 a.m. to 1:00 pm natural ventilation increases, obtaining outdoor air supply through door opening and/or occupants leaving, and thus the decreases. Also, when the room is not occupied around 1:00 - 1:30 p.m., the sensors register a slight drop in their readings. For this simulation, a constant outdoor air exchange rate of 0.25 was set. It can be observed that the simulated data follow the measurements presented by Candanedo et al. [17] in a satisfactory manner, and as a result, we proceeded with the experiments proposed in Section 2.4.2.
3.2 Results for baseline experiment
The results of a single simulation with the baseline configuration are presented in this section. Figure 8a summarizes the types of events (coffee, lunch, meetings, go to the restroom, do office work) performed by all occupants throughout the day, while Figure 8b shows a detailed breakdown of the activities performed by each person throughout the day.
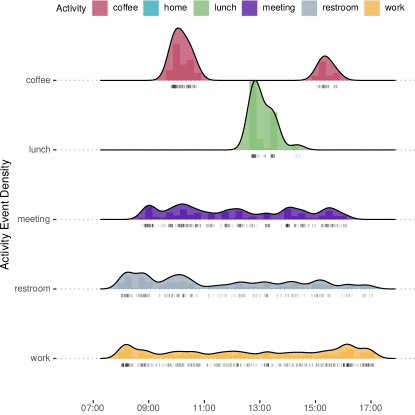
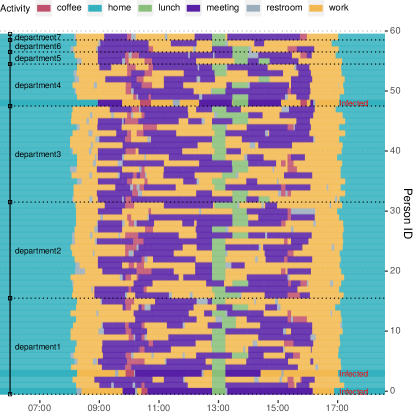
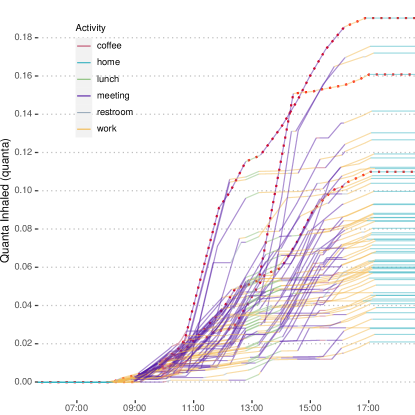
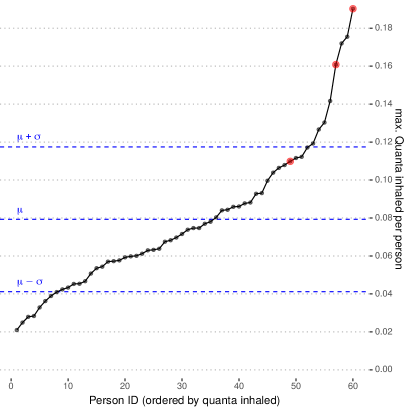
As it can be observed on Figure 8b, agents are strictly adhering to the specified schedule, with two coffee breaks, one main lunch event, and meetings, restrooms, and work events spread throughout the day. The three randomly infected people are also highlighted in Figure 8b. The amount of quanta inhaled per person is depicted in Figure 8c. Each line represents a person, and the red dotted lines indicate the three infected people. The color of the line represents the activity that each agent is performing. For instance, meetings and lunch activities primarily contribute to quanta inhalation between the agents. The total quanta inhaled by each person at the end of the day is shown in Figure 8d, and the three infected people are highlighted with red dots.
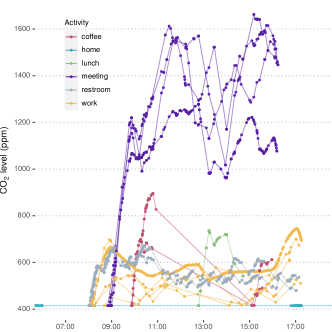
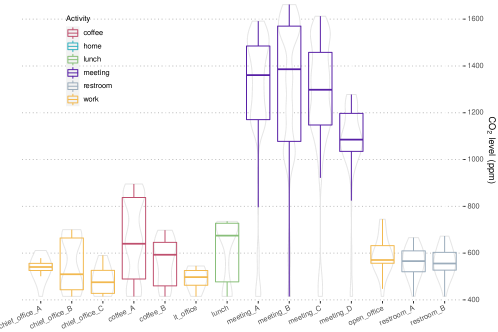
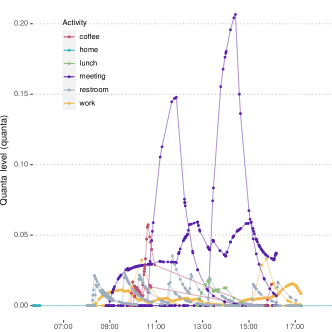
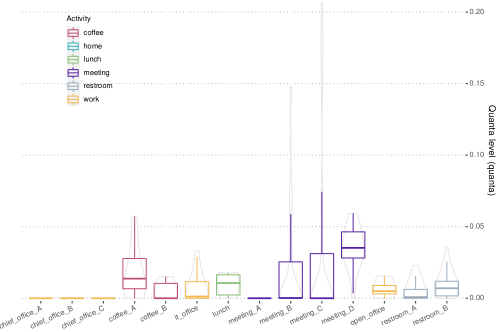
From the places perspective, ArchABM also offers the possibility of tracking the and concentration levels (Figure 9). Examining the level at each place throughout the day (Fig. 10.a), it can be observed that the meeting rooms accumulate the highest concentration throughout the day. The coffee places rapidly accumulate during the coffee events, but the air quality is restored between the coffee breaks. Other rooms, for example, restrooms and office places show a more constant level. The distribution of concentration can directly be observed in Figure 9b, where a box-plot is overlaid on top of a violin plot. A similar interpretation can be concluded with the concentration for this simulation run.
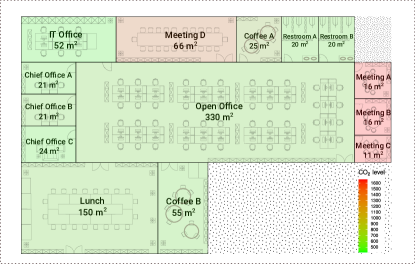
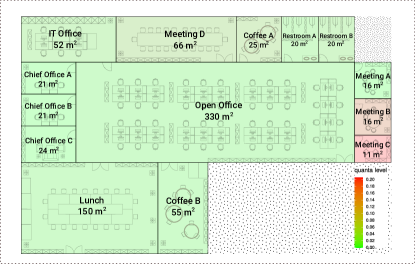
In addition, metrics related to IAQ at the place level have been overlaid on the floor plan, as shown in Figure 10. Concerning the level, meeting rooms are highlighted as the worst locations. With regard to the level, meeting rooms B and C come out worst in this case. These results demonstrate ArchABM’s capabilities of detecting ”hotspots” in terms of high and virus quanta concentrations (in our case meeting rooms and the coffee place) across the entire building.
It should be noted that the results in this section refer to a single simulation run and that the -related metrics are very dependent on the randomly selected infected people. However, the high computational performance of ArchABM allows running multiple simulations, as is explained in the following section.
3.3 Results for further experiments
The impact of different building-related and company policy-related measures are presented in this section. As it was explained in Section 2.4.2, nine experiments are proposed, including the baseline case and the combined building-policy case. The results of the described experiments are evaluated with regard to three levels: places, people (i.e., departments), and the entire building.
3.3.1 Results for places
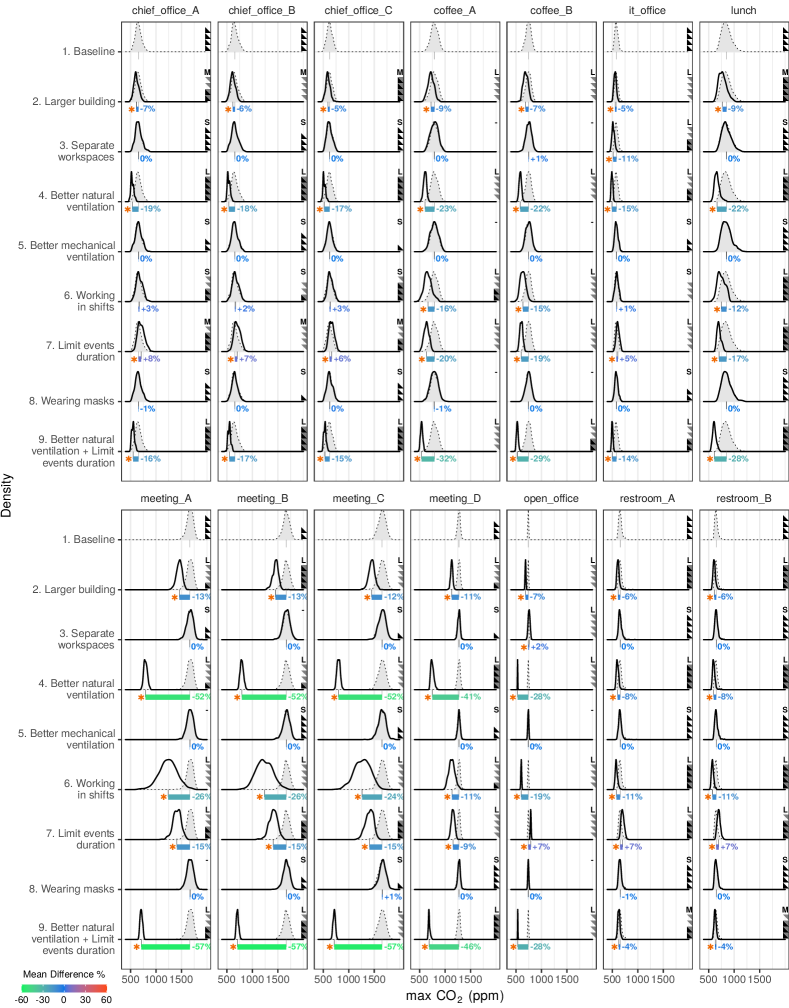
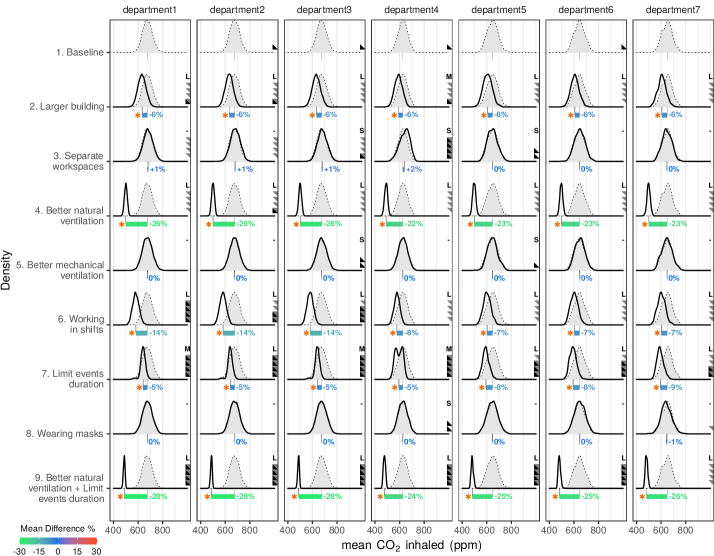
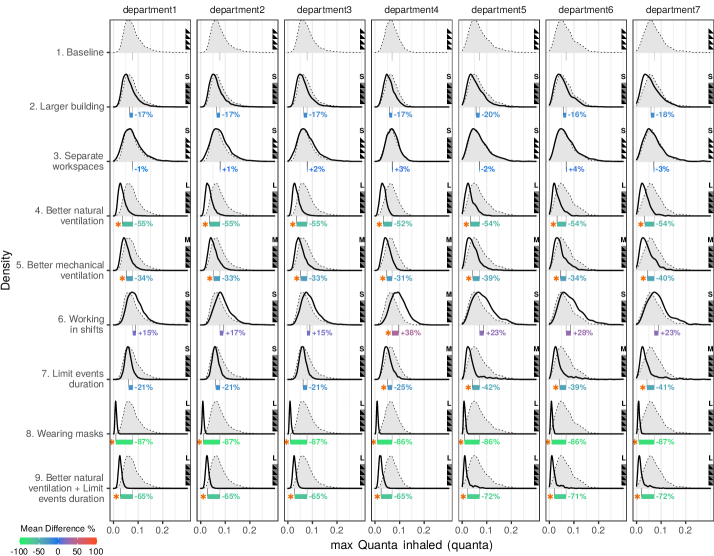
In terms of outcome parameters related to IAQ at the place-level, the maximum level (concentration in ppm) and the maximum virus level (concentration in ppm) reached during the day per place are calculated. This section examines the results from a location standpoint (Figure 11 and Figure 12, and we will concentrate solely on differential aspects between places at each experiment. The analysis of these results takes into account the statistical significance of the hypothesis tests explained in Section 2.5.
Maximum level
Designing a 20% larger building (i.e. increasing each room’s area by 20%) reduces the maximum level of in every room, and especially affects the meeting rooms, where the reduction nearly doubles when compared to the rest of the building. Separate workspaces have a significant impact only in the IT office and the open office. This strategy, in particular, lowers the maximum level of in the IT office by up to 11% while increasing it by 2% in the open office. Designing better natural ventilation systems greatly improves the indoor air quality in terms of level, particularly in meeting rooms. Improved mechanical ventilation systems, on the other hand, have no effect on levels due to the way they were implemented in the model (no air exchange/replacement).
The strategy of working in shifts affects the entire building, except for the chiefs’ rooms, and reduces the maximum level of the meeting rooms in particular. Shortening the duration of events produces interesting results in terms of . People are not allowed to take long coffee breaks, lunch activities or meetings, so they spend more time in other places (for instance, chiefs, IT office, open office and restrooms), where the level rises. Establishing a mandatory mask policy has no effect on the level as the model does not take mask filtration into account for calculations. Finally, the combination of improved natural ventilation and events duration limitation corresponds to the confluence of the aforementioned observations about these experiments.
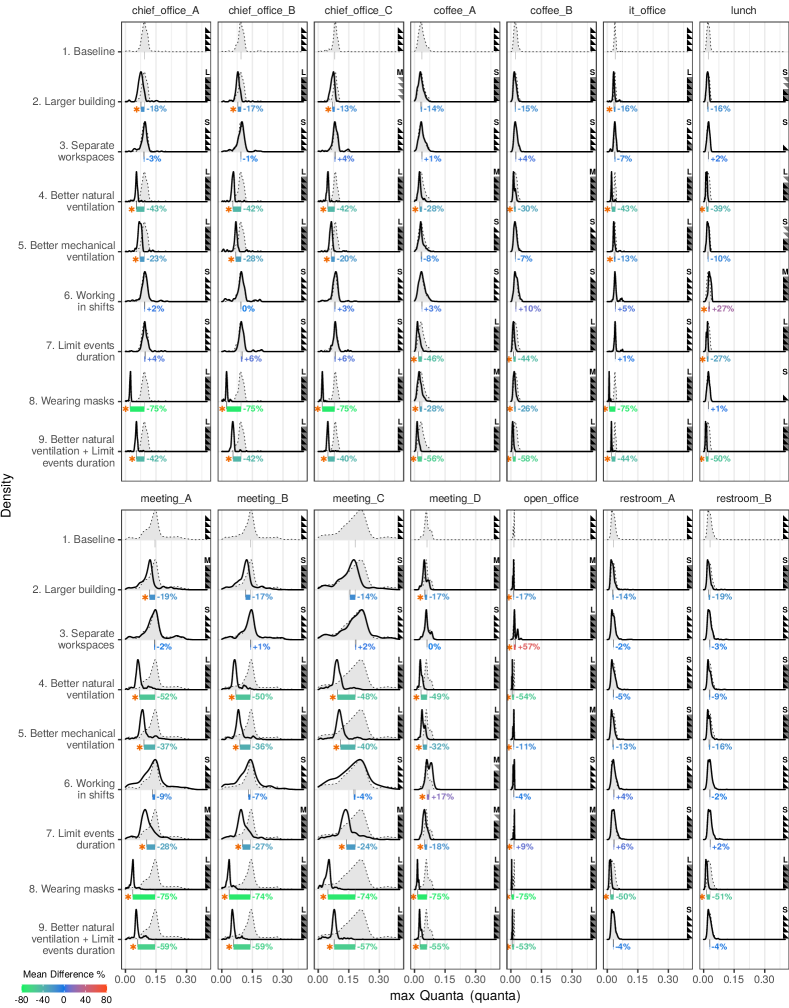
Maximum level
The design of a larger building in terms of room area reduces the maximum level in every room by up to 18%. Separate workspaces have a significant impact exclusively in the open office, which is divided into three distinct spaces according to this strategy. This building configuration specifically raises the maximum level in the open office by up to 57%. This increase in the mean level is due to the fact that in this experiment, one of the three spaces is more likely to be highly contaminated, which raises the mean value. Better natural ventilation system design improves indoor air quality in terms of , especially in meeting rooms. Installing better mechanical ventilation systems reduces concentration levels in all rooms, with a greater impact in chief offices and meeting rooms.
The strategy of working in shifts increases the prevalence of the virus, affecting the levels of the entire building as we kept the number of infected people constant in our experiments. Larger spaces where a large number of people can congregate (such as the lunch room and the largest meeting room D) are particularly affected. Limiting the duration of events produces the same results as analyzing the level under this strategy. People spend more time in other places (for example, chiefs, it office, open office, and restrooms, where the level increases) because they are not allowed to take long coffee breaks, lunch activities, or meetings. Establishing a mandatory mask policy affects every area in the building, except the lunch room, and has a greater effect on the level of the chief offices and meeting rooms. Combining the experiment of improved natural ventilation with the limitation of events’ duration produces very similar results to the former experiment. However, in this case there is a slight improvement in the quanta level in the coffee places and the lunch room.
3.3.2 Results for people / departments
In terms of physiological response outcome at person-level, the time-weighted average inhaled over the day and the maximum inhaled at the end of the day per person are used. This section examines the results from a departmental viewpoint (Figure 13), and we will concentrate solely on differential aspects between departments at each experiment. Once again, the analysis of these results takes into account the statistical significance of the hypothesis tests explained in Section 2.5.
Working in shifts reduces the average of level inhaled by all departments, but particularly in departments D1, D2, and D3. This difference is clearly explained by the fact that in this experiment the number of people in these departments gets reduced, and thus, the emitted decreases as well. Nonetheless, in terms of level in this shift-work strategy, maintaining a constant number of infected people while reducing the total number of people increases the virus prevalence among the population, which has the greatest impact on the IT office department. As a consequence, the level at the department D4 (IT office) is increased by 38%, while the rest of the departments suffer an increase of 15 to 25%, approximately.
Limiting the duration of events has a similar effect with respect to the average level inhaled across departments, with an average reduction of 5 to 9 percent. However, in terms of maximum inhaled at the end of the day per person, this strategy has the greatest impact on departments D5, D6 and D7, which represent chief officers. In comparison to departments D1-D4, the reduction in average inhaled by departments D5-D7 is nearly doubled. Interestingly, other ABM-based studies found similar results when analysing the duration of classes in schools [36], where shorter classes were preferable. The remaining experiments (larger building, separate workspaces, better natural ventilation, better mechanical ventilation, and wearing masks), do not show any differential aspects among departments, however, wearing masks has the largest impact on reducing quanta levels across all departments. The benefit of wearing masks indoors has been found in several other studies applying ABMs [26, 34].
3.3.3 Results for whole building
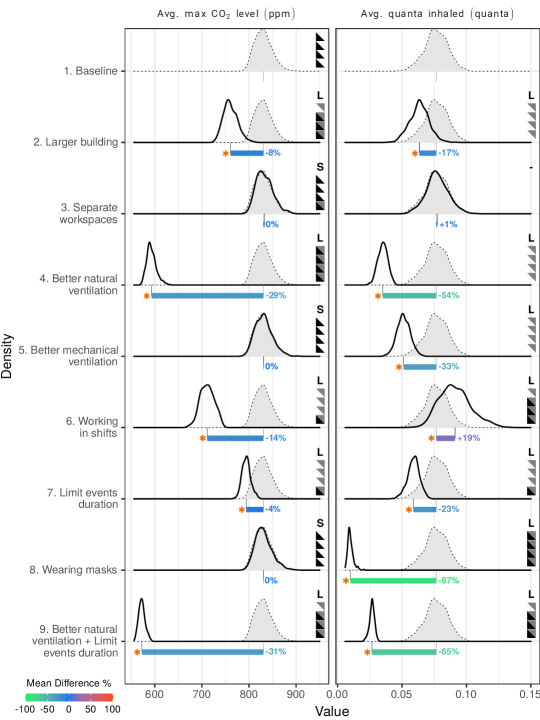
At the building level, volume-weighted average maximum is reported in terms of IAQ parameters per experiment, where volume refers to the volume of each place. To summarize physiological response parameters on the building level, the maximum level at the end of the day is averaged over all people. Once more, the analysis of these results takes into account the statistical significance of the hypothesis tests explained in Section 2.5, which has been included on Figure 14
Concerning the building-related measures, increasing each room’s area by 20% reduces, on average, the maximum level by 8% and the maximum level by 17%. However, the cost of these solutions must be carefully considered, and in some cases, they are not a financially viable option. Creating separate workspaces does not affect either the nor levels at the building level. However, the results from the perspective of the place claim that it affects the modified spaces. Increasing the natural ventilation, the outdoor air exchange rate, reduces, on average, the maximum level by 29% and the maximum level by 54%. This measure improves the IAQ of the building and is a crucial parameter to control the indoor air quality, as expected. Increasing the mechanical ventilation rate improves the level by 33% but does not modify the concentration level, as there is no outdoor air supply, the air is merely recirculated. Although virus quanta can be removed from recirculated air, the level remains unchanged.
Regarding the company policy-related measures, working in shift reduces, on average, the maximum level by 14%, but increases the maximum level by 19%. These results can be explained by the fact that maintaining a constant number of infected people while reducing the total number of people increases the virus prevalence among the population. Thus, it is expected to observe the level increase in this experiment. Constraining the events’ duration reduces, on average, the maximum level by 4% and the maximum level by 23%. This reflects the fact that the level is directly related to the meeting events and rooms and that limiting their duration can be an easy-to-apply and effective strategy to reduce the concentration indoors. Establishing a mandatory mask policy has no effect on the level but almost completely eliminates the concentration from the building, as predicted by the aerosol model developed by Peng and Jimenez [16]. Other ABM models from the literature, such as [33, 34, 35, 36], have made similar observations regarding the use of masks.
Combining better natural ventilation and limiting the duration of meetings and lunch events has a significant effect on both and levels. This case combines the most promising measures from the above experiments and reduces, on average, the maximum level by 31% and the maximum level by 65%.
3.4 Strengths, limitations and future work
In this study, we present a novel agent-based simulator framework, ArchABM, designed to model complex human-building interaction patterns for evaluating the impact of building-related and policy-related measures on a building’s IAQ in terms of and virus quanta levels and the respective physiological response of occupants. While the application of ABMs in the building domain has grown in recent years, few studies specifically focus on IAQ, and only very recent studies consider the latest call to include potential airborne virus transmission in their models. Furthermore, to the best of our knowledge, no other ABM-based approach has been published that allows for an easy-to-setup simulation of complex, realistic human-building interaction patterns resulting from occupants following their daily schedule across an entire building and adhering to conventions or local policies while at the same time including a random component.
When designing a building or adapting an existing building to improve IAQ for its occupants on a broad scale, cost and energy efficiency are critical considerations. For example, a large, perfectly ventilated room may not be necessary depending on the given human interaction with this room. At the same time, it may be futile to optimize one room’s ventilation system under great (engineering and monetary) efforts when occupants later get infected in another, overlooked room such as a coffee kitchen. ArchABM was designed to provide a general overview and optimize the entire building based on its intended use. Simulations performed with ArchABM can assist in unveiling such ”hotspots” with poor IAQ or ”oversized” rooms and allows playing with a combination of (likely costly) building-related measures and (potentially less expensive) policy-related measures that may lead to significantly improved IAQ. Thanks to ArchABM’s good computational performance, results can be evaluated quickly and with a high number of simulation repetitions, which allows extracting statistically valid conclusions for decision-makers.
We present here a realistic use case applying ArchABM, based on a real floor plan with realistic room sizes, number of people, and workday routines, which results in a series of interaction patterns that in turn lead to different IAQ distributions in different rooms. While some of the investigated measures resulted in expected outcomes in terms of and virus quanta levels (such as masks having a positive effect on quanta levels and inhaled quanta), ArchABM allows quantifying and comparing these effects in detail - revealing, for example, that relatively ”simple” measures such as improved natural ventilation (increase outdoor air supply by opening windows) or reducing the duration of events have a relatively significant positive impact. Results from our simulations further show how poor IAQ in terms of and virus quanta levels can be detected for each room in the building, highlighting in our case that in particular meeting rooms are problematic in terms of IAQ. ArchABM allows combining, testing and quantifying a set of various measures, whose outcome may not be easy to predict, taking into account the use of the entire building by its occupants. Combining better natural ventilation with limiting meeting duration, for instance, could decrease average levels on the building level by 31% and average virus quanta levels by 68%. In those scenarios, ArchABM can provide valuable quantitative insights to architects, engineers, or building and human resource managers.
3.4.1 IAQ including aerosols
IAQ in this study has been principally defined by pollutant concentration. A recently published aerosol model calculating both the amount of exhaled and inhaled , as well as virus quanta (here for SARS-CoV-2), was adapted to account for the dynamics of people entering and leaving different rooms over a day to be applicable in our agent-based simulation. ArchABM’s calculations regarding levels in a room were validated against a well-documented case from the literature where was measured, and recorded [17]. Validating inhaled and in particular accumulated and inhaled virus quanta levels is to date as complex as to measure virus concentrations in a room reliably. Regarding SARS-CoV-2, this is currently a critical research topic, and viable options may become available in the future. For now, we have to rely on the applied aerosol model, which in any case has been validated against real cases of SARS-CoV-2 transmissions [50]. We would like to point out that here we deliberately refrained from calculating parameters such as ”infection risk” as we understand that it is still not fully known which amount of virus quanta leads to which amount of risk. We therefore only report virus quanta levels for rooms and inhaled quanta for occupants. ArchABM being flexible and modular, and available as an Open Source Python library, it is straightforward to adapt the current SARS-CoV-2 aerosol model or another model related to airborne virus transmission. The same applies to extending the definition of the calculated IAQ in order to include other relevant parameters such as temperature, or humidity [17] - this can be addressed in future work.
3.4.2 Localised air flow
Compared to other ABM-related studies using aerosol models for indoor environments, to the best of our knowledge, this study is the first to analyse differences between mechanical and natural ventilation configurations which apply varying ventilation rates. One limitation of the aerosol model included in ArchABM though is related to the nature of ventilation, which removes both and virus quanta from a room over time. Here, we assume homogeneous mixing of air constituents and do not take into account airflow direction or any localized airflows induced either by people or the ventilation itself, depending on the room geometry or interference with objects or occupants in the room. This is currently another important research topic, with authors conducting detailed (mostly Computational Fluid Dynamics (CFD)-based) studies of indoor airflows and different ventilation systems [56, 47, 48, 13, 57]. Evidence suggests that the position of ventilation inlets and outlets, as well as occupants’ individual positions relative to an infected person play an important role in airborne virus transmission [13, 36]. Accounting for these complex air flow-related effects is generally difficult in agent-based models as computational efforts even for a single room are typically high. However, recent studies suggest model adjustments taking into account airflow directions or locally spread quanta [35, 36].
3.4.3 Agent characteristics
Regarding the agents’ (i.e., building occupants’) characteristics used in this study, future work could involve varying agents’ profiles in order to account for different types of respiratory activities (speaking, shouting, breathing, etc.), respiratory parameters (e.g., inhalation rate) or activity level (resting, standing, walking, etc.) [3]. Even varying individual agent behavior based on agent physical perception or physiology may be added [39, 58]. Yet, adding such complexities to the model will result in performance loss and may reduce the comprehensibility and explainability of the model’s output. For certain applications, such a level of detail regarding ”agent microdynamics” may not be necessary.
3.4.4 Building optimisation
ArchABM’s good computational performance and standard output format (JavaScript Object Notation, JSON) make it attractive for coupling with advanced optimization methods such as Reinforcement Learning [8] or more traditional Knapsack [59], or Design of Experiments approaches [60], with which optimal room sizes and distributions or ventilation configurations could be estimated based on simulated human-building behavior. We believe there is an immense potential for future studies to explore such building design optimization in order to find cost and energy-effective solutions that at the same time provide good IAQ across the entire building - given its use.
4 Conclusion and summary
In this study, we present a novel, fast and open source agent-based modelling framework, ArchABM, which allows for simulating complex human-building-interaction patterns to estimate IAQ across the entire building, while taking into account potential airborne virus concentrations. A recently published aerosol model for SARS-CoV-2 was adapted to calculate time-dependent carbon dioxide () and virus quanta concentrations in each room as a measure of IAQ as well as inhaled and virus quanta for each agent (occupant) over the course of a day as a measure of physiological response. ArchABM was then applied to simulate a realistic office scenario including 14 rooms and 60 agents to investigate the impact of building-related measures and policy-related measures on overall IAQ and physiological response of occupants. Results allowed determining critical and not-so-critical rooms in terms of IAQ and allowed for a quantitative assessment of the impact of single and combinations of measures on IAQ and physiological response, suggesting that improved natural ventilation, limiting meeting duration and wearing masks were among the most effective measures.
The pandemic caused by SARS-CoV-2 has demonstrated that we need to focus more on improving IAQ in order to avoid risking occupants’ health. We believe that advanced simulation tools such as ArchABM can provide novel insights and moreover may assist stakeholders in finding cost and energy effective solutions, ensuring good IAQ across a building, while taking into account how single rooms are actually used. Using ArchABM in optimisation scenarios may even lead to new ways of designing future buildings that provide healthier indoor environments.
Declaration of competing interest
The authors declare that they have no known competing financial interests or personal relationships that could have appeared to influence the work reported in this paper.
Acknowledgements
The authors would like to thank Asier Aguirre Martínez and Egoitz Bizkarguenaga Agirre for their help in obtaining realistic room sizes, floor plans and work schedules for the use case of our research center. The authors further thank the anonymous Reviewers for their insightful comments that helped to improve the manuscript.
Copyright Information
This manuscript version is made available under the CC BY-NC-ND 4.0 license
References
- [1] R. Zhang, Y. Li, A. L. Zhang, Y. Wang, M. J. Molina, Identifying airborne transmission as the dominant route for the spread of COVID-19, Proceedings of the National Academy of Sciences 117 (26) (2020) 14857–14863. doi:10.1073/PNAS.2009637117.
- [2] S. GA, v. R. C, K. S, B. RA, B. D, Small droplet aerosols in poorly ventilated spaces and SARS-CoV-2 transmission, The Lancet. Respiratory medicine 8 (7) (2020) 658–659. doi:10.1016/S2213-2600(20)30245-9.
- [3] G. Buonanno, L. Stabile, L. Morawska, Estimation of airborne viral emission: Quanta emission rate of SARS-CoV-2 for infection risk assessment, Environment International 141 (aug 2020). doi:10.1016/j.envint.2020.105794.
- [4] Y. Li, H. Qian, J. Hang, X. Chen, P. Cheng, H. Ling, S. Wang, P. Liang, J. Li, S. Xiao, J. Wei, L. Liu, B. J. Cowling, M. Kang, Probable airborne transmission of SARS-CoV-2 in a poorly ventilated restaurant, Building and Environment 196 (2021) 107788. doi:10.1016/J.BUILDENV.2021.107788.
- [5] B. Blocken, T. van Druenen, A. Ricci, L. Kang, T. van Hooff, P. Qin, L. Xia, C. A. Ruiz, J. H. Arts, J. F. Diepens, G. A. Maas, S. G. Gillmeier, S. B. Vos, A. C. Brombacher, Ventilation and air cleaning to limit aerosol particle concentrations in a gym during the COVID-19 pandemic, Building and Environment 193 (2021) 107659. doi:10.1016/J.BUILDENV.2021.107659.
- [6] N. Agarwal, C. S. Meena, B. P. Raj, L. Saini, A. Kumar, N. Gopalakrishnan, A. Kumar, N. B. Balam, T. Alam, N. R. Kapoor, V. Aggarwal, Indoor air quality improvement in COVID-19 pandemic: Review, Sustainable Cities and Society 70 (2021) 102942. doi:10.1016/J.SCS.2021.102942.
- [7] K. Azuma, U. Yanagi, N. Kagi, H. Kim, M. Ogata, M. Hayashi, Environmental factors involved in SARS-CoV-2 transmission: effect and role of indoor environmental quality in the strategy for COVID-19 infection control, Environmental Health and Preventive Medicine 2020 25:1 25 (1) (2020) 1–16. doi:10.1186/S12199-020-00904-2.
- [8] W. Valladares, M. Galindo, J. Gutiérrez, W. C. Wu, K. K. Liao, J. C. Liao, K. C. Lu, C. C. Wang, Energy optimization associated with thermal comfort and indoor air control via a deep reinforcement learning algorithm, Building and Environment 155 (2019) 105–117. doi:10.1016/J.BUILDENV.2019.03.038.
-
[9]
ASHRAE,
Standards
62.1 & 62.2 (2021).
URL https://www.ashrae.org/technical-resources/bookstore/standards-62-1-62-2 - [10] N. CJ, B. CB, S. PA, K. KG, Modelling the transmission of airborne infections in enclosed spaces, Epidemiology and infection 134 (5) (2006) 1082–1091. doi:10.1017/S0950268806005875.
- [11] M. L, A. J, B. W, B. PM, B. A, B. G, C. J, D. SJ, F. A, F. F, G. T, H. C, H. J, I. C, J. JL, K. J, L. Y, L. M, M. G, M. LC, M. L, M. AK, M. S, M. DK, N. W, N. PV, N. C, P. J, P. K, Q. X, S. C, S. O, T. SI, T. JW, T. R, T. KW, W. P, W. A, Y. M, A paradigm shift to combat indoor respiratory infection, Science (New York, N.Y.) 372 (6543) (2021) 689–691. doi:10.1126/SCIENCE.ABG2025.
- [12] A. K. Melikov, COVID-19: Reduction of airborne transmission needs paradigm shift in ventilation, Building and Environment 186 (2020) 107336. doi:10.1016/J.BUILDENV.2020.107336.
- [13] B. P. P. Barbosa, N. de Carvalho Lobo Brum, Ventilation mode performance against airborne respiratory infections in small office spaces: limits and rational improvements for Covid-19, Journal of the Brazilian Society of Mechanical Sciences and Engineering 43 (6) (jun 2021). doi:10.1007/S40430-021-03029-X.
- [14] ECDC - European Center for Disease Prevention and Control, Heating, ventilation and air-conditioning systems in the context of COVID-19: first update Changes to the current update (2020).
- [15] WHO - World Health Organization, Roadmap to improve and ensure good indoor ventilation in the context of COVID-19 (2021) 38.
- [16] Z. Peng, J. L. Jimenez, Exhaled CO2 as COVID-19 infection risk proxy for different indoor 1 environments and activities 2 3, medRxiv (2020). doi:10.1101/2020.09.09.20191676.
- [17] L. M. Candanedo, V. Feldheim, Accurate occupancy detection of an office room from light, temperature, humidity and CO2 measurements using statistical learning models New Energy Efficient Demonstration for Buildings-NEED4B View project Accurate occupancy detection of an office room fro, Energy and Buildings 112 (2016) 28–39. doi:10.1016/j.enbuild.2015.11.071.
-
[18]
Vicomtech, archABM - Agent based
simulation for architectural spaces (2021).
URL https://pypi.org/project/archABM/ -
[19]
Vicomtech, archABM code
repository (2021).
URL https://github.com/Vicomtech/ArchABM/ -
[20]
I. Martinez, J. L. Bruse, A. M. Florez, I. G. Olaizola,
Building air quality
and pandemic risk simulation 1 (Jul. 2021).
doi:10.17632/cx3byrjx7b.1.
URL https://data.mendeley.com/datasets/cx3byrjx7b/1 - [21] P. J. Giabbanelli, S. A. Gray, P. Aminpour, Combining fuzzy cognitive maps with agent-based modeling: Frameworks and pitfalls of a powerful hybrid modeling approach to understand human-environment interactions, Environmental Modelling and Software 95 (2017) 320–325. doi:10.1016/j.envsoft.2017.06.040.
- [22] S. L. Chang, N. Harding, C. Zachreson, O. M. Cliff, M. Prokopenko, Modelling transmission and control of the COVID-19 pandemic in Australia, Nature Communications 11 (1) (dec 2020). arXiv:2003.10218, doi:10.1038/s41467-020-19393-6.
- [23] A. Kirpich, V. Koniukhovskii, V. Shvartc, P. Skums, T. A. Weppelmann, E. Imyanitov, S. Semyonov, K. Barsukov, Y. Gankin, Development of an interactive, agent-based local stochastic model of COVID-19 transmission and evaluation of mitigation strategies illustrated for the state of Massachusetts, USA, PLOS ONE 16 (2) (2021) e0247182. doi:10.1371/journal.pone.0247182.
- [24] H. Inoue, Y. Todo, The propagation of economic impacts through supply chains: The case of a mega-city lockdown to prevent the spread of COVID-19, PLOS ONE 15 (9) (2020) e0239251. doi:10.1371/journal.pone.0239251.
- [25] P. L. Silva, P. V. Batista, H. S. Lima, M. A. Alves, F. G. Guimaraes, R. C. Silva, COVID-ABS: An agent-based model of COVID-19 epidemic to simulate health and economic effects of social distancing interventions, Chaos, Solitons and Fractals 139 (2020) 110088. doi:10.1016/j.chaos.2020.110088.
- [26] M. D’Orazio, G. Bernardini, E. Quagliarini, How to restart? An agent-based simulation model towards the definition of strategies for COVID-19 ”second phase” in public buildings (apr 2020). arXiv:2004.12927.
- [27] D. Simeone, A. Fioravanti, U. M. Coraglia, S. Cursi, A simulation model for building use re-thinking after the COVID-19 emergency.
- [28] F. Ying, N. O’Clery, Modelling COVID-19 transmission in supermarkets using an agent-based model, PLoS ONE 16 (4 April) (2021) e0249821. arXiv:2010.07868, doi:10.1371/journal.pone.0249821.
- [29] E. Ronchi, R. Lovreglio, EXPOSED: An occupant exposure model for confined spaces to retrofit crowd models during a pandemic, Safety Science 130 (2020) 104834. doi:10.1016/j.ssci.2020.104834.
- [30] P. V. Vezeteu, D. I. Nastac, Simulating the Evolution of Infectious Agents through Human Interaction, 2020 IEEE 26th International Symposium for Design and Technology in Electronic Packaging, SIITME 2020 - Conference Proceedings (2020) 43–46doi:10.1109/SIITME50350.2020.9292169.
- [31] T. Yeung Cho, R. Bardhan, M. Jiayu Pan, M. B. Tze Yeung Cho, Redesigning the working space for social distancing: Modelling the movement in an open-plan office, CIBSE Technical Symposium (2021) 13–14.
- [32] Q. Xu, M. Chraibi, On the Effectiveness of the Measures in Supermarkets for Reducing Contact among Customers during COVID-19 Period, Sustainability 2020, Vol. 12, Page 9385 12 (22) (2020) 9385. doi:10.3390/SU12229385.
- [33] T. Antczak, B. Skorupa, M. Szurlej, R. Weron, J. Zabawa, Simulation Modeling of Epidemic Risk in Supermarkets: Investigating the Impact of Social Distancing and Checkout Zone Design (2021) 26–33doi:10.1007/978-3-030-77961-0_3.
- [34] T. S. Farthing, C. Lanzas, When can we stop wearing masks? Agent-based modeling to identify when vaccine coverage makes nonpharmaceutical interventions for reducing SARS-CoV-2 infections redundant in indoor gatherings, medRxiv (apr 2021). doi:10.1101/2021.04.19.21255737.
- [35] T. Altamimi, H. Khalil, V. S. Rajus, R. Carriere, G. Wainer, Cell-DEVS models with BIM integration for airborne transmission of COVID-19 indoors (2021).
- [36] R. Zafarnejad, P. M. Griffin, Assessing school-based policy actions for COVID-19: An agent-based analysis of incremental infection risk, Computers in Biology and Medicine 134 (2021) 104518. doi:10.1016/J.COMPBIOMED.2021.104518.
- [37] E. Azar, C. Menassa, Agent-Based Modeling of Occupants and Their Impact on Energy Use in Commercial Buildings, Journal of Computing in Civil Engineering 26 (2012) 506–518. doi:10.1061/(ASCE)CP.1943-5487.0000158.
- [38] S. Papadopoulos, E. Azar, Integrating building performance simulation in agent-based modeling using regression surrogate models: A novel human-in-the-loop energy modeling approach, Energy and Buildings 128 (2016) 214–223. doi:10.1016/J.ENBUILD.2016.06.079.
- [39] M. Jia, R. S. Srinivasan, R. Ries, N. Weyer, G. Bharathy, A systematic development and validation approach to a novel agent-based modeling of occupant behaviors in commercial buildings, Energy and Buildings 199 (2019) 352–367. doi:10.1016/J.ENBUILD.2019.07.009.
- [40] M. N. Uddin, Q. Wang, H. H. Wei, H. L. Chi, M. Ni, Building information modeling (BIM), System dynamics (SD), and Agent-based modeling (ABM): Towards an integrated approach, Ain Shams Engineering Journal (may 2021). doi:10.1016/J.ASEJ.2021.04.015.
- [41] M. Moglia, S. Cook, J. McGregor, A review of Agent-Based Modelling of technology diffusion with special reference to residential energy efficiency, Sustainable Cities and Society 31 (2017) 173–182. doi:10.1016/J.SCS.2017.03.006.
- [42] G. Van Rossum, F. L. Drake, Python 3 Reference Manual, CreateSpace, Scotts Valley, CA, 2009.
- [43] N. Matloff, Introduction to discrete-event simulation and the simpy language, Davis, CA. Dept of Computer Science. University of California at Davis. Retrieved on August 2 (2009) (2008) 1–33.
- [44] M. Z. Bazant, J. W. M. Bush, A guideline to limit indoor airborne transmission of COVID-19, Proceedings of the National Academy of Sciences 118 (17) (2021). doi:10.1073/pnas.2018995118.
- [45] J. Lelieveld, F. Helleis, S. Borrmann, Y. Cheng, F. Drewnick, G. Haug, T. Klimach, J. Sciare, H. Su, U. Pöschl, Model Calculations of Aerosol Transmission and Infection Risk of COVID-19 in Indoor Environments, International Journal of Environmental Research and Public Health 17 (21) (2020) 8114. doi:10.3390/ijerph17218114.
- [46] A. Di Gilio, J. Palmisani, M. Pulimeno, F. Cerino, M. Cacace, A. Miani, G. de Gennaro, CO2 concentration monitoring inside educational buildings as a strategic tool to reduce the risk of Sars-CoV-2 airborne transmission, Environmental Research (2021) 111560doi:10.1016/j.envres.2021.111560.
- [47] Z. Pang, P. Hu, X. Lu, Q. Wang, Z. O’neill, J. M. Walker ’, A Smart CO2-Based Ventilation Control Framework to Minimize the Infection Risk of COVID-19 In Public Buildings (02 2021).
- [48] R. K. Bhagat, M. S. D. Wykes, S. B. Dalziel, P. F. Linden, Effects of ventilation on the indoor spread of COVID-19, Journal of Fluid Mechanics 903 (2020). doi:10.1017/JFM.2020.720.
- [49] R. L. RILEY, C. C. MILLS, F. O’GRADY, L. U. SULTAN, F. WITTSTADT, D. N. SHIVPURI, Infectiousness of air from a tuberculosis ward. Ultraviolet irradiation of infected air: comparative infectiousness of different patients., The American review of respiratory disease 85 (1962) 511–525. doi:10.1016/s0196-6553(97)90057-2.
- [50] S. L. Miller, W. W. Nazaroff, J. L. Jimenez, A. Boerstra, G. Buonanno, S. J. Dancer, J. Kurnitski, L. C. Marr, L. Morawska, C. Noakes, Transmission of SARS‐CoV‐2 by inhalation of respiratory aerosol in the Skagit Valley Chorale superspreading event, Indoor Air 31 (2) (2021) 314–323. doi:10.1111/ina.12751.
-
[51]
Costmodelling - Typical
building costs (2021).
URL https://costmodelling.com/building-costs - [52] R. Seri, D. Secchi, How Many Times Should One Run a Computational Simulation?, 2017, pp. 229–251. doi:10.1007/978-3-319-66948-9_11.
- [53] J. S. Lee, T. Filatova, A. Ligmann-Zielinska, B. Hassani-Mahmooei, F. Stonedahl, I. Lorscheid, A. Voinov, G. Polhill, Z. Sun, D. C. Parker, The complexities of agent-based modeling output analysis, JASSS 18 (4) (oct 2015). doi:10.18564/JASSS.2897.
- [54] D. Secchi, R. Seri, Controlling for false negatives in agent-based models: a review of power analysis in organizational research, Computational and Mathematical Organization Theory 2016 23:1 23 (1) (2016) 94–121. doi:10.1007/S10588-016-9218-0.
-
[55]
R Core Team, R: A Language and Environment
for Statistical Computing, R Foundation for Statistical Computing, Vienna,
Austria (2020).
URL https://www.R-project.org - [56] V. Vuorinen, M. Aarnio, M. Alava, V. Alopaeus, N. Atanasova, M. Auvinen, N. Balasubramanian, H. Bordbar, P. Erästö, R. Grande, N. Hayward, A. Hellsten, S. Hostikka, J. Hokkanen, O. Kaario, A. Karvinen, I. Kivistö, M. Korhonen, R. Kosonen, J. Kuusela, S. Lestinen, E. Laurila, H. J. Nieminen, P. Peltonen, J. Pokki, A. Puisto, P. Råback, H. Salmenjoki, T. Sironen, M. Österberg, Modelling aerosol transport and virus exposure with numerical simulations in relation to SARS-CoV-2 transmission by inhalation indoors, Safety Science 130 (2020) 104866. doi:10.1016/J.SSCI.2020.104866.
- [57] S. Shao, D. Zhou, R. He, J. Li, S. Zou, K. Mallery, S. Kumar, S. Yang, J. Hong, Risk assessment of airborne transmission of COVID-19 by asymptomatic individuals under different practical settings, Journal of Aerosol Science 151 (jan 2021). arXiv:2007.03645, doi:10.1016/j.jaerosci.2020.105661.
- [58] K. Tijani, S. Ploix, B. Haas, J. Dugdale, Q. D. Ngo, Dynamic Bayesian Networks to simulate occupant behaviours in office buildings related to indoor air quality (may 2016). arXiv:1605.05966.
- [59] E. Demirović, P. J. Stuckey, J. Bailey, J. Chan, C. Leckie, K. Ramamohanarao, T. Guns, An investigation into prediction+ optimisation for the knapsack problem, in: International Conference on Integration of Constraint Programming, Artificial Intelligence, and Operations Research, Springer, 2019, pp. 241–257.
- [60] J. C. Thiele, W. Kurth, V. Grimm, Facilitating parameter estimation and sensitivity analysis of agent-based models: A cookbook using NetLogo and R, JASSS 17 (3) (2014) 11. doi:10.18564/JASSS.2503.
Appendix A Estimating number of simulations with coefficient of variation