7Be in the outburst of the ONe nova V6595 Sgr
Abstract
We report the search for 7Be ii isotope in the outbursts of the classical nova V6595 Sgr by means of high resolution UVES observations taken at the ESO VLT in April 2021, about two weeks after discovery and under difficult circumstances due to the pandemic. Narrow absorption components with velocities at -2620 and -2820 km s-1, superposed on broader and shallow absorption, are observed in the outburst spectra for the 7Be ii 313.0583, 313.1228 nm doublet resonance lines, as well as in several other elements such as Ca ii, Fe i, Mg i, Na i, H i but Li i. Using Ca ii K line as a reference element, we infer 7.4 , or 9.8 when the 7Be decay is taken into account. The 7Be abundance is about half of the value most frequently measured in novae. The possible presence of over-ionization in the layers where 7Be ii is detected is also discussed. Observations taken at the Telescopio Nazionale Galileo (TNG) in La Palma 91 days after discovery showed prominent emission lines of Oxygen and Neon which allow to classify the nova as ONe type. Therefore, although 7Be is expected to be higher in CO novae, it is found at comparable levels in both nova types.
keywords:
stars: individual: V6595 Sgr; stars: novae – nucleosynthesis, abundances; Galaxy: evolution – abundances1 Introduction
Classical Novae (CNe) are recurring thermonuclear explosions in binary-star systems formed by a white dwarf (WD) accreting matter from a main sequence or evolved companion (Bode & Evans, 2012; Della Valle & Izzo, 2020). The layer of accreted material grows in mass until the pressure at its bottom becomes sufficiently high ( dyne/cm2) for the beginning of nuclear ignition of the p-p chain. Since the bottom of the accreted layer is electron degenerate, nuclear burning increases the temperature without expansion that would inhibit further nuclear reactions. When the temperature becomes sufficiently high ( K), the energy source shifts to the CNO cycle and both temperature and energy release increase at a much faster rate. When pressure and temperature at the bottom of the accreted layer exceed the degeneracy values, thermonuclear reactions (TNR) ignite removing degeneracy and causing ejection of matter into the interstellar medium (Gallagher & Starrfield, 1978). The subsequent expansion of the hot envelope at velocities of the order of 500-3000 km s-1 is responsible for the initial brightness of the nova, which can reach an absolute magnitude of mag (Selvelli & Gilmozzi, 2019).
Synthesis of lithium in novae explosions was first predicted in the 1970s (Arnould & Norgaard, 1975; Starrfield et al., 1978). Lithium is created in the thermonuclear runaway via the reaction 3He(,)7Be with 7Be decaying to 7Li via electron capture (half-life 53.22 days). The production proceeds through the so-called Cameron-Fowler mechanism (Cameron, 1955; Cameron & Fowler, 1971) where 7Be has to be transported to cooler zones than where it is formed, with a time-scale shorter that its electron capture time, and therefore preserved from destruction.
The suggestion which dates back to the 70’s was thwarted by the non detection of 7Li in a bunch of novae (Friedjung, 1979). After decades of observational failures to detect the Li i670.8 nm line, the parent nucleus 7Be was detected in classical novae (Tajitsu et al., 2015, 2016; Molaro et al., 2016; Izzo et al., 2018; Molaro et al., 2020; Arai et al., 2021), thanks to high-resolution spectrographs capable to reach the atmospheric cut-off. Following these detections, a search in high dispersion spectra of historical novae in the archival database of the space-based International Ultraviolet Explorer (IUE) led to the identification of the 7Be II resonance line in nova V838 Her, which had been overlooked (Selvelli et al., 2018). The possible presence of 7Li 670.8 nm resonance line in nova V1369 Cen (Izzo et al., 2015) was also reported. The detection of the short-lived 7Be in the spectra of novae shortly after outburst implies that this isotope is freshly created in the thermonuclear runaway (TNR) processes of the nova event. 7Be decays with capture of an internal K-electron and ends into an ionized lithium, whose ground-state transitions are not observable in the optical range, thus explaining the general non-detection of neutral 7Li (Molaro et al., 2016). The decay of 7Be into an excited state of 7Li produces a high-energy line at 478 keV emitted during the de-excitation to the ground state of the fresh 7Li produced in the 7Be electron-capture (Clayton, 1981; Gomez-Gomar et al., 1998). Several unsuccessful attempts to detect the line with Gamma ray satellites have been performed (Harris et al., 2001). The detection of the radioactive 7Be nuclei in the nova outburst reopened the possibility of detecting the 478 Kev line with INTEGRAL for nearby novae. The distance should be lower than 0.5 kpc, though the horizon would depend on the amount of 7Be produced in the nova event (Jean et al., 2000; Siegert et al., 2018; Siegert et al., 2021). We note that the detection of the 478 keV line from a nova with known distance will allow us to derive an accurate 7Be abundance.
The astrophysical origin of lithium represents a major open question in modern astrophysics (Fields, 2011). The abundance of lithium observed in halo and metal-rich disk stars is much lower and higher, respectively, than the primordial value estimated from Big Bang nucleosynthesis once the baryonic density from CMB or deuterium abundance is adopted. This implies the existence of efficient lithium sinks and factories which are both still unknown. For the latter, many astrophysical sources can actively produce lithium such as AGB stars (Romano et al., 2001), red giants (Wallerstein & Sneden, 1982), classical novae (Starrfield et al., 1978) or spallation processes (Davids et al., 1970). Early Galactic chemical evolution models of 7Li revealed that classical novae show the required time scales, but lithium nova yields were theoretically derived and not supported by observations at that time (D’Antona & Matteucci, 1991; Romano et al., 1999, 2001). The recent measured yields imply massive 7Be ejecta with the final 7Li product at about four orders of magnitude above meteoritic abundance and novae are very likely the major Li sources in the Galaxy (Molaro et al., 2016; Cescutti & Molaro, 2019; Romano et al., 2021).
A major problem is that the measured abundances exceed what foreseen by current nova nucleosynthesis models (Hernanz et al., 1996; José & Hernanz, 1998), and it seems that 7Be is present in both fast and slow novae, with comparable abundances. Controversy arises about the maximum amount of 7Be ii that can be produced in novae (see e.g. Denissenkov et al., 2021, and discussions in Starrfield et al., 2020) but it remains well below what derived from observations. Chugai & Kudryashov (2020) suggested that the presence of an over-ionization in the expanding shell of V5668 Sgr, where 7Be is observed, could reduce substantially the abundance of derived 7Be.
Following the recent detection of 7Be ii in the outburst spectra of Classical Novae, we started an observing program at ESO to target 7Be in novae which at maximum reach magnitude V 9 mag. We report here on the observations of V6595 Sgr by means of the high resolution UVES spectrograph (Dekker et al., 2000) at the Very Large Telescope (VLT).
| Property | Value |
|---|---|
| Discovery | 2021 April 04.825 UT |
| RA (J2000) | 17 58 16.7 |
| Dec (J2000) | -29 14 49.0 |
| Epoch max. | 2021 April 06.2 UT |
| gmax | 8.69 mag |
| t2 | 8.9 days |
| t3 | 15.3 days |
| 0.65 mag | |
| 9.49 0.40 mag | |
| 8.6 0.9 kpc |
2 V6595 Sgr
V6595 Sgr, originally reported as PNV J17581670-2914490111http://tamkin1.eps.harvard.edu/unconf/followups/J17581670-2914490.html, was discovered on 2021 April 04.825 UT by Andrew Pearce at 8.4 mag. The nova was classified as a classical nova by Taguchi et al. (2021) and confirmed in follow-up spectra by Aydi
et al. (2021). The ASAS-SN (Kochanek
et al., 2017) light curve of V6595 Sgr is displayed in Fig 1. The photometry shows that the nova is a very fast one, according to the historical classification by Gaposchkin (1957): it reached optical peak on 2021 April 06.2, i.e. 1.4 days after its discovery, and faded by two magnitudes in 8.9 days. At the position reported in Ferreira
et al. (2021), there is a single source in the GAIA EDR3 catalog (Gaia
Collaboration et al., 2021), namely GAIA 4062339124163281920. The GAIA magnitude is = 18.18 mag, suggesting an amplitude of the outburst of = 9.49 0.40 mag, with the uncertainty related to the different photometric systems used in GAIA and ASAS-SN surveys222see e.g. the GAIA DR documentation release at the link: https://gea.esac.esa.int/archive/documentation/GDR2/Data_processing/
chap_cu5pho/sec_cu5pho_calibr/ssec_cu5pho_PhotTransf.html. No parallax is reported for this source in the DR3. Given the observed magnitude at peak of = 7.6 mag (see Fig. 1), the reddening = 2.01 mag, and the decay time of = 8.9 days, we can derive the absolute magnitude at the peak using the recent formulation of the maximum-magnitude and rate-decay (MMRD) relation given in Della Valle &
Izzo (2020): we obtain = -9.08 0.22 mag, resulting in a nova distance of = 8.6 0.9 kpc. The estimate from the MMRD relation is in good agreement
with that estimated from the geometric distance
(= -8.89 0.7) and photogeometric distance ( = -9.03 0.8) (Bailer-Jones
et al., 2021). The basic data for the V6595 Sgr are summarized in Tab. 1.
In early spectra of V6595 Sgr Aydi et al. (2021) noted P-Cygni profiles and emission lines of low contrast relative to the continuum but with exceptional breadth. The Na i D interstellar absorption shows multiple components at velocities from 0 up to -215 km s-1, suggesting high extinction towards the line of sight. From Diffuse Interstellar Bands, Aydi et al. (2021) derived a colour excess = 0.65 mag, and = 2 mag when assuming the standard Galactic extinction law = 3.1. They also found this consistent with the reddening estimated from the Galactic reddening maps. Observation taken few days later by Bayless et al. (2021) revealed strong emission lines, while the P-Cygni absorption mostly disappeared. They also noted that the emission lines were exceptionally broad with FWHM of 3500 km s-1or greater. Fe II features were still present along with C I, N I, and O I. The N I lines are unusually strong relative to C I, which together with the presence of He I, indicate a rapid spectral evolution.
No X-ray emission has been detected by Swift/XRT on 2021 April 5.86 (Sokolovsky et al., 2021). McCollum & Laine (2021) performed SED fitting of the available photometry for the progenitor object and with a set of model atmospheres found the best fit for Teff = 3750 150 K, and log g = 3.5 0.3. The value of obtained from their best fit analysis is 1.26 0.22 mag. In the following, we will use this value to correct our spectral dataset for Galactic extinction.
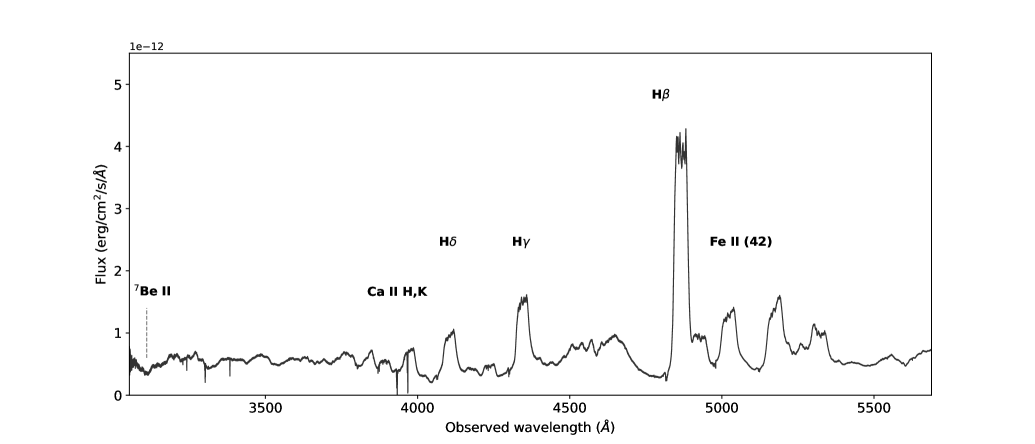
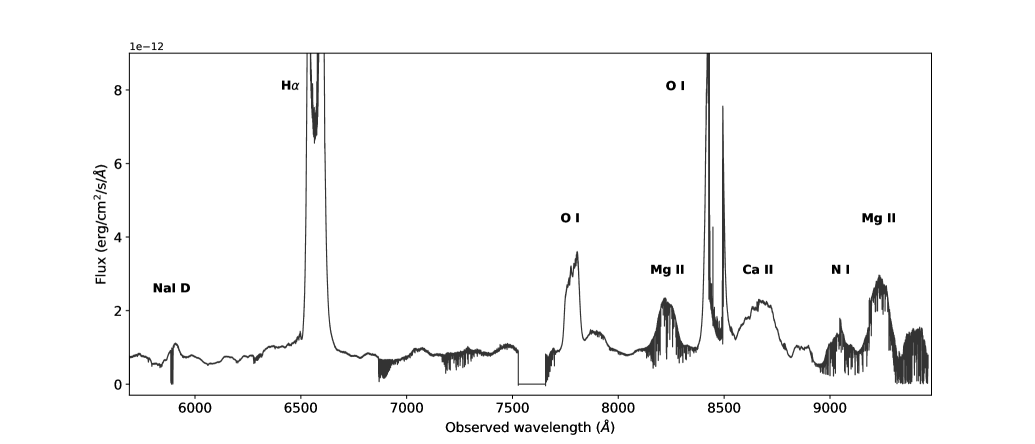
Three spectra for V6595 Sgr were obtained at VLT/UVES following the peak brightness as soon as possible due to the critical pandemic circumstances. The UVES settings used were DIC1 346-564, with ranges 305-388 nm in the blue and 460-665 nm in the red, and DIC2 437-760 with ranges 360-480 nm in the blue, and 600-800 nm in the red. The journal of the observations for the nova is provided in Table 2. The nominal resolving power of the first two epochs was of for the blue arm and for the red arm. In the third observation the slit was set to 1.2 arcsec and the pixels were binned two by two to cope with the nova fading, degrading by about half the previous resolution. Overlapping spectra were combined for each epoch to maximise the signal-to-noise ratio. In Fig. 2, we show the spectrum of V6595 Sgr obtained at VLT/UVES on 2021 April 16.
| Date | Time | B,R slit | Bin | 346 nm | 437 nm | 564 nm | 760 nm |
|---|---|---|---|---|---|---|---|
| arcsec | pix | sec | sec | sec | sec | ||
| 2021-04-14 | 7:12 | 0.4, 0.3 | 1x1 | 60 | 60 | ||
| 2021-04-14 | 7:25 | 0.4, 0.3 | 1x1 | 300 | 60 | ||
| 2021-04-16 | 8:04 | 1.2, 1.2 | 1x1 | 700 | 700 | ||
| 2021-04-16 | 8:44 | 1.2, 1.2 | 1x1 | 2310 | 2310 | ||
| 2021-04-19 | 7:21 | 1.2, 1.2 | 2x2 | 900 | 900 | ||
| 2021-04-19 | 6:11 | 1.2, 1.2 | 2x2 | 3600 | 3600 |
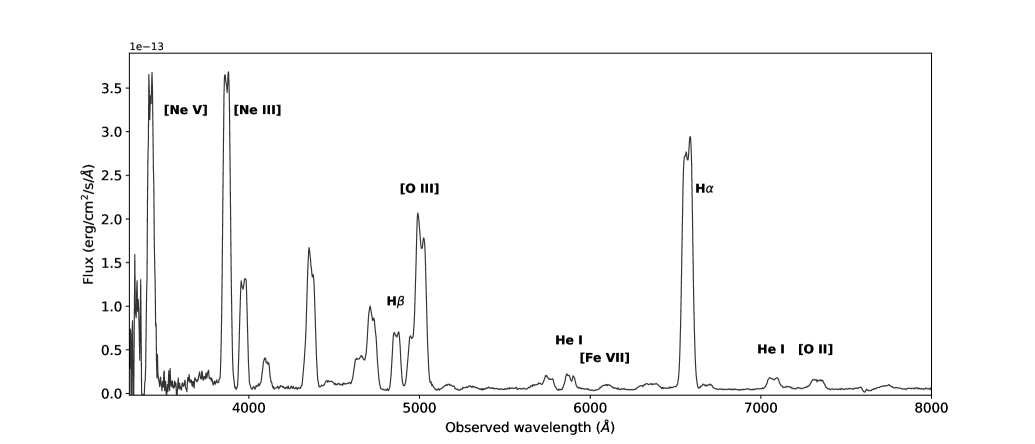
A spectrum of V6595 Sgr was also obtained on July 4, 2021, 91 days after discovery, by using the 3.6m Telescopio Nazionale Galileo (TNG) equipped with the Device Optimized for the LOw RESolution (DOLORES) instrument in low-resolution spectroscopy mode. Multiple exposures were obtained using the LR-B grism to optimize the signal-to-noise at wavelengths lower than 400 nm, and to avoid possible saturation of bright emission lines. The stacked spectrum covers the wavelength region between 330 and 800 nm and is shown in Fig. 3. The spectrum shows typical emission lines observed in the nebular phase of classical novae such as [O iii], [O ii] and [N ii] (Della Valle & Izzo, 2020). In particular, we identified bright forbidden [Ne iii] and [Ne v] lines, with [Ne iii] 386.9 nm being the most bright line in the spectrum, see Fig. 3. This suggests an over abundance of Neon in the ejecta, which implies that V6595 is a ONe nova type (Williams et al., 1991). We also note the presence of relatively faint high-ionization iron forbidden lines which are commonly observed during the super-soft phase of classical novae (Ness et al., 2007; Schwarz et al., 2011).
3 7Be Detection & abundance
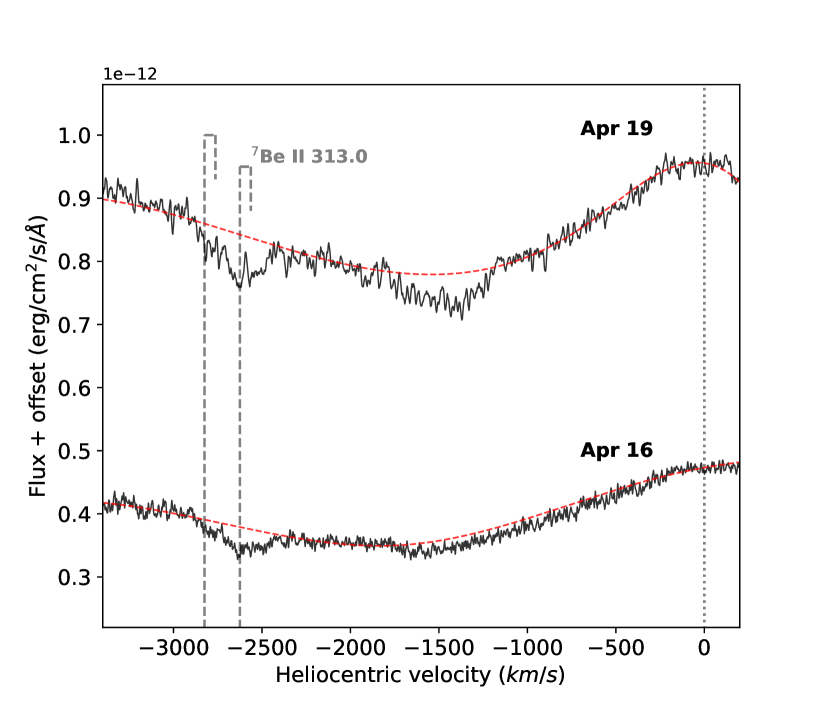
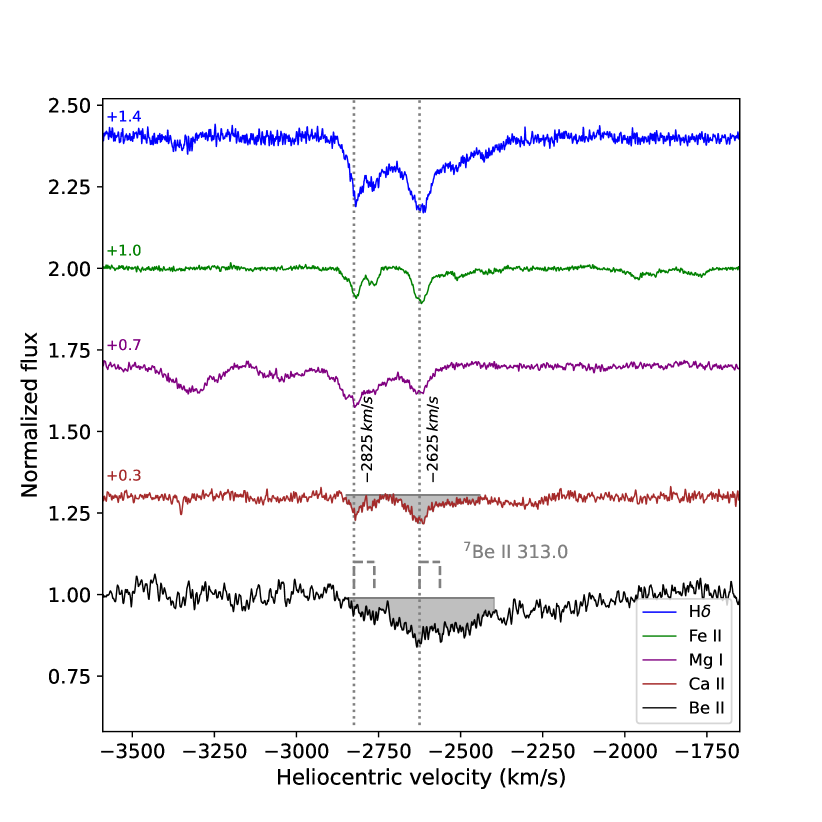
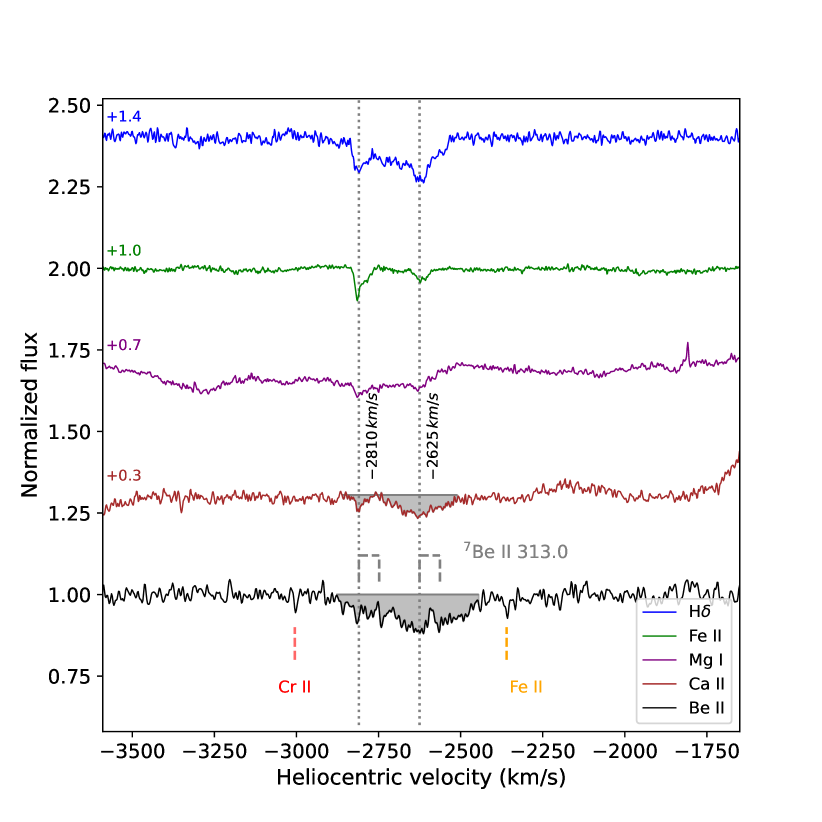
The three UVES spectra covering the Beryllium region in the three epochs are shown in Fig. 4. The outburst spectra show absorption in a range of radial velocities spanning from -2000 to -3000 km s-1. Fig. 5 and 6 show the 7Be spectra of 16 and 19 April, respectively, along with the portions with the Ca ii K, and H lines on a common velocity scale and normalized with a local continuum around the highlighted features. H is representative of the absorption seen in all members of the Balmer Series. The Ca ii H cannot be used since it is contaminated with Hϵ and for this nova its high velocity components are blended with the Galactic interstellar components of Ca ii K. The appearance of the absorption is clear in all three elements. Superposed to a relatively shallow absorption there are small but narrower structures at velocities of -2630 and -2815 km s-1whose positions are marked on the figure. In all three spectra there is a hint of features which could be possibly ascribed to other lines of the 7Be ii doublet at a separation of 62 km s-1. We preferred not to average the 3 spectra since, although taken rather close in time, a small velocity drift of the components is always possible. The narrow features are hidden in the noise, but their presence in all the three spectra make us confident they are real. We can also detect very weak lines of Cr ii 312.870 nm and Fe ii 313.536 nm at -2810 km s-1. Since these weak lines are the strongest lines in the multiplets they show that the contamination in the region is minimal and both Cr ii and Fe ii cannot be responsible for the observed absorption. It is also possible that the absorption could be in the form of a P-Cygni with an 7Be emission centered at rest wavelength and a large absorption shortwards. An emission in 7Be ii has been detected in the oxygen poor Nova V838 Her by Selvelli et al. (2018). However, here we focus on the absorption for which there is correspondence with other elements.
Relatively weak components make the detection more problematic but provide more reliable abundance estimation since saturation effects can be ignored. Shore & De Gennaro Aquino (2020) showed that with high abundances the 7Be ii lines are strongly saturated and cannot be used. The 7Be abundance are generally estimated taking Ca, which is not a nova product, as reference. Mg ii, if available, could also be used for novae of the ONeMg type (Casanova et al., 2016).
We do not detect doubly ionized ions, whose transitions are generally characterized by higher ionization potentials. On the other hand we see the presence of neutral species such as Mg i 383.8, 383.2, 379.8 e 379.6 nm. Therefore we assume that singly ionized ions of Ca ii and 7Be ii are representing the main ionization stage in the expanding shell. This assumption has been criticised by Chugai & Kudryashov (2020) in the nova V5668 Sgr and will be addressed in detail in the next section.
Since we cannot resolve the 7Be ii doublet for the shallow absorption we consider the equivalent width (EW) of the sum of the 7Be ii doublet and compare it with the Ca ii K line at 393.366 nm (Tajitsu et al., 2015; Molaro et al., 2016). We have
| (1) |
where of -0.178 and -0.479 for the 7Be ii doublet, and +0.135 for that of Ca ii K line are adopted. The equivalent width of the whole region spanned by the 7Be ii components as measured in the spectrum of 16 April is of 274 15 mÅ with the main uncertainty coming from the continuum placement. The equivalent width of the Ca ii 393.3 nm line is of 189 8 mÅ providing a ratio of EW(7Be ii)/EW(Ca ii) 1.45 0.15. The same components as measured in the spectrum of 19 April are of 279 13 mÅ and 165 7 mÅ providing a ratio of 1.69 0.15. We therefore adopt an average ratio of 1.57 . Using Eq. 1, we obtain N(7Be ii)/N(Ca ii) = 3.4 . Since 7Be is unstable with a half life time decay of 53.22 days, at the epoch of our measurement, 15 days from discovery, the abundance had reduced by a factor of 0.745. The solar abundance of calcium is N(Ca)/N(H) = 2.19 (Lodders, 2019). As a consequence, we obtain an abundance of N(7Be)/N(H) = 9.8 . Should Calcium abundance be different from solar, the final N(7Be) /N(H) would change accordingly. For instance, by extrapolating the Galactic metalliciy gradient of Lemasle et al. (2018) towards the Galactic Center we should expect a metallicity of [Ca/H] +0.3, which would imply N(7Be)/N(H) = 2.0 , namely a factor 2 higher than what reported in Table 4.
3.1 Lithium
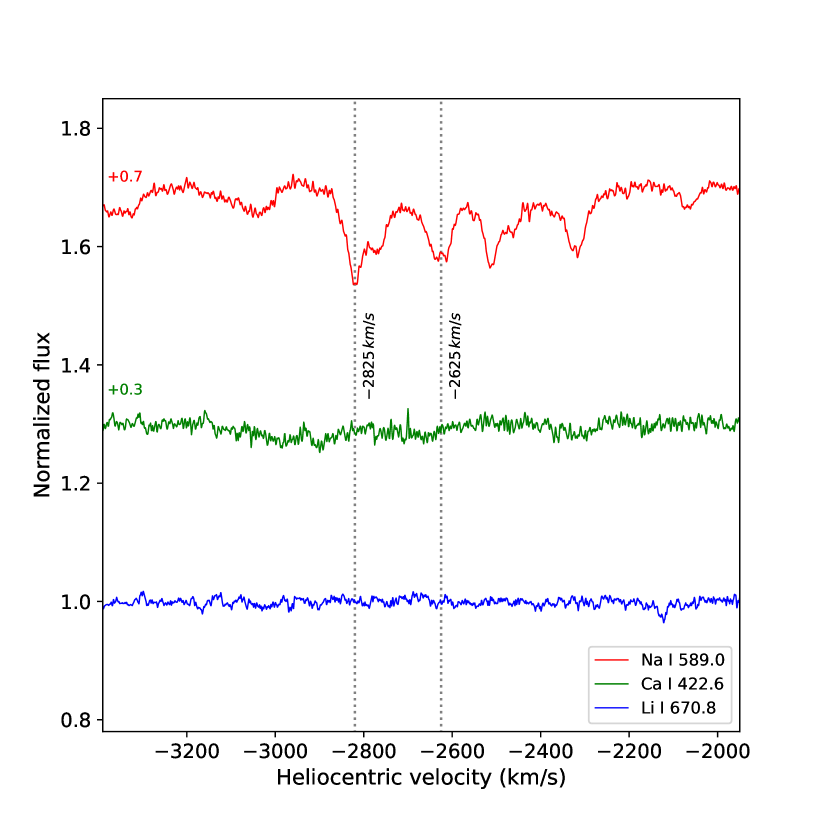
In Fig. 7 the spectrum of 16 April is shown in the region of 7Li i 670.8 nm together with the D2 line of Na i 589.0 nm and Ca i 422.6 nm. Absorptions are detected in correspondence of the D2 and D1 lines with expasion velocities of -2625 and -2825 km s-1but not in correspondence of the Ca i and Li i lines. The same is found for the spectra of the other two epochs of 14 and 19 April. Thus, there is no evidence of the resonance 7Li i doublet at 670.8 nm in the spectra of V 6596 Sgr as in most of the novae. So far 7Li i has been detected only in V1369 (Izzo et al., 2015) and, as a trace element, in a very early epoch of V906 Car (Molaro et al., 2020). The detection in V1369 was determined on days 7 and 13 when only a small amount of 7Be had decayed into 7Li and implies that the TNR started much earlier than the explosion (Izzo et al., 2015). A claim for a Li detection was made by Della Valle et al. (2002) in V382 Vel but Shore et al. (2003) suggested that the feature could be neutral nitrogen. The general absence of neutral 7Li on a time scale longer than the 7Be decay can be explained if 7Be decays through the capture of an internal K-electron. In this case the end product is an ionized lithium with transition lines in the X-ray (Molaro et al., 2016).
and Fe ii 313.536 nm can be identified in the spectrum.
4 Discussion
4.1 Over-ionization?
The Be ii abundances measured in the novae where it has been detected so far are high, see Table 4, and in particular are higher than what the nova models predict. Recent reappraisal of the theoretical 7Be maximum which can be synthesized in novae is of X(7Be)/X(H) 2 as mass fraction , or N(7Be)/N(H) in atomic fraction, for CO and relatively massive white dwarfs (Starrfield et al., 2020; Denissenkov et al., 2021; Chugai & Kudryashov, 2020). 7Be abundances are generally derived assuming 7Be ii and Ca ii are both in their dominant ionization stage. Chugai & Kudryashov (2020) suggested that the disagreement between theoretical predictions and observations could be resolved if significant over-ionization is present in the expanding components. Since the ionisation potential of Be ii and Ca ii are 18.21 and 11.87 eV, respectively, the radiation from a hot photosphere could over-ionize Ca ii and reduce the 7Be abundance derived from observations.
In nova V838 Her Selvelli et al. (2018) obtained the 7Be abundance by using Mg ii as a reference element. Mg has a second ionisation potential of 15 eV which is closer to Be ii than Ca ii and the two ions should behave similarly. They obtained N(7Be)/N(H) , a value which is similar to the value measured in the other novae where Ca ii was used and listed in Table 4. Selvelli et al. (2018) also derived consistent abundances by using He i and H i emission lines. A consistency which would not be expected in the presence of significant over-ionization.
Chugai & Kudryashov (2020) analysed in detail the case of Nova V5668 Sgr studied by Molaro et al. (2016) and Tajitsu et al. (2016), and concentrate on the component at velocity -1175 km s-1 shown at day 58. No doubly ionized states of Fe-peak elements with second ionization potentials intermediate those of 7Be (18.21 eV) and Ca ii (11.87 eV) are observed in correspondence of this high velocity component of nova V5668 Sgr (Molaro et al., 2016; Tajitsu et al., 2016). This was one major justification used in Tajitsu et al. (2015); Molaro et al. (2016) to consider 7Be and Ca ii in the main ionization state in V5668. On the other hand, hints of the neutral species of Ca i and Na i, see Fig 7 of Molaro et al. (2016), are reported. For any combination of physical parameters it is not possible to have Ca iii and Ca i in the same slab of material.
Chugai & Kudryashov (2020) argue for the presence of partial covering and of multiple components. However, they obtain a Be ii/Ca ii ratio of 36.6 which is close to the value of 31.9 derived by Molaro et al. (2016) for this component. We note that the measured Be ii/Ca ii= 31.9 implies a X(7Be)/X(H) mass fraction of 1.2 and not of 9 as reported by Chugai & Kudryashov (2020). Thus, a correction of two orders of magnitude is required to reconcile these abundances with the theoretical 7Be production. The pseudo photosphere of the nova in the Chugai & Kudryashov (2020)’s model is approximated with a black body with a temperature of 15000 K, and a radius of 1012 cm, for a total luminosity of 3.6 1037 erg/sec. The high velocity component showing 7Be ii is located at a distance of 6x1014 cm which is the distance reached after 58 days when moving with a velocity of vexp= -1175 km s-1, and it has a thickness which is 10 of its radius. Chugai & Kudryashov (2020) assume a mass of 10-5 M⊙ for this component which with the assumed volume results into a gas density of = 7.6 cm-3. This shell feels the radiation coming from the nova pseudo-photosphere and Chugai & Kudryashov (2020) estimate a Ca iii/Ca ii 10 in the expanding shell with velocity of -1175 km s-1. This means that the Ca ii is not the main stage and the 7Be abundance previously estimated should be decreased by one order of magnitude.
We have used version 17.03 of the photoionization code Cloudy (Ferland et al., 2017) to probe photoionization conditions within the absorption component. In a first model, Model A, we adopted the same model of Chugai & Kudryashov (2020) with a temperature of the nova photosphere of 15000 K. The results, reported in Table 3, show that Ca ii is indeed much more ionized than Be ii and even for a larger fraction than that estimated by Chugai & Kudryashov (2020). However, the question is whether the model provides a realistic description of nova photosphere and of the expanding shell were 7Be is observed. The gas density in the expanding shell is probably higher than what assumed. Harvey et al. (2018) at day 141 measure an electron density of = 9 cm-3 which is higher than the 7.6 assumed by Chugai & Kudryashov (2020) 80 days earlier. Moreover, the formation of dust requires shielding from the WD’s radiation which is possible if the gas density is greater than = 9-10 cm-3 (Gehrz & Ney, 1987). Gehrz et al. (2018) found evidence that dust condensation in V5668 Sgr commenced 82 days after outburst and estimated an envelope temperature of 1090 K. Muztaba et al. (2020) modeled with Cloudy the spectrum of V5668 Sgr on June 12, 2015, or day 89, with the nova in the dust production phase and matching fairly well the emission spectrum with a temperature for the nova envelope of 6509 K. At day 107 Banerjee et al., 2016 modelled the CO emission line with a temperature of 4000 300 K.
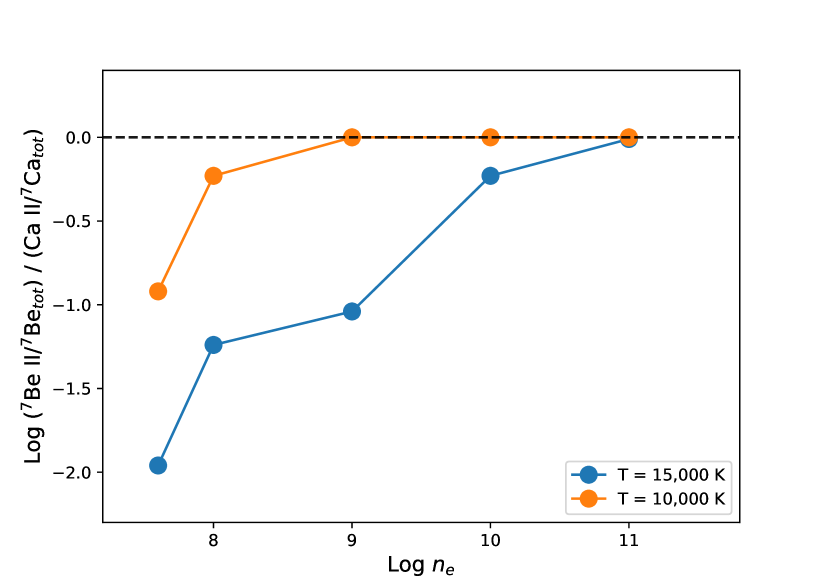
We thus constructed a new model, Model B, with a temperature of T=15000 K for the nova envelope but with a gas density in the clump of = 10 cm-3. The higher density is obtained reducing the thickness of the expanding shell and the filling factor. We have also constructed an intermediate model, Model C, with a black body temperature of 10000 K and a gas density of = 9 cm-3. The mean ionizations for the relevant elements are listed in Table 3, In both models B and C the Ca ii and Be ii are found in their main ionization stages. The relative ionization fractions for 7Be and Ca ii for the two black body temperatures for a wider range of gas densities are shown in Fig. 8. Thus, overionization is possible only for very low gas densities and rather hot pseudo-photosphere.
We emphasize that measured 7Be abundances in V5668 Sgr obtained in components with different expanding velocities and also at different epochs show a consistency (Molaro et al., 2016). For instance, at day 58 the component with vexp =-1175 km s-1 shows Be ii/Ca ii= 31.9 while the component expanding with a velocity of -1500 km s-1 at day 82 shows Be ii/Ca ii=17.7 . Interestingly, these two ratios become 69 and 53, respectively, when the 7Be decaying factors are considered. We consider quite unlikely that the physical conditions producing over-ionization could remain similar in two shells expanding with different velocities and measured in two epochs separated by a time interval of 24 days.
A satisfactory physical model is presently not available due to the poor understanding of the nova ejecta. However, for the arguments provided here, we consider unlikely that the disagreement between theoretical predictions by nova models and 7Be abundances derived from observations could be ascribed to the presence of over-ionization in the expanding shells.
| El | Model A | Model B | Model C | ||||||||
|---|---|---|---|---|---|---|---|---|---|---|---|
| Ion | I | II | III | I | II | III | I | II | III | ||
| H | -0.71 | -0.09 | | | -0.03 | -1.15 | | | -0.02 | -1.40 | |||
| He | -0.01 | -1.81 | | | 0.00 | -5.18 | | | 0.00 | -9.01 | |||
| Li | -5.21 | 0.00 | | | -3.83 | 0.00 | | | -4.68 | 0.00 | |||
| Be | -4.22 | -0.28 | -0.32 | | | -2.82 | 0.00 | -4.55 | | | -3.30 | 00 | -762 |
| Na | -3.82 | 0.00 | -12.14 | | | -2.54 | 0.00 | -12.50 | | | -3.23 | 0.00 | -19.20 |
| Mg | -4.40 | -0.31 | -0.30 | | | -2.77 | 0.00 | -2.85 | | | -3.45 | 0.00 | -3.11 |
| Ca | -7.82 | -2.24 | 0.00 | | | -4.42 | -0.23 | -0.39 | | | -5.05 | -0.01 | -1.55 |
| Cr | -5.79 | -0.38 | -0.23 | | | -4.14 | 0.00 | -2.41 | | | -4.56 | 0.00 | -3.25 |
| Fe | -5.45 | -0.35 | -0.26 | | | -4.27 | 0.00 | -2.84 | | | -4.47 | 0.00 | -3.64 |
4.2 7Be nova yields
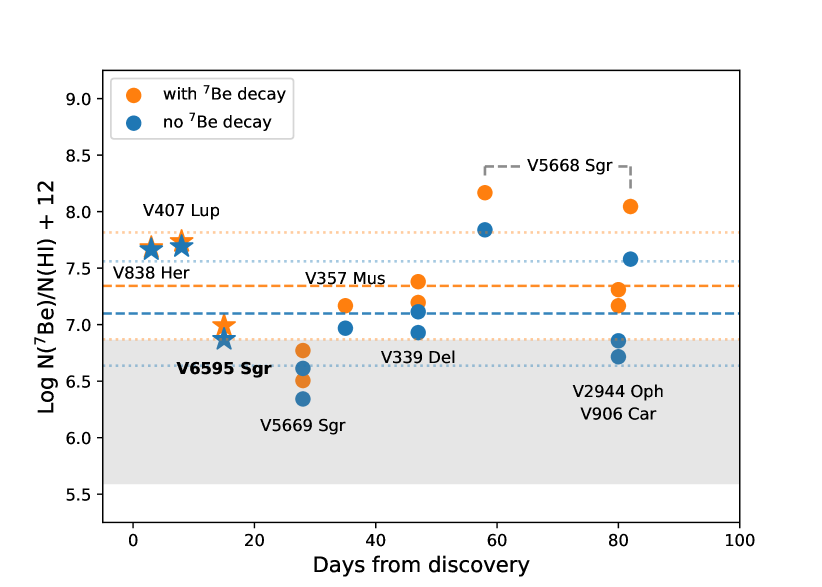
The presence of 7Be in a high velocity component in the outburst spectra of V6595 Sgr adds another object to the small sample of novae where 7Be has been searched and found. The A(7Be) = abundances of these novae are listed in Tab 4 and shown in Fig 9. So far 7Be has been found in all the novae where it has been searched off but V612 Sct which has been suggested could be peculiar (Mason et al., 2020). By means of a low resolution spectrum of V6595 Sgr taken 91 days after the discovery which shows prominent lines of forbidden Ne iii and [Ne v] lines, we classified the nova as of ONe type (Williams et al., 1991). V6595 Sgr is together with V407 Lup a second nova of ONe type where 7Be has been detected. Nova V838 Her is a third one but with some peculiarities being deficient in oxygen (Matheson et al., 1993). The ONe novae show quite different 7Be abundances with V407 Lup being about six times higher than V6595 Sgr. The synthesis of 7Be is believed to occur via 3He()7Be in both types of CO and ONe novae but is expected to be one order of magnitude higher in CO novae due to the different time-scales of the TNR in the two types of novae (José & Hernanz, 1998). The ONe show 7Be abundances which overlap those of the CO novae. While V6595 Sgr shows among the lowest abundance of the sample, V407 Lup is slightly higher and V838 Her is aligned with the mean value of the CO novae. This supports the evidence that the 7Be abundances is uncorrelated from the nova type. We note that in the ONe type the 7Be detection was made in the early phases when the nova pseudo-photosphere is hotter. Thus, overionization is more likely to occur in fast novae, and the 7Be of ONe could be lower than the CO type as expected from the TNR theory.
The nine 7Be measurements show a scatter which exceed the observational errors and is likely real. The mean value is of A(7Be) = 7.34 when7Be decay is taken into account, which is about 4 orders of magnitude over the the meteoritic value (Lodders, 2019). The role of novae as 7Li producers has been considered in a framework of a detailed model of the chemical evolution of the Milky Way (Cescutti & Molaro, 2019; Romano et al., 2021). Cescutti & Molaro (2019) showed that novae account well for the observed increase of Li abundance with metallicity in the Galactic thin disk and also for the relative flatness observed in the thick disk. In fact, the thick disk evolves on a timescale which is shorter than the typical timescale for the production of substantial7Li by novae. Cescutti & Molaro (2019) left the nova yields as a free parameter and found that in order to match the 7Li behaviour with metallicity and the present abundance a 7Li production of 3 per nova event is required. This is consistent with the measured mean yields of 7Li/H of 1.5 in mass, and an average ejecta of 3 . A constant nova rate of 20 yr-1 during the Galactic life with these yields is able to synthesize 600 M, i.e. about 60% of the total 7Li estimated for the whole Galaxy, with the rest shared by Big Bang, 250 M, and Galactic spallation nucleosynthesis, 100 M.
Molaro et al. (2020) suggested that a higher 3He in the donor star could result into a higher 7Be since it is produced trough the 3He()7Be channel. Denissenkov et al. (2021) showed that a increased abundance of 3He in the accreted material leads to a decrease of the peak temperature, and therefore a reduced production of 7Be. They suggested instead that an enhanced abundance of 4He could favour the 7Be production. However, McCollum & Laine (2021) found that the progenitor object of V6595 Sgr is a cool subgiant with Teff = 3750 150 K, and log g = 3.5 0.3, which is unlikely enriched either in 3He or 4He.
Evidence of absorption components have always been observed in novae, both in hydrogen and metal lines. These absorptions show relatively narrow features named THEA, from Williams et al. (2008). Generally, these are due to neutral and low-ionization transitions of elements that are detected during the optically thick phases of classical novae. They exhibit only a single, low velocity absorption component, suggesting that they are located in a toroidal ejecta surrounding the nova progenitor. These lines are visible only for a limited time interval, generally few weeks after the nova discovery, before disappearing and leaving a spectrum dominated by Balmer lines, Fe II, elements synthesised in the TNR and, at later times when the ionization state increases, by helium. Aydi et al. (2020) from a study of their evolution in V906 Car argued that they might be located in the slow ejecta component. The detection of high-energy emission in gamma-rays combined with the evidence of delayed components in the optical has challenged the nova phenomenology. Aydi et al. (2020) suggested that nova outburst consists in early dense toroidal ejecta moving outward with relatively slow ( km s-1) velocities which produce the first bright optical peak in the emission. Later, a faster wind-like component with larger velocities will catch up with the earlier slower ejecta thus producing shocks that will be observed at high-energies. They concluded that THEA could be pre-existing material surrounding the system.
The 7Be absorption line observed in V6595 Sgr is expanding at almost 3000 km s-1, which is the highest recorded velocity for 7Be in all novae. However, in V2944 Oph the velocity of the 7Be absorption is -645 km s-1. V̱5668 Sgr also shows 7Be ii lines in a component at -730 km s-1and also in components with velocities up to 2200 km s-1. By taking these figures at face values, 7Be is found in both high or low velocity components of nova outbursts. This shows that TNR products are present also in the slower material.
Denissenkov et al. (2021) noted that the conditions after 71 minutes at the end of the nova trajectory implies a small occupation probabilities for K-shell electrons, suggesting that 7Be is fully ionized and practically stable. They computed the effective lifetime to be of the order of days. In Fig. 9 the 7Be abundances both with and without the decay correction are shown. When 7Be decay is not taken into account the average value is 7Be = . The two sets of measurements show a similar scatter which exceeds the observational errors and is likely intrinsic. The values without correction are significantly smaller and closer to the maximum theoretical values. With this scenario the distance between observed abundances and theoretical models is much reduced. V5668 Sgr is the only nova where two independent measures of the 7Be abundance have been taken in two different epochs, at 58 and 82 days after maximum, respectively. The abundances differ by a factor of 1.8 when the decay is not taken into account, but by only 30%, i.e. within the measurement errors, when the decay is considered. Thus, in this case it seems that correction for the decay provides a more plausible behaviour. Moreover, we note that the mere presence of the 7Be ii lines in the outburst nova spectra is not consistent with 7Be remaining fully ionized for such a long time.
5 Summary
High resolution observations of the classical nova V6595 Sgr taken with the UVES spectrograph after few days from explosion have been analysed to search for the presence of the 7Be ii doublet lines. The main results are the following:
-
•
The spectra showed the presence of a shallow absorption feature due to the 7Be ii doublet lines spanning very high velocities from -2600 to -2900 km s-1. Superposed there are narrow absorption components with velocities at -2620 and -2820 km s-1. The absorptions are seen in several other elements such as Mg i, Na i Ca ii Fe ii and H i as well. The 7Be detection in very high velocity ejecta components shows that both high and low velocity components contain material processed in the Termo-Nuclear Runaway.
-
•
Using Ca ii K line as a reference element, we infer 7.4 , or 9.8 when the 7Be decay is taken into account. The 7Be abundance is about half of the value most frequently measured in novae.
-
•
Observations 91 days after discovery showed prominent emission lines of Neon and Oxygen which allowed to classify the nova as a ONe type. 7Be seems to be produced in both types at comparable levels.
-
•
The possible presence of over-ionization suggested by Chugai & Kudryashov (2020) in nova V5668 Sgr is discussed. The model adopted by Chugai & Kudryashov (2020) does indeed produce overionization in the observed layer, but, it fails to reproduce other observable and does not reproduce the physical conditions of the material where the 7Be is observed. We therefore conclude that significant over-ionization effects are unlikely to occur. On the other hand, over-ionization could be present for the fast ONe novae resulting into a 7Be abundance lower than CO novae, in better agreement with the theoretical expectations.
-
•
The suggestion by Denissenkov et al. (2021) that 7Be remains fully ionized and stable for a considerable time after the explosion is also discussed and found not consistent with the 7Be ii observations and their time variation.
| Nova | type | d | comp | A(7Be) | A(7Be)c | Ref | |
| km s-1 | |||||||
| V339 Del | CO | 47 | -1103 | 6.92 | 7.20 | 1,4 | |
| V339 Del | CO | 47 | -1268 | 7.11 | 7.38 | 1,4 | |
| V5668 Sgr | CO | 58 | -1175 | 7.84 | 8.17 | 2 | |
| V5668 Sgr | CO | 82 | -1500 | 7.58 | 8.04 | 2 | |
| V2944 Oph | CO | 80 | -645 | 6.72 | 7.18 | 4 | |
| V407 Lup | ONe | 8 | -2030 | 7.69 | 7.73 | 3 | |
| V838 Her | ONe? | 3 | -2500 | 7.66 | 7.68 | 5 | |
| V612 Sct | ? | - | 6 | ||||
| V357 Mus | CO? | 35 | -1000 | 6.96 | 7.18 | 6 | |
| FM Cir | CO? | : | 6 | ||||
| V906 Car | CO? | 80 | -600 | 6.86 | 7.30 | 6 | |
| V5669 Sgr | CO | 28 | -1000 | 6.34 | 6.51 | 7 | |
| V5669 Sgr | CO | 28 | -2000 | 6.61 | 6.77 | 7 | |
| V6595 Sgr | ONe | 15 | -2700 | 6.87 | 6.99 | 9 | |
| V1369 Cen | CO | 7 | -550 | 5.00 | 5.04 | 8 | |
| V1369 Cen | CO | 13 | -560 | 5.30 | 5.38 | 8 | |
| V1369 Cen∗ | CO | 7 | -550 | 4.70 | 4.78 | 8 | |
| V1369 Cen∗ | CO | 13 | -560 | 4.78 | 4.85 | 8 |
Acknowledgments
The ESO staff is warmly acknowledged for the execution of these observation during the pandemic lockdown. An anonymous referee is warmly thanked for many useful suggestions. Based on observations made with the Italian Telescopio Nazionale Galileo (TNG) operated on the island of La Palma by the Fundación Galileo Galilei of the INAF (Istituto Nazionale di Astrofisica) at the Spanish Observatorio del Roque de los Muchachos of the Instituto de Astrofisica de Canarias. LI was supported by two grants from VILLUM FONDEN (project number 16599 and 25501). LI warmly thanks Ernesto Guido for the technical support and important discussions during the planning of the observations.
6 data availability
Based on data from the UVES spectrograph at the Unit 2 of the VLT at the Paranal Observatory, ESO, Chile. The observations have been taken under a Target opportunity Program 105.20B6.001 PI P. Molaro. ESO data are world-wide available and can be requested after the proprietary period of one year by the astronomical community through the link http://archive.eso.org/cms/eso-data.html. Before they will be shared on reasonable request to the corresponding author.
References
- Arai et al. (2021) Arai A., Tajitsu A., Kawakita H., Shinnaka Y., 2021, ApJ, 916, 44
- Arnould & Norgaard (1975) Arnould M., Norgaard H., 1975, A&A, 42, 55
- Aydi et al. (2020) Aydi E., et al., 2020, ApJ, 905, 62
- Aydi et al. (2021) Aydi E., et al., 2021, The Astronomer’s Telegram, 14533, 1
- Bailer-Jones et al. (2021) Bailer-Jones C. A. L., Rybizki J., Fouesneau M., Demleitner M., Andrae R., 2021, AJ, 161, 147
- Banerjee et al. (2016) Banerjee D. P. K., Srivastava M. K., Ashok N. M., Venkataraman V., 2016, MNRAS, 455, L109
- Bayless et al. (2021) Bayless A. J., Rudy R. J., Subasavage J. P., 2021, The Astronomer’s Telegram, 14553, 1
- Bode & Evans (2012) Bode M. F., Evans A., 2012, Classical Novae
- Cameron (1955) Cameron A. G. W., 1955, ApJ, 121, 144
- Cameron & Fowler (1971) Cameron A. G. W., Fowler W. A., 1971, ApJ, 164, 111
- Casanova et al. (2016) Casanova J., José J., García-Berro E., Shore S. N., 2016, A&A, 595, A28
- Cescutti & Molaro (2019) Cescutti G., Molaro P., 2019, MNRAS, 482, 4372
- Chugai & Kudryashov (2020) Chugai N. N., Kudryashov A. D., 2020, arXiv e-prints, p. arXiv:2007.07044
- Clayton (1981) Clayton D. D., 1981, ApJ, 244, L97
- D’Antona & Matteucci (1991) D’Antona F., Matteucci F., 1991, A&A, 248, 62
- Davids et al. (1970) Davids C. N., Laumer H., Austin S. M., 1970, Phys. Rev. C, 1, 270
- Dekker et al. (2000) Dekker H., D’Odorico S., Kaufer A., Delabre B., Kotzlowski H., 2000, in Iye M., Moorwood A. F., eds, Society of Photo-Optical Instrumentation Engineers (SPIE) Conference Series Vol. 4008, Optical and IR Telescope Instrumentation and Detectors. pp 534–545, doi:10.1117/12.395512
- Della Valle & Izzo (2020) Della Valle M., Izzo L., 2020, A&ARv, 28, 3
- Della Valle et al. (2002) Della Valle M., Pasquini L., Daou D., Williams R. E., 2002, A&A, 390, 155
- Denissenkov et al. (2021) Denissenkov P. A., Ruiz C., Upadhyayula S., Herwig F., 2021, MNRAS, 501, L33
- Ferland et al. (2017) Ferland G. J., et al., 2017, Rev. Mex. Astron. Astrofis., 53, 385
- Ferreira et al. (2021) Ferreira T. S., Saito R. K., Minniti D., 2021, The Astronomer’s Telegram, 14625, 1
- Fields (2011) Fields B. D., 2011, Annual Review of Nuclear and Particle Science, 61, 47
- Friedjung (1979) Friedjung M., 1979, A&A, 77, 357
- Gaia Collaboration et al. (2021) Gaia Collaboration et al., 2021, A&A, 649, A1
- Gallagher & Starrfield (1978) Gallagher J. S., Starrfield S., 1978, ARA&A, 16, 171
- Gaposchkin (1957) Gaposchkin C. H. P., 1957, The galactic novae.
- Gehrz & Ney (1987) Gehrz R. D., Ney E. P., 1987, Proceedings of the National Academy of Science, 84, 6961
- Gehrz et al. (2018) Gehrz R. D., et al., 2018, ApJ, 858, 78
- Gomez-Gomar et al. (1998) Gomez-Gomar J., Hernanz M., Jose J., Isern J., 1998, MNRAS, 296, 913
- Harris et al. (2001) Harris M. J., Teegarden B. J., Weidenspointner G., Palmer D. M., Cline T. L., Gehrels N., Ramaty R., 2001, ApJ, 563, 950
- Harvey et al. (2018) Harvey E. J., Redman M. P., Darnley M. J., Williams S. C., Berdyugin A., Piirola V. E., Fitzgerald K. P., O’Connor E. G. P., 2018, A&A, 611, A3
- Hernanz et al. (1996) Hernanz M., Jose J., Coc A., Isern J., 1996, ApJ, 465, L27
- Izzo et al. (2015) Izzo L., et al., 2015, ApJ, 808, L14
- Izzo et al. (2018) Izzo L., et al., 2018, MNRAS, 478, 1601
- Jean et al. (2000) Jean P., Hernanz M., Gómez-Gomar J., José J., 2000, MNRAS, 319, 350
- José & Hernanz (1998) José J., Hernanz M., 1998, ApJ, 494, 680
- Kafka (2021) Kafka S., 2021, https://www.aavso.org
- Kochanek et al. (2017) Kochanek C. S., et al., 2017, PASP, 129, 104502
- Lemasle et al. (2018) Lemasle B., et al., 2018, A&A, 618, A160
- Lodders (2019) Lodders K., 2019, arXiv e-prints, p. arXiv:1912.00844
- Mason et al. (2020) Mason E., Shore S. N., Kuin P., Bohlsen T., 2020, A&A, 635, A115
- Matheson et al. (1993) Matheson T., Filippenko A. V., Ho L. C., 1993, ApJ, 418, L29
- McCollum & Laine (2021) McCollum B., Laine S., 2021, The Astronomer’s Telegram, 14655, 1
- Molaro et al. (2016) Molaro P., Izzo L., Mason E., Bonifacio P., Della Valle M., 2016, MNRAS, 463, L117
- Molaro et al. (2020) Molaro P., Izzo L., Bonifacio P., Hernanz M., Selvelli P., della Valle M., 2020, MNRAS, 492, 4975
- Muztaba et al. (2020) Muztaba R., Malasan H. L., Arai A., 2020, in IOP Conference Series: Earth and Environmental Science. p. 012004, doi:10.1088/1755-1315/537/1/012004
- Ness et al. (2007) Ness J. U., et al., 2007, ApJ, 665, 1334
- Romano et al. (1999) Romano D., Matteucci F., Molaro P., Bonifacio P., 1999, A&A, 352, 117
- Romano et al. (2001) Romano D., Matteucci F., Ventura P., D’Antona F., 2001, A&A, 374, 646
- Romano et al. (2021) Romano D., et al., 2021, arXiv e-prints, p. arXiv:2106.11614
- Schwarz et al. (2011) Schwarz G. J., et al., 2011, ApJS, 197, 31
- Selvelli & Gilmozzi (2019) Selvelli P., Gilmozzi R., 2019, A&A, 622, A186
- Selvelli et al. (2018) Selvelli P., Molaro P., Izzo L., 2018, MNRAS, 481, 2261
- Shore & De Gennaro Aquino (2020) Shore S. N., De Gennaro Aquino I., 2020, A&A, 639, L12
- Shore et al. (2003) Shore S. N., et al., 2003, AJ, 125, 1507
- Siegert et al. (2018) Siegert T., et al., 2018, A&A, 615, A107
- Siegert et al. (2021) Siegert T., Ghosh S., Mathur K., Spraggon E., Yeddanapudi A., 2021, arXiv e-prints, p. arXiv:2104.00363
- Sokolovsky et al. (2021) Sokolovsky K., Aydi E., Chomiuk L., Kawash A., Strader J., Mukai K., Li K.-L., 2021, The Astronomer’s Telegram, 14535, 1
- Starrfield et al. (1978) Starrfield S., Truran J. W., Sparks W. M., Arnould M., 1978, ApJ, 222, 600
- Starrfield et al. (2020) Starrfield S., Bose M., Iliadis C., Hix W. R., Woodward C. E., Wagner R. M., 2020, ApJ, 895, 70
- Taguchi et al. (2021) Taguchi K., Kawabata M., Yamanaka M., Isogai K., 2021, The Astronomer’s Telegram, 14513, 1
- Tajitsu et al. (2015) Tajitsu A., Sadakane K., Naito H., Arai A., Aoki W., 2015, Nature, 518, 381
- Tajitsu et al. (2016) Tajitsu A., Sadakane K., Naito H., Arai A., Kawakita H., Aoki W., 2016, ApJ, 818, 191
- Wallerstein & Sneden (1982) Wallerstein G., Sneden C., 1982, ApJ, 255, 577
- Williams et al. (1991) Williams R. E., Hamuy M., Phillips M. M., Heathcote S. R., Wells L., Navarrete M., 1991, ApJ, 376, 721
- Williams et al. (2008) Williams R., Mason E., Della Valle M., Ederoclite A., 2008, ApJ, 685, 451