The mm-to-cm SED of spiral galaxies
Abstract
The mm-to-cm range of the Spectral Energy Distribution of spiral galaxies remains largely unexplored. Its coverage is required to disentangle the contribution of dust emission, free-free and synchrotron radiation and can provide constraints on dust models, star-formation rates and ISM properties. We present the case for a synergy between NIKA2 observations of nearby spirals and those from planned and current instrumentation at the Sardinia Radio Telescope, and report on a pilot K-band program to search for Anomalous Microwave Emission, an elusive emission component which is presumably related to dust.
1 Galactic SEDs in the mm-to-cm range
Our knowledge of the Spectral Energy Distribution (SED) of nearby galaxies has greatly improved in recent times, thanks to multi-wavelength surveys and in particular to the Herschel Space Observatory. Herschel has extended the SED coverage to far-infrared (FIR) and submm wavelengths, a range where dust, i.e. solid grains in the interstellar medium (ISM), emits the radiation it has absorbed from starlight (1/4 of the total luminosity for late type galaxies; BianchiA&A2018 ). Using a dust model and fitting tools such as, e.g., CIGALE BoquienA&A2019 and HerBIE GallianoMNRAS2018 , a wealth of information can be extracted from the SED: star-formation rates (SFRs), stellar and dust masses, gas-to-dust ratios, etc. (NersesianA&A2019 ; AnianoApJ2020 ; DeLoozeMNRAS2020 ; GallianoA&A2021 , just to mention a few recents works). Figure 1 shows an example of the current SED knowledge: it uses data from DustPedia DaviesPASP2017 , a database collecting photometry and imagery for all the large () and nearby ( Mpc) galaxies observed by Herschel; and mid radio continuum flux densities from TabatabaeiApJ2017 .
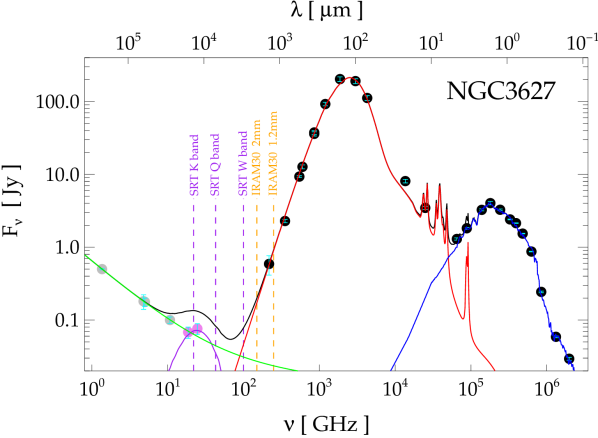
A few gaps still remain: in particular, data for (mm-to-cm range) is limited to the Milky Way (MW) and a few bright objects. The high-frequency side of this gap, at GHz, is still dominated by dust emission: radiation could come from the Rayleigh-Jeans tail of the warmer dust, or be due to colder grains undetected from FIR-submm observations. Large masses of cold grains, and/or variations of the dust absorption cross-section at longer wavelengths could be responsible for the submm excess detected in a few objects GallianoRev2018 . Thus, observations at these frequencies are important to constrain the properties of dust, which are still uncertain. Current dust models are made to reproduce the observations of extinction, emission and depletion at high galactic latitude in the MW CompiegneA&A2011 . Various dust models exist, leading to different estimates of quantities such as the dust mass (see, e.g., NersesianA&A2019 ). Furthermore, recent lab measurements are questioning the validity of the optical properties generally assumed for the grain materials DemykA&A2017 . Finally, there are indications that the bulk of dust in a galaxy might have different properties than those of the diffuse MW medium BianchiA&A2019 ; ClarkMNRAS2019 . The NIKA2 camera at the IRAM 30m radiotelescope, and in particular the IMEGIN guaranteed-time project observing large nearby galaxies at millimetre wavelengths Katsioli ; Ejlali , will help in shedding light on these issues.
At lower frequencies, emission components other than dust need to be taken into account. Already in NIKA2 maps at 2 mm, about 10% of the SED is due to free-free and synchrotron radiation; their contribution increases, and that of dust reduces, in the mid and low-frequency side of the gap (see, e.g.. Katsioli ). Free-free emission gives the maximum contribution in the mid of the frequency gap. Being due mostly to free electrons, this radiation can be directly related to ionising photons and thus provides a direct estimate of the star-formation rate, unaffected by the dust extinction corrections needed for estimates based on the UV continuum and the hydrogen recombination lines in the optical MurphyProc2018 ; or by the uncertain fraction of dust heating due to young stars, for estimates based on infrared dust emission NersesianA&A2019 . The dominant emission toward the low-frequency side of the gap is due to synchrotron radiation, produced by cosmic ray electrons accelerated to relativistic velocities in supernova remnants and spiralling along the magnetic field in the ISM MurphyProc2018 . Since all of these emission mechanisms overlap in frequency, full SED coverage is needed to solve the degeneracies and estimate the exact contribution of each component.
An opportunity to extend the knowledge of the SED beyond the frequencies accessible to the NIKA2 camera is soon going to be offered at the Sardinia Radio telescope (SRT PrandoniA&A2017 ; see Fig. 1). In the incoming year, the MISTRAL camera, operating in the W Band at GHz, will be installed at SRT DAlessandro , as well as a 19-feed Q band receiver at GHz OrfeiProc2020 . Thanks to the large SRT antenna, 64m, these instruments will allow us to map nearby galaxies with HPBW=12′′ and 28′′, respectively, resolutions close to those of NIKA2 and the Herschel instruments. Already available, a 7-feed spectro-polarimetric receiver allows access to the K band at GHz OrfeiProc2010 .
2 Anomalous Microwave Emission
A further emission component might need to be considered: the Anomalous Microwave Emission (AME). First detected in the MW in the mid-90s by Cosmic Microwave Background experiments, AME is seen as an excess over the expected free-free and synchrotron emissions, peaking at GHz and correlating with dust emission at larger frequencies (see DickinsonRev2018 for a review). AME is seen both in isolated clouds PlanckA&A2014 , as well as in the diffuse MW medium where its amplitude, relative to the 100 m surface brightness, is AME(30 GHz)/I(100 m) 1/3000 PlanckA&A2016 .
The most accredited theory explains AME with electric dipole emission from rapidly rotating grains DraineApJ1998a . For typical ISM conditions, these grains must have size of m, in order to spin fast and emit at the AME frequencies: they could be associated with the macromolecules carriers of the PAH features in the mid-infrared spectrum DraineApJ1998b , or with nanosilicates HensleyApJ2017 . Alternatively, AME could be due to an enhancement of the absorption/emission cross sections at microwave frequencies, either due to magnetic inclusions in grains DraineApJ1999 or the amorphous state of the grain material JonesA&A2009 ; NashimotoPASJ2020 . AME can thus set constraints on the grain size distribution (and ISM conditions), under the spinning grain hypothesis, and/or on the grain composition, for the thermal emission hypothesis. Though these models can all explain AME, yet there is no concluding evidence for its physical mechanism: some authors find a good correlation with small-grain emission, thus favouring spinning dust YsardA&A2010 ; HarperMNRAS2015 ; BellPASJ2019 ; others support the thermal hypothesis, reporting a better correlation with the total dust emission HensleyApJ2016 .
While AME is almost ubiquitous in the MW, it has been detected with high significance in three extragalactic sources only. AME has been found with pointed observations in just one star-forming region in NGC 6946 MurphyApJ2010 and one compact radio-source in NGC 4725 (MurphyApJ2018 , even though, in this case, it does not appear to be associated with dust MurphyApJ2020 ). On the global SED, strong evidence for AME has been recently found in the Andromeda galaxy BattistelliApJL2019 , with an AME component compatible with that in the MW.
3 A pilot K-band program at SRT
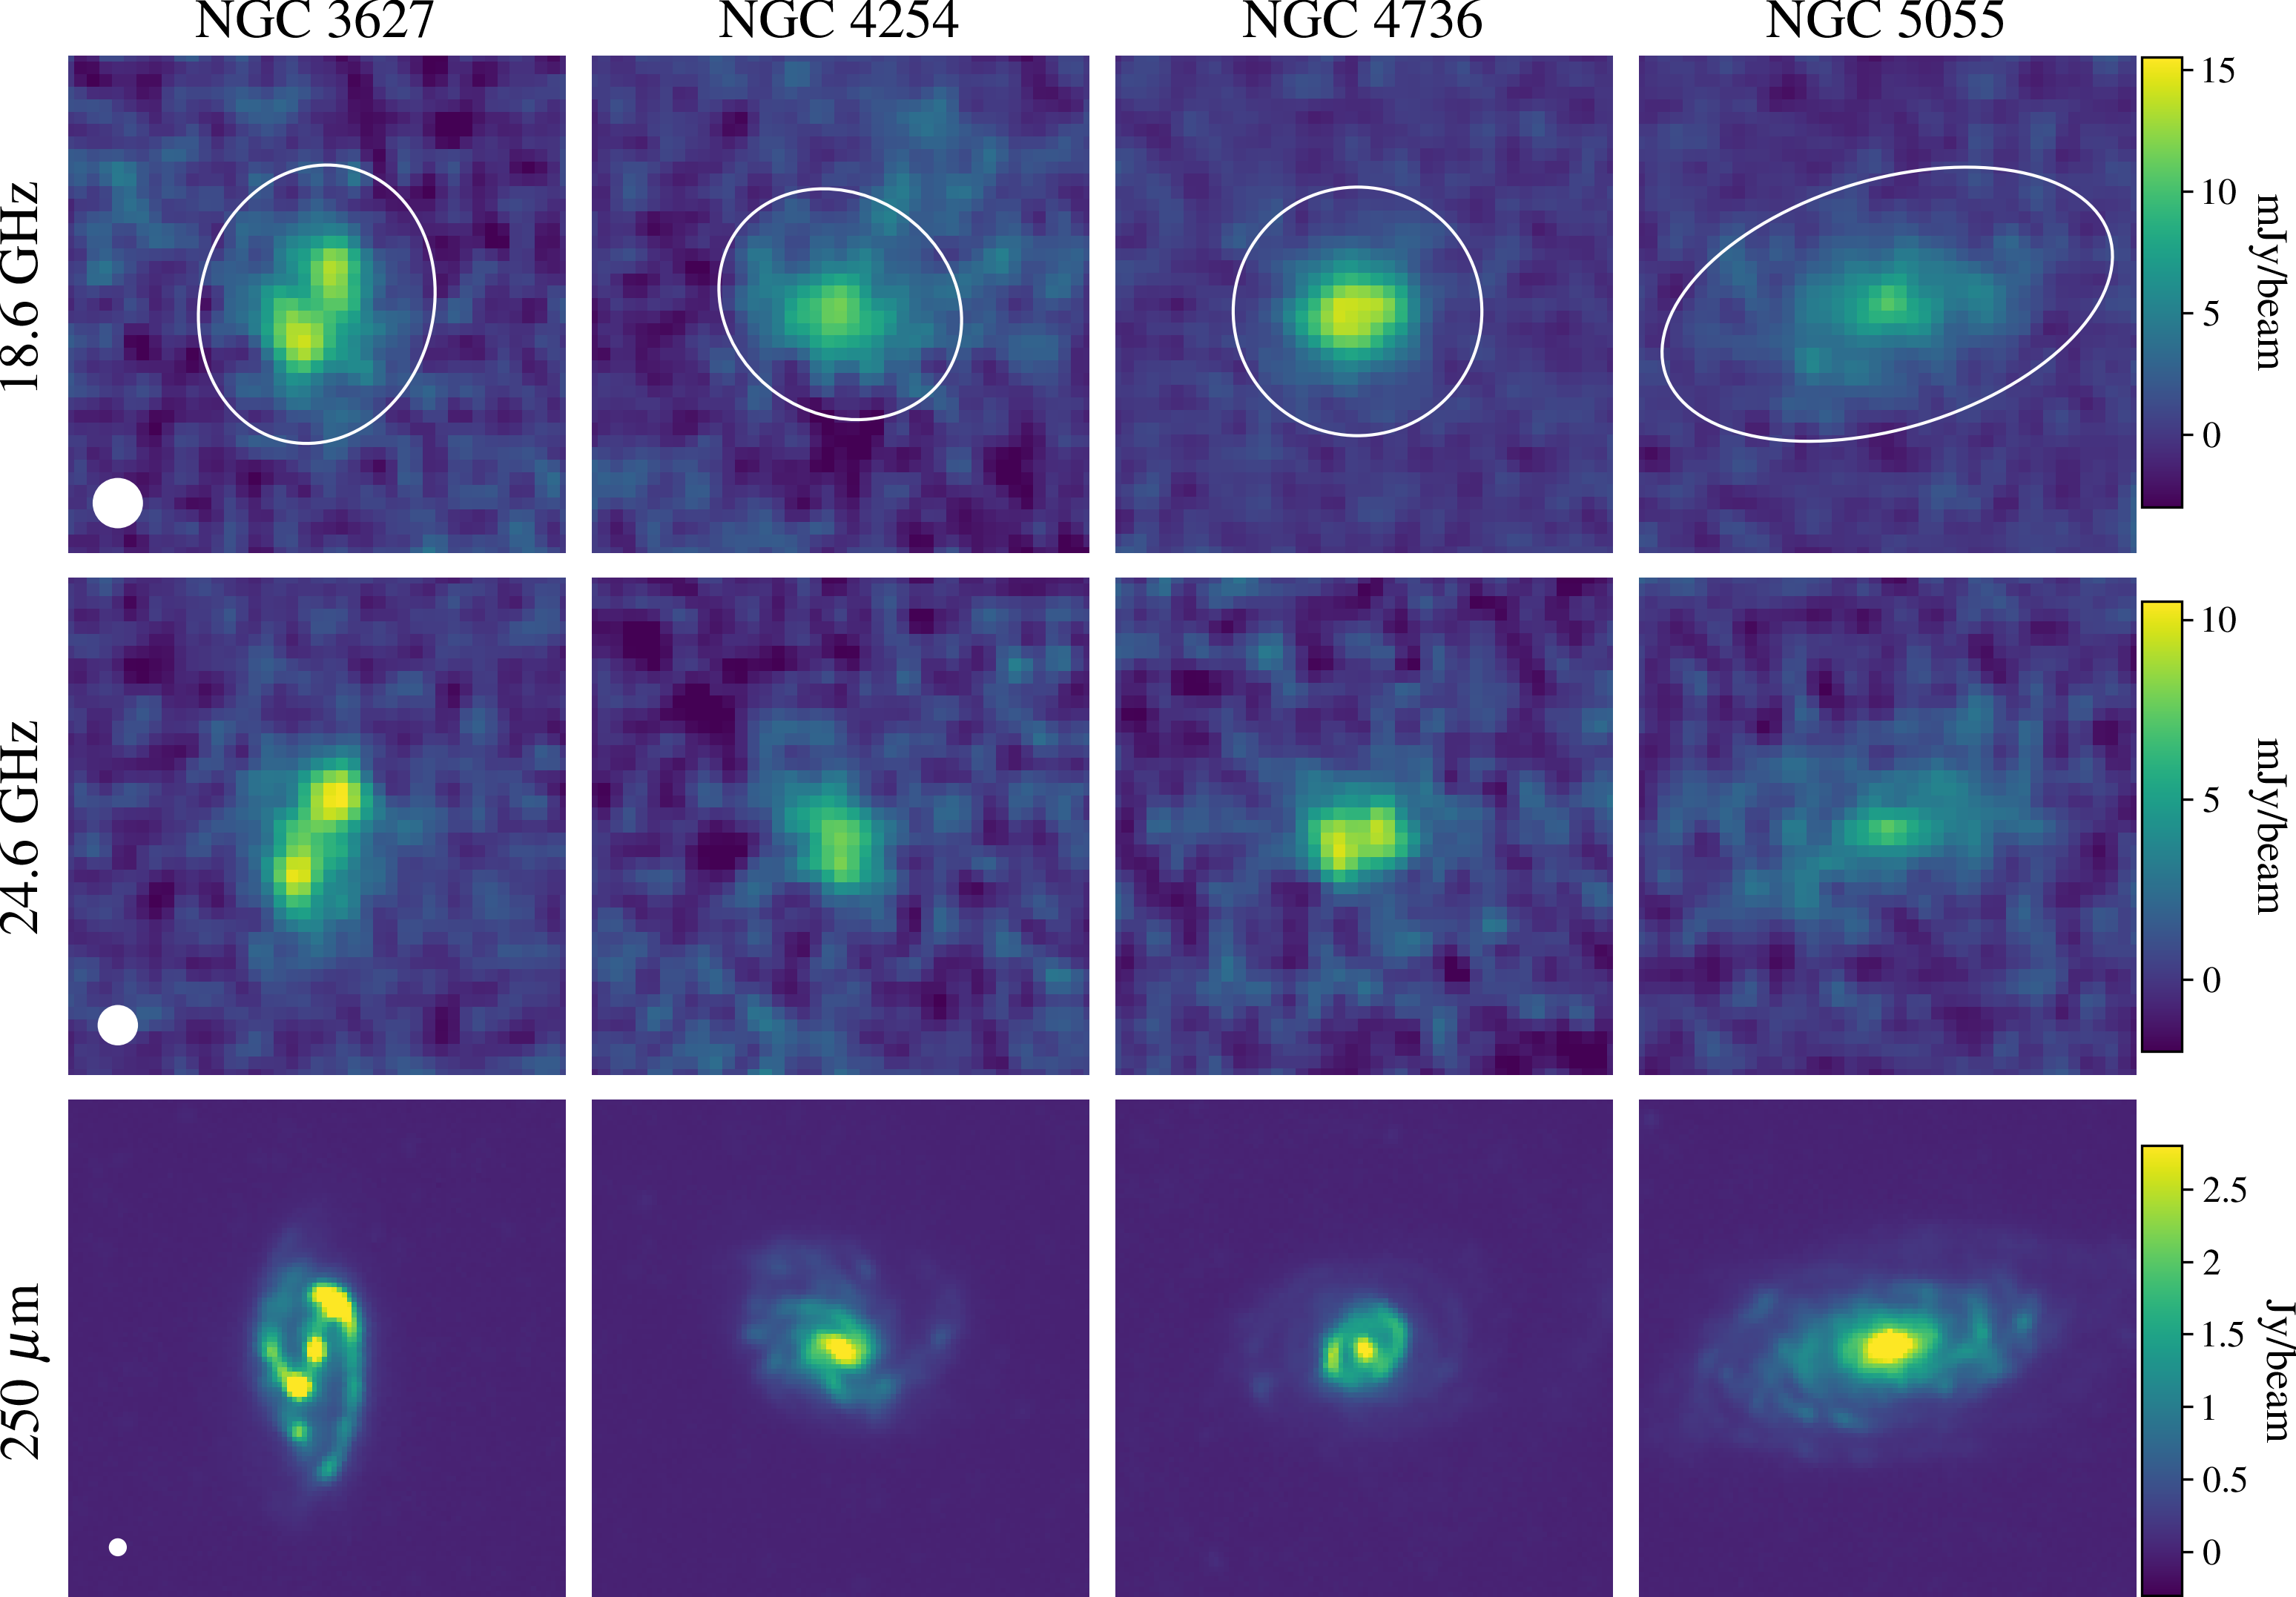
As a preliminary project, at the beginning of 2021 we observed four galaxies at SRT in the K band. They are: NGC 3627 (M 66), NGC 4254 (M 99), NGC4736 (M 94) and NGC5055 (M63). These galaxies are part of the NIKA2 IMEGIN sample, of the DustPedia database and of the KINGFISHER project. DustPedia provides homogenised images, full UV-to-submm global photometry and SED models ClarkA&A2018 ; NersesianA&A2019 , while KINGFISHER provides radio continuum data and models at frequencies between 1 and 10 GHz TabatabaeiApJ2017 . The first objective of the observations was the detection of AME, by comparing the SRT data with the available fits for the free-free and synchrotron components. Ultimately, the targets could become the first nucleus for a study of the complete UV-to-radio SED, once the NIKA2 data and the future SRT instruments cover the frequency gap between the submm and the K band (Fig. 1).
The K-band receiver was used together with the SArdinia Roach2-based Digital Architecture for Radio Astronomy back end (SARDARA; MelisJAInst2018 ). We selected two 1.2 GHz sub-bands at the edges of the K-band, at 18.6 and 24.6 GHz (with HPBW = 57′′ and 45′′, respectively). These sub-bands were covered by 1.46 MHz frequency channels in full Stokes mode. Observations were done on-the-fly over an area of , centered on each galaxy, with a scan speed 2′/s and scan separation HPBW/3. The area was alternatively covered by scanning along orthogonal RA and Dec directions, for an efficient removal of the scan noise. Each coverage took about 20 minutes and was repeated 15 to 40 times, depending on the target, frequency and observing conditions.
The spectral cubes were reduced using the proprietary Single-dish Spectral-polarimetry Software (SCUBE; MurgiaMNRAS2016 ) that accounts for calibration, RFIs removal, baseline removal and map-making. Maps for total and polarised intensity were made with pixel size 15′′. Total intensity maps are shown in Fig. 2. Even though some mechanisms proposed for AME are expected to produce polarised emission DickinsonRev2018 , we detected none.
4 Preliminary results
Using the apertures shown in Fig. 2, we measured the global flux density for our targets at 18.6 GHz and 24.6 GHz. These new datapoints were analized together with the mid-radio continuum from KINGFISHER. For NGC 4254 and NGC 4736, the SRT observations are consistent with the synchrotron and free-free fits to data for GHz. For NGC 3627 and NGC 5055, the 18.6 GHz flux density is still compatible with the fit in TabatabaeiApJ2017 ; the 24.6 GHz flux density, instead, is in excess of the fit extrapolation and larger than that at 18.6 GHz (see Fig. 1 for NGC 3627).
With the current data, it is difficult to asses if the 24.6 GHz excess seen in NGC 3627 and NGC 5055 is due to an additional component, such as AME, or if it is just a statistical fluctuation. Observations at larger frequencies, like those that will be possible with the forthcoming Q-band receiver for SRT, are needed to confirm this finding. In fact, a model including synchrotron and free-free only can be fit to the entire Ghz range, resulting in minor modifications with respect to the fit for GHz. The new parameters for the two radio components are still consistent with the spread of properties found in the KINGFISHER sample. From the free-free component, estimates of the global SFR can be obtained, which are consistent with those from the UV-to-submm SED fitting, though affected by large uncertainties Bianchi2022 . Again, more precise determinations will need to wait for data at higher frequencies, or better to the full coverage of the gap, for a simultaneous analysis of all the emission components, dust included.
Currently, we can only put upper limits on the AME contribution at 30 GHz. We find that AME(30 GHz)/I(100 m) is at least a factor 5 smaller that the values measured in M 31 and the MW (see the comparison between predicted AME and SRT observations in Fig. 1). This does not necessarily imply that the AME properties are different. In fact, the AME(30 GHz)/I(100 m) ratio is an ill-defined characterisation of the AME emissivity, as it is expected to be lower in objects where the dust temperature is higher TibbsProc2012 . Indeed, the average dust temperatures of our galaxies, as well as those in three other targets with no AME detection PeelMNRAS2011 are higher than those of M 31 and the MW. When the AME emissivity is derived in terms of the column density of dust, available from the DustPedia analysis, the upper limits in our galaxies become consistent with the AME detections. Apparently, AME may not be detected in our targets and those in PeelMNRAS2011 because of their relatively stronger radio-continuum than in the Milky Way and Andromeda galaxy Bianchi2022 . Future searches for AME might need to consider this in the selection of targets.
Acknowledgements
We acknowledge support from the INAF mainstream 2018 program "Gas-DustPedia: A definitive view of the ISM in the Local Universe" and from grant PRIN MIUR 2017- 20173ML3WW_001.
References
- (1) Bianchi, S., De Vis, P., Viaene, S., et al., A&A 620, A112 (2018)
- (2) Boquien, M., Burgarella, D., Roehlly, Y., et al., A&A 622, A103 (2019)
- (3) Galliano, F., MNRAS , 476, 1445 (2018)
- (4) Nersesian, A., Xilouris, E. M., Bianchi, S., et al., A&A 624, A80 (2019)
- (5) Aniano, G., Draine, B. T., Hunt, L. K., et al., ApJ 889, 150 (2020)
- (6) De Looze, I., Lamperti, I., Saintonge, A., et al., MNRAS 496 3668 (2020)
- (7) Galliano, F., Nersesian, A., Bianchi, S., et al., A&A 649, A18 (2021)
- (8) Davies, J. I., Baes, M., Bianchi, S., et al., PASP 129, 044102 (2017)
- (9) Tabatabaei, F. S., Schinnerer, E., Krause, M., et al., ApJ 836, 185 (2017)
- (10) Clark, C. J. R., Verstocken, S., Bianchi, S., et al., A&A 609, A37 (2018)
- (11) Battistelli, E. S., Fatigoni, S., Murgia, M., et al., ApJL 877, L31 (2019)
- (12) Planck Collaboration, A&A 594, A25 (2016)
- (13) Galliano, F., Galametz, M., Jones, A. P., ARA&A 56, 673 (2018)
- (14) Compig̀ne, M., Verstraete, L., Jones, A., et al., A&A 525, A103 (2011)
- (15) Demyk, K., Meny, C., Lu, X. H., et al., A&A 600, A123 (2017)
- (16) Bianchi, S., Casasola, V., Baes, M., A&A 631, A102 (2019)
- (17) Clark, C. J. R., De Vis, P., Baes, M., et al., MNRAS 489, 5256 (2019)
- (18) Katsioli, S., et al., these proceedings
- (19) Ejlali, G., et al., these proceedings
- (20) Murphy, E. J., Condon, J. J., Alberdi, A., et al., ASP Conference Series 517, 421 (2018)
- (21) Prandoni, I., Murgia, M., Tarchi, A., et al., A&A 608, A40 (2017)
- (22) D’Alessandro, G., et al., these proceedings
- (23) Orfei, A., in RadioNet Workshop on Future Trends in Radio Astronomy Instrumentation, MPIfR, Bonn (2020)
- (24) Orfei, A., Carbonaro, L., Cattani, A., et al., IEEE Antennas and Propagation Magazine 52, 62 (2010)
- (25) Dickinson, C., Ali-Haïmoud, Y., Barr, A., et al., New A Rev. 80, 1 (2018)
- (26) Planck collaboration, A&A 565, A103 (2014)
- (27) Draine, B. T., Lazarian, A., ApJ 494, L19 (1998a)
- (28) Draine, B. T., Lazarian, A., ApJ 508, 157 (1998b)
- (29) Hensley, B. S., Draine, B. T., ApJ, 836, 179 (2017)
- (30) Draine, B. T., Lazarian, A., ApJ 512, 740 (1999)
- (31) Jones, A. P., A&A 506, 797 (2009)
- (32) Nashimoto, M., Hattori, M., Génova-Santos, R., et al., PASJ 72, 6 (2020)
- (33) Ysard, N., Miville-Deschênes, M. A., Verstraete, L., A&A 509, L1 (2010)
- (34) Harper, S. E., Dickinson, C., Cleary, K., MNRAS 453, 3375 (2015)
- (35) Bell, A. C., Onaka, T., Galliano, F., et al., PASJ 71, 123 (2019)
- (36) Hensley, B. S., Draine, B. T., Meisner, A. M., ApJ 827, 45 (2016)
- (37) Murphy, E. J., Helou, G., Condon, J. J., et al., ApJL 709, L108 (2010)
- (38) Murphy, E. J., Linden, S. T., Dong, D., et al., ApJ 862, 20 (2018)
- (39) Murphy, E. J., Hensley, B. S., Linden, S. T., et al., ApJL 905, L23 (2020)
- (40) Melis, A., Concu, R., Trois, A., et al., Journal of Astronomical Instrumentation 7, 1850004 (2018)
- (41) Murgia, M., Govoni, F., Carretti, E., et al., MNRAS 461, 3516 (2016)
- (42) Bianchi, S., et al., in preparation
- (43) Tibbs, C. T., Paladini, R., Dickinson, C., Advances in Astronomy 2012,124931 (2012)
- (44) Peel, M. W., Dickinson, C., Davies, R. D., et al., MNRAS 416, L99 (2011)