TOI-2076 and TOI-1807: Two young, comoving planetary systems within 50 pc identified by TESS that are ideal candidates for further follow-up.
Abstract
We report the discovery of two planetary systems around comoving stars; TOI-2076 (TIC 27491137) and TOI-1807 (TIC 180695581). TOI-2076 is a nearby (41.9 pc) multi-planetary system orbiting a young ( Myr), bright (K = 7.115 in TIC v8.1). TOI-1807 hosts a single transiting planet, and is similarly nearby (42.58 pc), similarly young ( Myr), and bright. Both targets exhibit significant, periodic variability due to star spots, characteristic of their young ages. Using photometric data collected by TESS we identify three transiting planets around TOI-2076 with radii of =3.30.04 , =4.40.05 , and =4.10.07 . Planet TOI-2076b has a period of =10.356 d. For both TOI 2076c and d, TESS observed only two transits, separated by a 2-year interval in which no data were collected, preventing a unique period determination. A range of long periods (>17d) are consistent with the data. We identify a short-period planet around TOI-1807 with a radius of =1.80.04 and a period of =0.549 d. Their close proximity, and bright, cool host stars, and young ages, make these planets excellent candidates for follow-up. TOI-1807b is one of the best known small ( ) planets for characterization via eclipse spectroscopy and phase curves with JWST. TOI-1807b is the youngest ultra-short period planet discovered to date, providing valuable constraints on formation time-scales of short period planets. Given the rarity of young planets, particularly in multiple planet systems, these planets present an unprecedented opportunity to study and compare exoplanet formation, and young planet atmospheres, at a crucial transition age for formation theory.
=
1 Introduction
A primary aim of exoplanetary science is to use the observed properties of planetary systems to constrain theoretical models of planet formation (that which occurs in the protoplanetary disk) and evolution (what occurs after disk dispersal). This problem is approached in a number of ways: by forward modeling of the formation and evolution processes and comparison between simulated and observed exoplanet populations (“planet population synthesis,” e.g. Mordasini et al., 2009), through measuring the dependence of planet occurrence rates on fundamental stellar properties such as mass (e.g. Howard et al., 2012; Yang et al., 2020), metallicity (e.g. Fischer & Valenti, 2005; Petigura et al., 2018), or multiplicity (e.g. Wang et al., 2014a, b), and via case studies of individual systems that challenge conventional wisdom about the planet formation process (e.g. Carter et al., 2012; Lopez & Fortney, 2013).
Young exoplanets (1 Gyr) are particularly useful for case studies, as they have had less time to evolve and may therefore have properties that more closely resemble their initial conditions. In older planetary systems, disentangling the effects of planet formation from those of subsequent evolution becomes a more challenging task. However, of the more than 3,300 transiting exoplanets confirmed to date, fewer than 60 (2%) have securely determined ages Gyr.111NASA Exoplanet Archive (Akeson et al., 2013), accessed in March 2021. Thus, there is value in identifying and characterizing young planets. This can be done through careful characterization of previously known exoplanet hosts or through targeted planet searches in samples of known young stars (e.g. Nardiello et al., 2020; Battley et al., 2020).
For transiting exoplanets, which are the focus of this work, examining the time-dependence of the planet radius distribution can yield insights into evolutionary processes and timescales. For example, the discovery of a gap in the radius distribution of close-in (100 d), low-mass (100 ) exoplanets (Fulton et al., 2017) has fueled speculation about its origins. Theoretical studies have demonstrated that a radius gap may result from (1) late-time formation in a gas-poor disk (Lopez & Rice, 2018; Lee & Connors, 2021) or (2) post-formation atmospheric loss via stellar high-energy radiation (“photoevaporation” Owen & Wu, 2013; Lopez & Fortney, 2013), the luminosity of the planet’s cooling core (“core-powered mass loss,” Ginzburg et al., 2018; Gupta & Schlichting, 2019, 2020a), or impacts (Inamdar & Schlichting, 2016; Wyatt et al., 2020). In each of these theories the radius gap emerges and evolves on different timescales. Notably, the theoretical models mentioned also predict larger sizes for sub-Neptunes at earlier times (particularly in the first 100 Myr). Efforts to age-date known exoplanet host stars are providing emerging evidence that the size distribution of small planets continues to evolve over billions of years (Berger et al., 2020; Sandoval et al., 2020) and that the precise location of the radius gap evolves on similar timescales (David et al., 2020). These results are broadly consistent with expectations from the photoevaporation and core-powered mass-loss models. However, the age of any individual field star typically carries large uncertainties.
The TESS mission (Ricker et al., 2015) provides a new opportunity for targeted searches of young exoplanets from precise time-series photometry for millions of targets across most of the sky. For example, the THYME survey has identified several planets in known young associations spanning a diversity of Galactic environments, such as the Tucana-Horologium and Ursa Major moving groups (Newton et al., 2019; Mann et al., 2020), the Scorpius-Centaurus OB association (Rizzuto et al., 2020), the Pisces-Eridanus stream (Newton et al., 2021), and even a previously unknown association (Tofflemire et al., 2021). Other searches of TESS data have revealed planets orbiting young stars in the IC 2602 cluster (Bouma et al., 2020) and in the field (Zhou et al., 2021).
Here we present the discovery of two young planetary systems; first, a system of three exoplanets orbiting a bright (), K-type variable star TOI-2076 (TIC 27491137), and second a single short period exoplanet orbiting its similarly bright comoving companion TOI-1807 (TIC 180695581). Stellar parameters for these targets are given in Tables 1 and 2, and planet parameters derived for each planet are given in Table 4 and 5. We derive ages of Myr and Myr for TOI-2076 and TOI-1807 respectively. With its bright magnitude and close proximity of 41.91 pc in Gaia DR2 (Gaia Collaboration et al., 2018), TOI-2076 presents an rare opportunity to characterise a range of small radius planets orbiting a young, active star. Owing to their young ages, both TOI-2076 and TOI-1807 are excellent candidates for studying the atmospheres of close in planets existing around the transition age where photo-evaporation is theorised to cease. Among short-period, small planets, TOI-1807 is one of the most amenable to phase curve and eclipse spectroscopy.
Section 2 of this paper discusses the TESS observations of TOI-2076 and TOI-1807. Section 3 discusses our corrections to the TESS light curves to obtain more precise photometry, and the model fit of the stellar SEDs and planet transits. Sections 4 and 5 discusses the statistical validation of all planets in these two systems and ground based follow-up. In Section 6 we discuss our age estimates for both targets. We conclude in Section 7 with a discussion of the importance of TOI-2076 and TOI-1807 to the community, and demonstrate that each of these planets is an excellent candidate for further atmospheric follow-up.
| Other identifiers | ||||
|---|---|---|---|---|
| TOI-1807 | TOI-2076 | |||
| TIC 180695581 | TIC 27491137 | |||
| HIP 65469 | — | |||
| TYC 3025-00731-1 | TYC 3036-00481-1 | |||
| Parameter | Description | Value | Value | Source |
| Right Ascension (RA) | 13:25:07.9959 | 14:29:34.2428 | 1 | |
| Declination (Dec) | +38:55:20.9460 | +39:47:25.5450 | 1 | |
| Gaia mag. | 9.680.02 | 8.910.02 | 1 | |
| BP | Gaia BP mag. | 10.260.02 | 9.370.02 | 1 |
| RP | Gaia RP mag. | 8.990.02 | 8.330.02 | 1 |
| TESS mag. | 9.0360.006 | 8.3750.006 | 2 | |
| J | 2MASS J mag. | 8.103 0.023 | 7.6130.020 | 3 |
| H | 2MASS H mag. | 7.605 0.020 | 7.1880.027 | 3 |
| K | 2MASS mag. | — | 7.1150.020 | 3 |
| WISE1 | WISE1 mag. | 7.395 0.03 | 7.010.05 | 4,5 |
| WISE2 | WISE2 mag. | 7.508 0.03 | 7.130.03 | 4,5 |
| WISE3 | WISE3 mag. | 7.445 0.051 | 7.090.03 | 4,5 |
| WISE4 | WISE4 mag. | 7.368 0.115 | 7.00.1 | 4,5 |
| B | Tycho BT mag. | 11.3850.053 | 10.2580.025 | 6 |
| V | Tycho VT mag. | 10.1100.027 | 9.2380.015 | 6 |
| Gaia DR2 proper motion | -124.713 0.027 | -118.2280.036 | 1 | |
| in RA (mas yr-1) | ||||
| Gaia DR2 proper motion | -27.377 0.039 | -6.9730.048 | 1 | |
| in DEC (mas yr-1) | ||||
| Gaia Parallax (mas) | 23.4877 0.0423† | 23.862200.0384 | 1 | |
| Rotation Period (days) | §6.1 |
NOTES:
The uncertainties of the photometry have a systematic error floor applied.
Values have been corrected for the 30 as offset as reported by Lindegren
et al. (2018).
The 2MASS K-band value for TOI-1807 had a reported value and uncertainty of 7.56 +/-9.995 mag. Given questions about its reliability, we exclude it from our analysis and this table.
Not included in the SED analysis.
Sources are: 1Gaia
Collaboration et al. (2018),2Stassun et al. (2018),3Cutri
et al. (2003), 4Cutri & et
al. (2012), 5Zacharias et al. (2017),6]Høg
et al. (2000)
2 Observations
2.1 TESS Photometry
TOI-2076 was observed twice by TESS, once by camera 4 during Sector 16 (11 September - 07 October 2019) and then again by camera 2 during Sector 23 (18 March - 16 April 2020). TOI-1807 was observed in Sector 22 (19 February 2020 to 17 March 2020) and Sector 23. Both targets were observed in two minute cadence mode. The literature properties of both targets are shown in Table 1.
2.1.1 By Eye Search
TOI-2076 was first identified by a student-led, by-eye search. Our by-eye search method was as follows; we downloaded two minute cadence TESS Target Pixel Files (TPFs) for Sector 16 that had been calibrated by the TESS Science Processing Operations Center (SPOC) pipeline, and summed pixels within the pipeline provided aperture to create Simple Aperture Photometry light curves. Outliers were then rejected using a standard deviation of . Stellar variability was subtracted using the flatten tool from the Python package lightkurve222https://github.com/keplerGO/lightkurve, which applied a Savitsky Golay filter over a 1001 cadence window to remove long term trends on time-scales of 1.5 days. The resulting light curve was plotted and visually inspected. Over 500 targets were processed before TOI-2076 was identified as an interesting candidate using Sector 16 data on March 8th 2020.
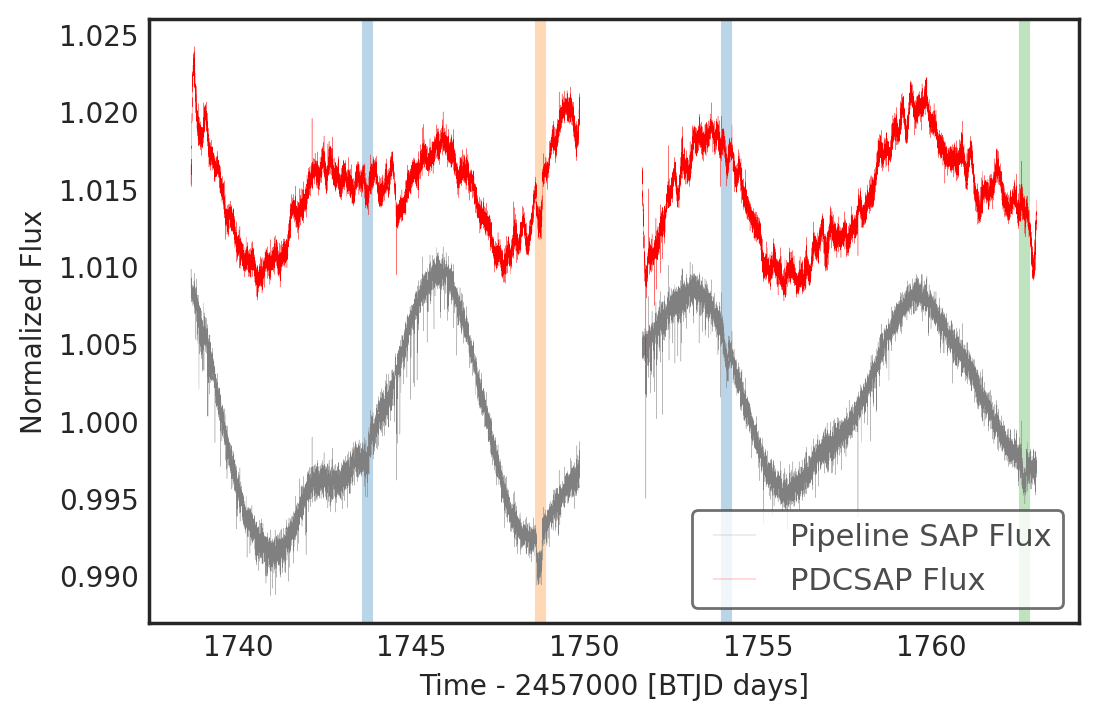
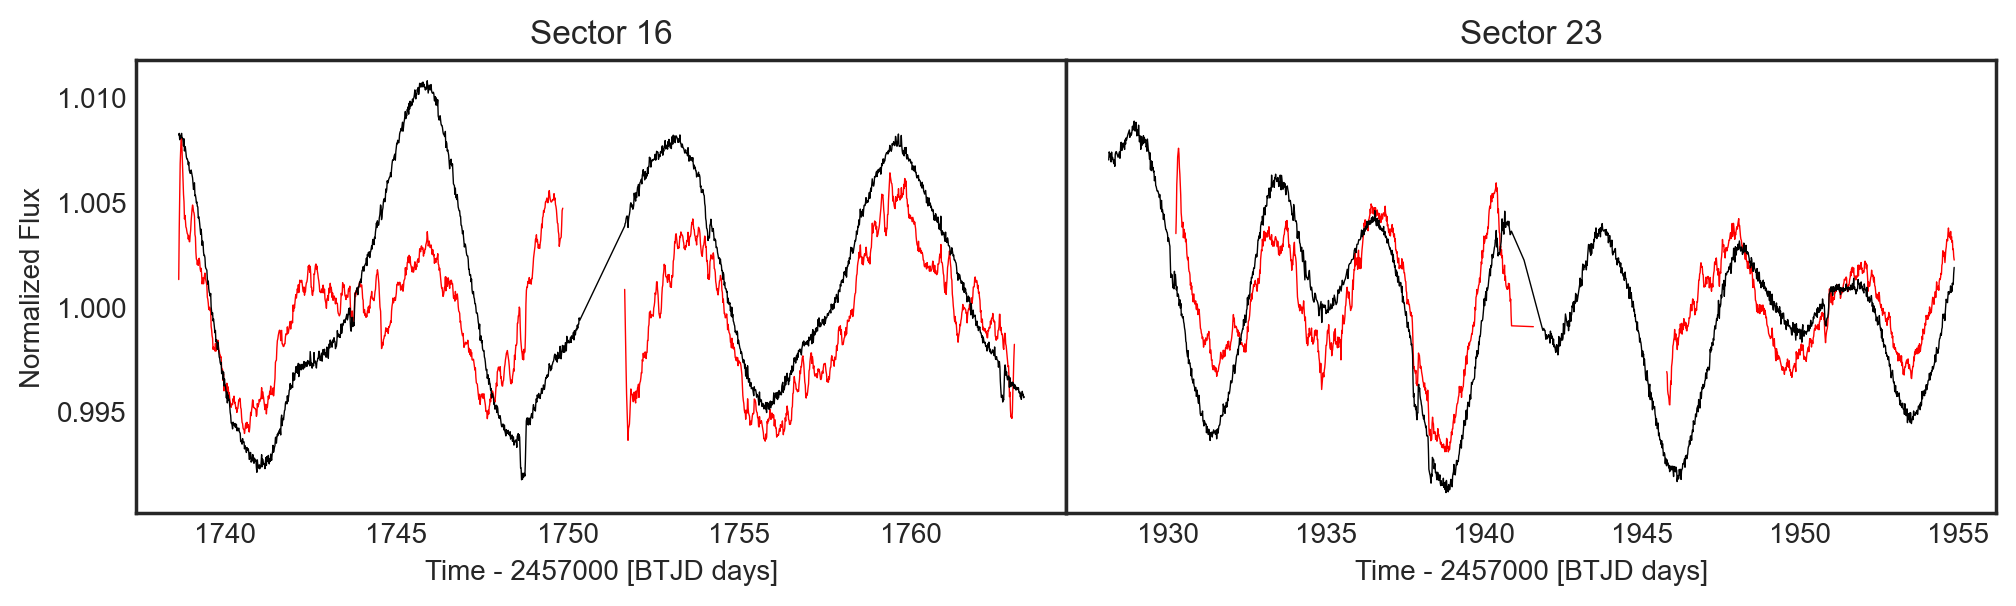
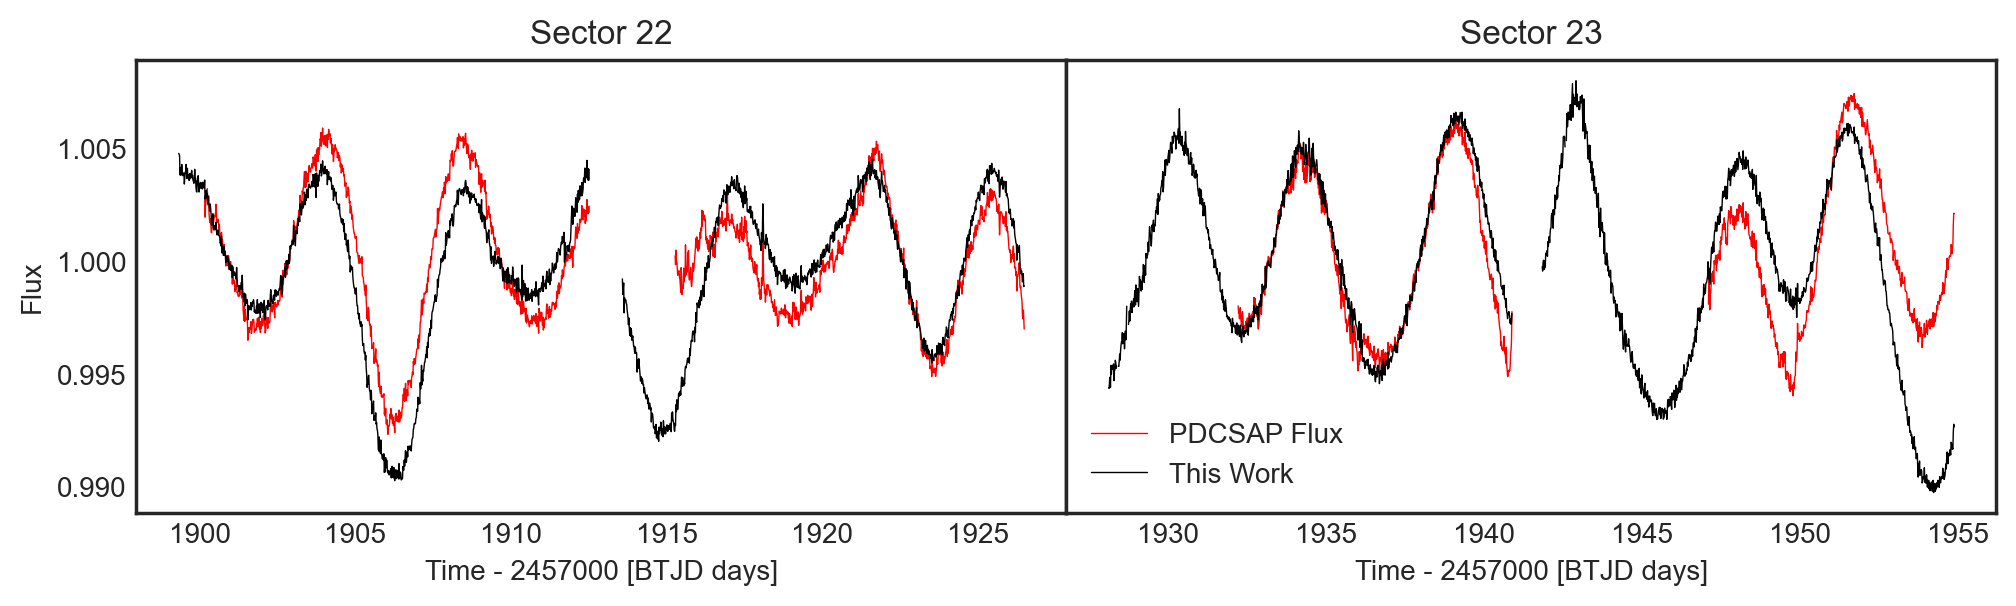
The TESS Pipeline-processed image data for TOI-2076 was accessed by our team in February 2020. The pipeline processed Pre Data-search Conditioned Simple Aperture Photometry (PDCSAP) photometry available at that time for TOI-2076 suffered from spurious, semi-periodic signals with durations on the order of 0.59 days, which is at timescales and amplitudes comparable to the planet transits. This ultimately adversely affected the planet transit search and planet modeling efforts (see Figure 1). By performing a by-eye search of Simple Aperture Photometry (SAP) flux generated from the TPFs, with no systematics corrections applied, our team was able to identify three, high signal to noise transiting objects in the Sector 16 data. We use the techniques described in Section 3 to detrend the SAP flux derived from the TESS products and improve precision before fitting the transits in the data. We later identified TOI-1807 as a comoving target also in the TOI list (see Section 2.2. Our processed light curves for TOI-2076 and TOI-1807 are shown in Figure 2, alongside the PDCSAP flux that was originally obtained. Figure 2 shows that, particularly in the case of TOI-2076, there is an increase in spurious noise, which hampered pipeline detection efforts. Since our access of the data, the TESS pipeline data has been reprocessed, and the new publicly available PDCSAP light curves show greatly improved the correction. We include the original PDCSAP light curves for illustration in Figure 1, compared to the pipeline provided SAP flux.
2.1.2 TESS Mission Transit Detections
The SPOC transit search pipeline (Jenkins, 2002; Jenkins et al., 2010) detected the transit of TOI-1807b in March 2020 with a period of 0.55 d and a radius of 1.52 ± 0.94 R⊕. A limb-darkened transit model was fitted to the light curve (Li et al., 2019) and a suite of diagnostic tests were performed to establish the planetary nature of the signal (Twicken et al., 2018). TOI-1807b passed all the tests, including the odd/even depth test, the ghost diagnostic test, and the difference image centroiding test, which located the source of the transit signature to within 4.9+/-2.7 arcseconds of the target star. This was further reduced to 3.1+2.7 arc sec in the multi-sector search of the combined light curves from sectors 16 and 23 conducted in May 2021. The TESS Science Office vetted the data validation results and issued an alert for TOI-1807b on 15 April 2020.
TOI-2076b was detected by the SPOC pipeline in a search of the sector 16 data on 16 March 2020 at a period of 10.357 d and a radius of 2.57 . It passed all the data validation tests and the difference image centroid test located the transit source to within 2.44+/-2.6 arcsec. The transit signature of TOI-2076c was detected at a period of 33.69 d with a radius of 4.3 R⊕, but was clearly a single transit detection according to the DV report. The difference imaging centroid test indicated that the transit source for TOI-2076c was located within 1.634+/-2.7 arcsec. Alerts for TOI-2076b and TOI-2076c were issued on 15 July 2020.
2.2 Comoving Targets
TOI-2076 and TOI-1807 were identified as a comoving pair of stars by Oh et al. (2017) because, after accounting for geometric projection, their proper motions are consistent with having the same three-dimensional velocity. Using updated astrometry and radial velocity data from Gaia EDR3, the stars have a mean heliocentric distance of 42.3 pc, a physical separation of 9.2 pc, and an angular separation of . While the stars have a proper motion difference of , this is largely due to their large angular separation: the 3D velocity difference between the stars is only (5th and 95th percentile of 0.39 and 1.58 respectively). Even though recent Gaia data confirm that these stars are comoving, their large physical separation suggests that these objects are not a bound wide binary, but could instead be part of a small moving group. The shared formation history, (indicated by their three-dimensional velocity and similar ages), and similar stellar parameters of TOI-2076 and TOI-1807 make them a further interesting laboratory for testing planet formation theory.
3 Data Analysis
After identifying TOI-2076 as a planet host by eye, and TOI-1807 as a comoving planet host among the public TOI list, we perform the following analysis to extract the planet parameters. In this analysis we use the lightkurve Python package to create Simple Aperture Photometry (SAP) light curves of TOI-2076 from the TESS SPOC pipeline (Jenkins et al., 2016) Target Pixel Files (TPFs). Sky background light from Earth is a significant systematic in TESS, which the pipeline corrects in TPF products. In this work, we use TPFs without background subtraction, since the SPOC pipeline masks cadences where the background is estimated to be severe, leading to data loss. Instead, we perform a bespoke background correction that includes these cadences, in order to preserve the most time-series data. This correction is discussed in Section 3.1.
3.1 Light curve creation
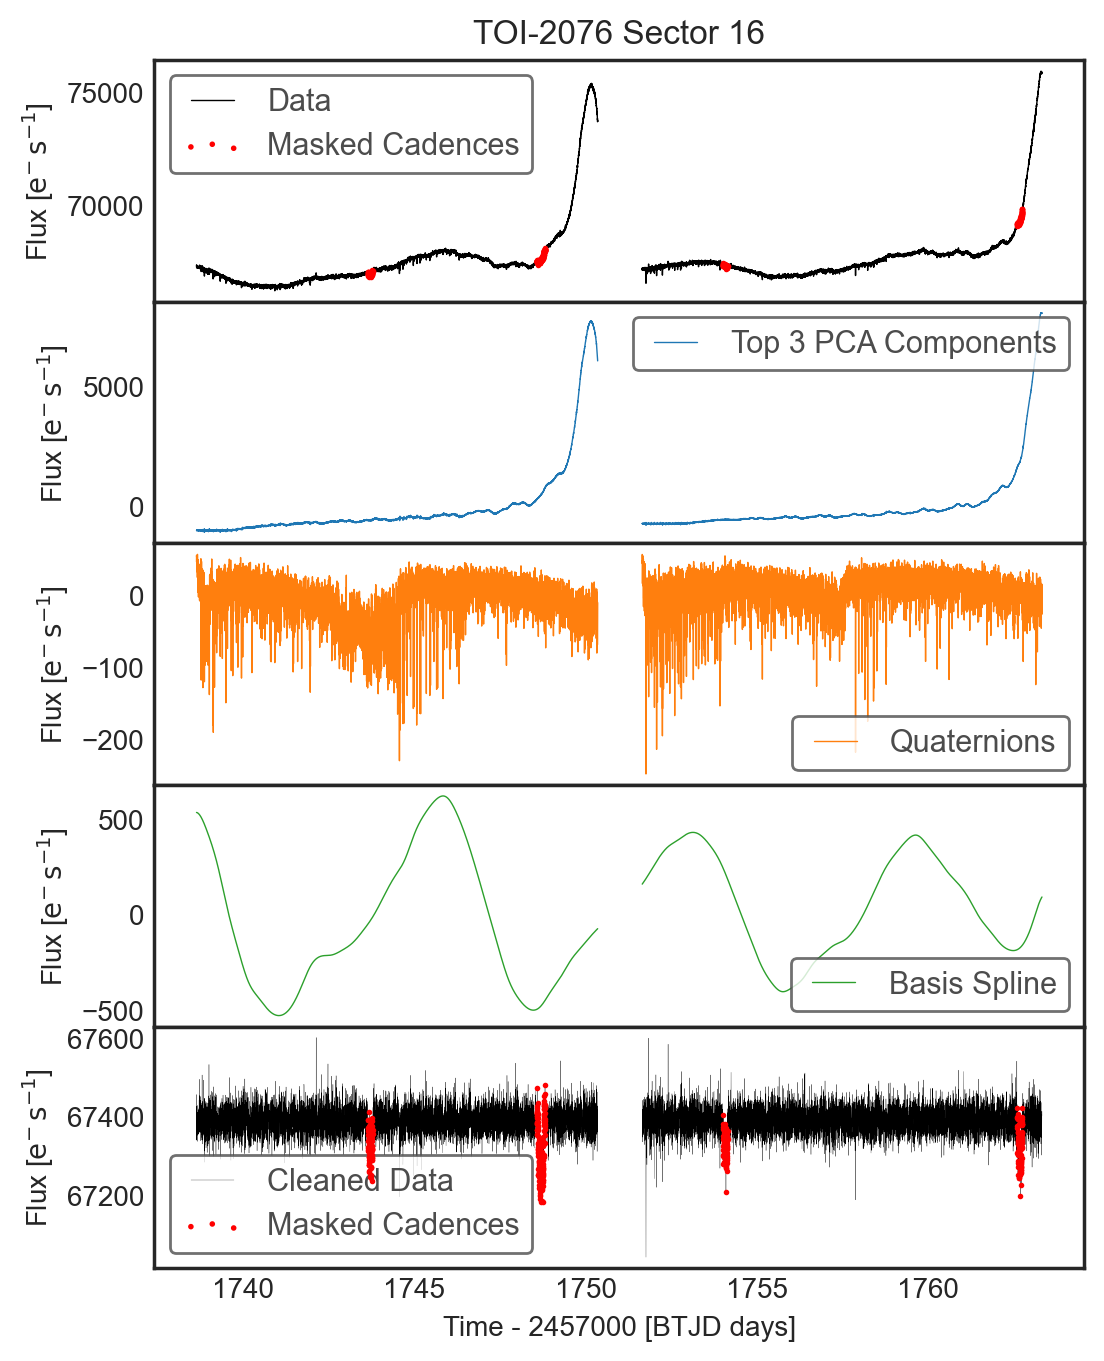
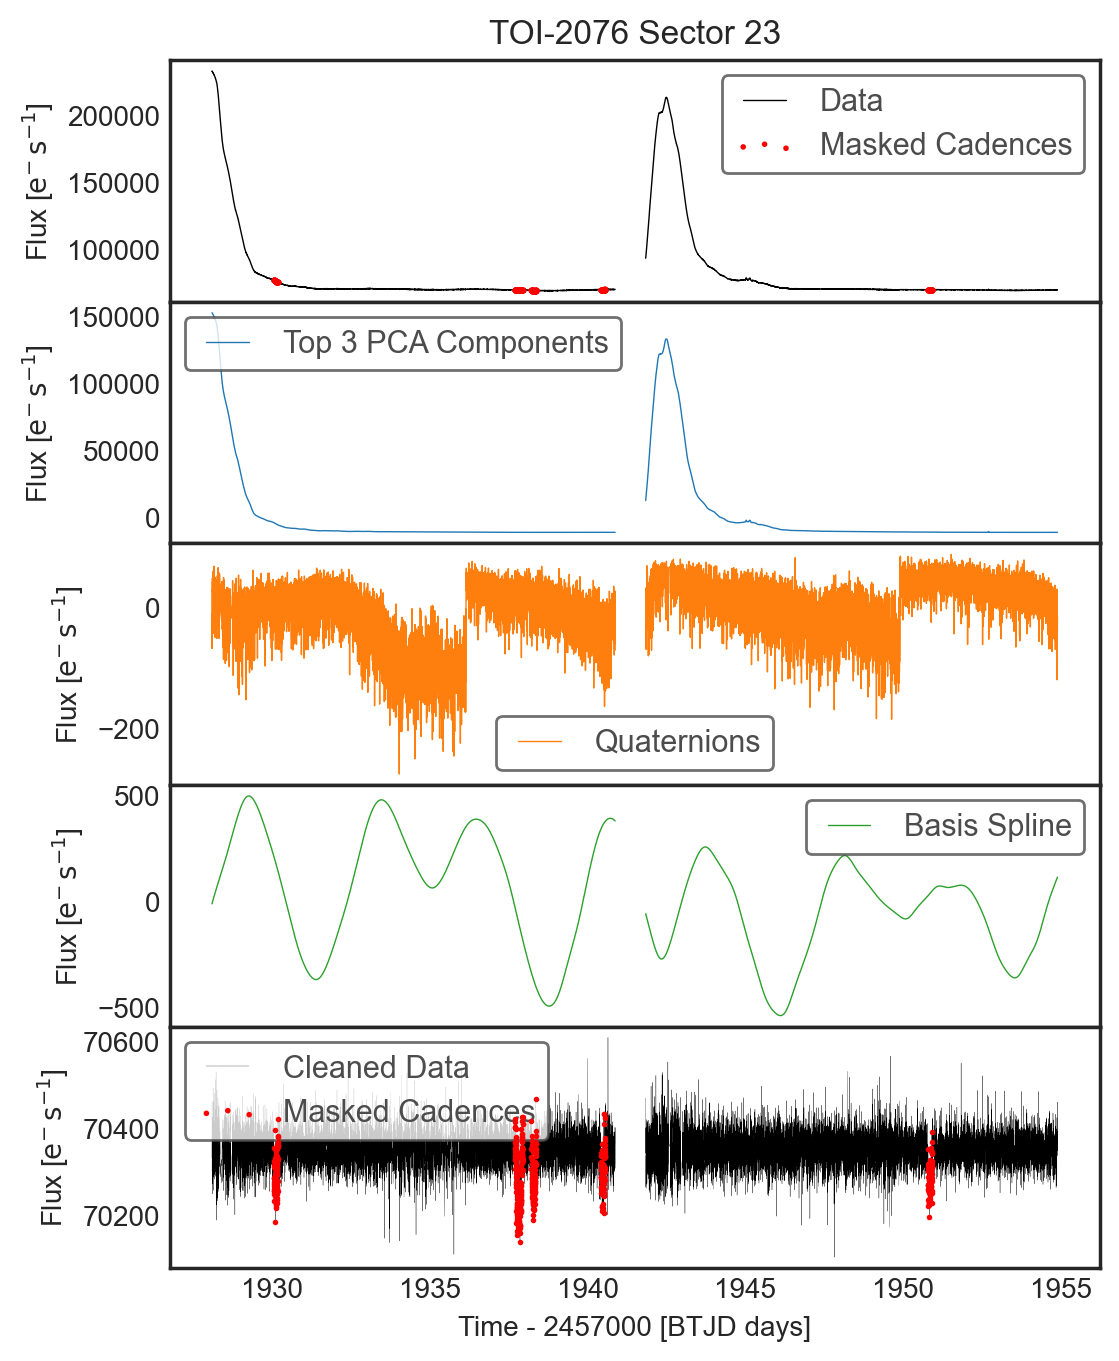
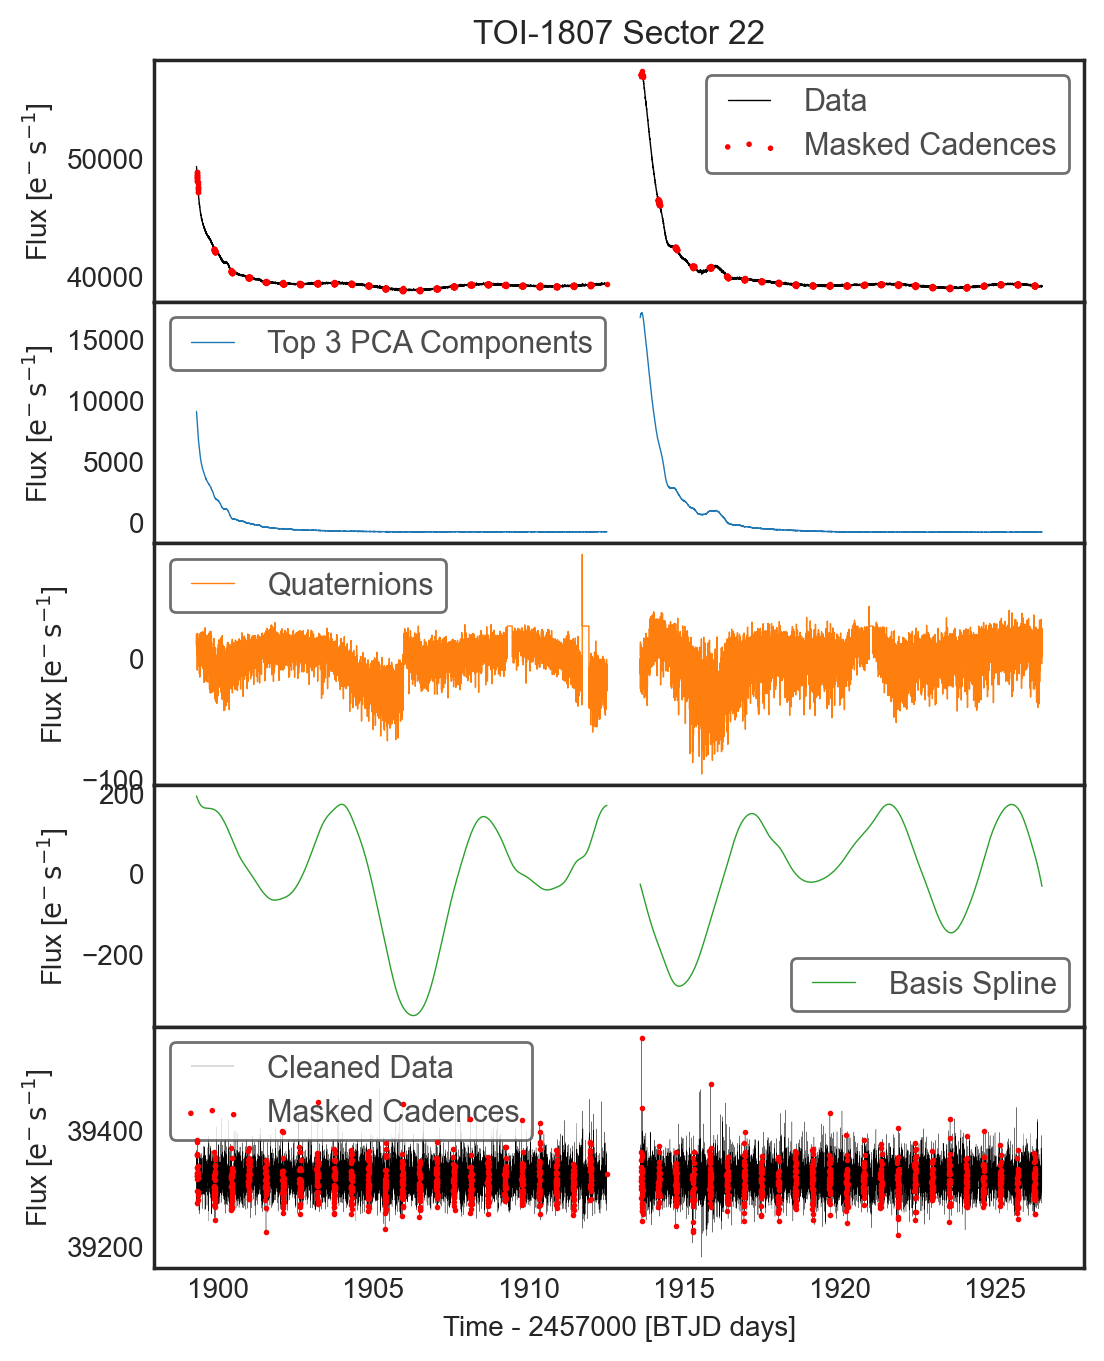
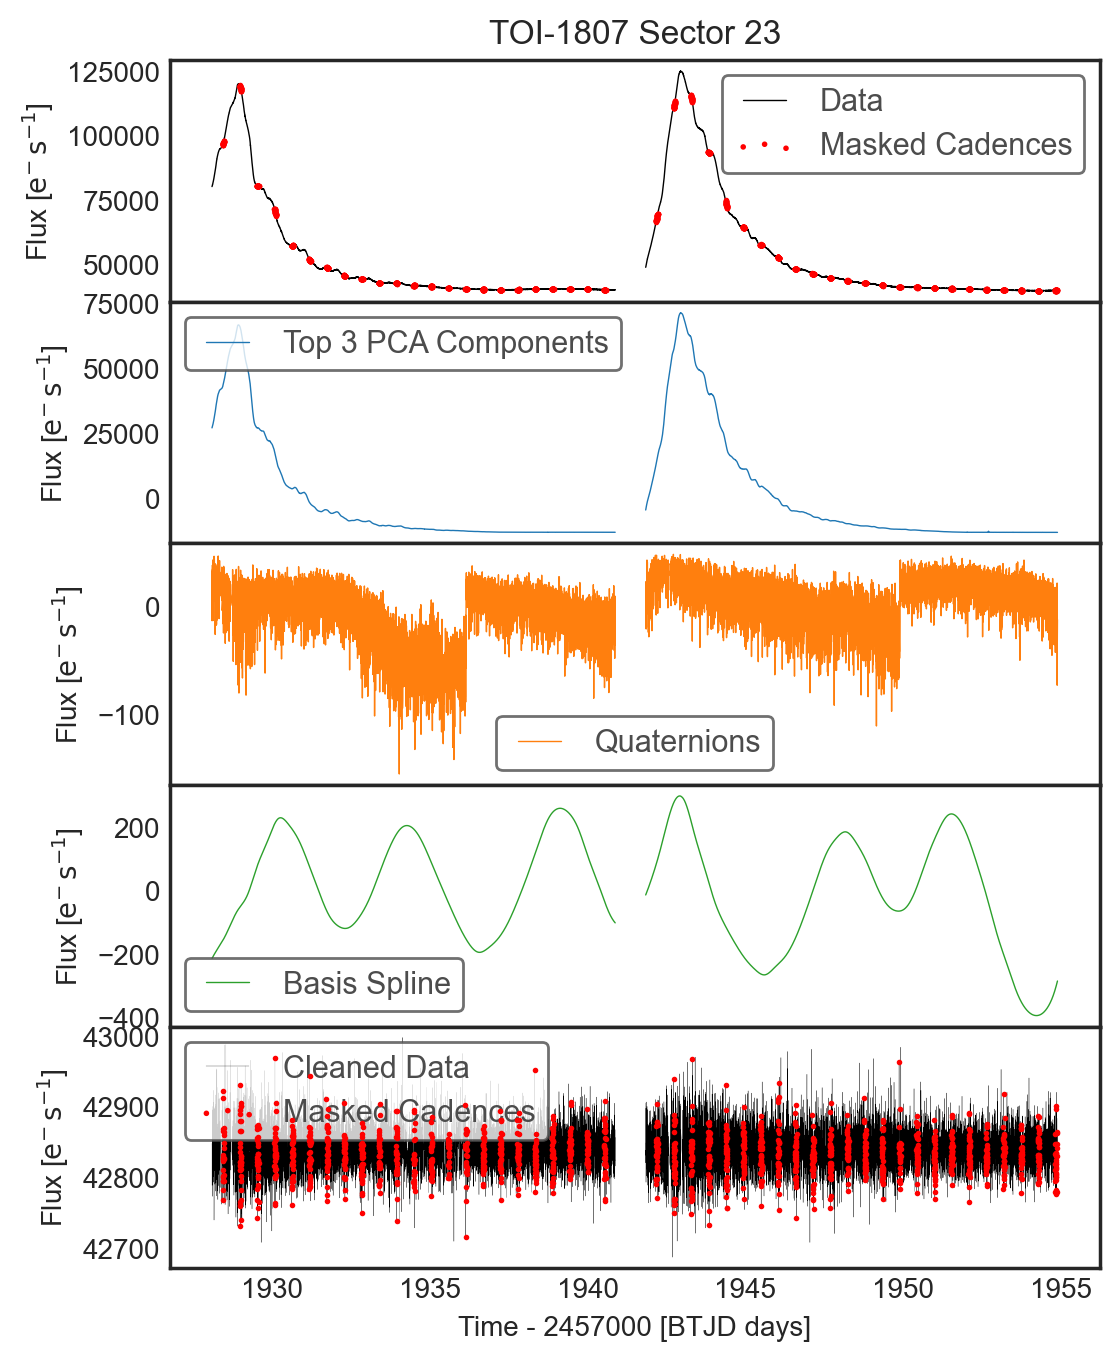
We create light curves for TOI-2076 and TOI-1807 using the following procedure. The results of this procedure are shown in Figure 3.
-
•
Using our basic, mean-normalized SAP flux light curves from Section 2.1, we estimate periods, transit mid-points and durations for each transiting planet.
-
•
We use the TESS Pipeline TPF products for TOI-2076 in Sector 16 and 23, and for TOI-1807 from Sector 22 and 23, conservatively removing cadences where the quality flags are consistent with "Coarse Point", "Desaturation", or "Argabrightening" (flags 4, 32 and 16) which cause significant outliers. TPFs are delivered with a background light estimate subtracted by the pipeline. We use the FLUX_BKG keyword in the TPF FITS files to add the TESS Pipeline background correction back into the TPF (resulting in uncorrected, but calibrated TPFs). As discussed above, (this enables us to perform a bespoke background correction, and preserve more data that the pipeline flags as poor quality close to the data downlink).
-
•
We build light curves from the TPFs using the pipeline provided apertures. Since these stars are isolated and the TESS pipeline estimates that more than 99.9% of the light in the apertures comes from the target stars (based on the pipeline’s crowding metric), contamination from background sources is negligible, and we do not apply a dilution correction.
-
•
We detrend these light curves to remove the background signal, using lightkurve’s RegressionCorrector tool. We model the light curve as a linear combination of 1) the top 3 components of the pixels outside the aperture using singular value decomposition (SVD) 2) A vector containing i) the mean and ii) the standard deviation of each of the three quaternions (available in the TESS engineering data, see Vanderburg et al. 2019) during each individual TESS exposure to account for TESS jitter. 3) A basis spline with 80, evenly space knots between the start and end of the sector to capture the stellar variability. We fit this model, using Gaussian priors, masking out cadences that we expect to contain transiting planet signals.
This procedure results in light curves with long term stellar variability removed, while transits remain intact in the dataset. Using the estimate_cdpp method from lightkurve we estimate the photometric precision of all the light curves to determine the improvement in precision we obtain. The official TESS pipeline computes the Combined Differential Photometric Precision (CDPP) metric using a wavelet-based algorithm to calculate the signal-to-noise of the specific waveform of transits of various durations (see Christiansen et al., 2012). In the lightkurve implementation, we use the simpler “sgCDPP proxy algorithm” discussed by Gilliland et al. (2011) and Van Cleve et al. (2016). Using this estimate the PDCSAP light curves available in 2020 for TOI-2076 and TOI-1807 have a sgCDPP of 100 and 164 respectively for a 1 hour transit duration in parts per million (PPM). The procedure we describe here reduces the sgCDPP to 82 and 86 PPM respectively, which indicates a significant reduction in noise. Having improved the precision of the light curves, we re-searched both TOI-2076 and TOI-1807 light curves to search for any shallower transiting signals using a simple Box Least Squares (BLS), but find no evidence of additional planets.
We use lightkurve and astropy to perform a basic Box Least Squares (BLS) search for transiting signals in the light curves of both targets. We identify 3 transiting objects around TOI-2076 with periods of 10.35d, 17.19d and 25.08d, and transit depths of 91319ppm, 190628ppm, and 118132. TOI-2076b transits 4 times during Sector 16 and Sector 23. TOI-2076c and TOI-2076d transit once in each in Sector 16, and once each in Sector 23. We identify a single transiting object around TOI-1807 during Sector 22 and Sector 23. Using a simple BLS, TOI-1807b has a period of 0.55d and a transit depth of 27111.
3.2 Spectroscopic Stellar Parameters
In order to refine the stellar parameters upon which the planetary parameters depend, we fit the stellar spectra and stellar spectral energy distributions (SEDs) for TOI-2076 and TOI-1807.
We obtained two reconnaissance spectra of TOI-2076 on UT2020-02-20 and UT2020-02-24, using the 1.5 m Tillinghast Reflector Echelle Spectrograph (TRES; Furesz, 2008) located at the Fred Lawrence Whipple Observatory (FLWO) in Arizona, USA. For TOI-1807, we obtained two spectra on UT2020-05-31 and UT2020-07-01 with the FIbre-fed Echelle Spectrograph (FIES; Telting et al., 2014) at the 2.56 m Nordic Optical Telescope (NOT) in La Palma, Spain, and another spectrum with TRES on UT2020-07-19. TRES has a resolving power of 44,000 with wavelength coverage from 3860-9100 Å, while FIES offers a resolution of 67,000 and covers the range 3760-8220 Å.
All the spectra are extracted as described in Buchhave et al. (2010). We derive stellar parameters using the Stellar Parameter Classification tool (SPC, Buchhave et al., 2012, 2014). SPC compares an observed spectrum against a grid of synthetic spectra based on Kurucz atmospheric models (Kurucz, 1992). We analyze each spectrum independently to obtain the effective temperature (), surface gravity (), metallicity ([m/H], a solar mix of metals rather than Fe alone), and projected rotational velocity (sin). The individually derived parameters agree to within their respective uncertainties, and we report their weighted average: TOI-2076 has =522750K, =4.560.10, [m/H]=-0.150.08. TOI-1807 has =483050K, =4.650.10, [m/H]=-0.090.08, sin=4.30.5 km/s. These values are derived from spectra alone. These estimates are used to inform our SED fit in §3.3.
3.3 Spectral Energy Distribution
To determined the properties of both host stars, we perform a Spectral Energy Distribution (SED) fit of the broadband photometry from Gaia DR2 (Gaia Collaboration et al., 2018), 2MASS (Cutri et al., 2003), and WISE (Cutri & et al., 2012; Zacharias et al., 2017) using the publicly available exoplanet fitting suite, EXOFASTv2 (Eastman et al., 2013, 2019). We place a Gaussian prior on the Gaia DR2 parallax of 23.8620.0384 mas for TOI-2076 and 23.4880.042 mas for TOI-1807, which have been corrected for the known offset as described in Gaia Collaboration et al. (2018). We also place Gaussian priors on the metallicities determined by analyzing the TRES spectra (see §3.2) and host star ages (0.1880.053 Gyr for TOI-2076 and 0.170.04 Gyr for TOI-1807; see §6.1). Using the galactic dust maps from Schlegel et al. (1998) & Schlafly & Finkbeiner (2011), we place upper limits on the line of sight extinction of 0.02635 mag (TOI-2076) and 0.0313 mag (TOI-1807). The resulting best fit parameters and the 68% confidence intervals are shown in Table 2.
| Parameter | Units | Values | Values |
|---|---|---|---|
| TOI-2076 | TOI-1807 | ||
| Stellar Parameters: | |||
| Mass () | |||
| Radius () | |||
| Luminosity () | |||
| Bolometric Flux (cgs) | |||
| Density (cgs) | |||
| Surface gravity (cgs) | |||
| Effective Temperature (K) | |||
| Metallicity (dex) | |||
| Initial Metallicity1 | |||
| Age (Gyr) | |||
| Equal Evolutionary Phase2 | |||
| V-band extinction (mag) | |||
| SED photometry error scaling | |||
| Parallax (mas) | |||
| Distance (pc) | |||
| Inferred Rotation Rate(d) | |||
3.4 Planet Model Fit
We use the exoplanet package333https://docs.exoplanet.codes/en/stable/ (Foreman-Mackey et al., 2020) and pymc3 (Salvatier et al., 2016) to fit the transit signals, given the best fit stellar parameters derived above, using the light curves from our correction procedure described in Section 3.1. exoplanet is a probabalistic model, which allows us to create distributions for each parameter and jointly model them. Using exoplanet we are able to sample each parameter using MCMC, including any derived parameters (e.g. semi-major axis is derived from period and the stellar properties). In the case of TOI-2076, we jointly fit a single set of stellar parameters (i.e. stellar density and limb darkening) and three transiting planets.
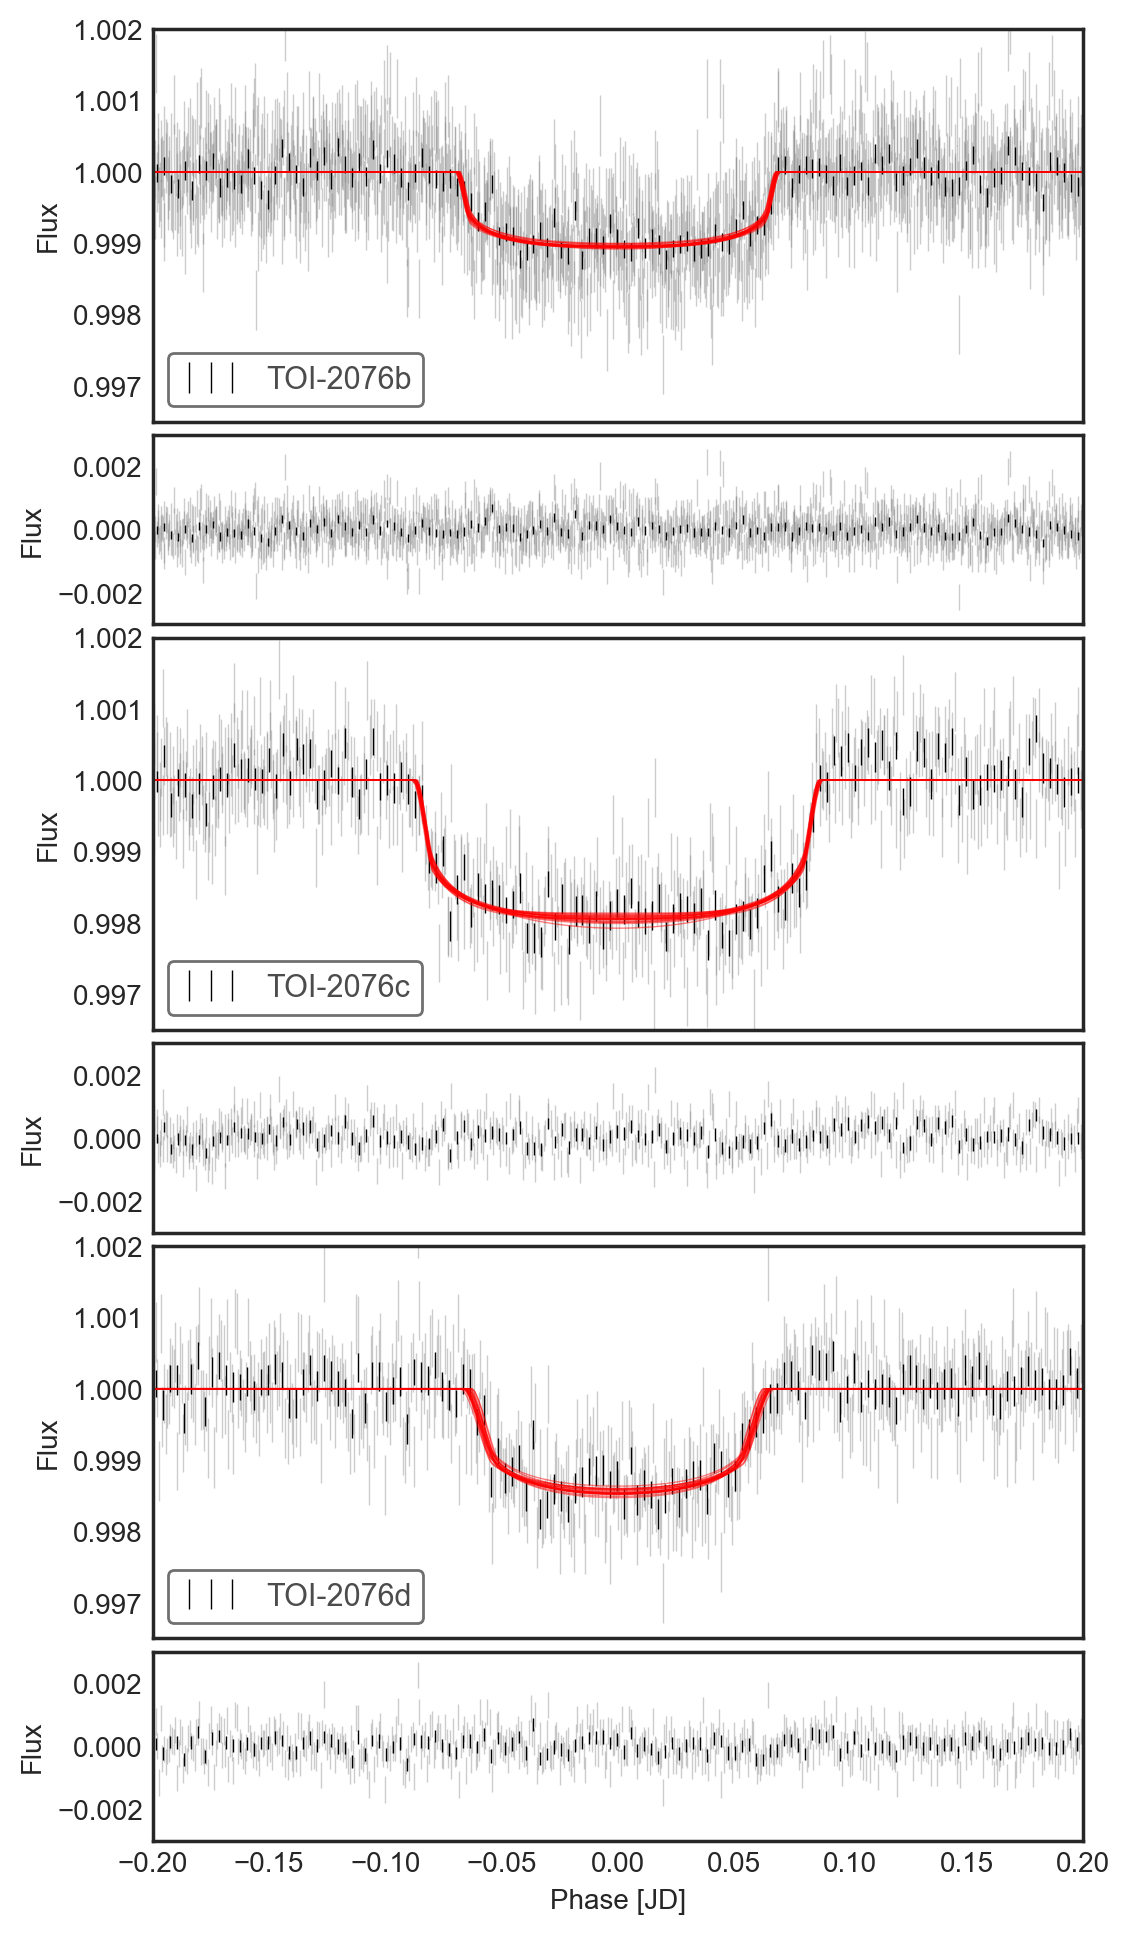
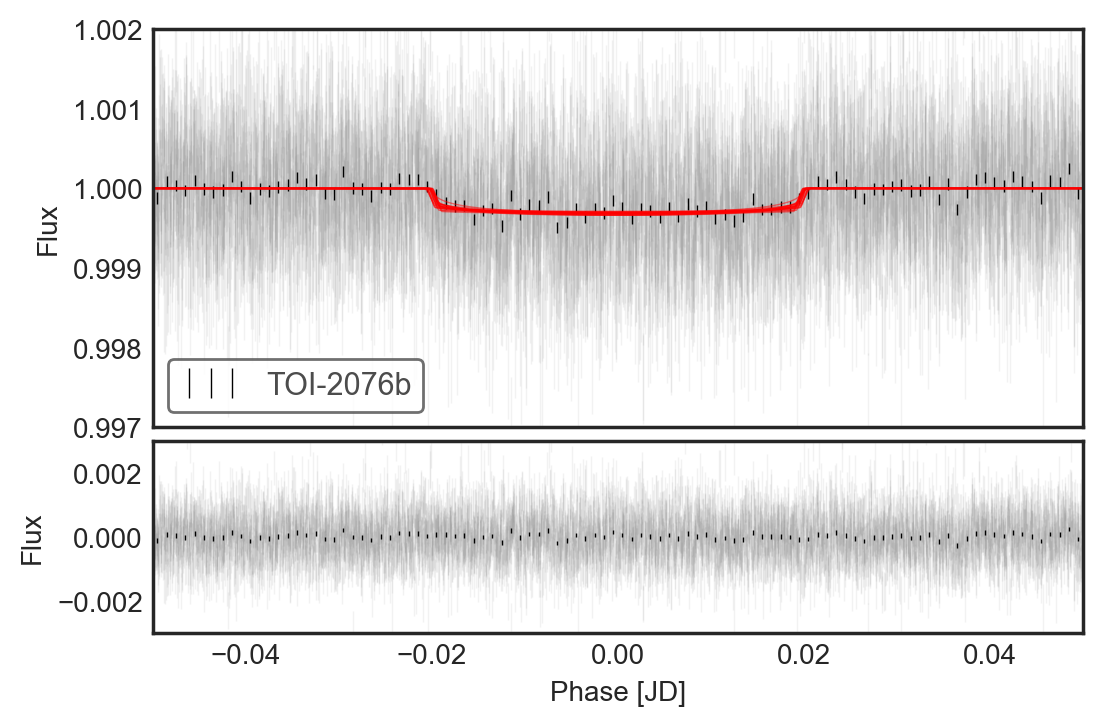
To fit the transiting planets in the dataset, we first remove stellar variability. We use the spline term from our fit to detrend the stellar variability by dividing the light curve by the best fit spline component from Section 3. Since the stellar variability is long period, we assume that the stellar variability can be adequately detrended, and does not require a joint fit with planet parameters. In the case of TOI-1807, we tested a joint fit for stellar variability and transits and found no significant improvement. For TOI-1807, we fit a single planet model, and for TOI-2076 we fit a model consisting of three planets, in circular orbits, simultaneously. We assume that eccentricity cannot be measured using these data, as there are relatively few transits of each planet. (We explore eccentricities and period aliases of planets c and d in Section 3.6.) We fit for period, transit-midpoint, planet radius, impact parameter and limb darkening in our model, and set the starting stellar parameters to those derived above, with Gaussian priors. We find the maximum likelihood fit, and then use an MCMC No-U-Turn Sampler to find errors on each variable. The priors of our model are given in Table 3, and results of this fit are shown in Table 4 and 5 and Figure 4, which shows good agreement with the data. We marginalize over the errors in the stellar parameters from Section 3.3.
| \topruleParameter | Distribution | TOI-1807b | TOI-2076b | TOI-2076c | TOI-2076d |
|---|---|---|---|---|---|
| R∗ [] | Normal | 0.680 0.015 | 0.761 0.016 | 0.761 0.016 | 0.761 0.016 |
| [cgs] | Normal | 3.36 0.023 | 2.72 0.027 | 2.72 0.027 | 2.72 0.027 |
| Normal | 4757K 51K | 5187K 54K | 5187K 54K | 5187K 54K | |
| QuadLimbDark1 | [0.525, 0.215] | [0.525, 0.215] | [0.525, 0.215] | [0.525, 0.215] | |
| t0 [BTJD] | Normal | 1899.34 0.1 | 1743.72 0.1 | 1748.69 0.1 | 1762.66 0.1 |
| [d] | Normal | 0.549d 0.1d | 10.3562 0.01d | 17.1932 0.01d | 25.0893 0.01d |
| [] | Uniform | 0.0001 .. 0.3 | 0.0001 .. 0.3 | 0.0001 .. 0.3 | 0.0001 .. 0.3 |
| ImpactParameter1 |
1 The QuadLimbDark and ImpactParameter prior distributions are provided in the exoplanet package. The QuadLimbDark is an uninformative prior based on the implementation discussed in Kipping (2013b). ImpactParameter is a uniform prior between 0 and 1+
| \topruleParameter | Description | Value | ||
|---|---|---|---|---|
| R∗ | Radius [] | 0.7622 | ||
| Density [cgs] | 2.244 | |||
| u1 | Limb Darkening Coeff 1 | 0.219 | ||
| u2 | Limb Darkening Coeff 2 | 0.451 | ||
| \topruleParameter | Description | b | c | d |
| RP | Radius [] | 3.282 | 4.438 | 4.14 |
| Rp/R∗ | Planet Radius/Star Radius | 0.0395 | 0.0534 | 0.0498 |
| P | Period [days] | 10.35566 | ||
| t0 | Transit Mid Point [JD] | 2458847.2776 | 2458834.6615 | 2458837.9363 |
| i | Inclination [∘] | 88.9 | 89.84 | 88.607 |
| b | Impact Parameter | 0.342 | 0.07 | 0.78 |
| Semi-Major Axis [AU] | 0.0631 | 0.0885 | 0.1138 | |
| Semi-Major Axis / R∗ | 17.79 | 24.9 | 32.1 | |
| t14 | Duration [hours] | 3.326 | 4.215 | 3.2 |
| Teq | Equilibrium Temp [K] | 870 | 734 | 648 |
| tdepth | Transit Depth | 0.001047 | 0.001943 | 0.001445 |
Note periods for planet c and d are omitted, see Section 3.6
| \topruleParameter | Description | Value |
| R∗ | Radius [] | 0.6802 |
| Density [cgs] | 3.374 | |
| u1 | Limb Darkening Coeff 1 | 0.304 |
| u2 | Limb Darkening Coeff 2 | 0.152 |
| \topruleParameter | Description | b |
| RP | Radius [] | 1.849 |
| Rp/R∗ | Planet Radius/Star Radius | 0.0249 |
| P | Period [days] | 0.549372 |
| t0 | Transit Mid Point [JD] | 2457000.166 |
| i | Inclination [∘] | 77.7 |
| b | Impact Parameter | 0.546 |
| Semi-Major Axis [AU] | 0.00812 | |
| Semi-Major Axis / R∗ | 2.57 | |
| t14 | Duration [hours] | 0.972 |
| Teq | Equilibrium Temp [K] | 2100 |
| tdepth | Transit Depth | 0.000312 |
3.5 Phase Curve Modeling
TOI-2076b is a short period, hot planet with an equillibrium temperature of 2000K. Given the high signal to noise light curve of the bright host star, it may be possible to use the TESS data to identify a phase curve; a simple calculation of the maximum surface brightness ratio of TOI-2076b gives an eclipse depth of 20ppm. We additionally fit a transit model for TOI-1807 with an eclipse and phase curve component, jointly fitting stellar variability. Using this approach, we are unable to detect a significant phase curve using the TESS data.
We additionally undertook the following search for a phase curve in the TESS Pipeline Products. First, the transits of TOI-1807 and the expected occultation events were removed from the observed TESS light curve. The photometry was separated into segments defined by each TESS orbit, then normalized by their average flux offset and detrended using a linear function that best-fit each light curve segment. (We note that detrending each segment by a higher degree polynomial did not significantly alter our results.) Significant stellar variability was removed from the light curve by subtracting the two strongest sinusoidal signals detected in a Lomb-Scargle periodogram of the out-of-transit light curve at 4.34 days and 6.06 days. Finally, the variability corrected out-of-transit light curve was fit with a double harmonic sinusoidal model to search for an atmospheric phase curve signature at the orbital period of TOI-1807b. The double harmonic sinusoidal model is defined as
| (1) |
where is the flux normalization offset and , , and represent the effects of planetary emission/reflection, Doppler boosting, and ellipsoidal variations, respectively. To determine the significance of the best-fit phase curve model, the reduced statistic was compared to that of a horizontal line.
Regardless of whether we used 1) the TESS Pipeline SAP photometry 2) PDCSAP photometry, 3) a correction for stellar variability, or 4) a higher-order polynomial (up to 10th degree) to detrend the light curve, we did not detect a significant atmospheric phase curve for TOI-1807b. In all cases, the best-fit phase curve model was either consistent with a horizontal line or exhibited a 3 significance phase curve shape that is inconsistent with the expected shape of a planetary atmospheric phase curve.
We conclude that, using the TESS data alone, there is no detectable phase curve for TOI-1807b. However, TESS data from future cycles may increase signal to noise, or additional data at redder wavelengths, may reveal a phase curve for this planet. TOI-1807 will be observed again by TESS in Sector 49, in February 2022.
3.6 Period Aliases of TOI-2076c and TOI-2076d
We find best fit periods for TOI-2076c and TOI-2076d of d and d respectively. Our best fit periods reflect the shortest period, in each case, that is consistent with the data. However, due to the long gap between TESS observations, many aliased periods are also fit well by the data.
To find the best fitting periods for TOI-2076c and TOI-2076d, we first recalculate the best fit model for TOI-2076b/c/d, relaxing our assumptions of a Keplerian orbit. Instead, we fit a "simple" orbit, where each planet occults the star, not on a circular orbit, but traveling on a straight path. This occultation is parameterised by the velocity of the planet. By adopting this approach, none of the parameters are forced by our prior knowledge of Keplarian laws (which link, for example, duration and impact parameter), and each parameter (e.g. impact parameter) is only constrained by the data itself. We set up this model such that each planet passes in front of the same star, with the same radius and limb darkening parameters, and use MCMC (e.g. see Section 3.4) to vary all parameters in our model.
We perform a Monte Carlo analysis combining the posteriors from the simple transit fit with inferences based on both 1) dynamical stability and 2) the window function of allowed orbital periods derived from the observation times of the TESS sectors. This method of constraining orbital periods follows the line of analysis in Vanderburg et al. (2016) and Becker et al. (2019). For each link of the transit fit posterior, we take parameters for each planet and then numerically solve the following equation for , the planetary orbital period (see Seager & Mallén-Ornelas, 2003):
| (2) |
The parameters taken from the observationally-derived posterior include , which is the transit duration of the planet, , which is the planetary radius, , which is the planetary mass, , which is the orbital eccentricity, , which is the longitude of periastron, , which is the planet’s impact parameter, and , which are the stellar radius and mass. Additional parameters that cannot be directly derived from the light curve must be computed: the planet mass () is inferred using the mass-radius relation of Wolfgang et al. (2016), was chosen using a beta distribution prior with shape parameters and (Kipping, 2013a, 2014; Kipping & Sandford, 2016), and then was chosen using Equation 19 of Kipping & Sandford (2016). Finally, is defined as the gravitational constant. For each link of the posterior, we solve Equation 2 numerically for each planet to derive the orbital period that corresponds to the observed parameters.
Once a set of two orbital periods (one for TOI-2076c and one for TOI-2076d) have been computed from a single link, we check two markers of dynamical instability: whether the chosen initial parameters are Hill unstable (Fabrycky et al., 2014), and whether the computed secular oscillation amplitudes in eccentricity (computed using the Laplace-Lagrange secular disturbing function, see Murray & Dermott, 1999) result in orbits that cross. If either of those conditions are met, the link is thrown out; if not, the computed periods are kept and used to construct a probability density function for orbital periods that are consistent with the data and also likely dynamically stable. We then combine that with the baseline prior (see Equation 1 of Becker et al. 2019 and the general form in Equation 2 of Dholakia et al. 2020) to construct a final probability density function for each possible orbital period. The baseline prior also corrects this final probability to zero for any orbital period where a third transit should have been observed anywhere in the TESS data.
Using this final probability density function for each planet’s orbital period, we check each possible orbital period (corresponding to an positive integer number of conjunctions in between the two observed transits) and normalize the probabilities using those discrete values as the only possible orbital periods. For TOI-2076d, the mostly likely orbital period is 25.089 days (with a 60% probability), which corresponds to a circular orbit. The next most likely orbital period is 29.271 days, followed by 35.125 days and 43.906 days. For TOI-2076c, a secure determination of a best candidate period cannot be made. Orbital periods which have a greater than 10% chance of being correct given the above analysis include (in order of computed likelihood) 23.641 days, 21.014 days, 27.018 days, 18.913 days, and 17.193 days. Of these, 18.913 days and 17.193 days had the greatest positive correlation in occurrence with the 25.089 day orbital period for TOI-2076d. The 17.193 orbital period for TOI-2076c also corresponds to a circular orbit.
To characterize the full state of the system, it is important to confirm the true orbital periods and subsequently refine the ephemerides and limits on transit timing variations. The determination of TOI-2076d’s orbital period is likely to be more straightforward, given the strong preference for the 25.089 day solution. TOI-2076c will be harder to constrain. We discuss ground-based data of TOI-2076 in the context of TOI-2076c in Section 5.
4 Vetting and Validation
In this Section we discuss the validation of the planet candidates around TOI-2076 and TOI-1807. In Section 4.1 we discuss the constraints on contamination by background objects, using archival data and show that archival data are able to rule out contamination for TOI-1807. In Section 4.2 we show there are no significant centroid offsets during transit, indicating that TOI-2076 and and TOI-1807 are both the true sources of the planet signal. In Section 5.2, we use the TRICERATOPS toolkit (Giacalone et al., 2021) to show that there is a very small false probability chance in either the case of TOI-2076 or TOI-1807.
We additionally note that Gaia DR2 provides the Renormalized Unit Weight Error (RUWE) (Lindegren, 2018) to determine whether Gaia astrometric fits are good. A value significantly above 1 indicates that a single source is not a good fit to the data. TOI-2076 has a RUWE of 1.0857, and TOI-1807 has a RUWE of 1.07523, suggesting that they are consistent with being single stars.
4.1 Contamination (Archival Data)
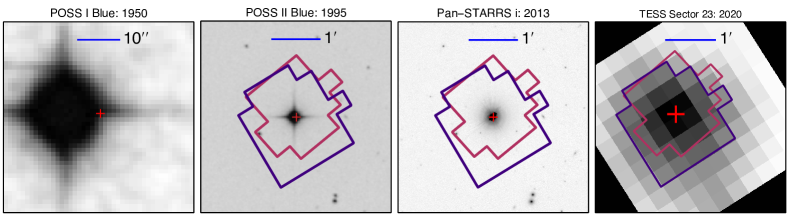
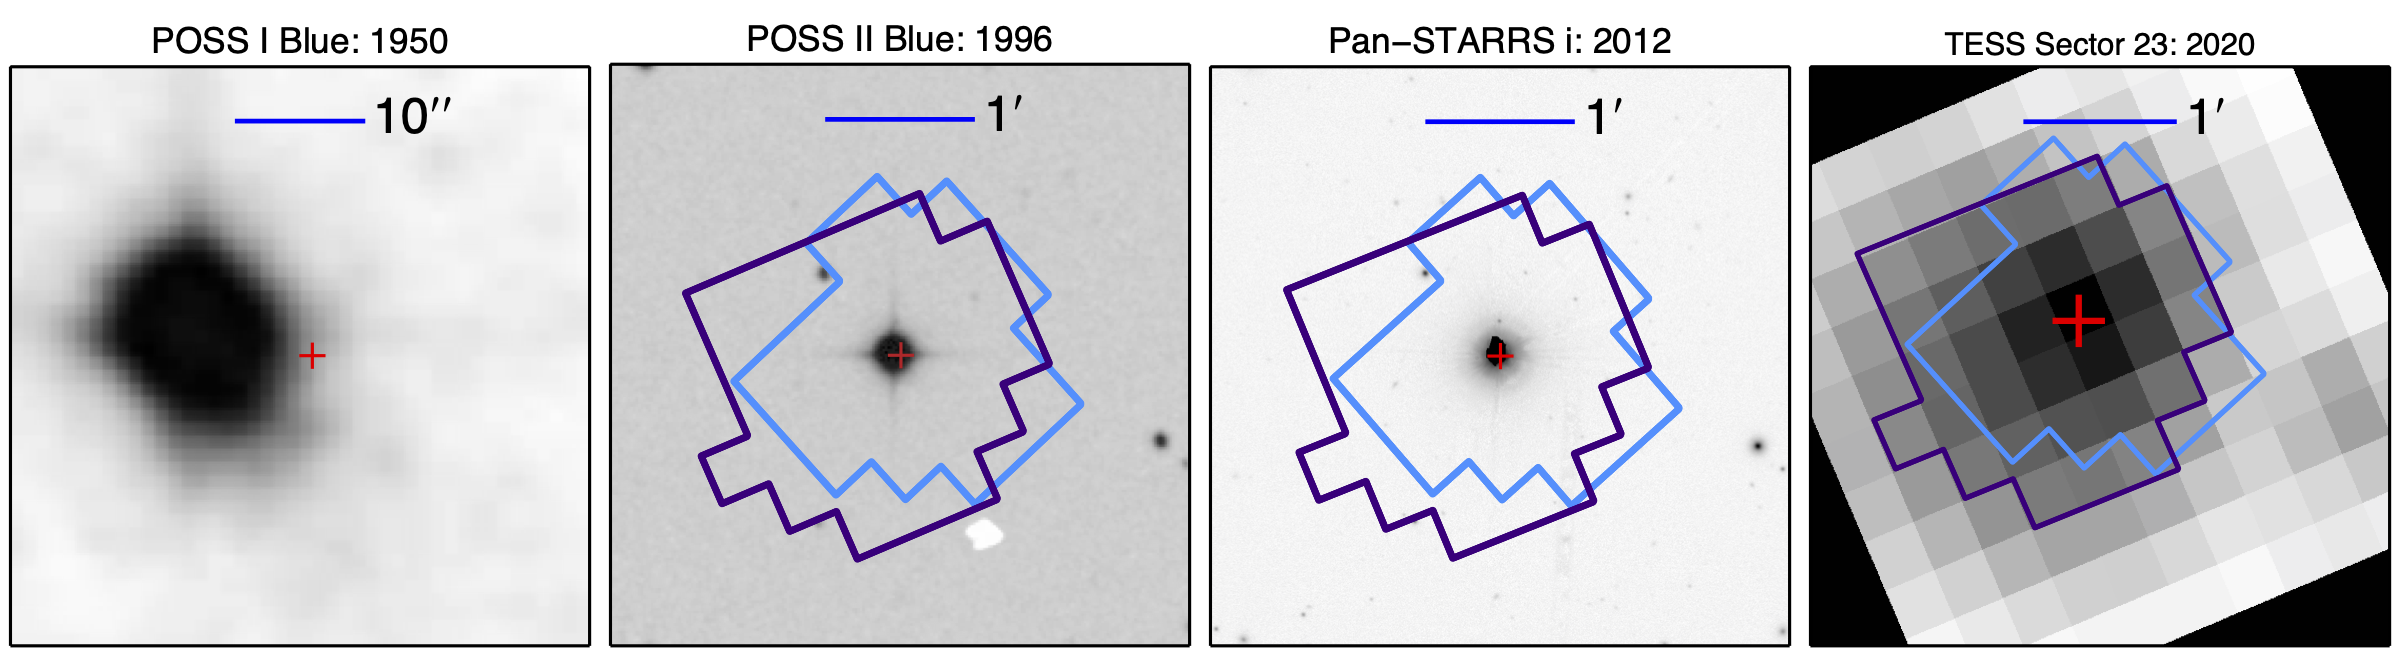
Figure 5 shows the potential contamination of TOI-2076 and TOI-1807 using archival data. We downloaded images from the first and second Palomar Observatory Sky Survey (Minkowski & Abell, 1963; Reid et al., 1991), as well as Pan-STARRS (Chambers et al., 2016), and plotted the present-day position of the stars from the TIC (Stassun et al., 2018) (propagating the proper motion forward to the time of TESS observations). We overplot the apertures assigned by the SPOC Pipeline that we use to extract the TESS light curves. Owing to the high proper motion of TOI-2076 and TOI-1807, the POSS I Blue image shows a significant offset between the centroid of the targets and their present day positions.
Using the POSS I Blue data, we fit PSFs of stars around both TOI-2076 and TOI-1807, using a simple 2D Gaussian model. By evaluating this model at the present day location of both targets, we are able to rule out background contaminants. For TOI-1807, our PSF modeling rules out contaminating targets down to 20th magnitude. TOI-2076 is sufficiently bright in POSS I Blue to cause a significant diffraction spike. Due to this spike, our PSF modeling is unable to rule out the presence of a contaminating source for TOI-2076 fainter than 11th magnitude using archival data alone.
We note that in POSS II and Pan-STARRS there are some fainter targets contained within the SPOC pipeline aperture at the edge, and so we additionally perform a centroid test.
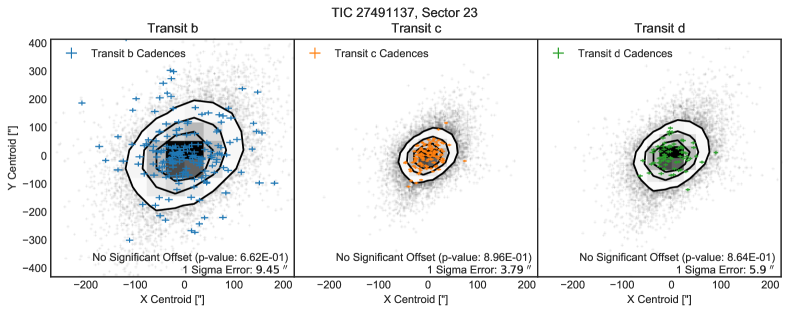
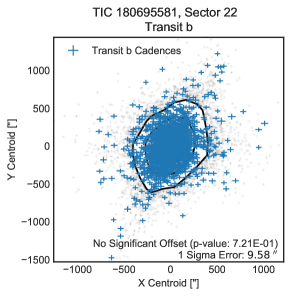
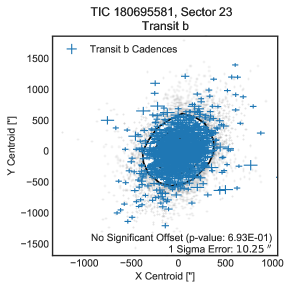
4.2 Contamination (Centroiding)
We perform a simple centroid test on the TESS data of TOI-2076 and TOI-1807 using the following procedure.
-
•
We estimate the centroid of the pixels within the SPOC Pipeline aperture using a weighted mean (weighted by the flux in each pixel). We propagate uncertainties by sampling from the flux errors for each pixel given by the pipeline.
-
•
We correct these centroids for long term trends by removing a smooth trend built by a Gaussian smoothing kernel, with a default width of 21 cadences, using astropy’s convolution module. This removes long term trends due to velocity aberration and focus change during a single TESS observation.
-
•
We then compare the X and Y centroid position distribution of cadences with no transits, to cadences containing transits of planets. Using a simple Student t-test, we test whether the means of these distributions are consistent, assuming they have the same variance. We use scipy.stats’s ttest_ind function to perform this test.
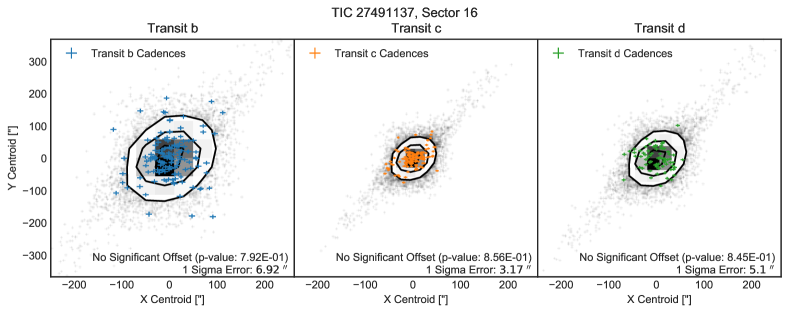
The tool to produce this centroid test is available as an open source project on GitHub444github.com/ssdatalab/vetting, and available as a pip installable tool named vetting555https://pypi.org/project/vetting/. The results of our centroid test are shown in Figure 6. We find for all planets, in all sectors, that there is no significant offset in the means of the centroid distributions. We find no significant evidence that there is any change in the target centroid during transits; our student t-test has a p-value of 0.8 (see Figure 6) for each transit, in each sector. This shows there is a 80% probability that the distributions have the same mean, (i.e. that the centroids during transit are consistent with centroids out of transit.) We calculate the 1 errors in separation from our centroid test for each planet, in each Sector. The distance at which we can rule out blends at the 1 sigma level is given in the corner of each panel of Figure 6. For TOI-2076 we can rule out blends out to distances of 7, 4, and 6 arcseconds at the 1 level for TOI-2076b, TOI-2076c, TOI-2076d respectively. For TOI-1807 we can rule out blends out to distances of 10 arcseconds at the 1 level for TOI-1807b. As such, we find no evidence that the transits originate from background sources, based on the TESS data alone. Further validation with external data sources is discussed below.
4.3 High-Resolution Imaging Follow-up
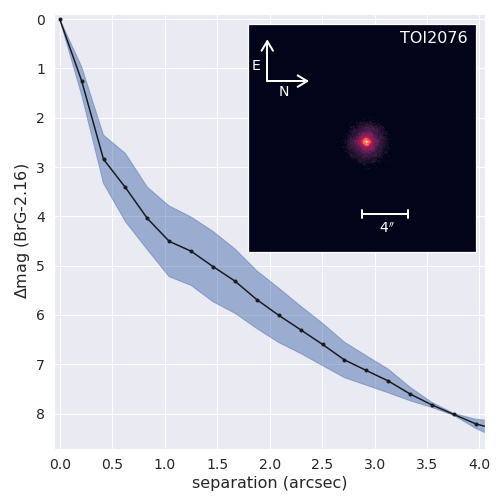
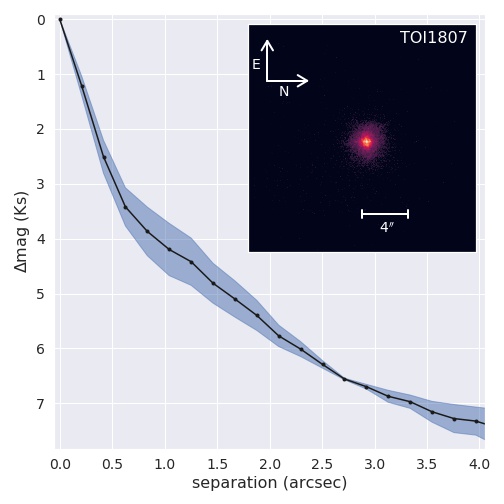
We observed TOI-2076 and TOI-1807 on UT 2020 December 2 using the ShARCS camera on the Shane 3-meter telescope at Lick Observatory (see Figure 7, top row). Observations were taken using the Shane adaptive optics (AO) system in natural guide star mode. We collected our observations using a 4-point dither pattern with a separation of 4 between each dither position. For TOI-2076, we obtained one sequence of observations in the BrG-2.16-band with exposure times of 15 s, which rules out companions with mag < 3 at 05 and companions with mag < 4.5 at 1. For TOI-1807, we obtained one sequence of observations in the Ks-band with exposure times of 1.5 s, which rules out companions with mag < 3 at 05 and companions with mag < 4 at 1. See Savel et al. (2020) for a detailed description of the observing strategy and reduction prodecure.
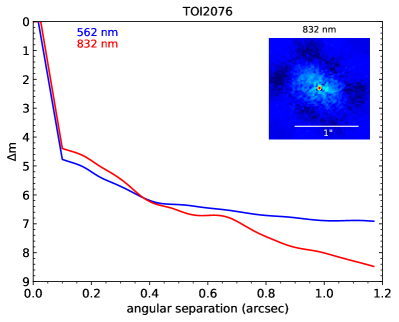
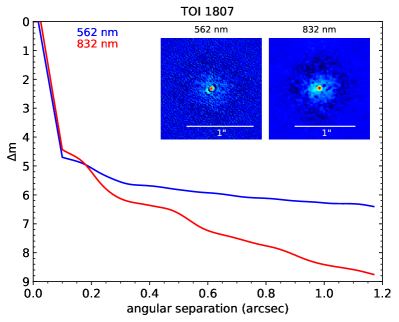
We obtained speckle interferometric images of TOI-2076 (see Figure 7, bottomw row) on UT 2021 February 07 using the ‘Alopeke instrument666https://www.gemini.edu/instrumentation/alopeke-zorro mounted on the 8 m Gemini North telescope on the summit of Mauna Kea in Hawai’i. We also obtained speckle interferometric images of TOI-1807 on UT 2020 June 09. ‘Alopeke simultaneously collects diffraction-limited images at 562 and 832 nm. Our data set consisted of 4 minutes of total integration time taken as sets of 1000 × 0.06 s images followed by the observation of a local PSF standard star. As discussed in Howell et al. (2011), we combined all images, subjected them to Fourier analysis, and produced reconstructed images from which the 5 contrast curves are derived in each passband. The bottom row in Figure 7 presents the two contrast curves as well as the 832 nm reconstructed image for TOI-2076 and TOI-1807. Our measurements reveal TOI-2076 and TOI-1807 to have no nearby, contaminating stars. For TOI-2076, we are confident of our determination of no companions to contrast limits of 5-8 mag, within the spatial limits of 0.7 AU (562nm) to 1.18 AU (832nm) at the inner working angle out to 50 AU at 1.2" (d=42 pc). For TOI-1807, we are confident in our determination of no companions of mag 3 at 0.5" (21 AU) and companions of mag 4 at 1" (42 AU).
5 Ground based photometry
We acquired ground-based time-series follow-up photometry of TOI-1807b and TOI-2076c as part of the TESS Follow-up Observing Program (TFOP)777https://tess.mit.edu/followup. We used the TESS Transit Finder, which is a customized version of the Tapir software package (Jensen, 2013), to schedule our transit observations. The photometric data were extracted using AstroImageJ (Collins et al., 2017).
We observed a full transit window of TOI-1807b, as predicted by the SPOC pipeline analysis of TESS sector 22, on UTC 2020 April 19 in Sloan band from the 0.5 m CDK20N telescope at the University of Louisville Moore Observatory near Louisville, Kentucky. We observed a second full transit window on UT 2020 April 25 in Pan-STARRS -short band from the Las Cumbres Observatory Global Telescope (LCOGT; Brown et al., 2013) 1.0 m network node at McDonald Observatory. Since the ppm event detected by the SPOC pipeline is generally too shallow to detect with ground-based observations, we checked for a faint nearby eclipsing binary (NEB) that could be contaminating the SPOC photometric aperture. To account for possible contamination from the wings of neighboring star PSFs, we searched for NEBs at the positions of Gaia DR2 stars out to from the target star. If fully blended in the SPOC aperture, a neighboring star that is fainter than the target star by 8.6 magnitudes in TESS-band could produce the SPOC-reported flux deficit at mid-transit (assuming a 100% eclipse). To account for possible delta-magnitude differences between TESS-band and Sloan band and Pan-STARRS -short band, we included an extra 0.5 magnitudes fainter (down to TESS-band magnitude 17.7). We visually compared the light curves of the 4 nearby stars that meet our search criteria with models that indicate the timing and depth needed to produce the ppm event in the SPOC photometric aperture. We found no evidence of an NEB that might be responsible for the SPOC detection. By a process of elimination, we conclude that the transit is likely occurring in TOI-1807, or a star so close to TOI-1807 that it was not detected by Gaia DR2 and too faint to be detected by high resolution imaging.
We observed a predicted egress of TOI-2076c on UTC 2020 December 29 in Pan-STARRS -short band from the LCOGT 1.0 m node at McDonald Observatory. The observation would contain a transit egress of TOI-2076c, if the period were the shortest period estimate derived in Section 3.6 ( d). The TOI-2076c observation was moderately defocused, resulting in a typical point source full-width at half-maximum of , and used 15 second exposures. A photometric aperture radius of was used to extract the differential photometry, resulting in ppm model residuals in 5 minute bins. The photometric aperture is not contaminated with flux from any known Gaia DR2 neighboring stars. We recover a a ppm egress using LCO data alone. The follow-up light curve data are available at ExoFOP-TESS888https://exofop.ipac.caltech.edu/tess.
We jointly fit the TESS data for TOI-2076c with the ground based LCO data, fitting every period that is consistent with the data derived in Section 3.6. We simultaneously detrend the LCO data against the reported airmass for the observation, and fit for a variable mean offset. We calculate the reduced chi squared fit of the model to the data, and find a slight preference for the period of 17.1936d. Figure 8 shows the best fitting model with the LCO data for TOI-2076c. Given that we were able to obtain a single egress event, we find moderate evidence that the period of 17.1936d is the correct period for TOI-2076c. If this is the correct period for TOI-2076c, this would put TOI-2076c and TOI-2076b very close to an orbital resonance of 5:3. Further data is needed to well constrain the period of TOI-2076c.

5.1 MuSCAT2 observations
MuSCAT2 (Narita et al., 2019) is a multi-colour optical camera mounted on the 1.52 m Telescopio Carlos Sánchez (TCS) at Teide Observatory, Tenerife, Spain. The instrument is able to obtain simultaneous observations in four bands: Sloan-g, Sloan-r, Sloan-i, and Sloan-. The field of view of MuSCAT2 is arcmin2 with a pixel scale of 0.44 arcsec per pixel. With read out times between 1 and 4 seconds, MuSCAT2 an ideal instrument for transit follow-up and time-series observations in general. We observed two primary transits of TOI-1807.01 using MuSCAT2, using four bands on the nights of 8 and 13 of May 2020. For each night the field of view was slightly offset from the center in order to observe a bright reference star north of the target. The telescope was defocused and the exposure times for each band were set to avoid saturation of the target star. The data was reduced using standard procedures, and the photometry and transit model fit (including systematic effects) was done by the MuSCAT2 pipeline (for details see Parviainen et al., 2019, Parviainen et al., 2020). In both nights we could not detect the transit on target due to the shallow depth of the transit and the scatter in the light curves, nonetheless the MuSCAT2 data were useful to discard the presence of eclipsing binaries inside the TESS aperture.
5.2 Statistical Validation
In addition to the vetting performed above, we statistically validate each target to provide strong evidence of each being a bona fide planet. We do so using triceratops (Giacalone et al., 2021; Giacalone & Dressing, 2020) and vespa (Morton, 2015), algorithms that rule out astrophysical false positives by calculating and comparing the probabilities of various transit-producing scenarios. triceratops is a tool specifically designed for TESS observations, and considers transit scenarios originating from the target star and sources unresolved with the target star, in addition to transit scenarios originating from nearby resolved stars. Because of the low spatial resolution of TESS and the resulting flux contamination from nearby stars, the assumption that the transit originates from within the resolution limits of the target star is not valid for many planet candidates, so tools like vespa (Morton, 2015), (which was originally designed to validate planet candidates from Kepler and later adapted to TESS) are less widely applicable. vespa operates assuming that the transit originates from within the resolution limits of the target star, and therefore cannot be used for many TESS planet candidates. However, because the photometric follow-up described in Section 4.3 rules out nearby resolved stars as transit sources for both TOI-1807 and TOI-2076, both of these tools can be used to validate planet candidates in these systems.
As additional constraint in our calculations, we fold in the high-resolution imaging follow-up observations discussed in Section 4.3. Because these observations reveal no previously unresolved companions within their detection limits, incorporating the follow-up reduces the calculated probability of the transit originating from a bound or chance-aligned star within the resolution limits of the target star, thereby reducing the overall false positive probability (FPP) for each target. The ground based follow-up presented above directly informs our statistical validation. Below, we present the results of this analysis for each planet candidate.
5.2.1 TOI-2076
We run triceratops for the three planet candidates around TOI-2076 20 times each and calculate the mean and standard deviation of the resulting distributions of FPPs. We find , , and for planets b, c, and d, respectively. We also run vespa a single time for each planet candidate and find , , and , respectively. These probabilities are low enough to consider the three planets validated.
5.2.2 TOI-1807
We run triceratops for the planet candidate around TOI-1807 20 times and calculate the mean and standard deviation of the resulting distribution of FPPs. We find , which is below the threshold of required to validate a planet candidate with this tool. We run vespa a single time to ensure that the two tools provide the same result. With vespa, we find . With these results strongly suggesting that the planet candidate is a bona fide planet, we consider the planet to be validated.
6 Estimating the age of TOI-1807 and TOI-2076
We make use of a number of indicators to estimate the ages of TOI-2076 and TOI-1807. Young stars retain much of the angular momentum from their formation. As a result of the rapid rotation, young stars also exhibit extensive spot coverage and chromospheric activity. As such, for young Sun-like stars, we can often estimate their ages by their rotation periods, as measured from the light curve, and from the chromospheric activity indicators, such as core emission in the Calcium II lines, and their UV and X-ray fluxes. We describe each of these indicators in the sections below.
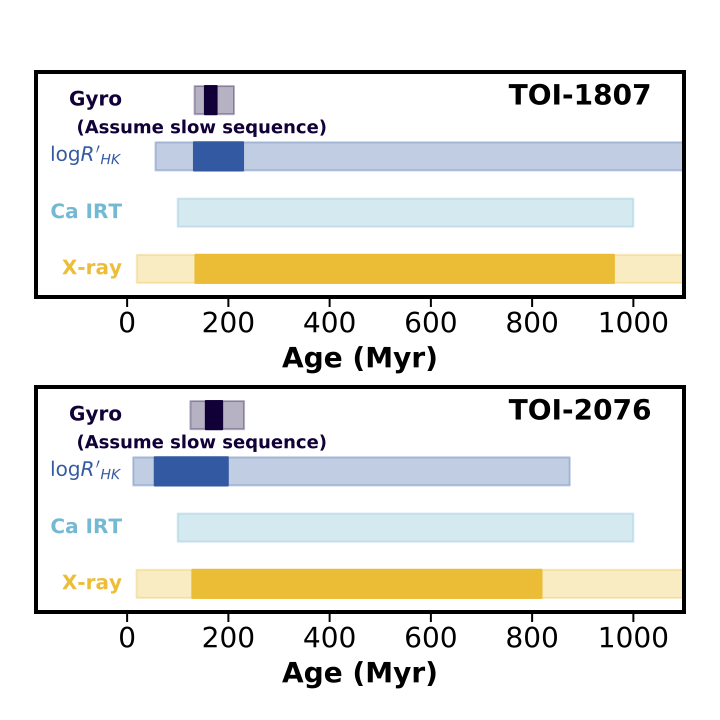
Figure 9 presents a summary of the quantitative age estimates we provide. We adopt the gyrochronology age estimates of Myr for TOI-1807, and Myr for TOI-2076, in our analyses. We show below that each of the other activity and spectroscopic indicator supports these gyrochronology estimates. We caution, however, that estimating the ages of single stars is always rife with caveats, and the estimates we provide should be taken with the necessary caution as is appropriate for their uncertainties.
6.1 Gyrochronology
Sun-like stars with convective envelopes and radiative cores spin down over their main-sequence lifetimes as mass is lost in the form of stellar wind. By comparing the rotation periods of our target stars against members of clusters and moving groups with known ages, we can place constraints on their ages. TOI-1807 and TOI-2076 exhibit significant spot-induced rotational modulation in their light curves. We make use of the TESS continuous light curves and archival ground-based multi-year observations to estimate the rotation periods of these stars.
TOI-2076 received two sectors of TESS observations over 28-day segments in September 2019 and March 2020, with significant spot evolution between the two separate sets of observations. We find a rotation period of d and d during Sectors 16 and 23 respectively (see Figure 10). The uncertainties are estimated based on the full width at half maximum of the Lomb-Scargle periodogram peaks for each sector of observations. In addition, we made use of 8 years of light curves from KELT (Pepper et al., 2007; Pepper et al., 2012; Pepper et al., 2018), spanning between December 2006 to December 2014. A Lomb-Scargle periodogram showed a peak at 7.31 d, consistent with that measured from the TESS observations. Taking the mean and the scatter in the measured periods between TESS and KELT, we get a rotation period for TOI-2076 of days.
TOI-1807 received two sectors of continuous TESS observations over a period of 54 days, showing consistent stellar variability at the 2% level. The Lomb-Scargle periodograms for each sector of the TESS observations are shown in Figure 10. Our initial analysis yielded a highest peak in the periodogram of and days for Sectors 22 and 23 respectively. However, further analysis of the long duration monitoring from the ground based KELT survey showed that the TESS period peak is actually 1/2 that of the true rotation period. TOI-1807 was observed by the KELT survey from December 2006 to December 2014. The periodogram derived from these observations is also shown in Figure 10, with a best matching period of 8.737 days, that from the TESS light curves. Given the extensive coverage from the KELT survey, and the rapid evolution expected for such young stars, we adopt a period of days for TOI-1807.
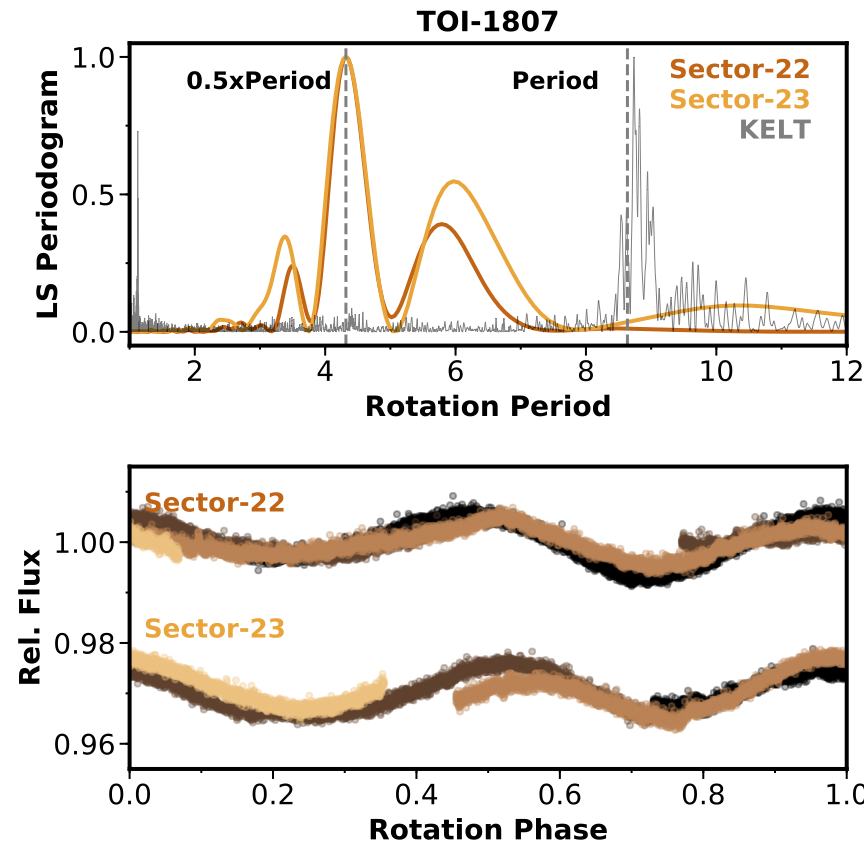
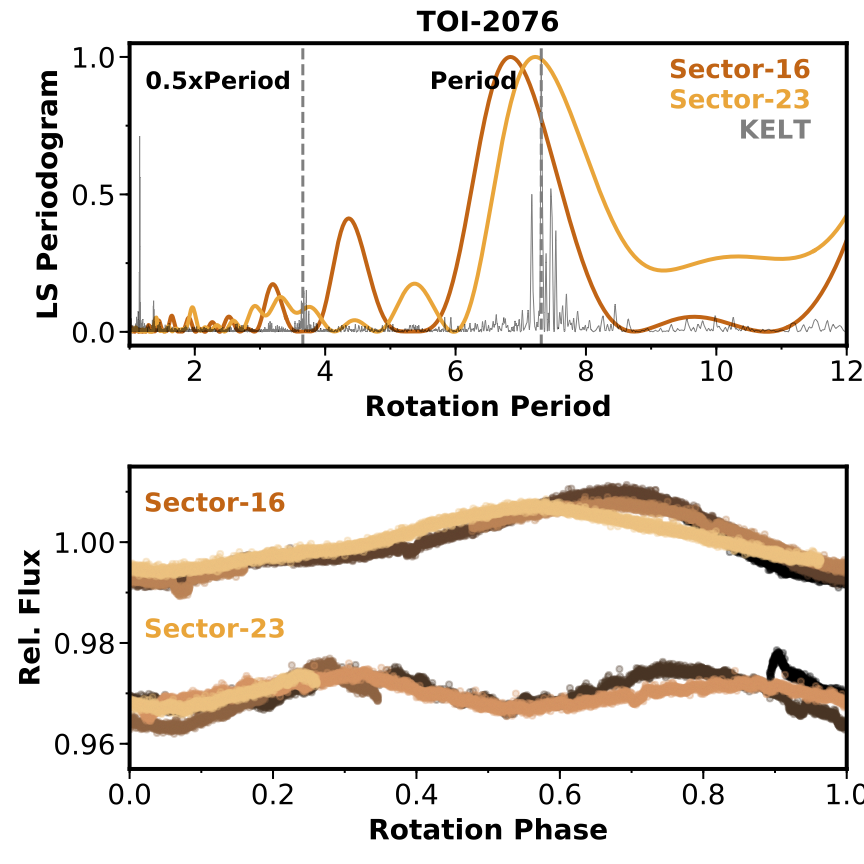
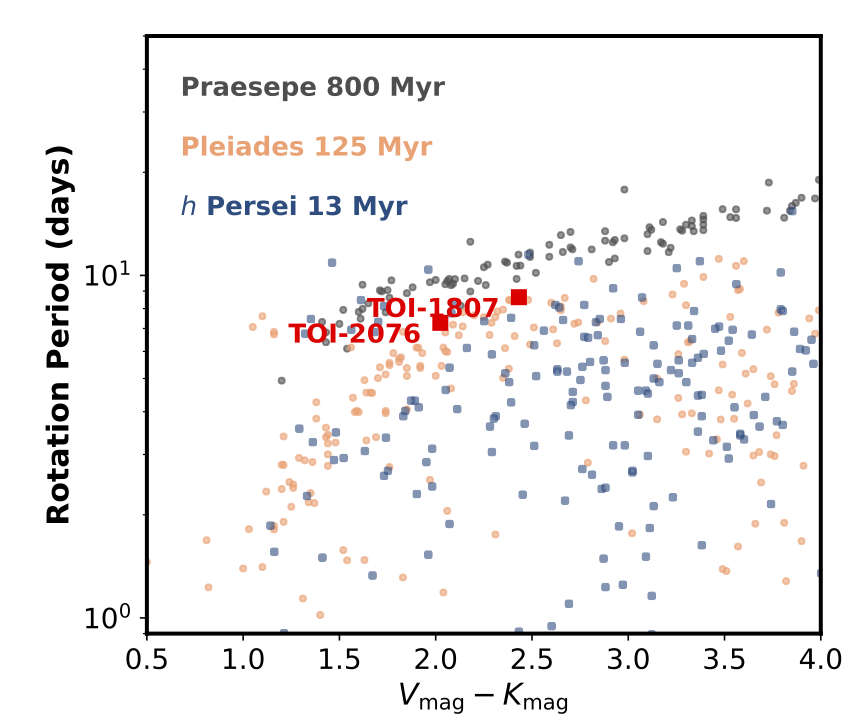
Figure 11 compares the colors and rotation periods of TOI-2076 and TOI-1807 against members of well characterized moving groups and clusters. The target stars fall along the slow-rotation sequence of the 125 Myr old Pleiades cluster. Adopting the gyrochronology relationship from Barnes (2007), we find an estimated age range of Myr for TOI-1807, and Myr for TOI-2076. To test the robustness of these estimates against the specific calibration, we also apply the rotation-age relationship from Mamajek & Hillenbrand (2008), and derive consistent age ranges of Myr for TOI-1807, and Myr for TOI-2076.
6.2 Stellar activity
As a result of the rapid rotation, young stars exhibit significant chromospheric emission visible in the X-ray and specific activity-sensitive optical features.
TOI-1807 and TOI-2076 are X-ray sources in the ROSAT All sky survey (Voges et al., 2000). We convert the X-ray fluxes to X-ray luminosities via the calibration from Fleming et al. (1995), and place age limits from these X-ray luminosities via Mamajek & Hillenbrand (2008) (Equation A3). TOI-1807 has an X-ray luminosity of , and an estimated age lower limit of . Similarly, TOI-2076 has an X-ray luminosity of , corresponding to a age lower limit of Myr.
Similarly, chromospheric emission in the cores of the Calcium II lines are also qualitatively informative on the ages of systems. There is significant core emission in the Calcium II H and K lines, as well as the Calcium II infrared triplet lines from the TRES spectra of TOI-1807 and TOI-2076.
Using the calibrations provided in Zhou et al. (2021), we measured equivalent widths for the core emission in the Calcium II H,&K lines, and convert them to the Mount Wilson Observatory HK Project (Wilson, 1978; Vaughan et al., 1978; Duncan et al., 1991; Baliunas et al., 1995) indices for both target stars. We measure and for TOI-1807 and 2076 respectively; these were converted to the bolometric flux ratios of and respectively.
Like X-ray, the level of Calcium II core emission is related to the rotation, and therefore age, of the target stars. We make use of the calibration offered by Mamajek & Hillenbrand (2008) (Equation 3) to yield age ranges of 60-1800 Myr for TOI-1807, and 12-870 Myr for TOI-2076.
Similarly, we also follow Zhou et al. (2021) and measured the levels of core emission in the Calcium II infrared triplet lines, finding equivalent widths of Å for TOI-1807 and Å for TOI-2076. Using the qualitative relationships provided in Žerjal et al. (2017), these core emissions are consistent with stars with ages between 100-1000 Myr of age.
6.3 Lithium absorption
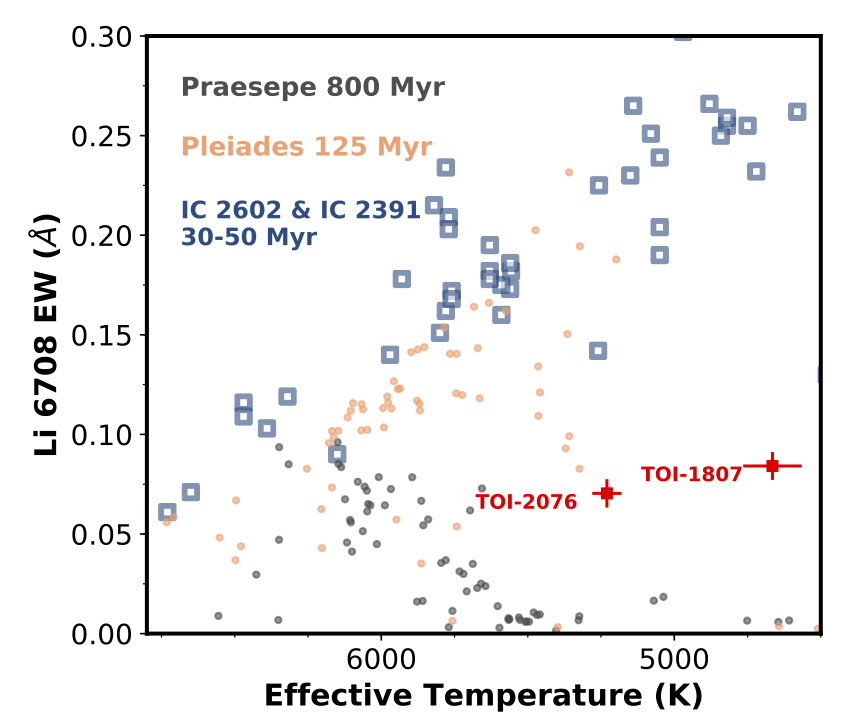
Lithium is rapidly depleted in the envelope of Sun-like stars within the first few hundred million years post formation, as it is convectively mixed into the core and destroyed through proton collisions. The Lithium 6708 Å line is therefore often a reliable and easily accessible indicator of youth for young Sun-like stars. Both TOI-1807 and TOI-2076 exhibit significant Lithium absorption features. We measured Li 6708 Å equivalent widths for these target stars using the high resolution observations from the TRES facility, as per the techniques described in Zhou et al. (2021), with equivalent widths of Å and Å for TOI-1807 and 2076 respectively.
Figure 11 places the Lithium absorption strength measured for TOI-1807 and 2076 into context with other well characterized clusters. As the Lithium absorption strength is dependent on a large number of additional factors, such as rotational evolution and metallicity, we do not derive quantitative ages from the equivalent width measurements. It is clear, however, that these target stars have ages significantly younger than stars in the 800 Myr old Praesepe cluster, and significantly older than the 50 Myr old clusters IC2602 and IC2391.
7 Discussion
The planets transiting TOI-1807 and TOI-2076 are valuable benchmarks for studying the evolution of small planets. Transiting planets around young (1 Gyr) stars are still relatively rare, and it remains to be seen if this is due to the scarcity of young stars amenable to transit searches, an age-dependence to detection efficiency and/or planet occurrence rates, a lack of precise and accurate ages for planet hosts, or some combination of these effects.
An especially compelling use case provided by young transiting planets is the possibility of constraining models of radial contraction and atmospheric loss (e.g. Owen & Wu, 2013; Lopez & Fortney, 2013; Jin et al., 2014; Chen & Rogers, 2016; Ginzburg et al., 2016). For example, one challenge in modeling the atmospheric evolution of planets with a photoevaporation model is the unknown X-ray and extreme ultraviolet (XUV) evolution of the host star (e.g. Kubyshkina et al., 2019a, b; Owen & Campos Estrada, 2020). This is because uncertainties in the time-integrated XUV exposure of a given planet are larger for stars with older and less precise ages, which could have had a wide range of XUV luminosities early in their lives. The X-ray and UV luminosities of nearby, young planet hosts can be directly measured and, provided some knowledge of the stellar age and planetary masses, allow for detailed modeling of the past (e.g. Owen, 2020) and future (e.g. Poppenhaeger et al., 2021) evolution of a planetary system.
In this context, the most intriguing observations about the TOI-2076 system are the relatively large planet sizes (b, c, and d have radii of 3.2, 4.5 and 4.0 respectively). All of the transiting planets detected around pre-main sequence stars appear to have anomalously large sizes when compared to exoplanets around field stars, while planets with ages of 0.5–1 Gyr appear to have sizes that are more consistent with those of the field population (see e.g. Mann et al., 2017; David et al., 2019; Livingston et al., 2019; Bouma et al., 2020; Tofflemire et al., 2021, and references therein). It remains to be seen whether this size-age correlation is astrophysical or due to lower detection efficiencies for young stars (e.g. Zhou et al., 2021). The TOI-1807 and TOI-2076 systems exist at an intermediate age (0.1–0.5 Gyr) when the most dramatic effects of photoevaporation are expected to be complete (Jackson et al., 2012), though mass loss may proceed further over gigayear timescales for some planets through either core-cooling (Gupta & Schlichting, 2020b) or photoevaporation (Rogers & Owen, 2021).
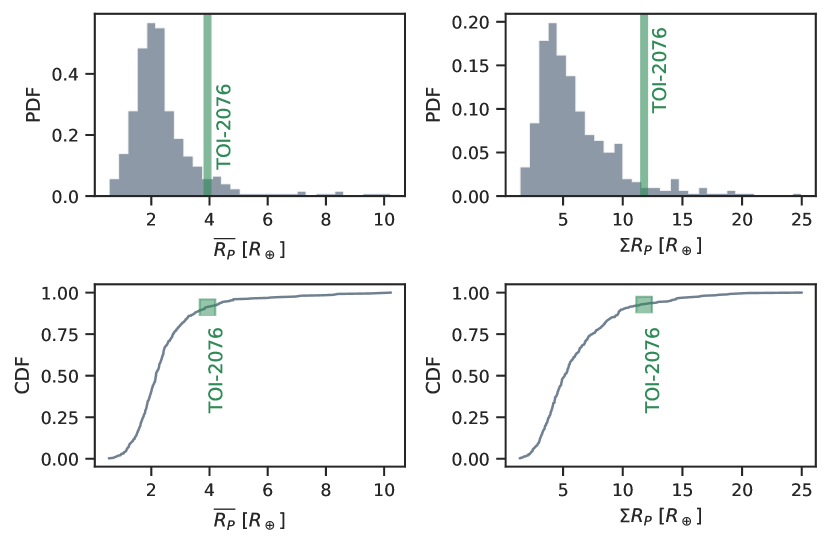
To place the TOI-2076 system in the broader context of multi-planet systems we queried the NASA Exoplanet Archive (Akeson et al., 2013) for all confirmed, multi-transiting systems with GK host stars (4000 K 6000 K). For each system we computed the average planet radius and the sum of planetary radii (regardless of how many planets were in each system). We then compared the equivalent values for TOI-2076 to the empirical probability distribution functions (PDFs) and cumulative distribution functions (CDFs) of the Exoplanet Archive sample (Fig. 12). We found that the average planet radius and sum of planetary radii in the TOI-2076 system are larger than 91% and 93% of the equivalent values in confirmed multi-planet systems, respectively. While we can not prove a causal link, it is intriguing that the TOI-2076 system extends the trend of large planetary radii observed in other young systems.
TOI-1807 b is particularly interesting as it belongs to a distinct class of planets known as ultra-short period planets (USPs, see Winn et al., 2018, for a review). USPs are intrinsically rare, with an occurrence rate of 0.5–1% around G and K-type stars (Sanchis-Ojeda et al., 2014; Steffen & Coughlin, 2016). Despite being about equally as rare as hot Jupiters, USPs are almost certainly unrelated to their more massive and distant cousins: they lack a strong preference for metal-rich hosts (Winn et al., 2017), they almost always occur in compact multi-planet systems (Sanchis-Ojeda et al., 2014; Adams et al., 2020), and they are more common around lower-mass stars (Sanchis-Ojeda et al., 2014). All of these trends run counter to what has been established for hot Jupiters. That being established, USPs may well be the remnant cores of sub-Neptunes.
Several lines of evidence suggest that USPs, including TOI-1807 b, did not form in their current orbits, likely underwent inward migration, and are the result of non-standard evolution. This evidence includes (1) present-day USP orbits lie interior to the dust sublimation radii of typical protoplanetary disks (e.g. Muzerolle et al., 2003; Eisner et al., 2005), (2) the observed period ratios between USPs and neighboring planets are much larger than the period ratios typically observed in multi-transiting systems (Steffen & Farr, 2013), (3) the planet occurrence rate is a steeper function of period inside 1 day relative to the rates in the 1-10 day, or 10-100 day range (Lee & Chiang, 2017), (4) USPs occur in multi-planet systems with larger-than-average mutual inclinations (Dai et al., 2018), and (5) well-characterized USPs are always smaller than 2 , having densities consistent with rocky compositions (Dai et al., 2019). The size cut-off of USPs is seen as potential evidence that some experienced atmospheric loss.
Millholland & Spalding (2020) provided a recent review of the most promising theories for how USPs arrived on their observed orbits, all of which involve tidal dissipation and the accompanying orbital decay. Briefly, these theories can be summarized as: (1) in situ formation near the inner edge of the protoplanetary disk, followed by tidal dissipation in the star (Lee & Chiang, 2017), and (2) planet-planet interactions followed by tidal dissipation in the planet driven by either the planet’s orbital eccentricity (Schlaufman et al., 2010; Petrovich et al., 2019; Pu & Lai, 2019) or the planetary obliquity (the angle between the planet’s spin axis and orbital angular momentum vector Millholland & Spalding, 2020). The latter class of theories naturally account for the high planet multiplicity and mutual inclinations in USP systems.
As the youngest USP detected to date, TOI-1807 b places stringent limits on theories for the formation and evolution of these rare planets. The discovery of an USP around a young star is compatible with a fast formation channel, which is also suggested by a comparison of galactic velocity dispersions between USP hosts and field stars (Hamer & Schlaufman, 2020). If stellar activity can be mitigated, radial velocity follow-up of TOI-1807 should lead to the discovery of the additional non-transiting planets that likely exist; this would help piece together a coherent picture of the past dynamics of the system which may have driven TOI-1807 b inwards.
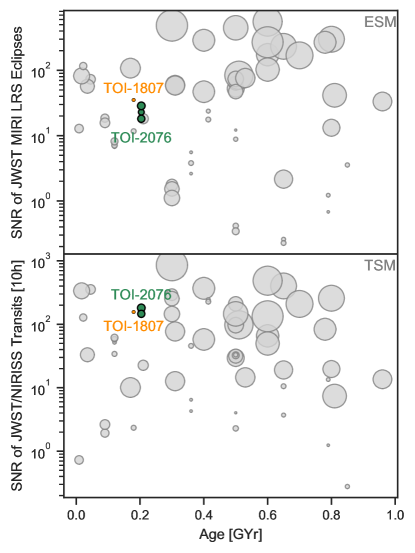
To place TOI-1807 b in a broader observational context we computed the JWST Emission Spectroscopy Metric (ESM, Kempton et al., 2018) for all confirmed USPs (1 day, 2 ) on the NASA Exoplanet Archive, assuming the Bond albedo of Earth (=0.306). We found that TOI-1807 b is the third most favorable USP for the detection of mid-IR thermal emission (Table 6 and Fig. 13). Notably, the two planets which rank more favorably, 55 Cnc e and LHS 3844 b, have securely detected mid-IR phase curves and secondary eclipses (Demory et al., 2016; Kreidberg et al., 2019) while K2-141 b, which ranks below TOI-1807 b, has a detected phase curve and secondary eclipse from K2 optical photometry (Malavolta et al., 2018).
Thus, the TOI-1807 system offers an opportunity to study a small, likely rocky planet shortly after its formation and perhaps after recently losing its atmosphere. The youth of TOI-1807 b makes it an even more compelling target for secondary eclipse spectroscopy, as the luminosity of the planet’s cooling core may be an order of magnitude higher than it would be at older ( Gyr) ages (Linder et al., 2019). Finally, as a candidate “lava world" (Chao et al., 2020), TOI-1807 b presents an opportunity to study the early evolution of these poorly-understood objects.
| Planet name | ESM |
|---|---|
| 55 Cnc e | 101.0 |
| LHS 3844 b | 51.4 |
| TOI-1807 b | 36.9 |
| GJ 1252 b | 26.6 |
| LTT 3780 b | 23.3 |
| K2-141 b | 21.5 |
| HD 3167 b | 20.0 |
| LP 791-18 b | 12.2 |
| TOI-561 b | 11.5 |
| K2-131 b | 9.7 |
TOI-2076 and TOI-1807 are coeval and comoving; these young stars likely formed together, though we their large physical separation (>9 pc) suggests they are not bound. Theoretical studies show that very close stellar companions can have a significant effect on planet formation; close companions can 1) truncate the proto-planetary disk, preventing planetary formation (Jang-Condell, 2015), 2) trigger the migration of giant planets, 3) eject smaller planets, and 4) disperse the disk before or during planetary formation (Cieza et al., 2009). Systems as widely separated as these two stars essentially evolve as single stars, and we know little of their formation processes and any interrelationship that may be present. The detection of transiting planets in both TOI-2076 and TOI-1807 reveals that the planetary orbital planes are co-aligned, which hints at a common formation process whereby the both components maintain a nearly-edge on inclination to our line of sight. There is some initial evidence of such alignment between planetary orbits and the orbits of their binary hosts (Colton et al., 2021) with more evidence to come from high-resolution imaging studies such as Howell et al. (2021).
7.1 Opportunities for Follow-up Observations
We have reported the detection and validation of TOI-2076b/c/d and TOI-1807b. These systems are extremely valuable to the community. The youth of the host stars place TOI-2076 and TOI-1807 in a valuable parameter space. The proximity of the host stars (40pc) could make these targets excellent candidates for follow up with direct imaging surveys, to search for longer period companions.
The bright, small host stars also provide an unparalleled opportunity to observe small, young planets in both transmission and emission using the James Webb Space Telescope (JWST) close to a crucial transition age in planet formation. Figure 13 shows the Emission Spectroscopy Metric (ESM) and Transmission Spectroscopy Metric (TSM) from Kempton et al. (2018) for the current sample of confirmed, young transiting planets999https://exoplanetarchive.ipac.caltech.edu/ accessed Jan 2021. The ESM provides an estimate of the signal to noise ratio of a secondary eclipse in JWST’s MIRI LRS bandpass, and the TSM provides the signal to noise ratio of a ten hour observation in JWST’s NIRISS, not accounting for the presence of clouds. These values do not account for any residual energy from planet formation, and only account for the atmosphere signal due to heating at the equilibrium temperature of the planet. TOI-2076 and TOI-1807 are highlighted. We note that 1) there are few known transiting planets close to the 100Myr age 2) TOI-1807b has the most observable emission of any small, young planet. 3) TOI-2076b, TOI-2076c, TOI-2076d, and TOI-1807b are all excellent candidates for transmission spectroscopy with JWST, providing enough signal to noise for an atmosphere detection with just one transit.
One crucial step towards effective atmospheric characterization is obtaining mass measurements for the planets. The brightness of TOI-2076 and TOI-1807 makes them amenable to ground-based radial velocity (RV) follow-up, though the significant stellar activity may make detection more difficult. As a first-order guess, we estimate the planet masses using the probabilistic radius-to-mass conversion from Chen & Kipping (2017) and calculate the expected RV semi-amplitude for a zero-eccentricity orbit. This yields an expected semi-amplitude m s-1 for TOI-1807b and m s-1 for TOI-2076b. The RV signal strength is even less certain for TOI-2076c and TOI-2076d due to their unknown orbital periods, but based on the likely periods given in Section 3.6, their RV semi-amplitudes should be on the order of 3-4 m s-1 as well.
Since both targets are young and active stars, they are likely to exhibit RV jitter on order of 10s to 100s of m s-1, well in excess of the photon noise limit for a typical RV spectrograph (Luhn et al., 2020). The primary challenge in measuring the planet masses through RV is then mitigating the stellar activity, particularly since it is likely to be larger in amplitude than the Doppler signal. In this sense TOI-1807b is the most promising target for mass follow-up, as its ultra-short orbital period suggests that the Keplerian signal will be separable from activity at the rotation period of the star. As demonstrated by recent Rossiter-McLaughlin (RM) effect measurements on very young and active stars, it is feasible to measure short-duration RV signals on timescales of hours even in the presence of high-amplitude stellar variability on longer timescales of days (Montet et al., 2020; Zhou et al., 2020). RV follow-up of TOI-2076b/c/d will be more challenging, since the planetary orbital periods are comparable to the stellar rotation and the complexity of the multi-planet RV signal requires a larger number of observations. That being said, recent work on other young systems like K2-100 and AU Mic has effectively employed stellar activity models to extract RV constraints in the face of considerable activity (Barragán et al., 2019; Klein et al., 2021), and these targets are prime examples of the importance of developing such methods.
We note also that similar RV amplitudes are expected for the RM effect of these planets. The spin-orbit alignment measurement enabled by RM measurements would be particularly valuable for constraining the formation and migration histories of these planets. TOI-2076c is expected to be the best RM target, with an amplitude on the order of 10 m s-1 (Triaud, 2018), possibly within reach of modern observations. This amplitude is not sensitive to the unknown orbital period of the planet, although refined ephemerides will of course be necessary to obtain the required in-transit observations.
A previous study of ultra-short-period planets by Sanchis-Ojeda et al. (2014) concluded that USP planets often have longer period coplanar companions in the period range days. Because the transit probability of USP planets in these multi-planet systems is significantly higher than the than longer period companions, systems with a single transiting USP planet are likely to also have non-transiting outer planets. While we identified no longer-period transiting planets in the TOI-1807 system, radial velocity measurements of TOI-1807, and perhaps future direct imaging observations, may reveal additional planets in this system.
Although the known planets detected in transit are too close to their stars to be directly imaged, giant planets in the outer reaches of the TOI-2076 and TOI-1807 systems may be more detectable. Due to the young age of the stars, giant planets would still be cooling from formation and would therefore appear brighter at infrared wavelengths than mature Jovian planets (e.g. Burrows et al., 1997). Depending on their masses, ages, formation conditions, and cooling rate, massive Jovian planets orbiting TOI-2076 and TOI-1807 at separations comparable to Saturn, Uranus, or Neptune (10 - 30 AU) could be within reach of current and upcoming instruments (e.g. Bowler, 2016; Lacy & Burrows, 2020).
8 Conclusions
In this paper we have presented and validated two systems of planets around two young, comoving stars. These planets could provide a unique opportunity for further study by characterizing atmospheres in transmission, emission, and phase curves in the immediate future. The host star variability may make radial velocity observations challenging, but in the case of TOI-1807b we expect mass measurements to be accessible. Their close proximity to earth could make them excellent candidates for direct imaging. In the case of the USP TOI-1807b, we may expect further, long period planets to be present. The potential for a joint formation history of these two host stars make them a unique opportunity to intercompare planet systems with the same starting conditions, but different outcomes. We suggest TOI-2076 and TOI-1807 are exceptional candidates for further follow-up, and to further our understanding of young planets.
9 Acknowledgements
This research made use of lightkurve, a Python package for Kepler and TESS data analysis (Lightkurve Collaboration et al., 2018). This research made use of Astropy,101010http://www.astropy.org a community-developed core Python package for Astronomy (Astropy Collaboration et al., 2013, 2018). This research made use of exoplanet (Foreman-Mackey et al., 2020) and its dependencies (Agol et al., 2020; Astropy Collaboration et al., 2013, 2018; Kipping, 2013b; Luger et al., 2019; Salvatier et al., 2016; Theano Development Team, 2016). This paper includes data collected with the TESS mission, obtained from the MAST data archive at the Space Telescope Science Institute (STScI). Funding for the TESS mission is provided by the NASA Explorer Program. We acknowledge the use of public TESS data from pipelines at the TESS Science Office and at the TESS Science Processing Operations Center. This research has made use of the Exoplanet Follow-up Observation Program website, which is operated by the California Institute of Technology, under contract with the National Aeronautics and Space Administration under the Exoplanet Exploration Program. STScI is operated by the Association of Universities for Research in Astronomy, Inc., under NASA contract NAS 5–26555. The National Geographic Society - Palomar Observatory Sky Atlas (POSS-I) was made by the California Institute of Technology with grants from the National Geographic Society. The Second Palomar Observatory Sky Survey (POSS-II) was made by the California Institute of Technology with funds from the National Science Foundation, the National Geographic Society, the Sloan Foundation, the Samuel Oschin Foundation, and the Eastman Kodak Corporation. Resources supporting this work were provided by the NASA High-End Computing (HEC) Program through the NASA Advanced Supercomputing (NAS) Division at Ames Research Center for the production of the SPOC data products. Funding for this work for CH is provided by grant number 80NSSC20K0874, through NASA ROSES. T.J.D. acknowledges support for this work from the TESS Guest Investigator program under NASA grant 80NSSC20K0631. This work is partly supported by JSPS KAKENHI Grant Numbers JP18H01265 and JP18H05439, and JST PRESTO Grant Number JPMJPR1775, and a University Research Support Grant from the National Astronomical Observatory of Japan (NAOJ). This work makes use of observations from the LCOGT network. Part of the LCOGT telescope time was granted by NOIRLab through the Mid-Scale Innovations Program (MSIP). MSIP is funded by NSF. Some of the observations in the paper made use of the High-Resolution Imaging instrument ‘Alopeke. ‘Alopeke was funded by the NASA Exoplanet Exploration Program and built at the NASA Ames Research Center by Steve B. Howell, Nic Scott, Elliott P. Horch, and Emmett Quigley. ‘Alopeke was mounted on the Gemini North (and/or South) telescope of the international Gemini Observatory, a program of NSF’s OIR Lab, which is managed by the Association of Universities for Research in Astronomy (AURA) under a cooperative agreement with the National Science Foundation on behalf of the Gemini partnership: the National Science Foundation (United States), National Research Council (Canada), Agencia Nacional de Investigación y Desarrollo (Chile), Ministerio de Ciencia, Tecnología e Innovación (Argentina), Ministério da Ciência, Tecnologia, Inovações e Comunicações (Brazil), and Korea Astronomy and Space Science Institute (Republic of Korea). This publication makes use of data products from the Wide-field Infrared Survey Explorer, which is a joint project of the University of California, Los Angeles, and the Jet Propulsion Laboratory/California Institute of Technology, funded by the National Aeronautics and Space Administration. This article is based on observations made with the MuSCAT2 instrument, developed by ABC, at Telescopio Carlos Sánchez operated on the island of Tenerife by the IAC in the Spanish Observatorio del Teide. This paper is partially based on observations made with the Nordic Optical Telescope, operated by the Nordic Optical Telescope Scientific Association at the Observatorio del Roque de los Muchachos, La Palma, Spain, of the Instituto de Astrofisica de Canarias. D.J.S. is supported as an Eberly Research Fellow by the Eberly College of Science at the Pennsylvania State University. The Center for Exoplanets and Habitable Worlds is supported by the Pennsylvania State University, the Eberly College of Science, and the Pennsylvania Space Grant Consortium. JNW thanks the Heising-Simons foundation for support.
References
- Adams et al. (2020) Adams E. R., et al., 2020, arXiv e-prints, p. arXiv:2011.11698
- Agol et al. (2020) Agol E., Luger R., Foreman-Mackey D., 2020, AJ, 159, 123
- Akeson et al. (2013) Akeson R. L., et al., 2013, PASP, 125, 989
- Astropy Collaboration et al. (2013) Astropy Collaboration et al., 2013, A&A, 558, A33
- Astropy Collaboration et al. (2018) Astropy Collaboration et al., 2018, aj, 156, 123
- Baliunas et al. (1995) Baliunas S. L., et al., 1995, ApJ, 438, 269
- Barnes (2007) Barnes S. A., 2007, ApJ, 669, 1167
- Barragán et al. (2019) Barragán O., et al., 2019, MNRAS, 490, 698
- Battley et al. (2020) Battley M. P., Pollacco D., Armstrong D. J., 2020, Monthly Notices of the Royal Astronomical Society, 496, 1197–1216
- Becker et al. (2019) Becker J. C., et al., 2019, AJ, 157, 19
- Berger et al. (2020) Berger T. A., Huber D., Gaidos E., van Saders J. L., Weiss L. M., 2020, AJ, 160, 108
- Bouma et al. (2020) Bouma L. G., et al., 2020, AJ, 160, 239
- Bowler (2016) Bowler B. P., 2016, PASP, 128, 102001
- Brown et al. (2013) Brown T. M., et al., 2013, Publications of the Astronomical Society of the Pacific, 125, 1031
- Buchhave et al. (2010) Buchhave L. A., et al., 2010, ApJ, 720, 1118
- Buchhave et al. (2012) Buchhave L. A., et al., 2012, Nature, 486, 375
- Buchhave et al. (2014) Buchhave L. A., et al., 2014, Nature, 509, 593
- Burrows et al. (1997) Burrows A., et al., 1997, ApJ, 491, 856
- Carter et al. (2012) Carter J. A., et al., 2012, Science, 337, 556
- Chambers et al. (2016) Chambers K. C., et al., 2016, arXiv e-prints, p. arXiv:1612.05560
- Chao et al. (2020) Chao K.-H., deGraffenried R., Lach M., Nelson W., Truax K., Gaidos E., 2020, arXiv e-prints, p. arXiv:2012.07337
- Chen & Kipping (2017) Chen J., Kipping D., 2017, ApJ, 834, 17
- Chen & Rogers (2016) Chen H., Rogers L. A., 2016, ApJ, 831, 180
- Christiansen et al. (2012) Christiansen J. L., et al., 2012, PASP, 124, 1279
- Cieza et al. (2009) Cieza L. A., et al., 2009, ApJ, 696, L84
- Collins et al. (2017) Collins K. A., Kielkopf J. F., Stassun K. G., Hessman F. V., 2017, AJ, 153, 77
- Colton et al. (2021) Colton N. M., Horch E. P., Everett M. E., Howell S. B., Davidson James W. J., Baptista B. J., Casetti-Dinescu D. I., 2021, AJ, 161, 21
- Cutri & et al. (2012) Cutri R. M., et al. 2012, VizieR Online Data Catalog, p. II/311
- Cutri et al. (2003) Cutri R. M., et al., 2003, VizieR Online Data Catalog, 2246, 0
- Dai et al. (2018) Dai F., Masuda K., Winn J. N., 2018, ApJ, 864, L38
- Dai et al. (2019) Dai F., Masuda K., Winn J. N., Zeng L., 2019, ApJ, 883, 79
- David et al. (2019) David T. J., Petigura E. A., Luger R., Foreman-Mackey D., Livingston J. H., Mamajek E. E., Hillenbrand L. A., 2019, ApJ, 885, L12
- David et al. (2020) David T. J., et al., 2020, arXiv e-prints, p. arXiv:2011.09894
- Demory et al. (2016) Demory B.-O., et al., 2016, Nature, 532, 207
- Dholakia et al. (2020) Dholakia S., Dholakia S., Mayo A. W., Dressing C. D., 2020, AJ, 159, 93
- Dotter (2016) Dotter A., 2016, ApJS, 222, 8
- Duncan et al. (1991) Duncan D. K., et al., 1991, ApJS, 76, 383
- Eastman et al. (2013) Eastman J., Gaudi B. S., Agol E., 2013, PASP, 125, 83
- Eastman et al. (2019) Eastman J. D., et al., 2019, arXiv e-prints, p. arXiv:1907.09480
- Eisner et al. (2005) Eisner J. A., Hillenbrand L. A., White R. J., Akeson R. L., Sargent A. I., 2005, ApJ, 623, 952
- Fabrycky et al. (2014) Fabrycky D. C., et al., 2014, ApJ, 790, 146
- Fischer & Valenti (2005) Fischer D. A., Valenti J., 2005, ApJ, 622, 1102
- Fleming et al. (1995) Fleming T. A., Schmitt J. H. M. M., Giampapa M. S., 1995, ApJ, 450, 401
- Foreman-Mackey (2016) Foreman-Mackey D., 2016, The Journal of Open Source Software, 1, 24
- Foreman-Mackey et al. (2020) Foreman-Mackey D., Luger R., Czekala I., Agol E., Price-Whelan A., Barclay T., 2020, exoplanet-dev/exoplanet v0.3.2, doi:10.5281/zenodo.1998447, https://doi.org/10.5281/zenodo.1998447
- Fulton et al. (2017) Fulton B. J., et al., 2017, The Astronomical Journal, 154, 109
- Furesz (2008) Furesz G., 2008, PhD thesis, Univ. of Szeged, Hungary
- Gaia Collaboration et al. (2018) Gaia Collaboration et al., 2018, A&A, 616, A1
- Giacalone & Dressing (2020) Giacalone S., Dressing C. D., 2020, triceratops: Candidate exoplanet rating tool (ascl:2002.004)
- Giacalone et al. (2021) Giacalone S., et al., 2021, AJ, 161, 24
- Gilliland et al. (2011) Gilliland R. L., et al., 2011, ApJS, 197, 6
- Ginzburg et al. (2016) Ginzburg S., Schlichting H. E., Sari R., 2016, ApJ, 825, 29
- Ginzburg et al. (2018) Ginzburg S., Schlichting H. E., Sari R., 2018, MNRAS, 476, 759
- Green (2018) Green G., 2018, The Journal of Open Source Software, 3, 695
- Green et al. (2019) Green G. M., Schlafly E., Zucker C., Speagle J. S., Finkbeiner D., 2019, ApJ, 887, 93
- Gupta & Schlichting (2019) Gupta A., Schlichting H. E., 2019, Monthly Notices of the Royal Astronomical Society, 487, 24
- Gupta & Schlichting (2020a) Gupta A., Schlichting H. E., 2020a, Monthly Notices of the Royal Astronomical Society, 493, 792
- Gupta & Schlichting (2020b) Gupta A., Schlichting H. E., 2020b, MNRAS, 493, 792
- Hamer & Schlaufman (2020) Hamer J. H., Schlaufman K. C., 2020, AJ, 160, 138
- Høg et al. (2000) Høg E., et al., 2000, A&A, 355, L27
- Howard et al. (2012) Howard A. W., et al., 2012, ApJS, 201, 15
- Howell et al. (2011) Howell S. B., Everett M. E., Sherry W., Horch E., Ciardi D. R., 2011, AJ, 142, 19
- Howell et al. (2021) Howell S. B., Matson R. A., Ciardi D. R., Everett M. E., Livingston J. H., Scott N. J., Horch E. P., Winn J. N., 2021, AJ, 161, 164
- Inamdar & Schlichting (2016) Inamdar N. K., Schlichting H. E., 2016, ApJ, 817, L13
- Jackson et al. (2012) Jackson A. P., Davis T. A., Wheatley P. J., 2012, MNRAS, 422, 2024
- Jang-Condell (2015) Jang-Condell H., 2015, ApJ, 799, 147
- Jenkins (2002) Jenkins J. M., 2002, ApJ, 575, 493
- Jenkins et al. (2010) Jenkins J. M., et al., 2010, in Radziwill N. M., Bridger A., eds, Society of Photo-Optical Instrumentation Engineers (SPIE) Conference Series Vol. 7740, Software and Cyberinfrastructure for Astronomy. p. 77400D, doi:10.1117/12.856764
- Jenkins et al. (2016) Jenkins J. M., et al., 2016, in Chiozzi G., Guzman J. C., eds, Society of Photo-Optical Instrumentation Engineers (SPIE) Conference Series Vol. 9913, Software and Cyberinfrastructure for Astronomy IV. p. 99133E, doi:10.1117/12.2233418
- Jensen (2013) Jensen E., 2013, Tapir: A web interface for transit/eclipse observability, Astrophysics Source Code Library (ascl:1306.007)
- Jin et al. (2014) Jin S., Mordasini C., Parmentier V., van Boekel R., Henning T., Ji J., 2014, ApJ, 795, 65
- Kempton et al. (2018) Kempton E. M. R., et al., 2018, PASP, 130, 114401
- Kipping (2013a) Kipping D. M., 2013a, MNRAS, 434, L51
- Kipping (2013b) Kipping D. M., 2013b, MNRAS, 435, 2152
- Kipping (2014) Kipping D. M., 2014, MNRAS, 444, 2263
- Kipping & Sandford (2016) Kipping D. M., Sandford E., 2016, MNRAS, 463, 1323
- Klein et al. (2021) Klein B., et al., 2021, MNRAS, 502, 188
- Kreidberg et al. (2019) Kreidberg L., et al., 2019, Nature, 573, 87
- Kubyshkina et al. (2019a) Kubyshkina D., et al., 2019a, A&A, 632, A65
- Kubyshkina et al. (2019b) Kubyshkina D., et al., 2019b, ApJ, 879, 26
- Kurucz (1992) Kurucz R. L., 1992, in Barbuy B., Renzini A., eds, Vol. 149, The Stellar Populations of Galaxies. p. 225
- Lacy & Burrows (2020) Lacy B., Burrows A., 2020, ApJ, 892, 151
- Lee & Chiang (2017) Lee E. J., Chiang E., 2017, ApJ, 842, 40
- Lee & Connors (2021) Lee E. J., Connors N. J., 2021, ApJ, 908, 32
- Li et al. (2019) Li J., Tenenbaum P., Twicken J. D., Burke C. J., Jenkins J. M., Quintana E. V., Rowe J. F., Seader S. E., 2019, PASP, 131, 024506
- Lightkurve Collaboration et al. (2018) Lightkurve Collaboration et al., 2018, Lightkurve: Kepler and TESS time series analysis in Python, Astrophysics Source Code Library (ascl:1812.013)
- Lindegren (2018) Lindegren L., 2018, Re-normalising the astrometric chi-square in Gaia DR2, GAIA-C3-TN-LU-LL-124, http://www.rssd.esa.int/doc_fetch.php?id=3757412
- Lindegren et al. (2018) Lindegren L., et al., 2018, A&A, 616, A2
- Linder et al. (2019) Linder E. F., Mordasini C., Mollière P., Marleau G.-D., Malik M., Quanz S. P., Meyer M. R., 2019, A&A, 623, A85
- Livingston et al. (2019) Livingston J. H., et al., 2019, MNRAS, 484, 8
- Lopez & Fortney (2013) Lopez E. D., Fortney J. J., 2013, ApJ, 776, 2
- Lopez & Rice (2018) Lopez E. D., Rice K., 2018, MNRAS, 479, 5303
- Luger et al. (2019) Luger R., Agol E., Foreman-Mackey D., Fleming D. P., Lustig-Yaeger J., Deitrick R., 2019, AJ, 157, 64
- Luhn et al. (2020) Luhn J. K., Wright J. T., Howard A. W., Isaacson H., 2020, AJ, 159, 235
- Malavolta et al. (2018) Malavolta L., et al., 2018, AJ, 155, 107
- Mamajek & Hillenbrand (2008) Mamajek E. E., Hillenbrand L. A., 2008, ApJ, 687, 1264
- Mann et al. (2017) Mann A. W., et al., 2017, AJ, 153, 64
- Mann et al. (2020) Mann A. W., et al., 2020, AJ, 160, 179
- Millholland & Spalding (2020) Millholland S. C., Spalding C., 2020, ApJ, 905, 71
- Minkowski & Abell (1963) Minkowski R. L., Abell G. O., 1963, The National Geographic Society-Palomar Observatory Sky Survey. p. 481
- Montet et al. (2020) Montet B. T., et al., 2020, AJ, 159, 112
- Moraux et al. (2013) Moraux E., et al., 2013, A&A, 560, A13
- Mordasini et al. (2009) Mordasini C., Alibert Y., Benz W., 2009, A&A, 501, 1139
- Morton (2015) Morton T. D., 2015, VESPA: False positive probabilities calculator (ascl:1503.011)
- Murray & Dermott (1999) Murray C. D., Dermott S. F., 1999, Solar system dynamics
- Muzerolle et al. (2003) Muzerolle J., Calvet N., Hartmann L., D’Alessio P., 2003, ApJ, 597, L149
- Nardiello et al. (2020) Nardiello D., et al., 2020, MNRAS, 495, 4924
- Narita et al. (2019) Narita N., et al., 2019, Journal of Astronomical Telescopes, Instruments, and Systems, 5, 015001
- Newton et al. (2019) Newton E. R., et al., 2019, ApJ, 880, L17
- Newton et al. (2021) Newton E. R., et al., 2021, AJ, 161, 65
- Oh et al. (2017) Oh S., Price-Whelan A. M., Hogg D. W., Morton T. D., Spergel D. N., 2017, The Astronomical Journal, 153, 257
- Owen (2020) Owen J. E., 2020, MNRAS, 498, 5030
- Owen & Campos Estrada (2020) Owen J. E., Campos Estrada B., 2020, MNRAS, 491, 5287
- Owen & Wu (2013) Owen J. E., Wu Y., 2013, ApJ, 775, 105
- Parviainen et al. (2019) Parviainen H., et al., 2019, A&A, 630, A89
- Parviainen et al. (2020) Parviainen H., et al., 2020, A&A, 633, A28
- Pepper et al. (2007) Pepper J., et al., 2007, PASP, 119, 923
- Pepper et al. (2012) Pepper J., Kuhn R. B., Siverd R., James D., Stassun K., 2012, PASP, 124, 230
- Pepper et al. (2018) Pepper J., Stassun K. G., Gaudi B. S., 2018, KELT: The Kilodegree Extremely Little Telescope, a Survey for Exoplanets Transiting Bright, Hot Stars. Springer International Publishing, Cham, pp 969–980, doi:10.1007/978-3-319-55333-7_128, https://doi.org/10.1007/978-3-319-55333-7_128
- Petigura et al. (2018) Petigura E. A., et al., 2018, AJ, 155, 89
- Petrovich et al. (2019) Petrovich C., Deibert E., Wu Y., 2019, AJ, 157, 180
- Poppenhaeger et al. (2021) Poppenhaeger K., Ketzer L., Mallonn M., 2021, MNRAS, 500, 4560
- Price-Whelan & Brammer (2020) Price-Whelan A., Brammer G., 2020, adrn/pyia v1.2, doi:10.5281/zenodo.4300654, https://doi.org/10.5281/zenodo.4300654
- Pu & Lai (2019) Pu B., Lai D., 2019, MNRAS, 488, 3568
- Rebull et al. (2016) Rebull L. M., et al., 2016, AJ, 152, 113
- Rebull et al. (2017) Rebull L. M., Stauffer J. R., Hillenbrand L. A., Cody A. M., Bouvier J., Soderblom D. R., Pinsonneault M., Hebb L., 2017, ApJ, 839, 92
- Reid et al. (1991) Reid I. N., et al., 1991, PASP, 103, 661
- Ricker et al. (2015) Ricker G. R., et al., 2015, Journal of Astronomical Telescopes, Instruments, and Systems, 1, 014003
- Rizzuto et al. (2020) Rizzuto A. C., et al., 2020, AJ, 160, 33
- Rogers & Owen (2021) Rogers J. G., Owen J. E., 2021, MNRAS,
- Salvatier et al. (2016) Salvatier J., Wiecki T. V., Fonnesbeck C., 2016, PeerJ Computer Science, 2, e55
- Sanchis-Ojeda et al. (2014) Sanchis-Ojeda R., Rappaport S., Winn J. N., Kotson M. C., Levine A., El Mellah I., 2014, ApJ, 787, 47
- Sandoval et al. (2020) Sandoval A., Contardo G., David T. J., 2020, arXiv e-prints, p. arXiv:2012.09239
- Savel et al. (2020) Savel A. B., Dressing C. D., Hirsch L. A., Ciardi D. R., Fleming J. P., Giacalone S. A., Mayo A. W., Christiansen J. L., 2020, The Astronomical Journal, 160, 287
- Schlafly & Finkbeiner (2011) Schlafly E. F., Finkbeiner D. P., 2011, ApJ, 737, 103
- Schlaufman et al. (2010) Schlaufman K. C., Lin D. N. C., Ida S., 2010, ApJ, 724, L53
- Schlegel et al. (1998) Schlegel D. J., Finkbeiner D. P., Davis M., 1998, ApJ, 500, 525
- Seager & Mallén-Ornelas (2003) Seager S., Mallén-Ornelas G., 2003, ApJ, 585, 1038
- Stassun et al. (2018) Stassun K. G., et al., 2018, The Astronomical Journal, 156, 102
- Steffen & Coughlin (2016) Steffen J. H., Coughlin J. L., 2016, Proceedings of the National Academy of Science, 113, 12023
- Steffen & Farr (2013) Steffen J. H., Farr W. M., 2013, ApJ, 774, L12
- Telting et al. (2014) Telting J. H., et al., 2014, Astronomische Nachrichten, 335, 41
- Theano Development Team (2016) Theano Development Team 2016, arXiv e-prints, abs/1605.02688
- Tofflemire et al. (2021) Tofflemire B. M., et al., 2021, AJ, 161, 171
- Triaud (2018) Triaud A. H. M. J., 2018, The Rossiter-McLaughlin Effect in Exoplanet Research. p. 2, doi:10.1007/978-3-319-55333-7_2
- Twicken et al. (2018) Twicken J. D., et al., 2018, PASP, 130, 064502
- Van Cleve et al. (2016) Van Cleve J. E., et al., 2016, PASP, 128, 075002
- Vanderburg et al. (2016) Vanderburg A., et al., 2016, ApJ, 827, L10
- Vanderburg et al. (2019) Vanderburg A., et al., 2019, ApJ, 881, L19
- Vaughan et al. (1978) Vaughan A. H., Preston G. W., Wilson O. C., 1978, PASP, 90, 267
- Voges et al. (2000) Voges W., et al., 2000, VizieR Online Data Catalog, p. IX/29
- Wang et al. (2014a) Wang J., Xie J.-W., Barclay T., Fischer D. A., 2014a, ApJ, 783, 4
- Wang et al. (2014b) Wang J., Fischer D. A., Xie J.-W., Ciardi D. R., 2014b, ApJ, 791, 111
- Wilson (1978) Wilson O. C., 1978, ApJ, 226, 379
- Winn et al. (2017) Winn J. N., et al., 2017, AJ, 154, 60
- Winn et al. (2018) Winn J. N., Sanchis-Ojeda R., Rappaport S., 2018, New A Rev., 83, 37
- Wolfgang et al. (2016) Wolfgang A., Rogers L. A., Ford E. B., 2016, ApJ, 825, 19
- Wyatt et al. (2020) Wyatt M. C., Kral Q., Sinclair C. A., 2020, MNRAS, 491, 782
- Yang et al. (2020) Yang J.-Y., Xie J.-W., Zhou J.-L., 2020, AJ, 159, 164
- Zacharias et al. (2017) Zacharias N., Finch C., Frouard J., 2017, VizieR Online Data Catalog, 1340
- Zhou et al. (2020) Zhou G., et al., 2020, ApJ, 892, L21
- Zhou et al. (2021) Zhou G., et al., 2021, AJ, 161, 2
- Žerjal et al. (2017) Žerjal M., et al., 2017, ApJ, 835, 61