The most metal-rich asymptotic giant branch stars
Abstract
We present new stellar evolutionary sequences of very metal-rich stars evolved with the Monash Stellar Structure code and with MESA. The Monash models include masses of with metallicities to and are evolved from the main sequence to the thermally-pulsing asymptotic giant branch (AGB). These are the first AGB models in the literature. The MESA models include intermediate-mass models with to evolved to the onset of the thermally-pulsing phase. Third dredge-up only occurs in intermediate-mass models . Hot bottom burning (HBB) shows a weaker dependence on metallicity, with the minimum mass increasing from 4.5 for to for Z = 0.04, for and above 6.5 for . The behaviour of the models is unusual; most do not experience He-shell instabilities owing to rapid mass-loss on the early part of the AGB. Turning off mass-loss produces He-shell instabilities, however thermal pulses are weak and result in no third dredge-up. The minimum mass for carbon ignition is reduced from 8 for to 7 for , which implies a reduction in the minimum mass for core-collapse supernovae. MESA models of similarly high metallicity () show the same lowering of the minimum mass for carbon ignition: carbon burning is detected in a model at the highest metallicity () and in all models with . This demonstrates robustness of the lowered carbon burning threshold across codes.
keywords:
nucleosynthesis, abundances — stars: AGB and post-AGB — ISM: abundances — Galaxy: abundances1 Introduction
Low and intermediate-mass stars evolve through core hydrogen and helium burning before ascending the asymptotic giant branch phase (AGB). It is during the AGB that the richest nucleosynthesis occurs, driven by mixing episodes between the core and envelope. Prior to the thermally-pulsing AGB (TP-AGB), first and second dredge-up may also occur, which change the surface composition by bringing the products of hydrogen burning to the surface. For reviews of the evolution of low and intermediate-mass stars we refer to Iben & Renzini (1983), Busso et al. (1999), Herwig (2005), and Karakas & Lattanzio (2014) and references therein.
Stellar yields from thermally-pulsing AGB stars are shaped by the repeated action of the third dredge-up (TDU), which mixes the products of partial He-burning to the stellar envelope, and hot bottom burning (HBB). TDU can cause the surface composition to become carbon rich, where the number of carbon atoms exceeds the number of oxygen atoms, i.e., C/O . The minimum stellar mass for TDU depends on initial parameters such as mass and metallicity, and is for solar metallicity (e.g., Groenewegen et al., 1995; Marigo et al., 2020). There is evidence for TDU occurring in low-mass Galactic AGB stars of , which is a challenge to model if we find that these stars are around solar metallicity (Shetye et al., 2019).
Theoretical models predict that TDU has a strong metallicity dependence (Boothroyd & Sackmann, 1988; Straniero et al., 1997; Karakas et al., 2002). Low-metallicity stellar models show more efficient TDU as well as a lower minimum mass, while above solar metallicity we predict the reverse, that the minimum mass increases and the efficiency at a given mass is reduced (Karakas, 2014; Weiss & Ferguson, 2009; Ventura et al., 2020). What happens when the metallicity is greater than about twice the solar value? There are currently too few AGB models in the literature to answer this question.
HBB occurs when the base of the convective envelope becomes hot enough to sustain proton capture nucleosynthesis (Bloecker & Schoenberner, 1991; Boothroyd & Sackmann, 1992; Lattanzio, 1992; Ventura et al., 2013). The efficiency of HBB depends on the temperature and density gradients near the base of the envelope, and on the peak temperature in that region. These quantities depend on the total stellar mass, core mass, and metallicity as well as on the convective model adopted in the stellar evolution code (e.g., Ventura & D’Antona, 2005a).
The minimum initial mass for HBB is approximately 5 for solar metallicity (Marigo et al., 2013a; Karakas, 2014). However different codes predict different minimums. For models around solar metallicity, the minimum varies from 3.5 (e.g., Ventura et al., 2018) to 6 (Weiss & Ferguson, 2009) or even no HBB at all (Straniero et al., 2014). All codes predict the same qualitative trend with metallicity in that the minimum mass decreases as a function of decreasing metallicity, and at a given mass the maximum temperature reached at the base of the envelope increases. The minimum mass for HBB for very metal-rich AGB stars is uncertain, as there are few models in the literature.
In Karakas (2014) we present grids of low and intermediate-mass mass stars between of solar metallicity, and a factor of two above and below solar. Solar metallicity in that paper and here is defined as (Asplund et al., 2009), so the full metallicity range considered is and . In a follow-up paper, Karakas & Lugaro (2016) provide the first grid of super-solar AGB yields, including the -process, for AGB stars of . Interestingly, the mass range of carbon stars narrowed from 1.5 to 4.5 to 3 to 4 when the metallicity was increased by a factor of two above solar, and the minimum mass for HBB increased to 5 (also see models by Marigo et al., 2013b).
There is a metallicity ceiling to carbon star production (Boyer et al., 2013, 2019; Marigo et al., 2017), which limits the amount of carbon that AGB stars can make as a function of increasing metallicity. Here, the metallicity ceiling is a result of two reasons: 1) the increasing amount of oxygen with increasing means it is more difficult to dredge-up enough carbon to reach C/O , and 2) the predicted TDU efficiency decreases from solar to (Karakas, 2014). What happens in very metal-rich AGB stars above twice solar? Could the TDU simply not occur in low-mass stars below about 4?
Thinking more generally, is there an upper metallicity limit above which AGB nucleosynthesis does not enrich the stellar surface? Here we include the nucleosynthesis contribution from HBB, which occurs in intermediate-mass AGB models of at solar metallicities. Or indeed, perhaps a metal-rich threshold for low and intermediate-mass stars to enter the AGB phase itself? If so, this means that above some metallicity threshold, AGB stars no longer contribute to the chemical evolution of carbon and -process elements through single stellar evolution. In this study we aim to answer these questions by considering models of the most metal-rich AGB stars.
These questions include: (1) how do very metal-rich models of low and intermediate-mass stars compare to their lower metallicity counterparts? (2) Are there significant changes to stellar lifetime, to the depth of first and second dredge-up, to the extended radii on the giant branches? On the AGB phase we need to consider the strength of thermal pulses, the temperatures in the burning shells, and on the efficiency of mixing episodes. How do the minimum masses for TDU and HBB depend on mass and metallicity, as the metallicity increases well above solar?
These results carry important implications for the composition of dust production in galaxies (e.g., Lugaro et al., 2020; Ventura et al., 2020), and for the chemical evolution of galaxies (Romano et al., 2010; Kobayashi et al., 2020). In particular, the inner regions of spiral galaxies such as our Milky Way Galaxy and M 31, along with giant ellipticals may harbour very metal-rich stellar populations (Worthey, 1994; Ness & Freeman, 2016; Do et al., 2018; Thorsbro et al., 2020). Stellar evolution fitting of metal-rich star clusters (e.g., NGC 6791, NGC 6253 and NGC 6583; Carraro et al., 2006; Netopil et al., 2016), all of which have [Fe/H] , requires models of stars at these metallicities. Very metal-rich stellar models are also required to calculate the survival rates of planets around metal-rich host stars (Villaver & Livio, 2007), where gas giant planets in particular are found in greater numbers around stars with increasing metallicity (e.g., Fischer & Valenti, 2005).
Here we present stellar evolutionary models of low and intermediate-mass stars between 1–8 with to including the full thermally-pulsing AGB phase. This is the first set of AGB models of presented in the literature. While we will focus on the evolution during the AGB phase, we examine the behaviour of the first and second dredge-up at these metallicities, stellar lifetimes, and the minimum mass for core carbon ignition. The minimum mass for core carbon burning ultimately determines which stars become white dwarfs or go onto explode as core collapse supernova (Bono et al., 2000; Ibeling & Heger, 2013; Doherty et al., 2017).
The AGB models are calculated with the Monash Stellar Structure code (Lattanzio, 1986; Frost & Lattanzio, 1996; Karakas, 2014) however the implications for carbon ignition, which shift the boundaries for core-collapse supernovae, require careful checking. As noted by Doherty et al. (2014b), the difficult phase of carbon ignition in the degenerate core of an intermediate-mass AGB star is best done using a diffusive mixing scheme (see also Siess, 2006; Gil-Pons et al., 2013). The version of the Monash Stellar Structure code that we use does not include diffusive mixing and instead uses instantaneous mixing in all convective regions (e.g., as discussed in Karakas, 2014). Therefore, it is important to check that our finding of the minimum mass for C-ignition shifting downwards by at the highest is not a result of input physics or numerical choices. We note that previous studies of metal-rich models that explored this boundary did not comment on this feature (e.g., Mowlavi et al., 1998a) or did not find the turnover in minimum C-ignition mass with increasing (Ibeling & Heger, 2013). For these reason we compute a supplementary grid of stellar tracks with MESA covering metallicities between to 0.09 and masses between 4 to 9. The advantage of MESA is that it includes options for diffusive mixing and convective boundary mixing, and has been successfully used in the 8-10 range by e.g,. Jones et al. (2013, 2014).
2 Metal-rich models in the literature
Meynet et al. (2006) review the evolution of very metal-rich stars, based partly on models from Mowlavi et al. (1998a) and Mowlavi et al. (1998b). While the Meynet et al. (2006) review gives a good overview of the evolution and properties of very metal-rich stars including up to , the discussion concentrates on massive star evolution. There are a number of studies that focus on low and intermediate-mass stellar evolution between to but these do not evolve through the thermally-pulsing AGB phase (Fagotto et al., 1994a, b; Mowlavi et al., 1998a, b; Bono et al., 2000; Salasnich et al., 2000; Claret, 2007; Valcarce et al., 2013).
Models of very metal-rich thermally-pulsing AGB stars are fewer in number. Siess (2007) modelled the evolution of stars with masses between 9-13, which experience off-centre carbon ignition and develop O-Ne cores before evolving through the super-AGB phase. The most metal-rich models were , which is where he set . Models of CO-core AGB stars include those by Bertelli et al. (2008) who used a synthetic treatment of the thermally-pulsing AGB phase of evolution; Weiss & Ferguson (2009) who model AGB stars up to ; Marigo et al. (2013a) model AGB stars with metallicities up to and Marigo et al. (2017) present results for metallicities up to [Fe/H] = ; the MIST models by Choi et al. (2016) up to [Fe/H] = ; and the and AGB models by Ventura et al. (2020). Similar to Siess (2007), Weiss & Ferguson (2009) and Ventura et al. (2020) have a maximum , where the abundances used in the calculations are based on Grevesse & Sauval (1998, that is, ).
Marigo et al. (2017) adopt which means that their most metal-rich models have . The MIST evolutionary models use the same solar metallicity as is adopted here, which means that their most metal-rich models have (assuming a solar scaling of elements). There are currently no AGB models in the literature with .
3 The Stellar models
Here we describe the models calculated and the codes used to calculate them.
3.1 The Monash Stellar Models
. Metallicity, Helium, Hydrogen, [Fe/H] 0.04 0.330 0.630 +0.46 0.05 0.354 0.596 +0.55 0.06 0.375 0.565 +0.63 0.07 0.396 0.534 +0.70 0.08 0.420 0.500 +0.66 0.09 0.438 0.472 +0.81 0.10 0.459 0.441 +0.85
We have calculated new stellar evolutionary sequences with initial masses between 1–8 with metallicities to , with steps of . These masses cover the full mass range of AGB behaviour, from the long-lived, low-mass AGB stars of 1 to models at or just beyond the CO-core limit ().
All evolutionary sequences are evolved from the zero age main sequence through to the end of the thermally-pulsing AGB phase, or until convergence difficulties end the calculations. We do not evolve through to the post-AGB to the white dwarf phase except for a few cases (for details of post-AGB evolution we refer to Miller Bertolami, 2016).
Mass-loss at very high metallicities is highly uncertain. We include mass-loss on the RGB for and no RGB mass-loss for . The assumption of no mass-loss on the RGB is based the short RGB lifetimes of intermediate-mass stars and typically lose very little mass () before reaching the AGB. For RGB mass-loss we use the Reimer’s formula and adopt the free parameter from McDonald & Zijlstra (2015), noting this value was calibrated to globular clusters, systems more metal-poor than we consider here. For the AGB phase we use the semi-empirical Vassiliadis & Wood (1993) mass-loss rate, which was derived for AGB stars in the Milky Way and Magellanic Clouds. We come back to the discuss the effect of mass-loss in § 5.
We use the Mixing-length Theory (MLT) of convection and assume instantaneous mixing in all convective regions. We set the mixing-length parameter . The borders between radiative and convective regions in stellar interiors is notoriously difficult to model; here we use the search for a neutrally stable point from the formal Schwarzschild boundary (Lattanzio, 1986; Frost & Lattanzio, 1996). This method has problems predicting carbon-stars of low enough initial mass to match observations and some overshoot beyond the formal border is needed (Kamath et al., 2012; Karakas et al., 2010; Karakas & Lugaro, 2016). Based on predictions around solar metallicities (e.g., Cristallo et al., 2009; Karakas & Lugaro, 2016), the minimum mass for TDU at a given metallicity is likely to be lower than we predict here. In § 5 we experiment with simple overshoot in order to test this aspect, using the same method as Karakas & Lugaro (2016).
We use the C and N-rich low-temperature molecular opacity tables from Marigo & Aringer (2009), noting that this is the first time that such opacity tables have been used for very metal-rich models of . Other input physics used in the calculations is exactly the same as in Karakas (2014).
3.1.1 Initial composition
We present the initial compositions of the Monash stellar models in Table 1. Here we include the global metallicity, , the helium abundance, , the hydrogen abundance, , where abundances are in mass fraction. We also show the approximate [Fe/H] ratio, where we assume a scaled-solar initial mixture. Here we assume the standard spectroscopic notation: [Fe/H] (Fe/H)(Fe/H)⊙, and abundances are by number.
For the initial compositions in Table 1, we determine the initial helium abundance according to
| (1) |
where is the primordial helium abundance, which we set to 0.2485 (Aver et al., 2013) and (Casagrande et al., 2011). We provide a detailed discussion of these choices in Karakas (2014).
The initial C, N and O abundances are scaled solar, where we adopt the proto-solar values from Table 5 of Asplund et al. (2009). The initial C/O ratio = 0.55 (solar) in all models. Observations of unevolved main sequence stars show that the [C/Fe] and [O/Fe] ratios decrease to slightly sub-solar values of and , respectively for [Fe/H] , while the C/O ratio increases (Bensby & Feltzing, 2006; Nissen et al., 2014; Amarsi et al., 2019). The study of Nissen et al. (2014) extends to metallicities of [Fe/H] and shows that the C/O ratio plateaus around for metal-rich stars. This trend is confirmed by Galactic chemical evolution models (Cescutti et al., 2009; Romano et al., 2019, 2020; Kobayashi et al., 2011, 2020). There is however large scatter in the data, with some metal-rich stars showing close to or around solar values for C/O.
3.2 The MESA Stellar Models
We compute a supplementary grid of stellar tracks with MESA version 11701 (Paxton
et al., 2018) covering input metallicities of through at a resolution of and masses between 4 and 9 at a resolution of . We also compute a grid at solar composition () for comparison.
The models adopt a uniform mixing length of . A grid adopting a uniform, enhanced helium abundance of is computed as well as a separate grid adopting the scaled helium abundances used in the Monash models (see Fig 3). This latter grid is used to compare the codes on the HR diagram.
We use the photosphere_tables option for atmospheric boundary conditions, the Asplund et al. (2009) abundances, the Reimers red giant mass loss scheme with the free parameter set to , same as the Monash models. On the AGB we use the Blöcker (1995) wind scheme with an efficiency parameter of . We invoke the co_burn_plus.net nuclear reaction network, which includes the dominant burning chains required by the proton-proton chains, CNO cycle, helium burning, carbon/oxygen burning, and alpha capture up through silicon (i). As the standard equation of state tables in MESA do not cover metallicities beyond , we cannot match the Monash calculations up to , but our grid is sufficient for detecting the lower carbon burning threshold.
We compute two grids: one which adopts no convective overshoot (as in the Monash stellar models) and one in which a fixed convective overshoot of 0.014 pressure-scaled heights () is set uniformly for all burning regions. The models are terminated according to the condition stop_at_TP = .true., which halts the evolution once a thermal pulse is detected, or an age limit estimated from Table 2–whichever occurs first.
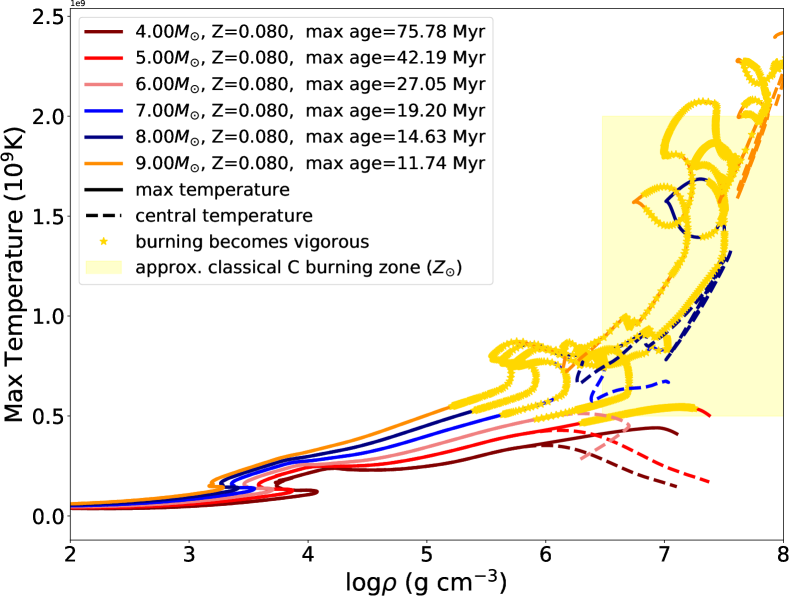
Detection of carbon ignition in the MESA models was performed by analysing Kippenhahn diagrams generated with a modified version of mkipp (Marchant, 2020) and inspection of diagrams, an example of which is shown in Figure 1 for models of .
As in the calculations performed with the Monash code, we find that the carbon burning threshold drops in mass with increasing metallicity, with vigorous, sustained carbon burning appearing for masses as low as for the most metal-rich models (). Our findings for the grids with and without overshoot are summarised in Fig. 10.
4 Results
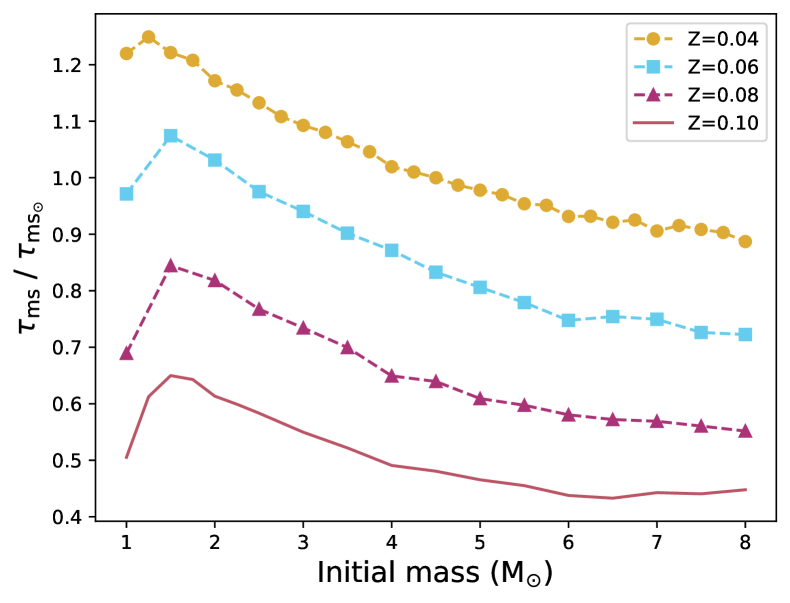
We start with stellar lifetimes in Fig. 2, where we show the ratio of the main-sequence lifetimes to the solar-metallicity main-sequence lifetime from the Monash models. The main-sequence lifetimes of the models are longer than the solar metallicity low-mass models and otherwise similar. Models of increasing metallicity show decreasing main-sequence lifetimes compared to the models and by the models show significantly shorter hydrogen-burning lifetimes. The models show shorter lifetimes for two significant reasons: 1) the reduced hydrogen fuel available to them, and 2) most importantly, the increased luminosity on the main-sequence for each mass, as a consequence of a higher initial mean molecular weight, as discussed by Meynet et al. (2006). To tease out the importance of increasing mean molecular weight we can examine the models of Karakas (2014), which explored the effect of increasing the initial helium abundance in AGB models of the same metallicity. Changes in helium of cause the mean molecular weight to increase by 3%, whereas the main-sequence lifetime changes by up to 20%. However, increasing causes the central temperature to increase (from the perfect gas law) which consequently results in a higher rate of H-burning and a higher main-sequence luminosity.
The significant decrease in in the model of % with respect to the solar metallicity model is consistent with results reported in Mowlavi et al. (1998b). The same relationship between increasing metallicity and decreasing main-sequence lifetime (and lifetime in general) is found in the MESA models. The maximum age of the MESA models–where “max age” is defined as the onset of thermal pulses, at which point the simulations are terminated–drops by at least two-thirds from solar composition () to across all masses considered. Lifetimes for the MESA models are shown in Figure 10.
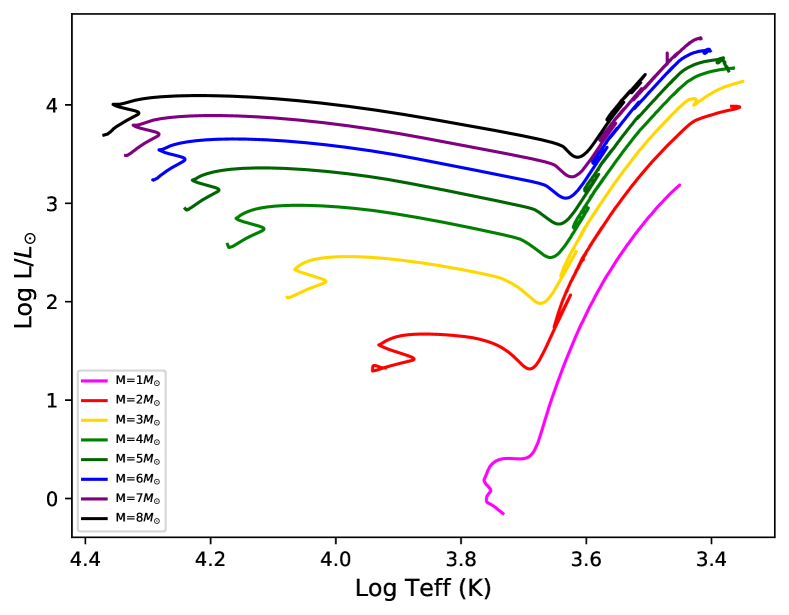
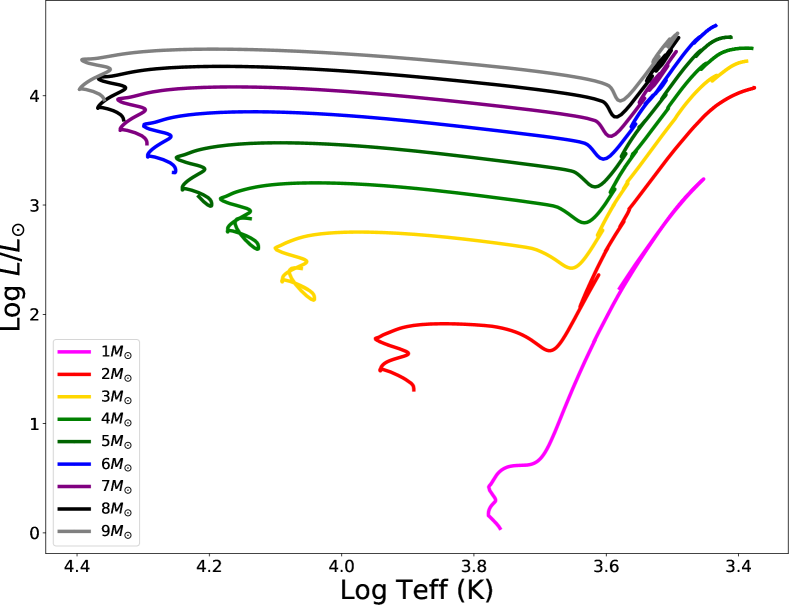
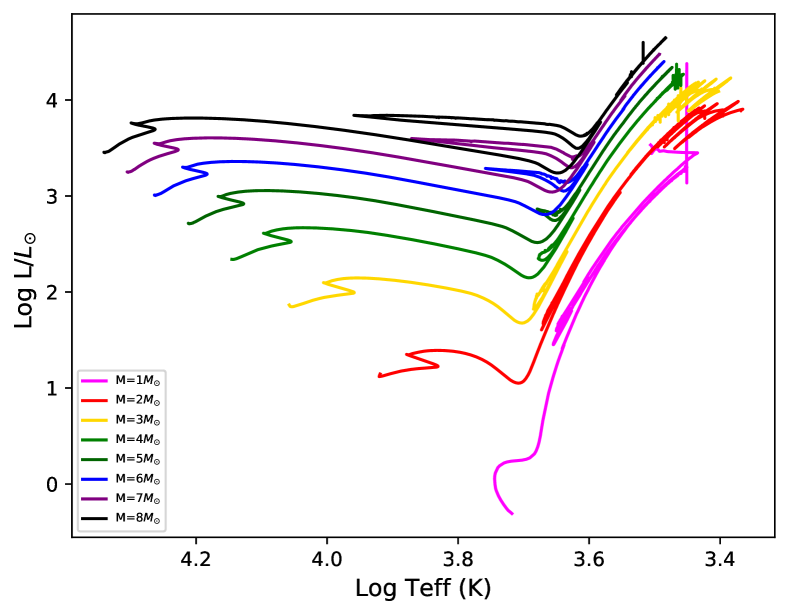
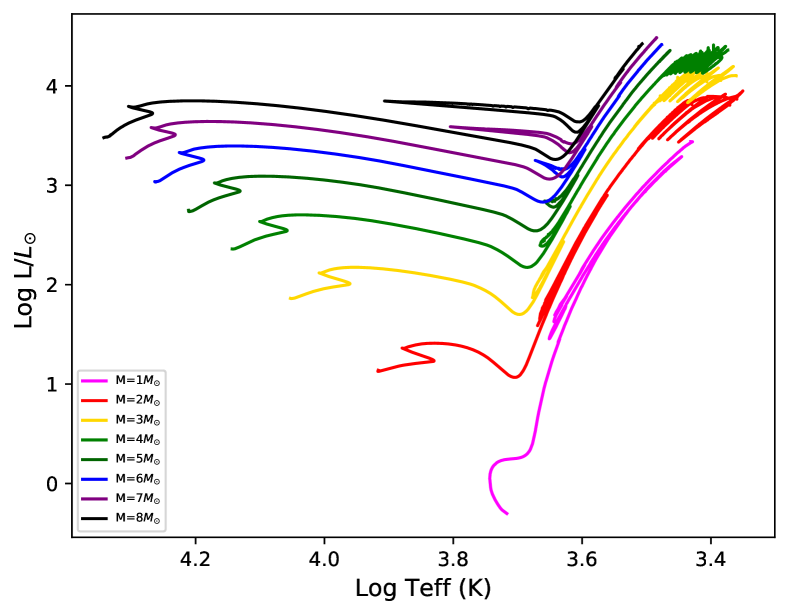
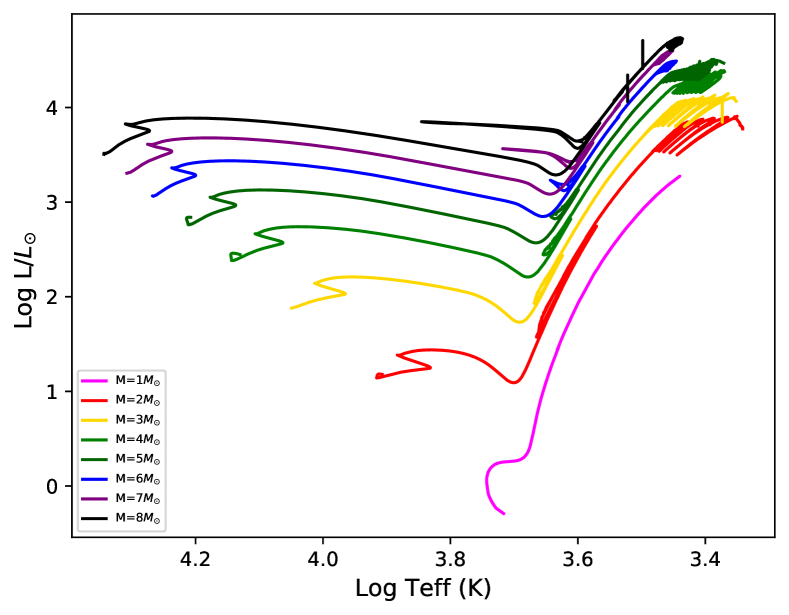
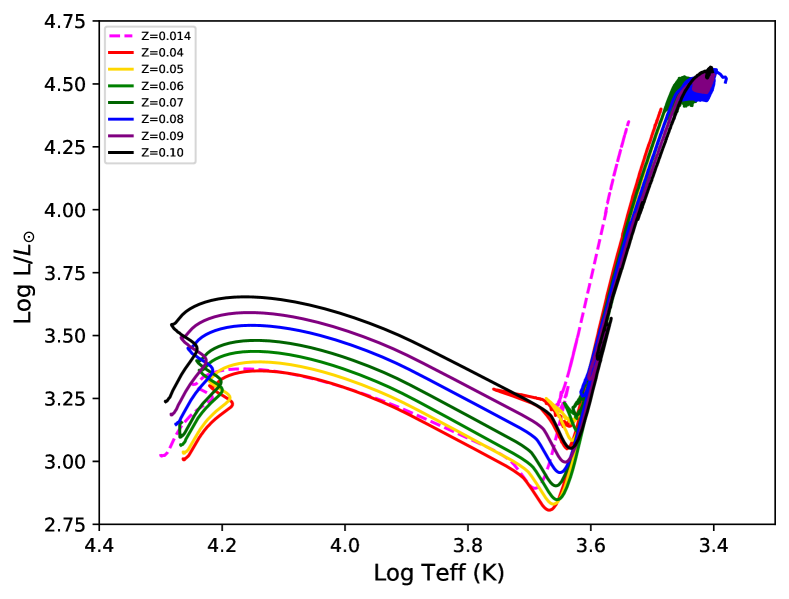
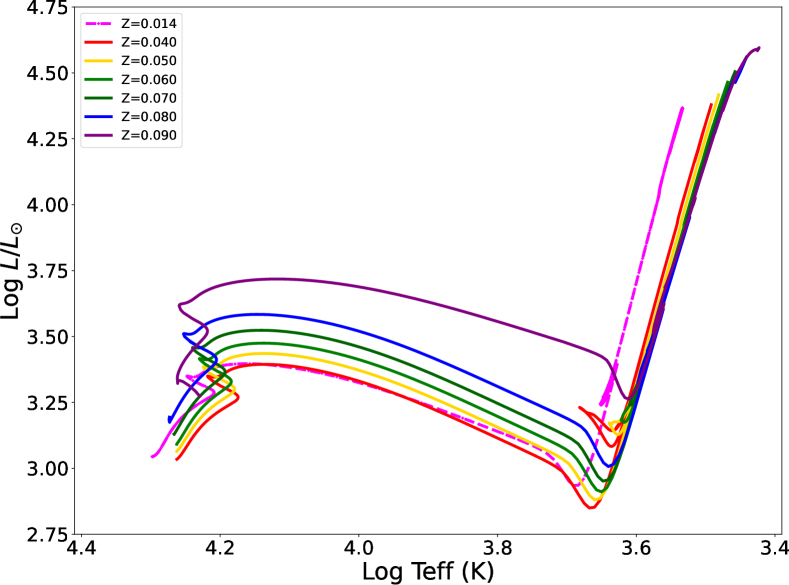
In Fig. 3 we present stellar evolutionary tracks of models of 6 of various metallicity, evolved from the zero-age main sequence to the AGB phase, while the lower panel shows tracks from the MESA models. In the Appendix we include Hertzsprung-Russell diagrams (HRD) for models of , and for all masses in Figs 12, 13, 14 and 11. In Fig. 3 the thermally-pulsing AGB phase has been left out in most cases but can clearly be seen in the Monash evolutionary tracks of the 6, and models.
From Fig 3 and Fig. 11 (in the Appendix) we see some key features of models (see discussions in Mowlavi et al., 1998a, b; Meynet et al., 2006): 1) the higher luminosities compared to their lower metallicity counterparts, as a result of higher central burning temperatures. This means that the 1, model burns hydrogen predominantly via the CNO cycle and has a convective core on the main sequence, evidenced by the evolutionary track shown in Fig 11 (e.g., as also found by Mowlavi et al., 1998a, b). There is a transition metallicity for the development of a convective core in 1 models and that is ; models with metallicity below have radiative cores for most of the main sequence and have a similar structure to models of solar metallicity. An important consequence of the models burning hotter and at higher luminosity on the main sequence is that they enter the post-main sequence phase with larger H-exhausted cores.
Fig. 3 shows how increasing metallicity well above change the evolutionary behaviour of 6 theoretical models. The Monash models shown in the upper panel follow a fairly smooth transition from (using data from Karakas, 2014) to , with the solar metallicity track shown as a dashed-line. Models with begin the main sequence cooler than the solar-metallicity model, whereas models with are hotter and brigher than the solar metallicity model from the zero-age main sequence to the giant branch. By the time the stars reach the AGB the more metal-rich models are overall cooler, owing to a higher opacity, and also considerably brighter at the tip of the AGB, as a consequence of the increasing H-exhausted core mass.
The MESA models, shown in the lower panel of Fig 3, display similar behaviour with increasing metallicity when compared with the Monash models. The MESA models shown in Fig. 3 have been calculated with the same initial helium mass fraction as the Monash models, as shown in the figure legend, and as such show a similar transition to increasing luminosity with increasing metallicity. The one exception is the most metal-rich 6, MESA model, which shows a much higher luminosity at the main-sequence turn-off and sub-giant branch, compared to the Monash models which show a smoother transition from to . We speculate that the main reason for this abrupt increase in for the MESA model may have to do with the opacity extrapolation to these highest metallicities. The luminosities and temperatures of the MESA tracks at the tip of the AGB monotonically increase and decrease, respectively, as a function of metallicity.
4.1 First giant branch
The ascent of the first giant branch (or RGB) is characterised by a deepening of the convective envelope and the first canonical mixing event, the first dredge-up (FDU). The second dredge-up (SDU) occurs later on, during the early AGB, after the model has exhausted its supply of helium in the core. The FDU and SDU mixing events are well studied in theoretical stellar evolutionary models, although most calculations only extend to about twice solar in terms of maximum metallicity (e.g., Becker & Iben, 1979; Maeder & Meynet, 1989; El Eid, 1994; Charbonnel et al., 1996; Forestini & Charbonnel, 1997; Dominguez et al., 1999; Umeda et al., 1999; Siess, 2006; Doherty et al., 2014a).
Both FDU and SDU mixing events dredge-up the products of hydrogen burning from the deep interior to the stellar surface. The depth of mixing depends on the initial mass and metallicity, where FDU is deeper in lower mass stars of while SDU is deeper and reaches the products of complete H-burning in intermediate-mass stars . Here we comment on the depth of these mixing events, as a function of metallicity and mass for .
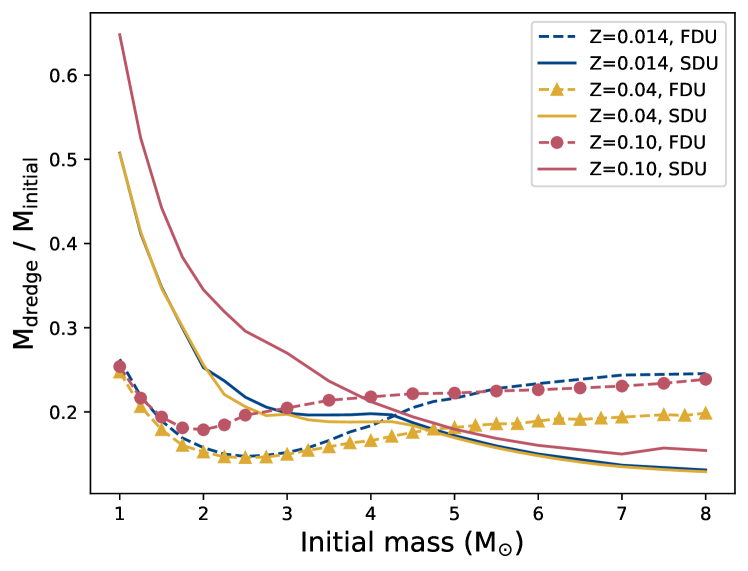
In Figure 4 we show the depth of first and second dredge-up as a function of initial stellar mass for models of solar metallicity (), , and . We can compare this figure to the depth of FDU and SDU found in models of lower metallicities (e.g., Boothroyd & Sackmann, 1999; Karakas & Lattanzio, 2014). FDU in low-mass models of are similar to their solar metallicity counterparts, while FDU is deeper in intermediate-mass models. The increase in FDU depth (relative to the total stellar mass) with increasing metallicity for intermediate stellar masses is consistent with models by Boothroyd & Sackmann (1999) when comparing results for to solar.
Of interest are the models, which have shallower FDU than solar models in the range between 2 to 5 but are otherwise similar. The depth of second dredge-up seems relatively independent of metallicity, even for models of . Likewise the minimum mass for second dredge-up is only mildly metallicity dependent, hovering around for . The minimum mass is reduced in models of to 3.5 as a consequence of a larger H-exhausted core mass post-main sequence.
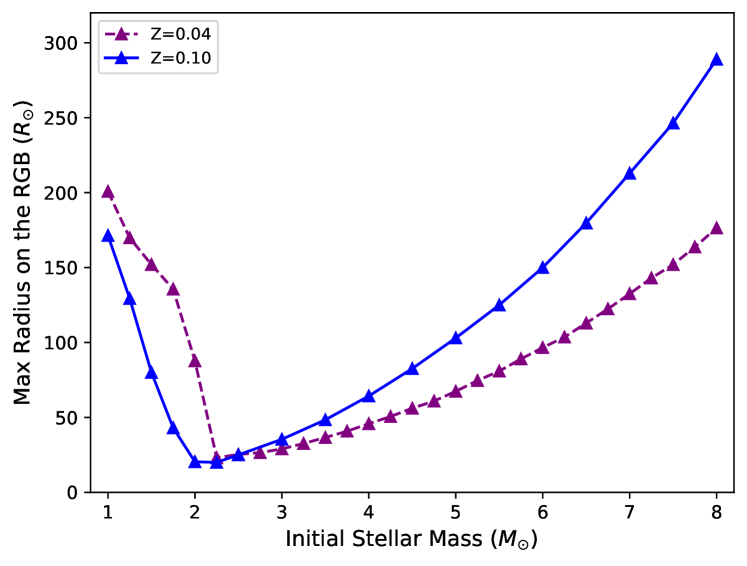
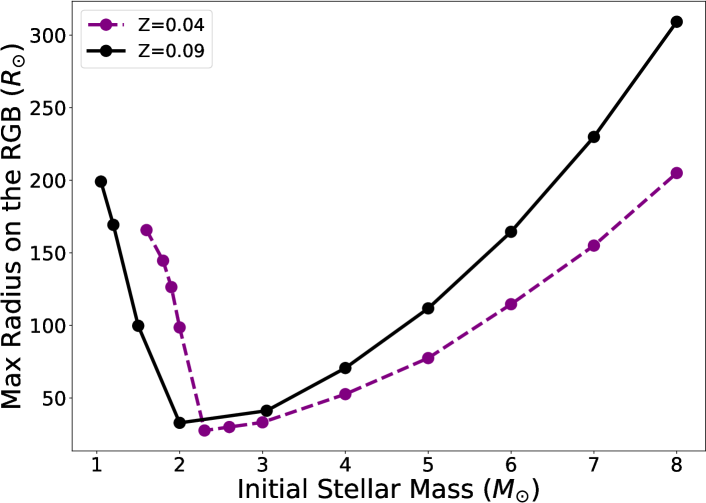
The radius along the first giant branch is an important quantity for binary star interactions and the survival rates of planet around evolved stars (Hurley et al., 2000, 2002; Rasio et al., 1996; Villaver & Livio, 2007). This is because the interactions with a companion are more likely to occur when the most-massive star first expands to giant dimensions. We can examine how metallicity influences the radius along the first giant branch as a function of stellar mass by plotting the maximum radius at the tip of the RGB.
In the upper panel of Fig 5 we show the maximum radius at the tip of the RGB for Monash models of and . In the lower panel of Fig 5, we show the same for MESA models of and .111Models with lie outside of the standard opacity tables in MESA and hence produce convergence problems; we adopt in lieu. The radii at the tip of the RGB show similar trends with initial stellar mass, where the radii is larger in stars that experience the core He-flash, and shows a minimum at around 2, which is the transition from degenerate helium ignition to non-degenerate ignition. It can clearly be seen in Fig. 5 that the minimum radii shifts to slightly higher mass when moving from models of to the most metal-rich models shown ( for Monash; for MESA). Across the two codes the radii are similar with differences of up to about 16%, with the largest differences seen in models of around 8, and smaller differences of % seen in the lower mass stars, e.g., for models of 2, the maximum radius is 88 from Monash and 99 from MESA.
Across codes, we find that the radius for low-mass stars that experience the core helium flash is directly related to their RGB lifetime; longer lifetimes result in higher tip RGB luminosities and radii. The main reason that the tip RGB radius correlates with stellar lifetime is related to the time taken for the cores of low-mass stars to reach the necessary temperatures for core He ignition. Lower mass stars take longer to reach temperatures of 100 million K and consequently their RGB lifetimes are longer; this equates to higher luminosities and cooler effective temperatures on the HRD and therefore larger radii. The core mass at helium ignition is roughly for metallicities from solar to , although the core mass at the core flash does reduce with increasing metallicity, where e.g., at the core mass is 0.46 compared to 0.42 for (in models of 1).
The and models evolve off the main sequence with larger H-exhausted cores, so spend overall less time on the RGB (e.g., the 1.5, model has a RGB lifetime that is 2.7 times shorter than the model). Hence, the maximum radius at the tip of the RGB is larger in models. In contrast, for intermediate-mass stars the maximum radius reached at the tip of the RGB depends primarily on initial composition, with the and models reaching larger radii owing to their high opacities as can be seen in Fig 5.
The maximum stellar mass for the core helium flash is dependent on mass, initial composition and the inclusion of convective overshoot on the main sequence (Bertelli et al., 1986). Here we include no overshoot in both the Monash and MESA models so the minimum mass for the core He-flash is higher compared to models with overshoot by (e.g., Pols et al., 1998). The maximum mass for core He-flash is about 2 for (Karakas, 2014), which rises to 2.5 by . For metallicities above this the trend is reversed and the minimum is around 1.75 for , similar to models of much lower metallicity around (Fishlock et al., 2014). Mowlavi et al. (1998b) find that the maximum mass for core He-flash is 1.5 for , lower than their models of solar metallicity. The reason for the reversal is clear: the most metal-rich models enter the RGB with larger core masses.
4.2 AGB evolution
We now turn our attention to evolution during AGB. Following the exhaustion of helium in the core the convective envelope deepens once again, moving inwards and the star expands back to giant dimensions. There are a number of reviews of AGB evolution, although none extend the discussion to the very metal-rich regime which we are studying here (e.g., Iben, 1991; Busso et al., 1999; Herwig, 2005; Karakas & Lattanzio, 2014, and references therein).
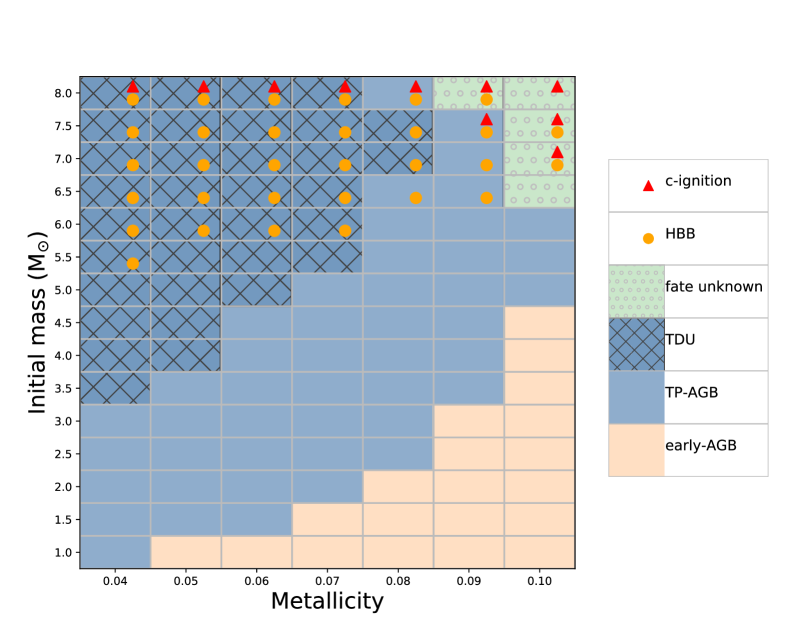
In Fig. 6 we illustrate the behaviour of the Monash AGB models as a function of mass and metallicity, where different coloured squares indicate if the model ends its life on the early-AGB, as a result of intense mass-loss, or makes it to thermally-pulsing AGB phase. We also indicate if the model experiences TDU, HBB and/or carbon burning.
4.2.1 Onset of carbon burning
The maximum mass of a CO-core AGB star is defined by the onset of carbon burning. Stars between about 8 to 12 ignite carbon off centre before going through a brief phase of core carbon burning (Siess, 2006; Doherty et al., 2010; Jones et al., 2013). Stars at the lower end of this mass range (approximately 8-10) will enter the AGB with ONe cores and evolve through a super-AGB phase, before losing their envelopes through mass-loss to die as massive ONe white dwarfs. In contrast, C ignition moves progressively toward the centre in the upper mass range above about 10, and these stars may experience neon-burning flashes, before exploding as electron-capture supernovae (Jones et al., 2014; Doherty et al., 2017). The upper initial mass for a CO-core AGB star is about 8 for solar metallicity (Karakas, 2014; Doherty et al., 2014a), although similar to the core He-flash the result depends on the inclusion of core overshoot during the main sequence and core He burning phases (Gil-Pons et al., 2007).
Another interesting feature of our very metal-rich models is that the onset of carbon burning moves to lower initial masses with increasing metallicity, as a consequence of earlier evolution. Among the Monash models, by the minimum stellar mass to experience carbon ignition is the 7 model, which experiences off-centre carbon flashes, although carbon burning does not reach the centre. This is very similar to the behaviour experienced by the 8 model of solar metallicity (Karakas, 2014; Doherty et al., 2014a). These models are not super-AGB stars although they are at the border, and would end their lives as hybrid C-O/O-Ne white dwarfs (Doherty et al., 2017). MESA models with through experience carbon ignition at as well, this drops to 6 for the case of . For MESA models that invoke a small amount of convective overshoot (), this mass threshold drops even further to at and at . The slight difference in carbon burning mass thresholds between the two codes is easily explained by differences in microphysics and convective prescriptions.
From Fig. 6 we see that all of the 8 Monash models with experience carbon ignition. All of these models end their lives as hybrid white dwarfs, except the 8 models of and , which burn carbon through to the centre. Both of these are expected to become O-Ne white dwarfs, possibly after a super-AGB phase depending on the mass-loss rate. We did not follow the evolution of these models into the super-AGB phase, owing to numerical difficulties during carbon burning. We also did not follow the evolution of the 7, model beyond SDU. The model had already lost just over 1 by the time the calculation ended, and would likely enter the thermally-pulsing phase, albeit at very high luminosity ().
The analogue of Fig 6 for the MESA models is given in Fig 10. This table provides the detection of carbon burning and other qualitative features of the stellar interior (e.g. location of the carbon burning region; whether or not there is a deeper convective pocket of burning present) as a function of mass and metallicity for MESA models with no convective overshoot. The criterion “burning is vigorous” refers to the detection of the burning chain coincident with neutrino losses, as in Farmer et al. (2015). MESA models are uniformly halted at the beginning of the TP-AGB, so “maximum age” refers to the lifetime of the star from the ZAMS (plus an additional Myr, accounting for pre-main sequence convergence) to the onset of thermal pulses.
Mowlavi et al. (1998b) evolved models of 7 and 9 for and note that the 9 experiences carbon burning. Inspection of the plot from that paper (their Fig. 3) shows that the 7 evolution may have ended during C ignition, with an upturn in temperature evident in the figure. The final position of the 7 is in a region that looks occupied by other models that experience C burning, consistent with our results.
4.2.2 Thermally-pulsing AGB phase
In this section we present results from the TP-AGB phase of evolution and concentrate our discussion from here on results from the Monash stellar models.
In Table 2 we present data for the AGB models of , with tables for the other metallicities included in the Appendix in Tables 3 and 4. Each table contains the initial mass, if SDU occurs, the number of thermal pulses (TPs), the maximum TDU efficiency parameter, , the minimum mass for the occurrence of thermal pulses (in ), the maximum temperature at the base of the convective envelope (in K, MK), the maximum radiated luminosity (in the format , where is in ), the maximum luminosity from the He-shell (in the format , where is in ), the total stellar lifetime ( in Myr), and the RGB and AGB lifetimes, respectively ( and , in Myr). The AGB lifetime includes time spent on the early AGB, before the first thermal pulse, along with the thermally-pulsing AGB lifetime. Table 2 for the models also includes the TP-AGB lifetime (, in Myr), which is the time from the first thermal pulse to the end of the AGB phase. We define He-shell flashes (thermal pulses) to occur if the He-shell luminosity exceeds and for the He-shell luminosity to exceed the radiated luminosity.
| Mass | SDU | #TP | |||||||||
|---|---|---|---|---|---|---|---|---|---|---|---|
| () | () | (MK) | () | () | (Myr) | (Myr) | (Myr) | (Myr) | |||
| , models. | |||||||||||
| 1.00 | No | 6 | 0.00 | 0.573 | 1.13 | 3.67 | 5.12 | 15200 | 3347 | 23.6 | 0.26 |
| 1.25 | No | 7 | 0.00 | 0.580 | 2.13 | 3.73 | 5.24 | 6620 | 1811 | 30.0 | 0.28 |
| 1.50 | No | 8 | 0.00 | 0.582 | 2.62 | 3.75 | 5.27 | 3452 | 843 | 20.8 | 0.31 |
| 1.75 | No | 12 | 0.00 | 0.581 | 2.93 | 3.82 | 5.56 | 2076 | 376 | 19.0 | 0.49 |
| 2.00 | No | 17 | 0.00 | 0.577 | 3.26 | 3.90 | 5.89 | 1394 | 169 | 22.7 | 0.75 |
| 2.25 | No | 23 | 0.00 | 0.571 | 3.64 | 3.96 | 6.21 | 1132 | 68.0 | 25.3 | 1.1 |
| 2.50 | No | 26 | 0.00 | 0.579 | 4.05 | 4.02 | 6.37 | 851.2 | 38.8 | 21.7 | 1.1 |
| 2.75 | No | 28 | 0.00 | 0.584 | 4.58 | 4.07 | 6.51 | 645.0 | 25.8 | 17.9 | 1.0 |
| 3.00 | No | 28 | 0.00 | 0.610 | 5.28 | 4.11 | 6.65 | 493.1 | 18.2 | 13.1 | 0.90 |
| 3.25 | No | 27 | 0.35 | 0.634 | 6.20 | 4.15 | 6.94 | 443.5 | 13.2 | 11.1 | 0.74 |
| 3.50 | No | 22 | 0.58 | 0.672 | 7.50 | 4.19 | 7.28 | 302.0 | 10.2 | 8.29 | 0.49 |
| 3.75 | No | 18 | 0.67 | 0.715 | 10.0 | 4.22 | 7.39 | 244.2 | 8.00 | 6.25 | 0.31 |
| 4.00 | No | 16 | 0.71 | 0.761 | 14.0 | 4.27 | 7.36 | 203.1 | 6.37 | 4.61 | 0.19 |
| 4.25 | Yes | 14 | 0.74 | 0.809 | 17.1 | 4.32 | 7.28 | 167.4 | 5.23 | 3.86 | 0.12 |
| 4.50 | Yes | 15 | 0.77 | 0.835 | 21.5 | 4.35 | 7.32 | 141.6 | 4.29 | 3.09 | 0.10 |
| 4.75 | Yes | 18 | 0.80 | 0.844 | 27.6 | 4.38 | 7.47 | 121.1 | 3.61 | 2.61 | 0.11 |
| 5.00 | Yes | 21 | 0.85 | 0.854 | 35.8 | 4.40 | 7.64 | 106.1 | 3.04 | 2.18 | 0.12 |
| 5.25 | Yes | 24 | 0.86 | 0.863 | 46.6 | 4.42 | 7.70 | 92.5 | 2.51 | 1.88 | 0.12 |
| 5.50 | Yes | 28 | 0.87 | 0.872 | 56.3 | 4.45 | 7.77 | 82.0 | 2.22 | 1.60 | 0.13 |
| 5.75 | Yes | 30 | 0.87 | 0.883 | 61.8 | 4.48 | 7.79 | 73.4 | 1.82 | 1.38 | 0.12 |
| 6.00 | Yes | 32 | 0.87 | 0.895 | 65.0 | 4.51 | 7.74 | 65.3 | 1.57 | 1.21 | 0.12 |
| 6.25 | Yes | 35 | 0.88 | 0.906 | 67.8 | 4.54 | 7.80 | 59.1 | 1.31 | 1.08 | 0.12 |
| 6.50 | Yes | 37 | 0.87 | 0.920 | 70.6 | 4.56 | 7.75 | 54.3 | 1.15 | 0.90 | 0.11 |
| 6.75 | Yes | 39 | 0.86 | 0.934 | 73.2 | 4.59 | 7.70 | 49.1 | 0.95 | 0.82 | 0.10 |
| 7.00 | Yes | 43 | 0.85 | 0.951 | 76.2 | 4.62 | 7.68 | 44.7 | 0.82 | 0.69 | 0.091 |
| 7.25 | Yes | 45 | 0.85 | 0.970 | 79.2 | 4.65 | 7.66 | 41.6 | 0.72 | 0.62 | 0.082 |
| 7.50 | Yes | 50 | 0.85 | 0.993 | 82.8 | 4.68 | 7.56 | 38.7 | 0.63 | 0.52 | 0.074 |
| 7.75 | Yes | 56 | 0.85 | 1.014 | 86.2 | 4.71 | 7.55 | 36.1 | 0.55 | 0.47 | 0.070 |
| 8.00a | Yes | 64 | 0.84 | 1.039 | 89.6 | 4.76 | 7.69 | 32.7 | 0.53 | 0.45 | 0.064 |
(a) Model ignited carbon on early AGB, with the core temperature nearing 900 MK.
From Tables 2, 3 and 4 we notice two things: 1) the peak flash intensity as measured by the maximum He-shell luminosity is reduced in models of increasing metallicity, for a given mass; and 2) the number of thermal pulses strongly decreases with increasing metallicity. The decreasing strength of thermal pulses with metallicity has important implications on the efficiency of TDU in these highest metallicity AGB stars, which is discussed in Section 4.2.3. The reduction in the number of thermal pulses is mostly as a result of increasing mass-loss, driven by increasing radius and luminosity on the AGB with increasing . This has implications for the mass-loss rate, especially on the early part of the AGB before thermal pulses begin. We use the AGB mass-loss rate from Vassiliadis & Wood (1993), where the mass-loss rate on the early part of the AGB is determined by the radial pulsation period, which depends on radius and mass according to
| (2) |
However, once the period exceeds 500 days a luminosity driven superwind begins, where the mass-loss rate is proportional to . Owing to their larger radii, very metal-rich models enter the AGB with larger pulsation periods and higher mass-loss rates than models with smaller . For example, the 2, model has a period of days at the start of the AGB, much shorter than the days of the model of the same mass. The main consequence is that the envelope mass is stripped more quickly in models with increasing , which reduces the number of thermal pulses, or, in some instances, stops them completely.
Given the above criteria we set for the occurrence of thermal pulses (e.g., the He-shell luminosity must exceed and the He-shell luminosity must exceed the radiated luminosity) most of the models do not experience a thermally-pulsing AGB phase. This is because of the intense mass-loss during the early AGB. Some of the models that do not experience thermal pulses show very small He-shell luminosity oscillations (e.g., the 4, 4.5 and 6.5, models). In these cases the He-shell luminosity always remains below the radiated luminosity and true He-shell flashes do not develop. The models that do develop thermal pulses experience much weaker He-shell flashes than than their lower metallicity counterparts, with for all models. A different choice of AGB mass-loss rate that results in weaker mass-loss during the early AGB may lead to these stars experiencing stronger thermal pulses.
Other models to skip the thermally-pulsing phase are shown in Fig. 6 and include all 1 models with . These models end their lives as stripped He-stars and evolve toward the blue on the HR diagram at lower luminosities than is typical for post-AGB stars ( but higher than the post-RGB stars found in the Magellanic Clouds (e.g., Kamath et al., 2015). For example, the 1, exits the AGB at around . The luminosity slowly drops to as the the model moves toward hotter effective temperatures of 100,000 K, at which point the model evolves toward the white dwarf cooling track.
Binary evolution can produce stripped He stars, where mass transfer removes the H-rich envelope. This behaviour is not expected from single stellar evolution as a consequence of mass-loss but very metal-rich models experience higher mass-loss rates owing to their high opacity envelopes. Mowlavi et al. (1998a) found their massive models become helium stars as a consequence of mass-loss, similar to the behaviour we find for most of the models. The main uncertainty around these predictions is the rate of mass-loss in evolved stars, which is unknown for these very high metallicities. We explore the uncertainty around mass-loss on metal-rich AGB models further in Section 5.
4.2.3 Third dredge-up
The efficiency of TDU is known to strongly depend on stellar metallicity for a given mass (e.g., Boothroyd & Sackmann, 1988; Karakas et al., 2002). The effiency of TDU can be quantified by the parameter , which is defined as follows:
| (3) |
where is the amount of material dredged into the envelope and is the amount by which the H-exhausted core mass grew during the preceding interpulse period. The parameter in theoretical calculations also varies with initial mass for a given , and time on the TP-AGB phase. For models that experience TDU, increases from zero to reach an asymptotic value after some number of thermal pulses (Karakas et al., 2002). The strength of thermal pulses is directly connected to the efficiency of TDU, hence lower metallicity models, with stronger He-shell flashes, have deeper TDU (Marigo et al., 1999), while metal-rich models consequently should experience shallow TDU owing to weaker thermal pulses. In Karakas (2014) we examined how and the minimum core mass for TDU varied in models of to , noting how the metal-rich models experience shallow TDU at a given mass, or none at all.
The minimum initial mass for TDU in solar metallicity AGB models is around 2 without any convective boundary mixing, which increases to 2.5 by (Karakas, 2014; Karakas & Lugaro, 2016). Increasing the metallicity still higher, we find that the minimum mass is 3.25 for , 4 for , 5 for , 5.5 for and 7 for . These boundaries are illustrated in Fig 6, which shows the parameter space of the models to experience TDU events. In summary, models below 3 do not experience TDU for and above , TDU disappears completely, even for the most massive AGB models. The disappearance of TDU in the most metal-rich models is likely caused by the weak thermal pulses experienced by these models.
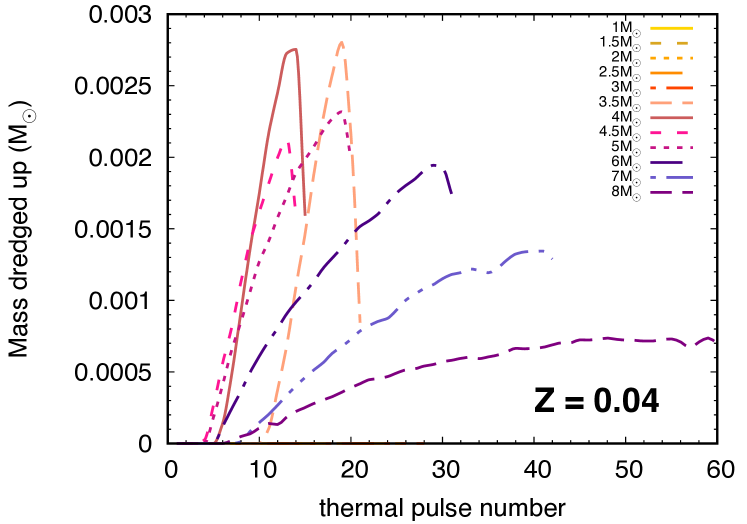
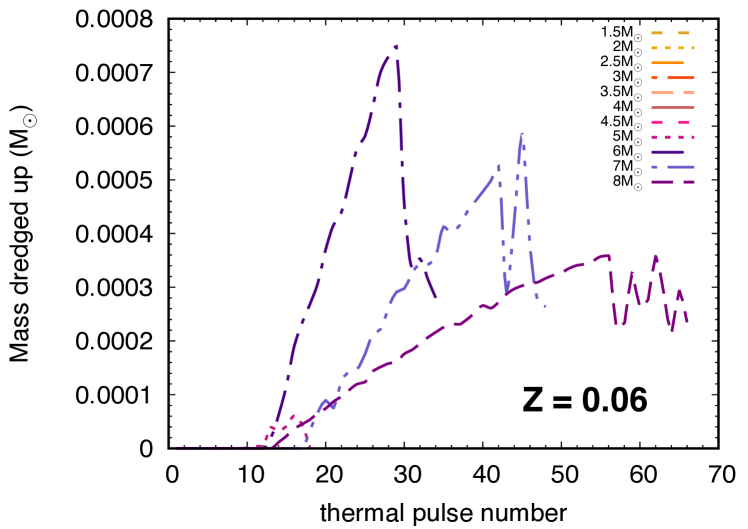
We present the maximum TDU efficiency parameter for all of the stellar models in Tables 2, 3 and 4. In Fig. 7 we show the mass dredged into the convective envelope by TDU as a function of thermal pulse number, for models of and from 1 to 8. Models not visible in Fig. 7 have no TDU. This plot is instructive because it shows two things: that only intermediate-mass models over 5, experience TDU and that the amount of mass dredged into the envelope at a given initial mass is also lower, by almost a factor of 3. We can quantify this more directly by summing the mass dredged into the envelope over the AGB for models of 5 with and . The model dredges up 0.024 while the dredges up in total only , or about 100 times less. The main consequence will be for the stellar yields of metal-rich AGB stars, which we explore in a companion paper (Cinquegrana & Karakas 2021, MNRAS, submitted).
In Karakas (2014) we compared initial mass ranges for carbon stars, noting that around solar metallicity the range extended from about 2 to 4.5, whereas by the mass range for C-star production had shrunk to 3-4. The formation of a C-rich atmosphere has important consequences for mass-loss and dust production, as has been outlined in many papers (Nanni et al., 2013; Dell’Agli et al., 2017, 2019; Höfner & Olofsson, 2018). None of our models become carbon rich on the AGB, where the maximum C/O is found in models around 3.5-4, , which is an increase from the first dredge-up value of C/O (c.f. the initial C/O = 0.55 in all models). At higher metallicities still, the minimum mass for TDU is pushed to higher masses which means two things. One, the larger envelope means that any He-shell material is diluted over a larger mass, and second, the mass range that experiences TDU is almost the same that experiences HBB (e.g., see Fig. 6), which keeps the C/O ratio low owing to CNO cycling. For metallicities above , the C/O ratio does not exceed 0.4.
The numerical treatment of convective borders is a major uncertainty in theoretical models of AGB stars. We use the algorithm described by Lattanzio (1986) to search for a neutrally stable point for the border between convective and radiative zones. This scheme has been shown to increase the amount of TDU compared to models that define the border according to the formal Schwarzschild criteria (Frost & Lattanzio, 1996; Mowlavi, 1999). Even with this scheme, Monash models have trouble matching observations of low-mass C-rich stars (e.g., Karakas et al., 2010; Kamath et al., 2012), which has necessitated the need for some form of mixing beyond the formal border, at least for the lowest mass stars to experience TDU. We explore these issues are explored further in Section 5.
4.2.4 Hot bottom burning
Stars over about 4 experience HBB on the AGB, which occurs when the base of the envelope becomes hot enough for proton-capture nucleosynthesis. From a structural point of view, the main change is an increase in the radiated luminosity, which causes deviations from the classical core-mass luminosity relationship (e.g., Bloecker & Schoenberner, 1991; Lattanzio, 1992; Boothroyd & Sackmann, 1992). The base of the envelope is less dense than the H-shell which means that higher minimum temperatures are required for CNO cycling than found typically in the cores of intermediate-mass stars on the main sequence (e.g., K). We define models to have HBB if the temperature at the base of the envelope exceeds K.
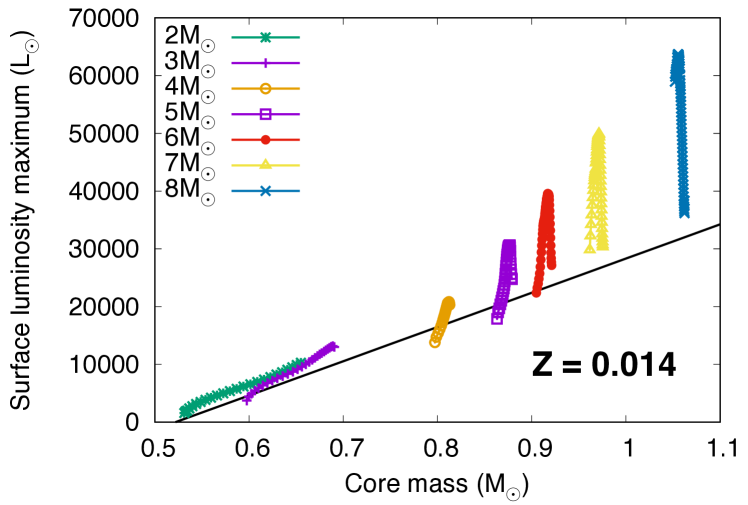
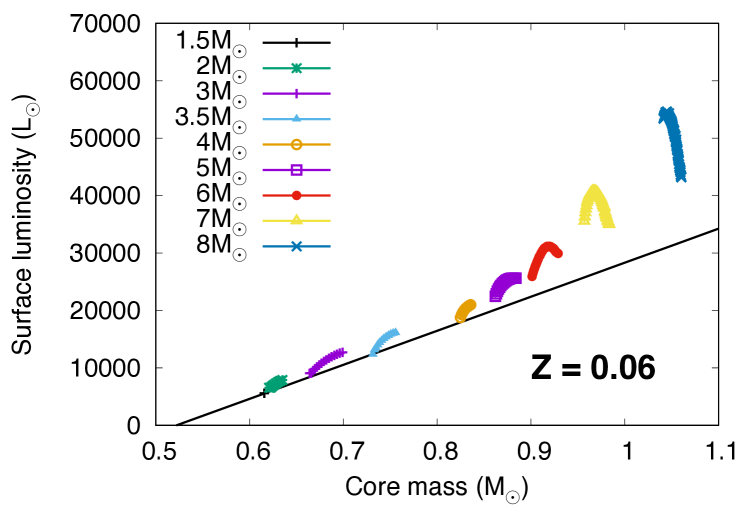
The minimum mass for HBB is known to be metallicity dependent, with metal-poor AGB stars experiencing HBB at lower initial masses (e.g., Karakas, 2010; Ventura & D’Antona, 2009; Weiss & Ferguson, 2009; Marigo et al., 2013a). In models with we find that the minimum mass for HBB shifts from 4.5 for to 5.5 for to 6.5 for . The only models to experience HBB are the 7 and 7.5 models, which reach HBB temperatures on the early AGB before thermal pulses begin. The main reason that metal-rich AGB models experience HBB at higher masses is owing to the structure at the base of the envelope, which is less dense than their metal-poor counterparts. Lower HBB temperatures has consequences for the maximum luminosity on the TP-AGB, as shown in Fig. 8 for models of (data from Karakas, 2014) and , where we show the core-mass luminosity relationship for some of our models. The linear relationship from Paczynski (1975) is included for comparison and is
| (4) |
where is the mass of the H-exhausted core. Interestingly the models deviate less from the linear relationship compared to models of solar metallicity, and only for the higher masses with efficient HBB. From Fig 8 we see that the models with HBB exhibit higher peak luminosities on the AGB, as a result of their more efficient HBB. For example, the 8, models reaches almost 64,000, compared to 54,000 for the model of the same mass. The difference in luminosity almost directly correlates with the difference in peak temperatures reached at the base of the envelope. The 8, model reaches over K, roughly 20% higher than the peak temperature of the 8, model, which is K.
4.3 Comparison to other metal-rich AGB models
We briefly compare the results of our TP-AGB models to other models published in the literature, starting with a comparison of AGB lifetimes of models up to to those published in Marigo et al. (2017) and Ventura et al. (2020). The 3, model in Ventura et al. (2020) has a total AGB lifetime of 14 Myr and a TP-AGB lifetime of 2.02 Myr. The Ventura et al. (2020) TP-AGB lifetime is considerably longer the 0.9 Myr lifetime found in our model of the same mass and . However, the total AGB lifetimes are similar where Myr in this paper. In contrast, the lowest mass models of 1 and the intermediate-mass models of have qualitatively similar lifetimes for both the entire AGB and TP-AGB phase compared to Ventura et al. (2020).
Marigo et al. (2017) show the number of thermal pulses and lifetimes for a range of models of different metallicity, as a function of mass in their Fig. 2. Considering their most metal-rich models of [M/H] , the 1.5 and 2 models have TP-AGB lifetimes of 0.2 Myr and 0.5 Myr, respectively, and experience roughly 5 and 12 TPs. Our AGB models have shorter TP-AGB lifetimes and fewer TPs. Our 2, has an TP-AGB lifetime of only 0.15 Myr and 8 TPs, whereas the 1.5, has only one TP and consequently a very short TP-AGB lifetime of Myr. These results are explained by our models experiencing stronger mass-loss early on in the AGB before the onset of thermal pulses, which erodes the envelope.
Marigo et al. (2017) provide the only AGB models up to [M/H] including maps of C-stars and O-rich stars, but they do not specifically comment on the occurrence of HBB in very metal-rich AGB stars. However Marigo et al. (2017) finds that C-stars are absent from their AGB models above [M/H] , consistent with our results. Similarly, none of the Weiss & Ferguson (2009) models of become C-rich either. In contrast, Ventura et al. (2020) find their model of 2.5, just becomes C-rich, with a final C/O .
The core mass at the first thermal pulse, , is an important indicator of the final stellar mass, especially for intermediate-mass stars that show little core growth on the AGB. Weiss & Ferguson (2009) compare to the solar metallicity models (here ) of Karakas et al. (2002) and found smaller cores for their low-mass AGB stars at the beginning of the TP-AGB; we find similar results here in comparison to their models, but find very similar core masses for models around . The models presented here also have larger core masses compared to the low-mass AGB models from Ventura et al. (2020), but similar, although somewhat smaller, core masses for intermediate-masses (e.g., for 6 we find 0.895 in our model compared to 0.928 from Ventura et al and 0.893 from Weiss & Ferguson).
The structure and nucleosynthesis of models with HBB is known to be notoriously dependent upon the temperature gradient in the convective envelope, and hence on the treatment of convection (e.g., Ventura & D’Antona, 2005a). We adopt the Mixing-length Theory (MLT) of convection which has been shown to produce lower peak temperatures and higher minimum masses for HBB than models that adopt the Full Spectrum of Turbulence (Ventura et al., 2018). However even stellar codes which adopt MLT show differences in their HBB models, e.g., the minimum mass for solar metallicity is 6 in Weiss & Ferguson (2009), around 5 for solar metallicity from Marigo et al. (2013a), while HBB is not apparent in any of the solar metallicity models of Straniero et al. (2014).
Ventura et al. (2020) finds that the minimum mass for HBB is around 3.5-4 for , which is considerably lower than our 5.5. However, this difference is consistent with what we find at solar metallicity (Ventura et al., 2018). Weiss & Ferguson (2009) find the minimum mass for HBB is 6 for , which is similar to our models, whereas Marigo et al. (2013a) find mild HBB in their 5, model, with some Li production, up to (Li/H) .
5 Discussion
The reduction in the minimum mass for carbon burning from 8 to 7 in the Monash models is an interesting result that has implications for a lowering of the core-collapse supernova threshold mass. The MESA models show that the minimum mass for C ignition is similarly reduced in metal-rich tracks to compared to at solar composition, with the most metal-rich model available () showing a reduction to . This drop in C ignition threshold to further applies to all metal-enhanced models when convective overshoot is used.
The minimum mass for C ignition is dependent upon a number of factors including the initial conditions (Bono et al., 2000) and input physics including the temporal and spatial resolution (Siess, 2006; Doherty et al., 2010), and the inclusion of convective overshoot in the core during early evolutionary phases (Gil-Pons et al., 2007). The minimum mass for core collapse supernovae at very high metallicities is also dependent upon the choice of mass-loss, which may strip the envelope so fast that core-collapse is avoided (Ibeling & Heger, 2013). The models of Mowlavi et al. (1998a) suggest models of can evolve toward core collapse, although the explosions would predominantly be of Types Ib/c, with no H present in the spectra.
Thermally-pulsing AGB models are known to be greatly affected by modelling uncertainties, both in the numerical details and in the input physics used in calculations (e.g., Ventura & D’Antona, 2005a, b; Stancliffe & Jeffery, 2007; Karakas et al., 2012; Rosenfield et al., 2014; Pastorelli et al., 2020; Marigo et al., 2020; Molnár et al., 2019; Gil-Pons et al., 2021). The most significant for very metal-rich stars is the mass-loss rate, which is essentially unknown in evolved phases. Calculating convective temperature gradients and the borders between radiative and convective regions is an on-going problem that extends to these highest metallicities.
In regards to the occurrence of the third dredge-up, the Monash models do not include any formal overshoot (see discussion in Kamath et al., 2012; Lattanzio, 1986). Models without convective boundary mixing do not match observable features of C-stars, including the minimum mass for carbon star formation in Galactic and Magellanic Cloud populations (Marigo et al., 1999). However, this is contradicted by Stancliffe et al. (2005) who match the carbon star luminosity function without convective overshoot. For this reason it is likely that our minimum initial stellar masses for TDU are likely to be overestimates. At solar metallicity the gap is around 0.5 between where we predict TDU to occur and the minimum initial mass for C-star formation (Karakas & Lugaro, 2016), but the difference could be as large as 1 if TDU occurs in 1 stars of solar metallicity as discussed below.
There has been progress in estimating the minimum initial stellar mass for the occurrence of third dredge-up in Galactic and Magallanic Cloud stellar populations. For Galactic carbon stars the initial mass range has been previously estimated to be between about 1.5–4 (Groenewegen et al., 1995; Karakas, 2014; Cristallo et al., 2015; Marigo et al., 2020). However, results using Gaia data shows that Galactic S-type stars, which show C/O , are likely to have evolved from stars with initial masses closer to 1 (Shetye et al., 2019). These results are in contrast to Marigo et al. (2020) who found that the minimum initial mass for Milky Way carbon stars is around 1.65. For stars in the Magellanic Clouds, the minimum initial mass has been estimated to be as low as (Wood et al., 1983) from stellar pulsations (Habing & Olofsson, 2004), however the masses derived from pulsations are present-day masses, not initial. More recent theoretical work suggest that the minimum initial mass for C-stars in the LMC is instead around 1.7 (Pastorelli et al., 2020). Metal-poor post-AGB stars in the Magellanic Clouds are some of the most -process rich objects known, where the stars rich in heavy elements are also carbon rich (Reyniers et al., 2007; van Aarle et al., 2011; De Smedt et al., 2012, 2015). The initial masses of the post-AGB stars are likely in the range 1–1.5, based on their luminosities, which are reasonably well known (van Winckel, 2003; De Smedt et al., 2012), also in tension with the results of Pastorelli et al. (2020). The discovery by Kamath et al. (2017) of a single luminous, low-metallicity post-AGB star in the Magellanic Clouds that appears to have failed TDU highlights that there is still much we do not understand about this phenomena.
Studies of Galactic and LMC evolved stellar populations highlight the issues surrounding the occurrence (or not) of third dredge-up, and the problem with trying to understand the behaviour as a function of metallicity. More metal-poor populations do become C-rich more easily and likely have more efficient TDU. If we turn this around to more metal-rich populations, a decreasing TDU efficiency is expected although the behaviour of the minimum initial stellar mass is unclear. In this study we find the minimum mass to be a strong function of the initial metallicity, to the point where TDU disappears from low-mass AGB populations by .
We can experiment with the minimum mass for TDU by including convective overshoot in the Monash models in the same manner as described in Karakas et al. (2010). We ran test calculations where we extend the base of the convective envelope following a thermal pulse by pressure-scale heights, where we set and 4. Kamath et al. (2012) found that values around were needed in order to match the luminosity of stars transitioning from oxygen rich to carbon rich in Magellanic Cloud clusters in stars around . Focusing on the 3, model as an example, the model with no formal overshoot has negligible dredge-up, where . Setting produces , respectively. The model with becomes carbon rich, with a final C/O = 1.3, which highlights just how much TDU is needed in these high metallicity models in order to overcome the large amount of oxygen initially present.
Regarding AGB mass-loss, we adopt Vassiliadis & Wood (1993) as in previous calculations (Karakas, 2014). In lower metallicity models Vassiliadis & Wood (1993) results in more thermal pulses and a longer TP-AGB lifetime than other AGB mass-loss formulations (e.g., Karakas, 2014). In very-metal rich AGB models, Vassiliadis & Wood (1993) leads to shorter or similar TP-AGB lifetimes for compared to the Blöcker (1995) mass-loss adopted by Ventura et al. (2020). The Blöcker (1995) mass-loss rate depends on a free parameter , which Ventura et al. (2020) set to from calibration of their models to AGB stars in the Magellanic Clouds (Ventura et al., 2001). It is not clear how applicable such formulae or calibrations are to such metal-rich AGB stars. The same is true of course for the Vassiliadis & Wood (1993) mass-loss rate we adopt.
We also find shorter TP-AGB lifetimes than Marigo et al. (2017), where they adopt a staged prescription for mass-loss, depending upon the stage of AGB evolution. Early on in the AGB the mass-loss formulation of Schröder & Cuntz (2005) is used, later when the star enters the dust-driven regime the mass-loss rate depends on the radius and mass, and is calibrated to Galactic long-period variables (Girardi et al., 2010). The superwind phase is then calculated in the same manner as Vassiliadis & Wood (1993).
The main concern regarding AGB mass-loss are our results for , which have no to very few thermal pulses. One test is to turn off mass loss entirely, which provides a limit on behaviour of thermal pulses and HBB (see e.g., Karakas et al., 2002). We test three models: the 2, 4 and 6.5 models as examples. From Fig. 6 we see these models do not enter the TP-AGB phase. The 2 model exits the AGB as a He-star and experiences no oscillations of the He-shell. A closer examination of the He-shell luminosity of the 4 shows a few weak He-shell oscillations, which do not exceed , noting that the radiated luminosity at this stage is almost . In the case of the 6.5 model, He-shell flashes do occur with peak intensities of ; these are below the radiated luminosity of .
We evolve the models without mass-loss up to a maximum of 100,000 time-steps, noting that the models reach the early AGB in . The 2 model enters the AGB with a H-exhausted core mass of 0.76 and we calculate 10 thermal pulses in total. For the 4 model we calculate 44 thermal pulses, where the peak He-shell luminosity is and still increasing. The maximum radiated luminosity during the interpulse is a fairly constant . No TDU or HBB is evident in either of these models.
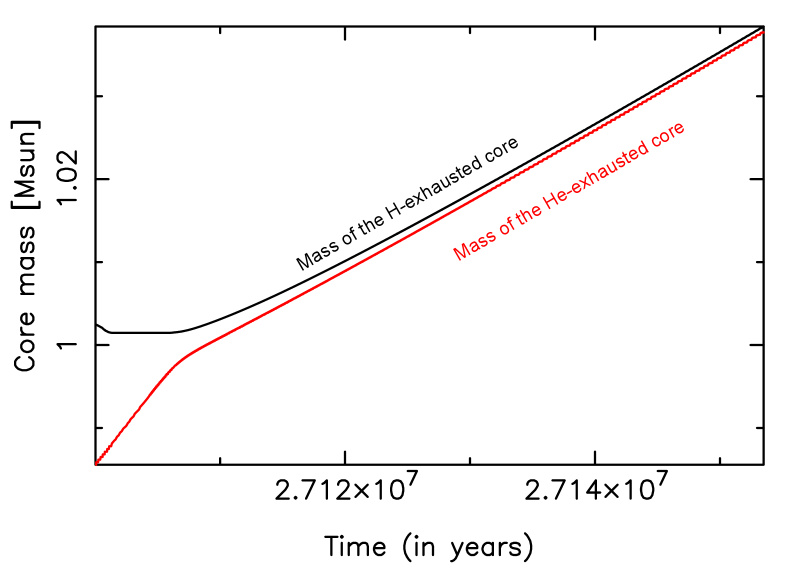
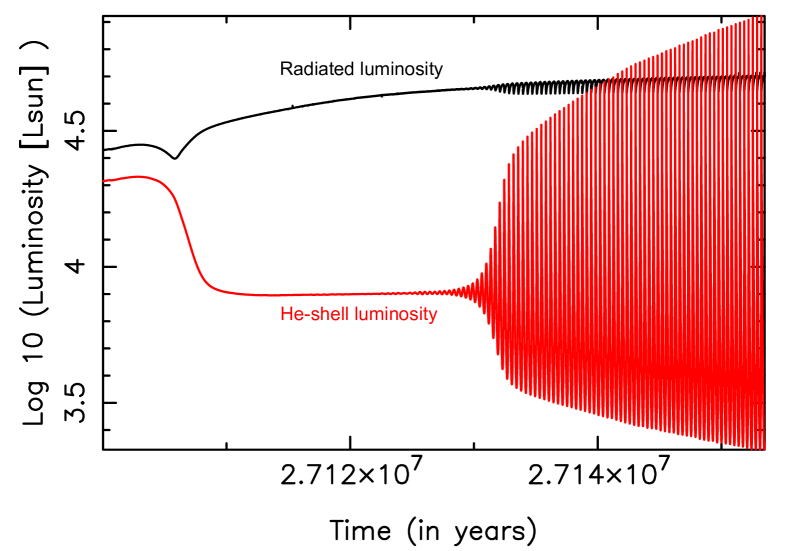
In Fig 9 we show the evolution of the 6.5, model with no mass-loss during the TP-AGB phase. We evolve through 37 thermal pulses, with Fig. 9 showing that the He-shell luminosity increases slowly with time, and only exceeds the radiated luminosity by the 28th thermal pulse. This model has HBB, with a peak temperature of about 75 MK but there is no evidence for TDU in the evolution of the core shown in Fig 9. Interestingly, the maximum temperatures during thermal pulses is only MK in both the 4 and 6.5. For comparison, in solar metallicity models we find typically 350 MK for core masses .
These experiments show that the very metal-rich models that exit the AGB as He-stars may experience thermal pulses with a different choice of mass-loss. This is entirely reasonable, given uncertainties about surrounding mass-loss in evolved stars (e.g. Höfner & Olofsson, 2018). These experiments also show that if the intermediate-mass models of enter the TP-AGB they are likely to have HBB, albeit at lower temperatures compared to their more metal-poor counterparts. We rule out the occurrence of the TDU: Even after reaching an asymptotic behaviour these models experience thermal pulses that are just too weak to drive TDU mixing.
6 Conclusions
In this paper we have presented new evolutionary tracks of very-metal rich AGB stars using two distinct stellar evolution codes. The Monash models cover a large range in mass, from 1 to 8, for metallicities between to , evolved from the main sequence to near the end of the thermally-pulsing AGB phase. We have also included supplementary MESA models of intermediate-mass between to , evolved to the beginning of the TP-AGB. These are the first AGB models of () published in the literature. Our results are consistent with earlier models by Mowlavi et al. (1998a, b) which show that the evolution of these most metal-rich stars is different to models of lower metallicity, and their behaviour cannot be easily extrapolated from models of lower metallicity. A good example of this is the minimum mass for C ignition, which shifts down from 8 to 7 in the Monash models of and in MESA models with . We see an even deeper downward shift to lower masses in the most metal-rich MESA models and all MESA models with convective overshoot.
Not all evolutionary features are strongly dependent on metallicity. We find that the depth of second dredge-up in intermediate-mass stars is notably metallicity invariant. From Figure 4 we find SDU to be similar in the Monash models of solar metallicity all the way to our highest metallicity of . Even first dredge-up is reasonably metallicity invariant at the lower and upper mass end, although there are differences between about 2–4 when comparing models of solar metallicity, and . The consequences of these results will be explored in Cinquegrana & Karakas (2021) when we present surface abundances and stellar yields for very metal-rich evolved stellar populations.
In this paper we consider the metal-rich limit of AGB behaviour. We found that thermal pulses can occur in Monash models of up to but that mass-loss on the AGB severely limits the number of thermal pulses in many models of such high metallicity. Third dredge-up, important for carbon and heavy-element production, ceases in models above , although HBB can in principle occur even in models of , depending upon the mass-loss rate on the AGB. This result has important implications for the chemical evolution of galaxies. Without a primary source of carbon the yields of such stars will be governed by secondary products mixed to the surface by first and second dredge-up, and secondary nitrogen made by HBB for models over about 6 and is discussed in detail in Cinquegrana & Karakas (2021).
In this paper we considered the evolution of single stars. Very metal-rich stars are more extended in radius than their lower metallicity counterparts owing to their high opacities, so may interact with their binary companions in more interesting ways than their lower metallicity counterparts. Finally, given the limit of TDU at these high metallicities, nucleosynthesis during binary evolution (e.g., novae or Type Ia explosions) may be the only way for these stars to produce fresh metals and to have a significant impact on the chemical evolution of their host galaxies.
Acknowledgements
We thank the Referee for their detailed comments which have helped to improve the paper, and GC is grateful for discussions with Carolyn Doherty on modelling super-AGB stars.
This research was supported by the Australian Research Council Centre of Excellence for All Sky Astrophysics in 3 Dimensions (ASTRO 3D), through project number CE170100013.
M.J. was supported the Research School of Astronomy and Astrophysics at the Australian National University and funding from Australian Research Council grant No. DP150100250 as well as the Lasker Fellowship at the Space Telescope Science Institute. MJ wishes to thank Rob Farmer for useful discussions and Pablo Marchant for use of his Kippenhahn diagram Python package, available at
https://doi.org/10.5281/zenodo.2602097.
Data Availability
In the case of the Monash models, the data underlying this article will be shared on request to the corresponding author. The MESA tracks and accompanying control files will be made publicly available at a Zenodo repository link after processing of this manuscript.
References
- Amarsi et al. (2019) Amarsi A. M., Nissen P. E., Asplund M., Lind K., Barklem P. S., 2019, A&A, 622, L4
- Asplund et al. (2009) Asplund M., Grevesse N., Sauval A. J., Scott P., 2009, ARA&A, 47, 481
- Aver et al. (2013) Aver E., Olive K. A., Porter R. L., Skillman E. D., 2013, JCAP, 11, 17
- Becker & Iben (1979) Becker S. A., Iben I., 1979, ApJ, 232, 831
- Bensby & Feltzing (2006) Bensby T., Feltzing S., 2006, MNRAS, 367, 1181
- Bertelli et al. (1986) Bertelli G., Bressan A., Chiosi C., Angerer K., 1986, A&AS, 66, 191
- Bertelli et al. (2008) Bertelli G., Girardi L., Marigo P., Nasi E., 2008, A&A, 484, 815
- Blöcker (1995) Blöcker T., 1995, A&A, 297, 727
- Bloecker & Schoenberner (1991) Bloecker T., Schoenberner D., 1991, A&A, 244, L43
- Bono et al. (2000) Bono G., Caputo F., Cassisi S., Marconi M., Piersanti L., Tornambè A., 2000, ApJ, 543, 955
- Boothroyd & Sackmann (1988) Boothroyd A. I., Sackmann I.-J., 1988, ApJ, 328, 653
- Boothroyd & Sackmann (1992) Boothroyd A. I., Sackmann I.-J., 1992, ApJ, 393, L21
- Boothroyd & Sackmann (1999) Boothroyd A. I., Sackmann I.-J., 1999, ApJ, 510, 232
- Boyer et al. (2013) Boyer M. L., et al., 2013, ApJ, 774, 83
- Boyer et al. (2019) Boyer M. L., et al., 2019, ApJ, 879, 109
- Busso et al. (1999) Busso M., Gallino R., Wasserburg G. J., 1999, ARA&A, 37, 239
- Carraro et al. (2006) Carraro G., Villanova S., Demarque P., McSwain M. V., Piotto G., Bedin L. R., 2006, ApJ, 643, 1151
- Casagrande et al. (2011) Casagrande L., Schönrich R., Asplund M., Cassisi S., Ramírez I., Meléndez J., Bensby T., Feltzing S., 2011, A&A, 530, A138
- Cescutti et al. (2009) Cescutti G., Matteucci F., McWilliam A., Chiappini C., 2009, A&A, 505, 605
- Charbonnel et al. (1996) Charbonnel C., Meynet G., Maeder A., Schaerer D., 1996, A&AS, 115, 339
- Choi et al. (2016) Choi J., Dotter A., Conroy C., Cantiello M., Paxton B., Johnson B. D., 2016, ApJ, 823, 102
- Claret (2007) Claret A., 2007, A&A, 467, 1389
- Cristallo et al. (2009) Cristallo S., Straniero O., Gallino R., Piersanti L., Domínguez I., Lederer M. T., 2009, ApJ, 696, 797
- Cristallo et al. (2015) Cristallo S., Straniero O., Piersanti L., Gobrecht D., 2015, ApJS, 219, 40
- De Smedt et al. (2012) De Smedt K., Van Winckel H., Karakas A. I., Siess L., Goriely S., Wood P. R., 2012, A&A, 541, A67
- De Smedt et al. (2015) De Smedt K., Van Winckel H., Kamath D., Wood P. R., 2015, A&A, 583, A56
- Dell’Agli et al. (2017) Dell’Agli F., García-Hernández D. A., Schneider R., Ventura P., La Franca F., Valiante R., Marini E., Di Criscienzo M., 2017, MNRAS, 467, 4431
- Dell’Agli et al. (2019) Dell’Agli F., Valiante R., Kamath D., Ventura P., García-Hernández D. A., 2019, MNRAS, 486, 4738
- Do et al. (2018) Do T., Kerzendorf W., Konopacky Q., Marcinik J. M., Ghez A., Lu J. R., Morris M. R., 2018, ApJ, 855, L5
- Doherty et al. (2010) Doherty C. L., Siess L., Lattanzio J. C., Gil-Pons P., 2010, MNRAS, 401, 1453
- Doherty et al. (2014a) Doherty C. L., Gil-Pons P., Lau H. H. B., Lattanzio J. C., Siess L., 2014a, MNRAS, 437, 195
- Doherty et al. (2014b) Doherty C. L., Gil-Pons P., Lau H. H. B., Lattanzio J. C., Siess L., Campbell S. W., 2014b, MNRAS, 441, 582
- Doherty et al. (2017) Doherty C. L., Gil-Pons P., Siess L., Lattanzio J. C., 2017, PASA, in press
- Dominguez et al. (1999) Dominguez I., Chieffi A., Limongi M., Straniero O., 1999, ApJ, 524, 226
- El Eid (1994) El Eid M. F., 1994, A&A, 285, 915
- Fagotto et al. (1994a) Fagotto F., Bressan A., Bertelli G., Chiosi C., 1994a, A&AS, 104, 365
- Fagotto et al. (1994b) Fagotto F., Bressan A., Bertelli G., Chiosi C., 1994b, A&AS, 105
- Farmer et al. (2015) Farmer R., Fields C. E., Timmes F. X., 2015, ApJ, 807, 184
- Fischer & Valenti (2005) Fischer D. A., Valenti J., 2005, ApJ, 622
- Fishlock et al. (2014) Fishlock C. K., Karakas A. I., Lugaro M., Yong D., 2014, ApJ, 797, 44
- Forestini & Charbonnel (1997) Forestini M., Charbonnel C., 1997, A&AS, 123, 241
- Frost & Lattanzio (1996) Frost C. A., Lattanzio J. C., 1996, ApJ, 473, 383
- Gil-Pons et al. (2007) Gil-Pons P., Gutiérrez J., García-Berro E., 2007, A&A, 464, 667
- Gil-Pons et al. (2013) Gil-Pons P., Doherty C. L., Lau H., Campbell S. W., Suda T., Guilani S., Gutiérrez J., Lattanzio J. C., 2013, A&A, 557, A106
- Gil-Pons et al. (2021) Gil-Pons P., Doherty C. L., Gutiérrez J., Campbell S. W., Siess L., Lattanzio J. C., 2021, A&A, 645, A10
- Girardi et al. (2010) Girardi L., et al., 2010, ApJ, 724, 1030
- Grevesse & Sauval (1998) Grevesse N., Sauval A. J., 1998, Space Sci. Rev., 85, 161
- Groenewegen et al. (1995) Groenewegen M. A. T., van den Hoek L. B., de Jong T., 1995, A&A, 293
- Habing & Olofsson (2004) Habing H. J., Olofsson H., 2004, Asymptotic Giant Branch Stars. Springer
- Herwig (2005) Herwig F., 2005, ARA&A, 43, 435
- Höfner & Olofsson (2018) Höfner S., Olofsson H., 2018, A&ARv, 26, 1
- Hurley et al. (2000) Hurley J. R., Pols O. R., Tout C. A., 2000, MNRAS, 315, 543
- Hurley et al. (2002) Hurley J. R., Tout C. A., Pols O. R., 2002, MNRAS, 329, 897
- Ibeling & Heger (2013) Ibeling D., Heger A., 2013, ApJ, 765, L43
- Iben (1991) Iben Jr. I., 1991, in Michaud G., Tutukov A. V., eds, IAU Symp. 145: Evolution of Stars: the Photospheric Abundance Connection. p. 257
- Iben & Renzini (1983) Iben I. J., Renzini A., 1983, ARA&A, 21, 271
- Jones et al. (2013) Jones S., et al., 2013, ApJ, 772, 150
- Jones et al. (2014) Jones S., Hirschi R., Nomoto K., 2014, ApJ, 797, 83
- Kamath et al. (2012) Kamath D., Karakas A. I., Wood P. R., 2012, ApJ, 746, 20
- Kamath et al. (2015) Kamath D., Wood P. R., Van Winckel H., 2015, MNRAS, 454, 1468
- Kamath et al. (2017) Kamath D., Van Winckel H., Wood P. R., Asplund M., Karakas A. I., Lattanzio J. C., 2017, ApJ, 836, 15
- Karakas (2010) Karakas A. I., 2010, MNRAS, 403, 1413
- Karakas (2014) Karakas A. I., 2014, MNRAS, 445, 347
- Karakas & Lattanzio (2014) Karakas A. I., Lattanzio J. C., 2014, PASA, 31, 30
- Karakas & Lugaro (2016) Karakas A. I., Lugaro M., 2016, ApJ, 825, 26
- Karakas et al. (2002) Karakas A. I., Lattanzio J. C., Pols O. R., 2002, PASA, 19, 515
- Karakas et al. (2010) Karakas A. I., Campbell S. W., Stancliffe R. J., 2010, ApJ, 713, 374
- Karakas et al. (2012) Karakas A. I., García-Hernández D. A., Lugaro M., 2012, ApJ, 751, 8
- Kobayashi et al. (2011) Kobayashi C., Karakas A. I., Umeda H., 2011, MNRAS, 414, 3231
- Kobayashi et al. (2020) Kobayashi C., Karakas A. I., Lugaro M., 2020, ApJ, 900, 179
- Lattanzio (1986) Lattanzio J. C., 1986, ApJ, 311, 708
- Lattanzio (1992) Lattanzio J. C., 1992, PASA, 10, 120
- Lugaro et al. (2020) Lugaro M., et al., 2020, ApJ, 898, 96
- Maeder & Meynet (1989) Maeder A., Meynet G., 1989, A&A, 210, 155
- Marchant (2020) Marchant P., 2020, orlox/mkipp, doi:10.5281/zenodo.4269885, https://doi.org/10.5281/zenodo.4269885
- Marigo & Aringer (2009) Marigo P., Aringer B., 2009, A&A, 508, 1539
- Marigo et al. (1999) Marigo P., Girardi L., Bressan A., 1999, A&A, 344, 123
- Marigo et al. (2013a) Marigo P., Bressan A., Nanni A., Girardi L., Pumo M. L., 2013a, MNRAS,
- Marigo et al. (2013b) Marigo P., Bressan A., Nanni A., Girardi L., Pumo M. L., 2013b, MNRAS, 434, 488
- Marigo et al. (2017) Marigo P., et al., 2017, ApJ, 835, 77
- Marigo et al. (2020) Marigo P., et al., 2020, Nature Astronomy, 4, 1102
- McDonald & Zijlstra (2015) McDonald I., Zijlstra A. A., 2015, MNRAS, 448, 502
- Meynet et al. (2006) Meynet G., Mowlavi N., Maeder A., 2006, in Israelian G., Meynet G., eds, The Metal Rich Universe, Cambridge University Press. pp 341–353
- Miller Bertolami (2016) Miller Bertolami M. M., 2016, A&A, 588, A25
- Molnár et al. (2019) Molnár L., Joyce M., Kiss L. L., 2019, ApJ, 879, 62
- Mowlavi (1999) Mowlavi N., 1999, A&A, 344, 617
- Mowlavi et al. (1998a) Mowlavi N., Schaerer D., Meynet G., Bernasconi P. A., Charbonnel C., Maeder A., 1998a, A&AS, 128, 471
- Mowlavi et al. (1998b) Mowlavi N., Meynet G., Maeder A., Schaerer D., Charbonnel C., 1998b, A&A, 335, 573
- Nanni et al. (2013) Nanni A., Bressan A., Marigo P., Girardi L., 2013, MNRAS, 434, 2390
- Ness & Freeman (2016) Ness M., Freeman K., 2016, Publ. Astron. Soc. Australia, 33, e022
- Netopil et al. (2016) Netopil M., Paunzen E., Heiter U., Soubiran C., 2016, A&A, 585, A150
- Nissen et al. (2014) Nissen P. E., Chen Y. Q., Carigi L., Schuster W. J., Zhao G., 2014, A&A, 568, A25
- Paczynski (1975) Paczynski B., 1975, ApJ, 202, 558
- Pastorelli et al. (2020) Pastorelli G., et al., 2020, MNRAS, 498, 3283
- Paxton et al. (2018) Paxton B., et al., 2018, ApJS, 234, 34
- Pols et al. (1998) Pols O. R., Schröder K.-P., Hurley J. R., Tout C. A., Eggleton P. P., 1998, MNRAS, 298, 525
- Rasio et al. (1996) Rasio F. A., Tout C. A., Lubow S. H., Livio M., 1996, ApJ, 470, 1187
- Reyniers et al. (2007) Reyniers M., Abia C., van Winckel H., Lloyd Evans T., Decin L., Eriksson K., Pollard K. R., 2007, A&A, 461, 641
- Romano et al. (2010) Romano D., Karakas A. I., Tosi M., Matteucci F., 2010, A&A, 522, A32
- Romano et al. (2019) Romano D., Matteucci F., Zhang Z.-Y., Ivison R. J., Ventura P., 2019, MNRAS, 490, 2838
- Romano et al. (2020) Romano D., Franchini M., Grisoni V., Spitoni E., Matteucci F., Morossi C., 2020, A&A, 639, A37
- Rosenfield et al. (2014) Rosenfield P., et al., 2014, ApJ, 790, 22
- Salasnich et al. (2000) Salasnich B., Girardi L., Weiss A., Chiosi C., 2000, A&A, 361, 1023
- Schröder & Cuntz (2005) Schröder K.-P., Cuntz M., 2005, ApJ, 630, L73
- Shetye et al. (2019) Shetye S., Goriely S., Siess L., Van Eck S., Jorissen A., Van Winckel H., 2019, A&A, 625, L1
- Siess (2006) Siess L., 2006, A&A, 448, 717
- Siess (2007) Siess L., 2007, A&A, 476, 893
- Stancliffe & Jeffery (2007) Stancliffe R. J., Jeffery C. S., 2007, MNRAS, 375, 1280
- Stancliffe et al. (2005) Stancliffe R. J., Izzard R. G., Tout C. A., 2005, MNRAS, 356, L1
- Straniero et al. (1997) Straniero O., Chieffi A., Limongi M., Busso M., Gallino R., Arlandini C., 1997, ApJ, 478, 332
- Straniero et al. (2014) Straniero O., Cristallo S., Piersanti L., 2014, ApJ, 785, 77
- Thorsbro et al. (2020) Thorsbro B., et al., 2020, ApJ, 894, 26
- Umeda et al. (1999) Umeda H., Nomoto K., Yamaoka H., Wanajo S., 1999, ApJ, 513, 861
- Valcarce et al. (2013) Valcarce A. A. R., Catelan M., De Medeiros J. R., 2013, A&A, 553, A62
- Vassiliadis & Wood (1993) Vassiliadis E., Wood P. R., 1993, ApJ, 413, 641
- Ventura & D’Antona (2005a) Ventura P., D’Antona F., 2005a, A&A, 431, 279
- Ventura & D’Antona (2005b) Ventura P., D’Antona F., 2005b, A&A, 439, 1075
- Ventura & D’Antona (2009) Ventura P., D’Antona F., 2009, A&A, 499, 835
- Ventura et al. (2001) Ventura P., D’Antona F., Mazzitelli I., Gratton R., 2001, ApJ, 550, L65
- Ventura et al. (2013) Ventura P., Di Criscienzo M., Carini R., D’Antona F., 2013, MNRAS, 431, 3642
- Ventura et al. (2018) Ventura P., Karakas A., Dell’Agli F., García-Hernández D. A., Guzman-Ramirez L., 2018, MNRAS, 475, 2282
- Ventura et al. (2020) Ventura P., Dell’Agli F., Lugaro M., Romano D., Tailo M., Yagüe A., 2020, A&A, 641, A103
- Villaver & Livio (2007) Villaver E., Livio M., 2007, ApJ, 661, 1192
- Weiss & Ferguson (2009) Weiss A., Ferguson J. W., 2009, A&A, 508, 1343
- Wood et al. (1983) Wood P. R., Bessell M. S., Fox M. W., 1983, ApJ, 272, 99
- Worthey (1994) Worthey G., 1994, ApJS, 95, 107
- van Aarle et al. (2011) van Aarle E., van Winckel H., Lloyd Evans T., Ueta T., Wood P. R., Ginsburg A. G., 2011, A&A, 530, A90
- van Winckel (2003) van Winckel H., 2003, ARA&A, 41, 391
Appendix A MESA Thresholds
Here we provide a pictorial chart showing the details of the MESA models calculated for this paper. We include the initial mass, initial metallicity , initial helium mass fraction , whether carbon burning was detected or not, the location of the burning, whether there was a pocket of higher convective burning closer to the core, whether the burning was vigorous, and the maximum age of the model (in Myr). We refer to the text in Section 3.2 for details. Solar composition models are included for comparison to the metal-rich intermediate-mass models (e.g., see Fig 3).
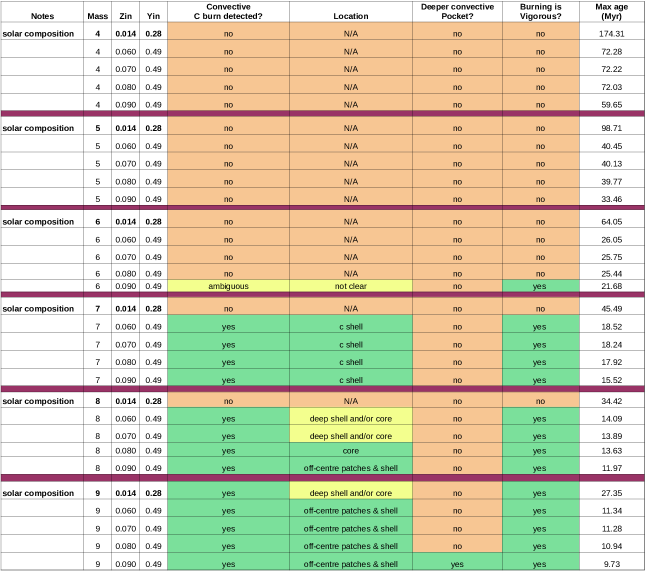
Appendix B AGB model data
Tables of thermally-pulsing AGB model data for metallicities of to .
| Mass | SDU | #TP | ||||||||
| () | () | (MK) | () | () | (Myr) | (Myr) | (Myr) | |||
| , models. | ||||||||||
| 1.0 | No | 0 | 0.00 | – | – | 3.556 | – | 14110 | 3406 | 20 |
| 1.5 | No | 4 | 0.00 | 0.603 | 2.5 | 3.763 | 4.88 | 3222 | 756.2 | 20 |
| 2.0 | No | 14 | 0.00 | 0.595 | 3.3 | 3.898 | 5.55 | 1340 | 148.7 | 19 |
| 2.5 | No | 21 | 0.00 | 0.604 | 4.0 | 4.010 | 5.95 | 787.2 | 37.2 | 18 |
| 3.0 | No | 22 | 0.00 | 0.636 | 5.1 | 4.106 | 6.26 | 450.6 | 16.8 | 12 |
| 3.5 | No | 17 | 0.00 | 0.700 | 6.5 | 4.192 | 6.43 | 276.0 | 9.6 | 7.2 |
| 4.0 | No | 12 | 0.05 | 0.787 | 10 | 4.288 | 6.46 | 182.8 | 6.0 | 4.5 |
| 4.5 | Yes | 12 | 0.32 | 0.840 | 18 | 4.359 | 6.62 | 129.8 | 4.0 | 2.9 |
| 5.0 | Yes | 19 | 0.62 | 0.857 | 28 | 4.403 | 7.01 | 96.5 | 2.8 | 2.1 |
| 5.5 | Yes | 26 | 0.74 | 0.874 | 47 | 4.448 | 7.26 | 75.4 | 2.0 | 1.5 |
| 5.75 | Yes | 29 | 0.74 | 0.887 | 56 | 4.477 | 7.26 | 66.9 | 1.7 | 1.3 |
| 6.0 | Yes | 34 | 0.76 | 0.897 | 62 | 4.505 | 7.10 | 53.8 | 1.4 | 1.2 |
| 6.5 | Yes | 39 | 0.80 | 0.915 | 68 | 4.561 | 7.36 | 49.4 | 1.0 | 0.91 |
| 7.0 | Yes | 44 | 0.80 | 0.953 | 73 | 4.616 | 7.39 | 40.8 | 0.75 | 0.70 |
| 7.5 | Yes | 51 | 0.79 | 0.991 | 79 | 4.675 | 7.35 | 35.2 | 0.58 | 0.53 |
| 8.0 | Yesa | 59 | 0.80 | 1.034 | 86 | 4.742 | 7.38 | 30.0 | 0.42 | 0.44 |
| , models. | ||||||||||
| 1.0 | No | 0 | 0.00 | – | – | 3.550 | – | 12900 | 3431 | 21 |
| 1.5 | No | 1 | 0.00 | 0.616 | 2.5 | 3.747 | 4.38 | 2986 | 665 | 17 |
| 2.0 | No | 8 | 0.00 | 0.621 | 3.2 | 3.898 | 4.97 | 1265 | 128 | 19 |
| 2.5 | No | 15 | 0.00 | 0.631 | 3.9 | 4.009 | 5.55 | 721.7 | 33.1 | 15 |
| 3.0 | No | 15 | 0.00 | 0.664 | 4.8 | 4.104 | 5.84 | 408.4 | 15.5 | 10 |
| 3.5 | No | 12 | 0.00 | 0.732 | 6.0 | 4.208 | 6.06 | 252.3 | 8.87 | 6.1 |
| 4.0 | Yes | 9 | 0.00 | 0.825 | 7.8 | 4.322 | 6.10 | 171.0 | 5.49 | 3.5 |
| 4.5 | Yes | 14 | 0.00 | 0.843 | 16 | 4.370 | 6.24 | 118.1 | 3.73 | 2.7 |
| 5.0 | Yes | 18 | 0.04 | 0.862 | 23 | 4.409 | 6.36 | 88.5 | 2.58 | 1.9 |
| 5.5 | Yes | 24 | 0.39 | 0.882 | 36 | 4.449 | 6.53 | 68.4 | 1.81 | 1.5 |
| 6.0 | Yes | 35 | 0.56 | 0.901 | 55 | 4.494 | 6.79 | 53.8 | 1.37 | 1.1 |
| 6.5 | Yes | 41 | 0.55 | 0.926 | 65 | 4.555 | 6.75 | 44.8 | 0.94 | 0.91 |
| 7.0 | Yes | 48 | 0.62 | 0.957 | 67 | 4.611 | 6.93 | 37.6 | 0.69 | 0.67 |
| 7.5 | Yes | 52 | 0.58 | 0.994 | 76 | 4.668 | 6.76 | 31.4 | 0.50 | 0.52 |
| 8.0 | Yesa | 66 | 0.64 | 1.041 | 82 | 4.735 | 6.79 | 27.2 | 0.39 | 0.42 |
| , models. | ||||||||||
| 1.0 | No | 0 | 0.00 | – | – | 3.47 | – | 11788 | 3377 | 433.776 |
| 1.5 | No | 0 | 0.00 | – | – | 3.71 | – | 2692 | 566.1 | 14.66 |
| 2.0 | No | 2 | 0.00 | 0.651 | 3.2 | 3.925 | 4.53 | 1142 | 102.2 | 16.06 |
| 2.5 | No | 10 | 0.00 | 0.662 | 4.0 | 4.045 | 5.14 | 636.5 | 29.85 | 12.89 |
| 3.0 | No | 12 | 0.00 | 0.697 | 5.1 | 4.145 | 5.57 | 359.7 | 14.13 | 8.943 |
| 3.5 | No | 9 | 0.00 | 0.772 | 6.3 | 4.260 | 5.80 | 222.5 | 7.865 | 5.280 |
| 4.0 | Yes | 9 | 0.00 | 0.836 | 8.1 | 4.350 | 5.86 | 145.1 | 4.716 | 3.181 |
| 4.5 | Yes | 16 | 0.00 | 0.852 | 18 | 4.394 | 6.07 | 105.7 | 3.368 | 2.409 |
| 5.0 | Yes | 22 | 0.00 | 0.874 | 27 | 4.436 | 6.11 | 76.65 | 2.082 | 1.671 |
| 5.5 | Yes | 30 | 0.11 | 0.892 | 41 | 4.475 | 6.23 | 61.28 | 1.525 | 1.289 |
| 6.0 | Yes | 40 | 0.26 | 0.914 | 59 | 4.527 | 6.34 | 48.75 | 1.059 | 1.036 |
| 6.5 | Yes | 49 | 0.29 | 0.940 | 66 | 4.582 | 6.36 | 40.00 | 0.761 | 0.801 |
| 7.0 | Yes | 56 | 0.31 | 0.967 | 71 | 4.634 | 6.36 | 33.16 | 0.546 | 0.665 |
| 7.5 | Yes | 61 | 0.29 | 1.003 | 75 | 4.684 | 6.30 | 28.35 | 0.401 | 0.508 |
| 8.0 | Yesa | 73 | 0.34 | 1.049 | 82 | 4.753 | 6.32 | 23.86 | 0.297 | 0.418 |
(a) Model ignited carbon on early AGB, with core temperatures nearing or exceeding 900 MK.
| Mass | SDU | #TP | ||||||||
| () | () | (MK) | () | () | (Myr) | (Myr) | (Myr) | |||
| , models. | ||||||||||
| 1.0 | No | 0 | 0.00 | – | – | 3.51 | – | 10012 | 2833 | 415.7 |
| 1.5 | No | 0 | 0.00 | – | – | 3.72 | – | 2332 | 459.2 | 12.44 |
| 2.0 | No | 0 | 0.00 | – | – | 3.89 | – | 1063 | 86.29 | 11.70 |
| 2.5 | No | 1 | 0.00 | 0.694 | 3.8 | 4.038 | 4.32 | 558.4 | 26.80 | 9.881 |
| 3.0 | No | 2 | 0.00 | 0.746 | 4.0 | 4.167 | 4.70 | 318.7 | 12.55 | 6.073 |
| 3.5 | No | 3 | 0.00 | 0.819 | 5.2 | 4.296 | 5.090 | 196.1 | 7.094 | 4.178 |
| 4.0 | Yes | 6 | 0.00 | 0.845 | 6.6 | 4.358 | 5.34 | 127.5 | 4.253 | 2.845 |
| 4.5 | Yes | 11 | 0.00 | 0.863 | 13 | 4.403 | 5.64 | 92.58 | 2.997 | 2.075 |
| 5.0 | Yes | 16 | 0.00 | 0.887 | 20 | 4.446 | 5.76 | 68.0 | 2.0 | 1.48 |
| 5.0 | Yes | 16 | 0.00 | 0.887 | 20 | 4.447 | 5.76 | 67.99 | 1.842 | 1.484 |
| 5.5 | Yes | 26 | 0.00 | 0.905 | 31 | 4.481 | 5.91 | 53.80 | 1.356 | 1.181 |
| 6.0 | Yes | 33 | 0.00 | 0.933 | 48 | 4.526 | 5.91 | 42.25 | 0.908 | 0.883 |
| 6.5 | Yes | 45 | 0.00 | 0.962 | 63 | 4.587 | 5.96 | 35.33 | 0.651 | 0.676 |
| 7.0 | Yes | 53 | 0.09 | 0.988 | 69 | 4.635 | 6.06 | 29.19 | 0.472 | 0.574 |
| 7.5 | Yes | 61 | 0.15 | 1.024 | 75 | 4.692 | 6.02 | 24.82 | 0.348 | 0.474 |
| 8.0 | Yesa | 46 | 0.00 | 1.094 | 84 | 4.788 | 5.61 | 21.37 | 0.263 | 0.370 |
| , models. | ||||||||||
| 1.0 | No | 0 | 0.00 | – | – | 3.49 | – | 8762 | 2494 | 381.8 |
| 1.5 | No | 0 | 0.00 | – | – | 3.74 | – | 2073 | 386.3 | 11.33 |
| 2.0 | No | 0 | 0.00 | – | – | 3.90 | – | 912.4 | 70.52 | 9.938 |
| 2.5 | No | 0 | 0.00 | – | – | 3.66 | – | 481.8 | 23.44 | 7.665 |
| 3.0 | No | 0 | 0.00 | – | – | 3.84 | – | 273.1 | 11.15 | 5.152 |
| 3.5 | No | 1 | 0.00 | 0.834 | 0.002 | 4.311 | 4.44 | 168.7 | 6.445 | 3.691 |
| 4.0 | Yes | 1 | 0.00 | 0.858 | 4.9 | 4.368 | 4.70 | 111.7 | 3.805 | 2.341 |
| 4.5 | Yes | 6 | 0.00 | 0.878 | 7.3 | 4.416 | 5.11 | 80.85 | 2.575 | 1.711 |
| 5.0 | Yes | 11 | 0.00 | 0.901 | 15 | 4.460 | 5.31 | 59.11 | 1.614 | 1.306 |
| 5.5 | Yes | 18 | 0.00 | 0.924 | 24 | 4.498 | 5.46 | 47.19 | 1.183 | 0.950 |
| 6.0 | Yes | 25 | 0.00 | 0.953 | 39 | 4.539 | 5.62 | 37.55 | 0.801 | 0.743 |
| 6.5 | Yes | 34 | 0.00 | 0.985 | 58 | 4.589 | 5.56 | 30.99 | 0.574 | 0.587 |
| 7.0 | Yes | 30 | 0.00 | 1.017 | 68 | 4.648 | 5.36 | 25.26 | 0.404 | 0.489 |
| 7.5 | Yesa | 22 | 0.00 | 1.058 | 76 | 4.72 | 5.170 | 21.73 | 0.299 | 0.410 |
| 8.0 | Yesa | 0 | 0.00 | – | – | 4.733 | – | 18.68 | 0.225 | 0.304 |
| , models. | ||||||||||
| 1.0 | No | 0 | 0.00 | – | – | 3.790 | – | 7033 | 2050 | 15 |
| 1.5 | No | 0 | 0.00 | – | – | 3.830 | – | 1779 | 308.4 | 7.9 |
| 2.0 | No | 0 | 0.00 | – | – | 3.990 | – | 790.4 | 59.5 | 7.0 |
| 2.5 | No | 0 | 0.00 | – | 3.4 | 4.110 | – | 410.1 | 20.3 | 6.0 |
| 3.0 | No | 0 | 0.00 | – | 3.6 | 4.240 | – | 234.0 | 10.0 | 3.8 |
| 3.5 | Yes | 0 | 0.00 | – | 4.9 | 4.317 | – | 146.0 | 5.8 | 2.8 |
| 4.0 | Yes | 0 | 0.00 | – | 6.0 | 4.375 | – | 98.1 | 3.8 | 2.0 |
| 4.5 | Yes | 0 | 0.00 | 0.890 | 7.0 | 4.430 | 3.96 | 70.3 | 2.4 | 1.4 |
| 5.0 | Yes | 5 | 0.00 | 0.917 | 14 | 4.476 | 4.68 | 52.5 | 1.6 | 1.1 |
| 5.5 | Yes | 7 | 0.00 | 0.945 | 20 | 4.516 | 4.73 | 40.9 | 1.1 | 0.81 |
| 6.0 | Yes | 7 | 0.00 | 0.981 | 32 | 4.563 | 4.72 | 32.5 | 0.80 | 0.62 |
| 6.5 | Yes | 4 | 0.00 | – | 45 | 4.610 | – | 26.6 | 0.57 | 0.48 |
| 7.0 | Yesa | 0 | 0.00 | – | 68 | 4.674 | – | 22.8 | 0.42 | 0.37 |
| 7.5 | Yesa | 0 | 0.00 | – | – | – | – | 19.6 | 0.30 | 0.28 |
| 8.0 | Yesa | 0 | 0.00 | – | – | – | – | 17.2 | 0.23 | 0.22 |
(a) Model ignited carbon on early AGB, with core temperatures nearing or exceeding 900 MK.
Appendix C HR Diagrams