The Whisper of a Whimper of a Bang: 2400 Days of the
Type Ia SN 2011fe Reveals the Decay of 55Fe
Abstract
We analyze new multi-filter Hubble Space Telescope (HST) photometry of the normal Type Ia supernova (SN Ia) 2011fe out to days after maximum light, the latest observations to date of a SN Ia. We model the pseudo-bolometric light curve with a simple radioactive decay model and find energy input from both 57Co and 55Fe are needed to power the late-time luminosity. This is the first detection of 55Fe in a SN Ia. We consider potential sources of contamination such as a surviving companion star or delaying the deposition timescale for 56Co positrons but these scenarios are ultimately disfavored. The relative isotopic abundances place direct constraints on the burning conditions experienced by the white dwarf (WD). Additionally, we place a conservative upper limit of on the synthesized mass of 44Ti. Only 2 classes of explosion models are currently consistent with all observations of SN 2011fe: 1) the delayed detonation of a low-, near- () WD, or 2) a sub- () WD experiencing a thin-shell double detonation.
1 Introduction
Type Ia supernovae (SNe Ia) are used as extragalactic distance indicators (e.g., Tully et al., 2016) and are key cosmological probes (e.g., Riess et al., 1998; Perlmutter et al., 1999). Our understanding of SNe Ia has advanced considerably in the past decade due to the proliferation of sky surveys (e.g., Shappee et al., 2013b; Chambers et al., 2016; Tonry et al., 2018; Bellm et al., 2019) and advances in numerical models (e.g., Röpke & Sim, 2018; Nouri et al., 2019), but key questions remain unanswered. While it is generally accepted that SNe Ia originate from the thermonuclear disruptions of carbon/oxygen (C/O) white dwarfs (WDs; Hoyle & Fowler, 1960), how and why the WD explodes as a SN Ia is unclear. The progenitor system must include a nearby companion star to destabilize the WD but the type of companion star remains debated (see Maoz et al., 2014; Jha et al., 2019, for recent reviews). Additionally, how the flame ignites and propagates in the WD core, referred to as the the explosion mechanism, has not yet reached a consensus (e.g., Hillebrandt et al., 2013), further complicating efforts to determine the progenitor systems of SNe Ia.
For many years the standard theory for SN Ia progenitor systems invoked a non-degenerate star transferring mass onto the WD through Roche Lobe overflow (RLOF), referred to as the ‘single degenerate’ (SD) scenario (e.g., Whelan & Iben, 1973; Nomoto, 1982; Yoon & Langer, 2003). This was driven by the overall homogeneity of SNe Ia near maximum light (e.g., Folatelli et al., 2010), as mass-transfer from a nearby donor star would naturally ignite WDs as they approach the Chandrasekhar mass (; Chandrasekhar, 1931). Additionally, WDs in mass-transfer binary systems are seen in the Milky Way (e.g., Pala et al., 2020), readily providing both a progenitor system and explosion mechanism.
However, the SD theory places a non-degenerate star in close proximity to the WD at the time of explosion. Interactions between the donor star and the ejecta are expected to produce several observational signatures (e.g., Wheeler et al., 1975) including irregularities in the rising light curve (Kasen, 2010), supersoft X-ray emission during accretion onto the WD (e.g., Langer et al., 2000; Schwarz et al., 2011), and radio and/or X-ray emission produced by the high-velocity ejecta interacting with nearby circumstellar material (CSM). Additionally, the high-velocity ejecta will deposit energy into the companion star (Marietta et al., 2000; Pan et al., 2012a; Boehner et al., 2017) increasing its luminosity for several thousand years after explosion (e.g., Pan et al., 2012b; Shappee et al., 2013a) and stripping/ablating of material from the star (Mattila et al., 2005; Botyánszki et al., 2018; Dessart et al., 2020).
Searches for SD progenitor systems in normal SNe Ia have repeatedly returned null results, including no irregularities in the rising light curves (Hayden et al., 2010; Bianco et al., 2011; Fausnaugh et al., 2021), stringent upper limits on radio (e.g., Panagia et al., 2006; Chomiuk et al., 2016; Cendes et al., 2020; Harris et al., 2021) and X-ray (e.g., Margutti et al., 2012; Russell & Immler, 2012; Margutti et al., 2014; Shappee et al., 2018; Kilpatrick et al., 2018; Sand et al., 2021) emission indicating a clean circumstellar environment, non-detections of material stripped from the companion star (Leonard, 2007; Graham et al., 2017; Maguire et al., 2018; Tucker et al., 2020), the lack of high-energy radiation (i.e., supersoft X-ray sources) expected for accreting WDs (e.g., Gilfanov & Bogdán, 2010; Woods et al., 2017, 2018; Kuuttila et al., 2019), and “missing” surviving companion stars (e.g., Schaefer & Pagnotta, 2012; Edwards et al., 2012; Kerzendorf et al., 2018; Do et al., 2021). Several studies have claimed detections of a SD progenitor system (e.g., Marion et al., 2016; Hosseinzadeh et al., 2017) but follow-up studies have yet to unambiguously confirm these claims (Maguire et al., 2016; Shappee et al., 2018; Sand et al., 2018; Tucker et al., 2019). There is a subclass of SNe Ia that exhibit signs of interaction with nearby CSM (SNe Ia-CSM; Silverman et al., 2013) but these systems are rare and constitute a small fraction of SNe Ia (Graham et al., 2019; Dubay et al., 2021). Thus, it seems unlikely that most SNe Ia originate from the SD scenario.
The alternative is the double degenerate (DD) scenario, where the companion is a degenerate star, typically another WD (e.g., Tutukov & Yungelson, 1979; Iben & Tutukov, 1984; Webbink, 1984). However, most double WD binaries do not have a combined mass exceeding (e.g., Maoz et al., 2012) leading to a resurgence of interest in sub- WDs () producing SNe Ia. Recent observational (e.g., Mazzali et al., 2011; Scalzo et al., 2014; Flörs et al., 2020) and theoretical (e.g., Blondin et al., 2017; Goldstein & Kasen, 2018; Townsley et al., 2019; Polin et al., 2019) studies support sub- producing some fraction of “normal” SNe Ia, but it remains unclear if it is the dominant channel for SNe Ia production. While the Milky Way WD merger rate may be able to reproduce the expected SN Ia rate (e.g., Maoz et al., 2018), some WD mergers will produce a more massive WD instead of exploding as a SN Ia (e.g., Giammichele et al., 2012; Brown et al., 2016). Thus, it remains unclear which parts of the parameter space (i.e., individual WD masses, orbital separation, presence of external bodies) available to double WD binaries lead to successful explosions.
The late-time light curves of SNe Ia can provide insight into the explosion conditions because they depend on the nucleosynthetic yields (e.g., Seitenzahl & Townsley, 2017; Graur et al., 2018). The primary energy source for SNe Ia is the radioactive decay of unstable isotopes synthesized during the explosion (Pankey, 1962; Truran et al., 1967). The important decay chains are (Colgate & McKee, 1969; Seitenzahl et al., 2009)
| (1) | |||
The mass of the synthesized species determines the bolometric evolution and the observed light curve provides insight into the amount of synthesized material (e.g., Arnett, 1982). Specifically, the evolution of the late-time light curve is determined by the burning conditions in the WD core. Mass ratios of these unstable isotopes can be derived from late-time photometry but observations at days are necessary to probe the long half-life of 55Fe.
SN 2011fe, discovered a mere hours after explosion (Nugent et al., 2011) by the Palomar Transient Facility (PTF; Law et al., 2009), is the brightest SN Ia since the advent of modern astronomical detectors. Located at just (e.g., Shappee & Stanek, 2011; Beaton et al., 2019), SN 2011fe exploded in a region of M101 uncontaminated by intervening dust (Patat et al., 2013) providing an ideal location for testing SN Ia progenitor and explosion models. The early detection allowed extensive follow-up observations across the electromagnetic spectrum (e.g., Matheson et al., 2012; Parrent et al., 2012; Pereira et al., 2013; Hsiao et al., 2013; Johansson et al., 2013; Tsvetkov et al., 2013; Munari et al., 2013; Mazzali et al., 2014; Zhang et al., 2016) and provided direct constraints on the radius of the exploding star (Nugent et al., 2011; Bloom et al., 2012). Stringent non-detections in radio (Chomiuk et al., 2012; Horesh et al., 2012; Kundu et al., 2017) and X-ray (Margutti et al., 2012; Horesh et al., 2012) observations exclude nearby CSM at high significance. Early ultraviolet (UV) photometry did not show any evidence for the ejecta encountering a nearby companion star (Brown et al., 2012) and nebular spectra lacked the Balmer emission lines from material ablated off the donor star by the ejecta impact (Shappee et al., 2013b; Lundqvist et al., 2015; Tucker et al., 2022). Pre-explosion imaging excludes the presence of a RG or He donor star (Li et al., 2011) and disfavor an accreting WD in the years prior to explosion (Graur et al., 2014). Multi-epoch spectropolarimetry reveal consistently-low continuum polarization suggestive of a symmetric ejecta distribution with evidence for minor oblateness (Milne et al., 2017). Finally, nebular-phase observations at year after maximum light allows a direct view to the inner ejecta and provides unique constraints on the explosion conditions (McClelland et al., 2013; Kerzendorf et al., 2014; Mazzali et al., 2015; Graham et al., 2015; Taubenberger et al., 2015; Kerzendorf et al., 2017; Dimitriadis et al., 2017; Shappee et al., 2017; Friesen et al., 2017; Tucker et al., 2022). SN 2011fe is one of the best-studied astronomical objects in the past decade and remains a key benchmark for any SN Ia theory or model.
In this paper we extend the rich dataset for SN 2011fe with new HST photometry extending to days after maximum light. Details about the data reduction are provided in §2 which we use to construct a pseudo-bolometric light curve in §3. The viability of various interpretations for the photometric evolution are assessed including inferred isotopic yields, the efficiency of leptonic confinement, and the presence of a surviving companion. With these new observations and analyses, we consider various proposed progenitor systems and explosion mechanisms in §4. We adopt the photometric parameters derived by Zhang et al. (2016), in particular the time of maximum -band flux . All phases are given in the rest-frame and the rise-time of days is taken from Pereira et al. (2013). We correct all observations for Milky Way extinction mag (Schlafly & Finkbeiner, 2011) but we do not correct for any host-galaxy extinction towards SN 2011fe as multiple studies have shown it to be negligible (e.g., Patat et al., 2013; Zhang et al., 2016). M101 has several distance estimates in the literature due to its proximity (e.g., Matheson et al., 2012; Jang & Lee, 2017; Beaton et al., 2019), but we adopt the distance of Mpc from Shappee & Stanek (2011) to allow direct comparisons with previous studies. All phases are given relative to in the SN rest-frame.
2 New and Archival HST Imaging
| Filter | UT Date | PhaseaaRelative to . | Exp. Time | Vega Mag |
|---|---|---|---|---|
| [days] | [sec] | |||
| 2017-06-15 | 2103.5 | 6150 | ||
| 2017-06-15 | 2103.5 | 5200 | ||
| 2017-06-17 | 2105.5 | 5400 | ||
| 2017-06-17 | 2105.5 | 4010 | ||
| 2017-06-17 | 2105.5 | 1910 | ||
| 2018-03-30 | 2391.3 | 8950 | ||
| 2018-03-26 | 2386.9 | 6300 | ||
| 2018-03-26 | 2386.9 | 11500 | ||
| 2018-03-30 | 2391.3 | 5610 | ||
| 2018-03-30 | 2391.3 | 8010 |
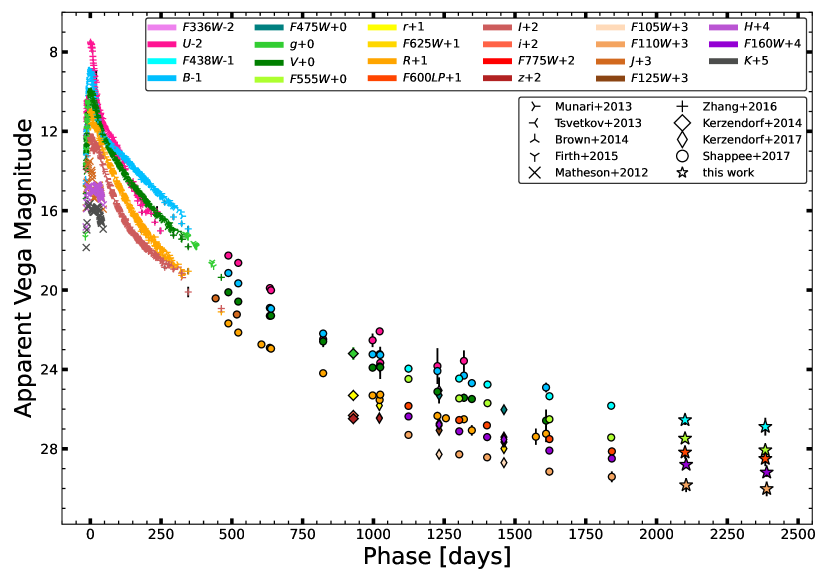
We obtained new photometry of SN 2011fe at 2105 and 2390 days after maximum light using the UVIS and NIR modules of the Wide Field Planetary Camera 3 (WFC3) instrument on the Hubble Space Telescope (HST). The new observations used the broadband , , , , and filters (see Table 1, GO-14678 and GO-15192, PI: Shappee). We also include 5 epochs of HST photometry from Shappee et al. (2017) which cover days after maximum light (GO-13737 and GO-14166, PI: Shappee) for the same optical and near-infrared (NIR) filters.
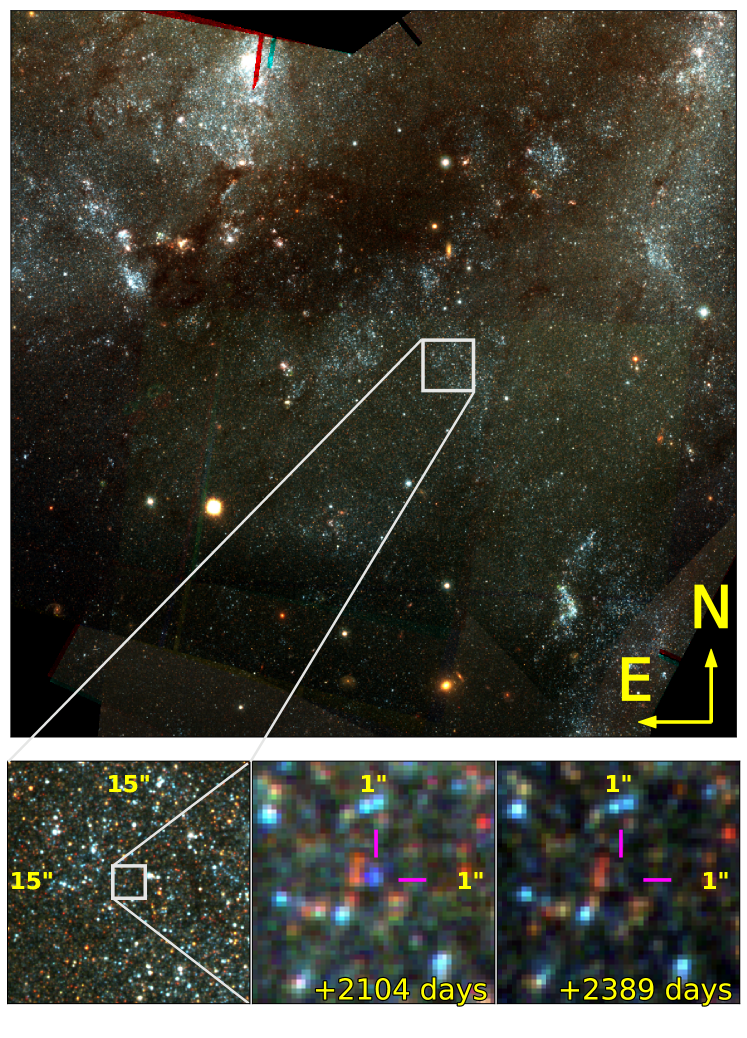
We use the dolphot software package (Dolphin, 2000) to perform point spread function (PSF) fitting photometry on the individual images retrieved from the Mikulski Archive for Space Telescopes (MAST)111mast.stsci.edu. We use the *flc.fits UVIS frames which are already corrected for charge transfer efficiency (CTE) losses and the *flt.fits NIR frames that do not need CTE corrections. Due to the faintness of SN 2011fe in the new observations, we simultaneously analyze both old and new images with dolphot to ensure that the location of SN 2011fe remains consistent across all epochs and filters. Individual frames are aligned to sub-pixel precision using the TweakReg software package with typical alignment errors of pixels. Then, AstroDrizzle is used to create deep (‘drizzled’) reference images for each filter with the drizzled image used as the dolphot reference frame. The composite color image is shown in Fig. 1.
Our -day photometry is consistent with the published results of Shappee et al. (2017) and Kerzendorf et al. (2017). The largest deviations between our photometry and the previously published results occur for the earliest observations, with a maximum discrepancy of . We attribute this difference to updated charge transfer efficiency (CTE) corrections in the WFC3/UVIS pipeline, as the largest photometric discrepancies correspond to observations where 1) SN 2011fe is far from the read-out amplifier and 2) the sky background is low enough ( per image) for CTE corrections to dominate the uncertainty (c.f., Anderson et al., 2021). While it is not possible to directly confirm that CTE is the source of the observed discrepancy, we note that the differences are at the level and the pseudo-bolometric light curve derived in §3.1 agrees with the pseudo-bolometric light curves calculated by Shappee et al. (2017) and Kerzendorf et al. (2017) to better than .
3 Pseudo-Bolometric Light Curve
Bolometric light curves provide important insight into the physical processes governing the observed emission. However, constructing a reliable bolometric light curve is challenging due to both observational factors and limits in our theoretical understanding of the dominant emission mechanisms. §3.1 outlines our procedure for constructing the (pseudo-)bolometric light curve, including comparisons to previous works and assumptions about the mid-IR contribution. We fit simple radioactive decay models to the derived pseudo-bolometric light curve in §3.2 and compare our isotopic ratios to other measurements in the literature. Finally, we discuss the effects of positron propagation within the ejecta and potential sources of contamination in §3.3 and §3.4, respectively.
3.1 Constructing the Pseudo-Bolometric Light Curve
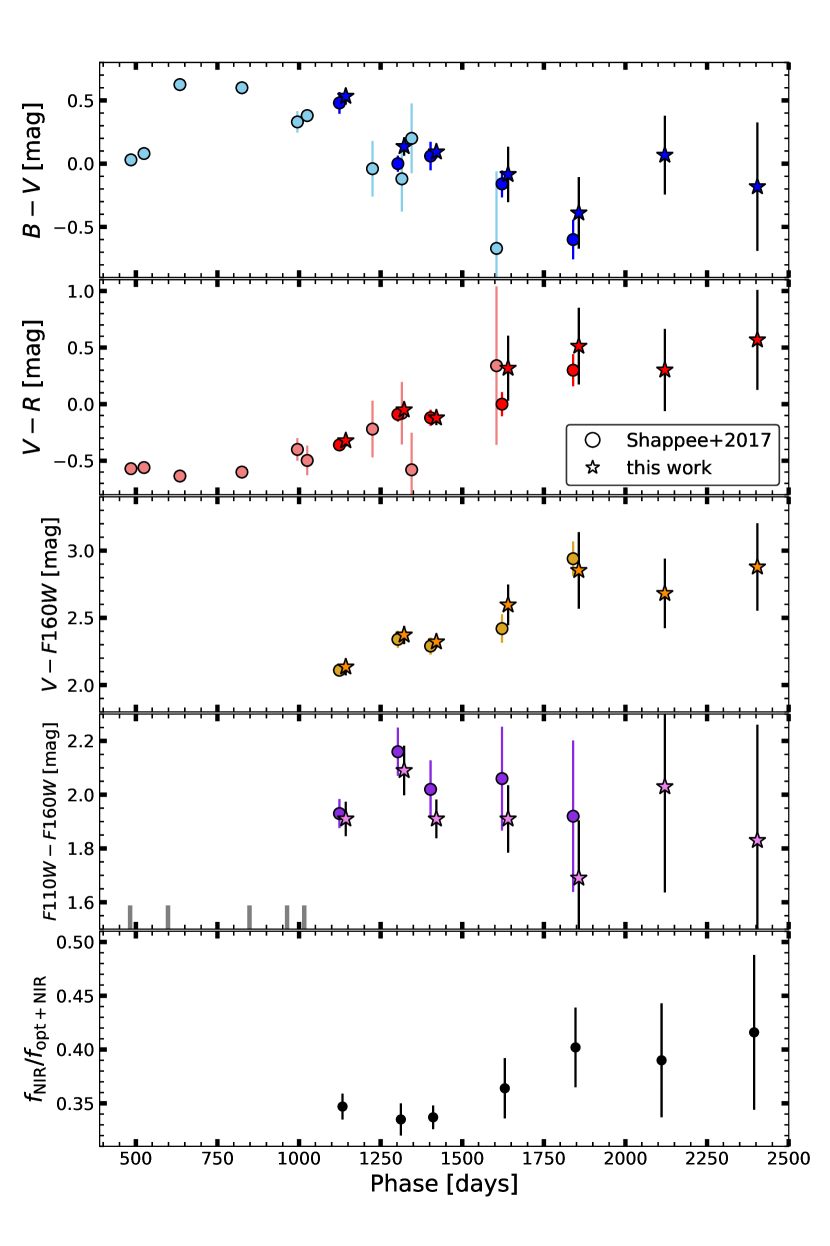
Our observations cover optical and NIR wavelengths (). Both the -day theoretical spectrum from Fransson & Jerkstrand (2015) and the optical + NIR photometry from Shappee et al. (2017) predict a NIR fraction222We use the same formalism for the fractional NIR contribution presented by Dimitriadis et al. (2017): . of which agrees with our results in the bottom panel of Fig. 3. Our observations are consistent with a flat or modestly increasing NIR fraction at days after with our latest observations reaching .
Because our observations are limited to optical and NIR wavelengths, we must make assumptions about the mid-IR (MIR) contribution. Axelrod (1980) predicted an “infrared catastrophe” (IRC) beginning days after explosion due to the diminishing temperature and density in the ejecta being unable to populate the optical [Fe II] and [Fe III] transitions. In the IRC picture, the late-time emission should be dominated by fine-structure line emission in the MIR with no optical emission. Empirically, however, there is no evidence for the IRC (e.g., Stritzinger & Sollerman, 2007; Hristov et al., 2021) and the most recent theoretical modeling from Fransson & Jerkstrand (2015) show that the IRC does not set in by day 1000 due to the redistribution of UV flux through multiple scatterings and fluorescence.
The fraction of the bolometric luminosity emitted in the mid-IR fine-structure lines remains unclear. Recent observational (e.g., Black et al., 2016, Mazzali et al., 2020, Tucker et al., 2022) and theoretical (e.g., Wilk et al., 2020) studies have found tentative evidence for clumping in the ejecta of SNe Ia which has important ramifications for the presence of the IRC. The degree of clumping determines where energy is deposited and affects both the observed spectra and the MIR emission. Fine-structure cooling will occur only in the low-density regions in a clumpy medium. Due to these uncertainties, we include the fraction of total luminosity emitted in the optical and NIR as a parameter constrained by a prior in our subsequent analyses.
We compute the pseudo-bolometric light curve by warping (e.g., Hsiao et al., 2007) the theoretical +1000-day spectrum from Fransson & Jerkstrand (2015) to match the observed photometry and then integrating the optical and NIR flux. The pseudo-bolometric light curve is unaffected by our choice to use the theoretical spectrum compared to the observed +1000-day spectrum from Taubenberger et al. (2015) with a NIR correction. The uncertainty in the distance to SN 2011fe/M101 is not propagated to the uncertainty in the pseudo-bolometric light curve as we do not attempt to derive true isotopic masses but only constrain the relative isotopic abundances in the following analyses. However, we do include a 5% systematic uncertainty when estimating our final pseudo-bolometric light curve to account for our incomplete knowledge regarding the evolution of the MIR emission. This systematic uncertainty is a sub-dominant source of error at days after compared to the statistical photometric uncertainties.
The larger pixel scale of the WFC3/IR module and the very red stars near SN 2011fe make crowding a potential source of contamination at these epochs (i.e., Fig. 1 from Shappee et al., 2017). To ensure contaminated NIR photometry does not dictate our results, we re-derive the pseudo-bolometric light curve by warping and integrating the optical portion of the spectrum then including a constant NIR fraction of (e.g., Fig. 7 from Dimitriadis et al., 2017). The resulting pseudo-bolometric light curve is consistent at from the procedure including the NIR photometry (see the bottom panel of Fig. 3), indicating that the NIR photometry is likely reliable.
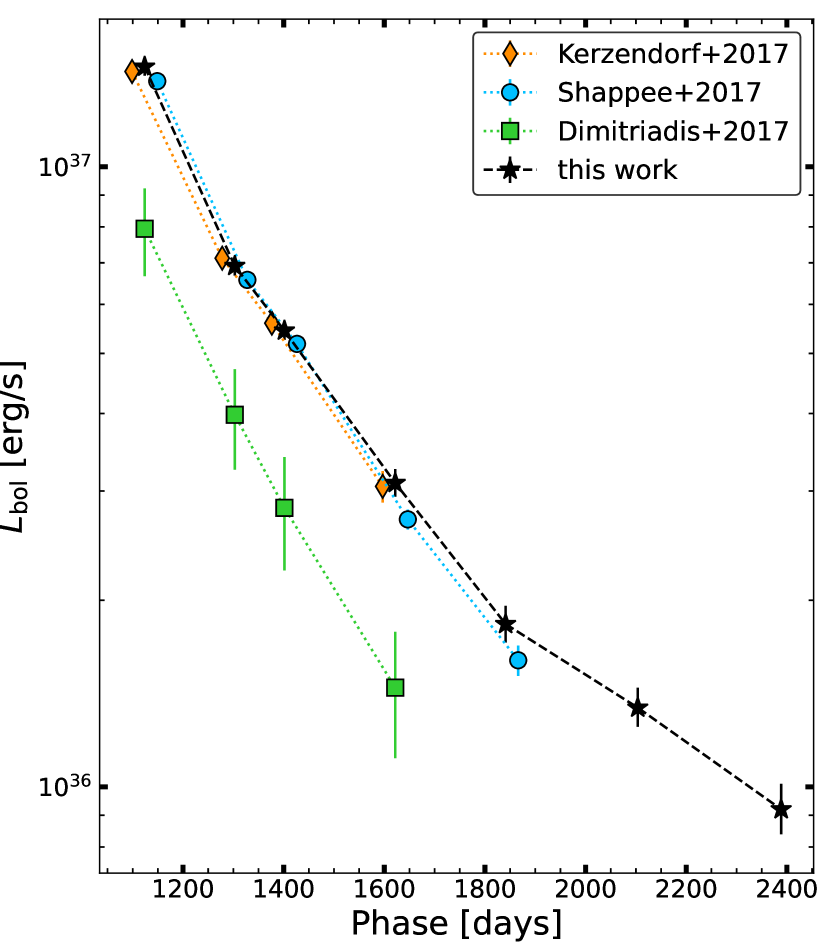
Our final pseudo-bolometric light curve is compared to the results from Shappee et al. (2017), Kerzendorf et al. (2017), and Dimitriadis et al. (2017) in Fig. 4. Our pseudo-bolometric light curve is slightly higher than previous estimates from Shappee et al. (2017) and Kerzendorf et al. (2017) due to slightly higher photometric measurements (see §2) but consistent within the uncertainties. We note that the pseudo-bolometric light curve derived by Dimitriadis et al. (2017) disagrees with our results and those of Shappee et al. (2017) and Kerzendorf et al. (2017). This discrepancy is likely due to the different methodology employed by Dimitriadis et al. (2017) who construct a pseudo-bolometric light curve from -band photometry and a NIR correction instead of integrating over broadband multi-filter photometry as done in this work, Shappee et al. (2017), and Kerzendorf et al. (2017). The main spectral feature in the -band at days after is [Ca II] (Tucker et al., 2022). The Å wavelength range is dominated by a complex blend of forbidden iron lines powered by UV scattering which generally tracks the bolometric evolution (e.g., Fransson & Jerkstrand, 2015). However, the ratio of [Ca II] flux to Å flux is not constant with time (Tucker et al., 2022). This indicates that the [Ca II] feature (and thus -band photometry in general) is not a good proxy for the bolometric evolution.
3.2 Interpreting the Pseudo-Bolometric Light Curve
We model the bolometric light curve with energy input from the radioactive decays in Eq. 1. The decay chain of is omitted for most of the analysis due to the long half-life () of the first decay and the very small mass of 44Ti expected from SNe Ia ( ; e.g., Iwamoto et al., 1999; Seitenzahl et al., 2009). We do provide simple constraints on the 44Ti mass in §3.2. For simplicity, we refer to the masses of radioactive isotopes and their daughter nuclei by their mass number (i.e., ).333These values only represent radioactive species and do not account for directly-synthesized stable isotopes. The only stable isotope produced in enough quantities for this to matter is stable 56Fe. At days after , -rays are free-streaming and do not contribute meaningfully to the emitted energy. However, the efficiency of X-ray trapping is less clear, especially at the epochs where 55Fe decays dominate the total energy deposition. Two simple models are considered in the subsequent analysis. The first assumes all X-rays are trapped and deposit their energy locally, and the second uses a simple prescription for time-dependent X-ray escape based on the models of Seitenzahl et al. (2015), while still assuming the trapped X-rays deposit their energy locally in the ejecta.
The second decay of the first decay chain, , occurs primarily by electron-capture, but 19% of these are through decay (Bé et al., 1999, 2016), producing a high-energy ( MeV) positron (). For many years it was thought that a small fraction of these positrons would escape into the interstellar medium (; e.g., Milne et al., 1999, 2001). However, the inclusion of NIR photometry suggests complete positron trapping (e.g., Sollerman et al., 2004; Stritzinger & Sollerman, 2007) and more recent studies have yet to find any evidence for escape (e.g., Hristov et al., 2021). For these reasons we assume the 56Co positrons are completely trapped in the ejecta, although we discuss the time-dependent energy deposition from in §3.3.
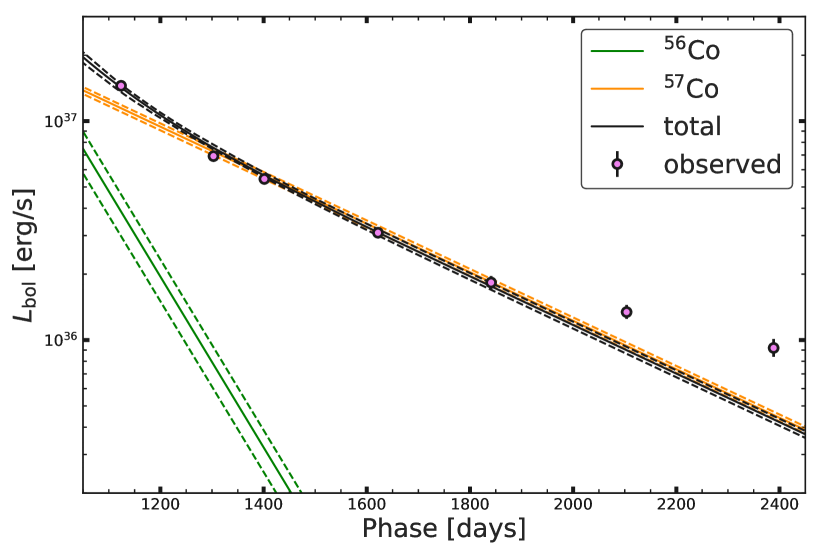
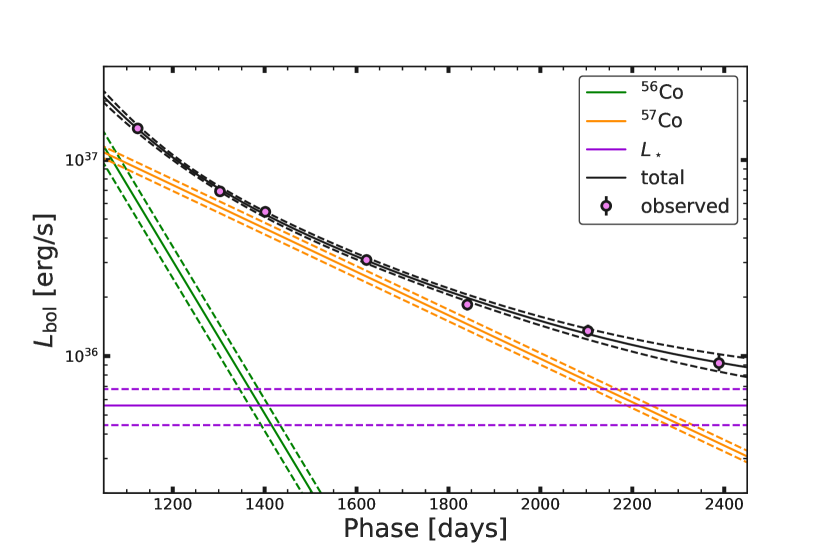
There are theoretical predictions (Axelrod, 1980; Fransson & Jerkstrand, 2015) for emission at (see §3.1), so our initial model includes energy input from 56Co + 57Co and assumes some fixed fraction of the true bolometric luminosity is emitted within m. The effect of 57Co/57Ni on the late-time light curves of SNe Ia has been invoked in the literature for both SN 2011fe (e.g., Fransson & Jerkstrand, 2015; Shappee et al., 2017; Kerzendorf et al., 2017; Dimitriadis et al., 2017) and other SNe Ia (e.g., Graur et al., 2016; Flörs et al., 2018; Jacobson-Galán et al., 2018; Yang et al., 2018). Contribution from the decay of 55Fe is excluded (i.e., ) for this initial model and we set simple priors on the parameters, including , , and . The distance to M101 of Mpc from Shappee & Stanek (2011) is included as a prior due to the covariance between the distance and . The prior on is derived from the values reported by Pereira et al. (2013) and Mazzali et al. (2015) using separate methods and data444We do not include the 56Ni mass derived by Scalzo et al. (2014), as they use the same SuperNova Factory observations as Pereira et al. (2013). The 56Ni mass derived by Childress et al. (2015) is excluded because they explicitly use SN 2011fe as an anchor for deriving their relation. . We note that removing the prior on does not affect the final conclusions but increases the resulting uncertainties (i.e., broadens the parameter posterior distributions). For the model excluding contributions from 55Fe, we find and , shown in the left panel of Fig. 5. The observations at days after explosion are poorly fit by this model.
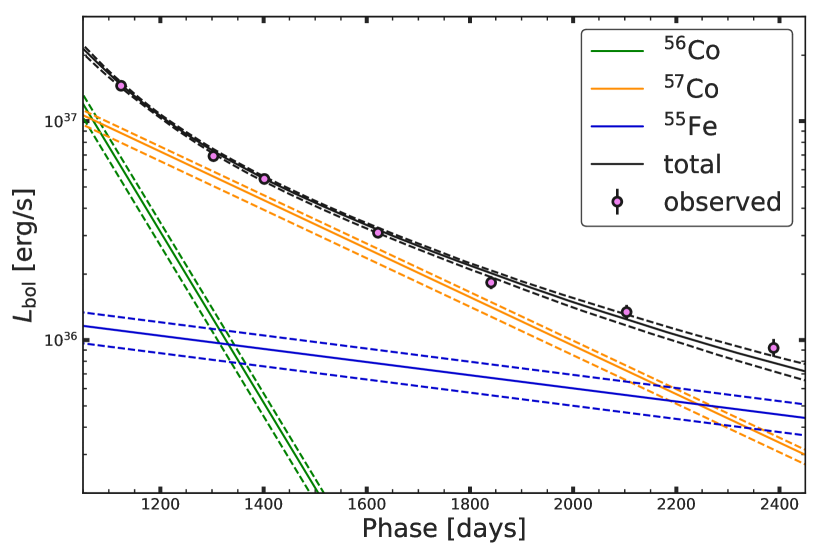
In practice, 55Fe is expected to dominate the energy input into the ejecta at days after (e.g., Seitenzahl et al., 2009; Kushnir & Waxman, 2020) but it has never previously been detected in the light curve of a SN Ia. If we now add 55Fe with , the same priors on the other three variables, and assume all X-rays are confined to the ejecta, we find , , and . This model provides an excellent fit to the observations. For a fiducial mass of , these ratios correspond to isotopic masses of and .
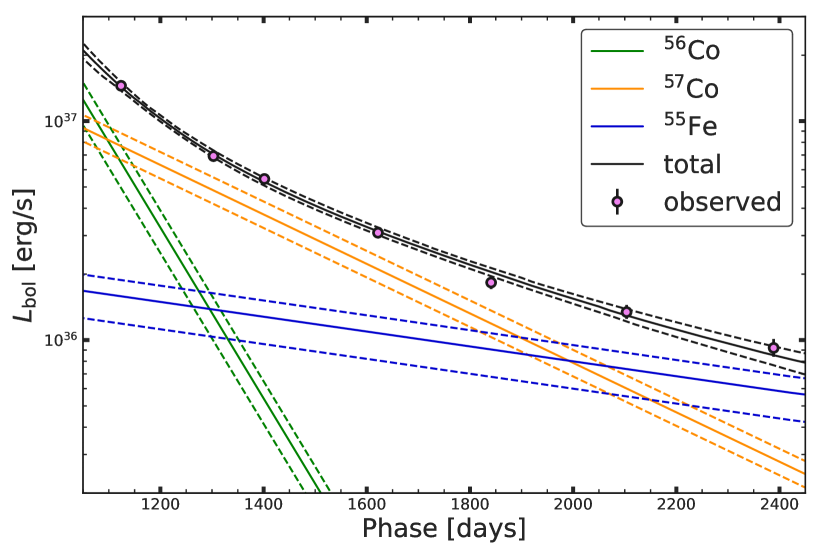
If X-rays are allowed to escape the ejecta, then some of the energy released by the decay of 55Fe 55Mn will not be deposited into the ejecta and thus not contribute to the bolometric light curve. To incorporate X-ray escape, we scale the emitted luminosity for each decay chain by where represents the fraction of decay energy released as X-ray photons ( for 56Co, for 57Co, and for 55Fe, see Table 1 from Seitenzahl et al., 2009) and is the time-dependent X-ray trapping function. Seitenzahl et al. (2015) estimate of the X-rays escape at 1000 days after explosion which increases linearly to at day 2400. Even assuming the explosion model with a higher X-ray escape fraction, the escaping X-rays constitute of the total decay energy at 2400 days and fitting the pseudo-bolometric light curve with this model produces similar results to the model assuming complete X-ray trapping, as shown in the bottom panel of Fig. 5. Including time-dependent X-ray escape produces , and . For a fiducial mass of , these isotope ratios correspond to synthesized masses of and .
SNe Ia are not thought to produce significant amounts of 44Ti (e.g., Iwamoto et al., 1999; Hoeflich et al., 2017) but the resurgence of explosion models invoking He burning shells (e.g., Shen et al., 2021) may challenge this assumption. Therefore, we check if the inclusion of affects our results. The first decay, 44Ti 44Sc, has a year half-life but of the subsequent decays produce a high-energy ( MeV) positron within a few hours (e.g., Seitenzahl et al., 2009; Chen et al., 2011). A synthesized 44Ti mass of supplies enough decay energy (, Seitenzahl et al., 2014) to match our last epoch of HST photometry (cf. Fig. 5). We do not fit for the amount of synthesized 44Ti in our pseudo-bolometric light curve for two reasons. The first is practical, as the near-constant luminosity from is degenerate with similar to including luminosity from a surviving companion (cf. §3.4.1). The second is theoretical, as we cannot assume that is the same for the inner and outer ejecta and 44Ti would be primarily produced during surface He burning. With these caveats, we place a rough upper limit of on the synthesized 44Ti mass which would supply the entire pseudo-bolometric luminosity at 2400 days assuming .
Finally, we compare our / ratio to previous estimates. Shappee et al. (2017) analyzed the first days of SN 2011fe and report a / mass ratio of , in good agreement with ours. They did not have a clean detection of 55Fe but placed a 99% upper limit at , broadly consistent with our new estimate. Our / ratio also agrees reasonably well with estimates by Graur et al. (2016), Jacobson-Galán et al. (2018), and Flörs et al. (2018) for other SNe Ia. However, our results disagree with the results of Dimitriadis et al. (2017) for SN 2011fe and with Yang et al. (2018) for SN 2014J. The results of Dimitriadis et al. (2017) are likely based on an inaccurate pseudo-bolometric light curve, as discussed in §3.1. The pseudo-bolometric light curve derived by Yang et al. (2018) for SN 2014J only extends to days after where 56Co still dominates the light curve (c.f. Fig. 5). Additionally, Yang et al. (2018) assume a fixed / ratio of . This is consistent with some of the explosion models shown in Fig. 8 but the resulting / ratio of is highly inconsistent with both our result and the bulk of SN Ia explosion models (e.g., Fig. 8).
Our results do not require supersolar abundances of iron-group elements (IGEs) as suggested by some studies in the literature (e.g., Graur et al., 2016). In fact, our isotopic constraints agree at with the Solar abundances from Asplund et al. (2009) with the caveat that the 56Fe abundance inferred from the Sun includes both stable 56Fe and daughter 56Fe from radioactive 56Ni. While a single object does not lend itself well to statistical inferences, we can at least say that SN 2011fe, the quintessential SN Ia, produced abundance ratios in rough agreement with the Solar values.
3.3 Positron Propagation
Although we assume the 56Co positrons cannot escape the ejecta (§3.1), there are other possible effects on the light curve from the propagation of positrons in the ejecta. As the ejecta expands and the density decreases, it will take longer for a positron to deposit its energy into the surrounding ejecta (i.e., “delayed deposition”; Kushnir & Waxman, 2020). This effect extends the energy deposition from 56Co and slows the decline rate compared to pure radioactive decay. It is unclear at what level, if any, this process will affect the observed light curve due to uncertainties regarding magnetic field generation within the ejecta (e.g., Hristov et al., 2021; Gupta et al., 2021) and the degree of clumping in the iron core (e.g., Black et al., 2016; Wilk et al., 2020). With these caveats, we briefly consider the potential effect of delayed deposition on the derived isotope ratios.
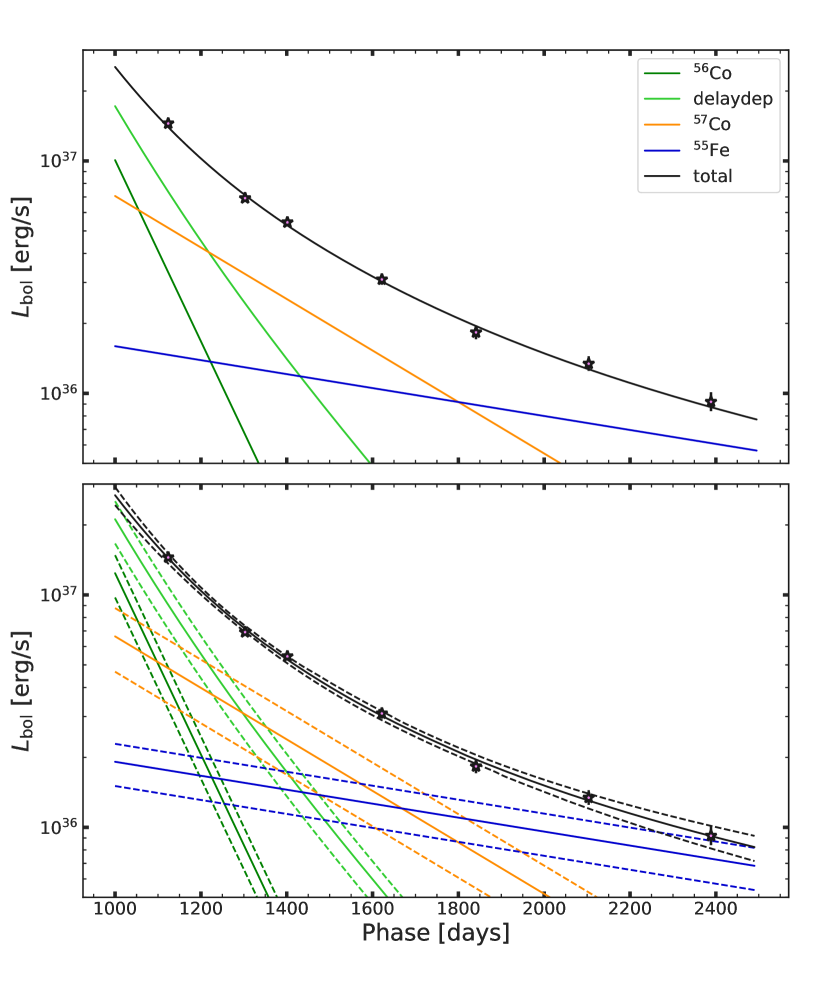
We first test the model of Kushnir & Waxman (2020) where the isotopic ratios are set to the Solar values, and and the mass-weighted density, , are free parameters. We set a simple prior on of (see Fig. 2 from Kushnir & Waxman, 2020) and the same prior on as in §3.2. This model produces similar results to Kushnir & Waxman (2020), namely and which is shown in the top panel of Fig. 6.
Next, we test a model where the isotopic ratios and are allowed to vary but is set , the value derived for SN 2011fe by Kushnir & Waxman (2020). The first thing to note is that our detection of 55Fe is robust to the inclusion of the delayed deposition effect, as most of the 56Co have completely deposited their energy into the ejecta by the time 55Fe dominates the light curve (c.f. Fig. 3 from Kushnir & Waxman, 2020). However, the 57Ni value does change as energy originally attributed to 57Ni is instead attributed to surviving 56Co. This results in a similar / ratio of dex but increases and the / ratio to and , respectively. The delayed energy deposition from 56Co essentially mimics the evolution of 57Ni, as shown in the bottom panel of Fig. 6.
While the model including delayed deposition produces isotope ratios in agreement with our previous estimates, this effect is in need of further study before adopting it in our analysis. The mass-weighted density predicted from explosion models is in slight tension with observations (e.g., Fig. 2 from Kushnir & Waxman, 2020). Additionally, it is unclear how clumping of the ejecta affects which dictates the strength of the delayed deposition effect.
3.4 Potential Sources of Contamination
Finally, we consider plausible sources of contamination to the pseudo-bolometric light curve. None of the HST images show any evidence for a resolved light echo. The late-time color evolution strongly disfavors the presence of an unresolved light echo (Shappee et al., 2017; Dimitriadis et al., 2017), consistent with SN 2011fe exploding in an extremely clean ISM environment (e.g., Patat et al., 2013; Zhang et al., 2016). However, we do consider contributions from a surviving post-impact donor star in §3.4.1 and a breakdown in the ionization and recombination timescales in §3.4.2.
3.4.1 A Surviving Post-Impact Companion Star
Another potential luminosity source at these epochs is a surviving donor star impacted by the explosion (e.g., Marietta et al., 2000; Pan et al., 2012a; Boehner et al., 2017). The kick velocity imparted to the companion star is too low ( km s-1, Pan et al., 2012a; Liu et al., 2013; Boehner et al., 2017) to produce a resolved shift in the HST images. However, the injection of energy into the stellar envelope should produce a significant increase in the photospheric temperature and luminosity (e.g., Podsiadlowski, 2003; Pan et al., 2012b; Shappee et al., 2013a). When the luminosity increases is unclear, as some models predict a rapid ( year) thermalization of the stellar envelope and a subsequent rapid increase in luminosity (e.g., Shappee et al., 2013a; Pan et al., 2013) yet other models predict the thermalization takes years (e.g., Pan et al., 2012b; Liu et al., 2021). Thus, we test a few simple models where some of the pseudo-bolometric luminosity is provided by luminosity from a surviving donor star ().
Fig. 7 shows that our detection of 55Fe can be replaced by the constant luminosity from a surviving companion with and similar values for and . Including luminosity input from both a surviving companion and 55Fe as free parameters results in sub-threshold () detections for both components, with best-fit parameters and dex. The other parameters ( and ) are unaffected by the inclusion of a surviving companion.
The detection of 57Ni without the detection of 55Fe would challenge most SN Ia explosion models (c.f. Fig. 8), so we consider a surviving companion star dominating the late-time light curve unlikely. However, this does not exclude models where it takes years for the stellar envelope to thermalize (e.g., the main-sequence star models of Pan et al., 2012b and the He-star models of Liu et al., 2021). Interestingly, there are also models for both main-sequence stars (Shappee et al., 2013a) and He-stars (Pan et al., 2013) predicting a companion luminosity far above our detection. For this reason we conclude any surviving post-impact companion star must have at years after explosion to prevent introducing discrepancies with SN Ia explosion models but the exact type of star(s) excluded by this result is model-dependent.
3.4.2 Ionization Freeze-Out
Finally, we briefly discuss ionization “freeze-out” where the balance between ionization and recombination breaks down (e.g., Fransson & Kozma, 1993). This occurs at low densities and results in a flattening of the late-time light curve as ions become “frozen” due a lack of free electrons for recombination, essentially storing energy and delaying the timescale between energy injection and emission. Kerzendorf et al. (2017) argue this is one of the reasons no conclusions can be drawn about isotopic yields based on the late-time light curve of SN 2011fe. They show a fit to the day pseudo-bolometric light curve using a simple prescription for freeze-out and show it can allow .
Approximating the impact of freeze-out as an additional luminosity source that evolves as (as done by Kerzendorf et al., 2017) can still produce a good fit to the late-time light curve. However, this speaks more to the flexibility of the model than its reliability. Luminosity from either 57Ni or 55Fe can be replaced with the model for freeze-out, as the radioactive decay slopes are close enough to and the additional parameter for scaling the freeze-out contribution provides plenty of flexibility in the model.
With these considerations in mind, we briefly discuss the applicability of freeze-out to SN 2011fe at these epochs (see Fransson & Kozma, 1993 for a discussion). Freeze-out sets in for the highest-velocity and lowest-density regions first. Fransson & Jerkstrand (2015) show the +1000-day optical spectrum is mainly comprised of Fe I emission. Non-Fe emission components (mainly Ca) contribute a diminishing fraction of the luminosity with time (Tucker et al., 2022). The Fe-dominated emission means that the luminosity is dominated by the iron-rich core instead of the lower-density, higher-velocity outer ejecta. Fransson & Jerkstrand (2015) state that the density and temperature of the inner core of SN 2011fe are very similar to the inner core of SN 1987A modeled by Jerkstrand et al. (2011). Furthermore, Jerkstrand et al. (2011) state that time-dependent effects from freeze-out have not set in for the iron-rich inner core of SN 1987A even years after explosion. While there are obvious differences in composition and density profiles between the cores of SN 1987A and SN 2011fe, it suggests that freeze-out is likely a subdominant contributor to the late-time emission and that the derived isotopic ratios are valid.
4 Discussion
We have presented new HST photometry of SN 2011fe extending to days after and used these observations to construct a pseudo-bolometric light curve. Energy input from 57Ni and 55Fe are needed to power the late-time luminosity (Fig. 5). While there are several physical mechanisms which could affect the derived isotopic constraints, these scenarios are ultimately disfavored because they produce physically unreasonable results (i.e., or ). We will obtain one additional HST epoch in Cycle 30 to constrain alternative explanations and improve the isotopic ratio estimates.
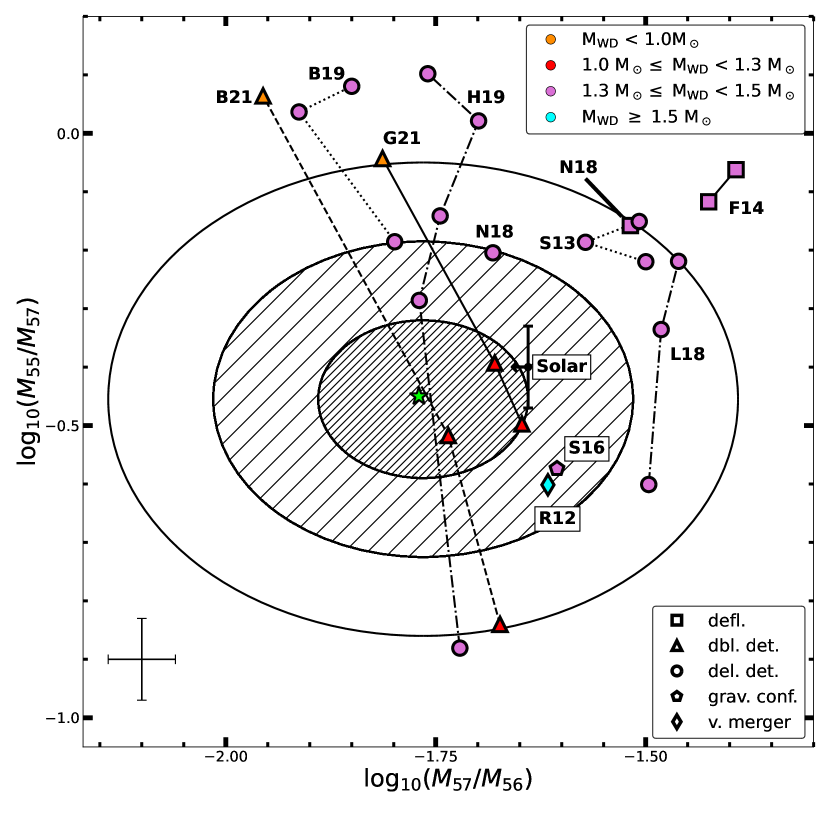
Fig. 8 compares our derived isotopic ratios to various SN Ia explosion models produced after the revision of electron-capture rates (Dean et al., 1998; Caurier et al., 1999a, b; Brachwitz et al., 2000). We adopt the isotope ratios from the model including time-dependent X-ray escape (see §3.2) but note that our conclusions are largely independent of the X-ray escape treatment. Some explosion models can be discarded as they do not reproduce SN 2011fe well near maximum light.555These comparisons only rely on observations of SN 2011fe and do not account for any discrepancies between models and the ensemble properties of SNe Ia as a population. Direct (head-on) WD collision models (e.g., Rosswog et al., 2009; van Rossum et al., 2016; Papish & Perets, 2016) predict isotope ratios inconsistent with observations (Papish & Perets, 2016) which is supported by the non-detection of bimodal nebular-phase emission profiles (e.g., Dong et al., 2015; Vallely et al., 2020). Similarly, graviationally-confined detonations (grav. conf.; e.g., Plewa et al., 2004; Plewa, 2007; Townsley et al., 2007; Meakin et al., 2009; Seitenzahl et al., 2016) predict large-scale mixing during the explosion that mix burning by-products into the outer ejecta. This creates strong UV line-blanketing in early spectra, which was not observed for SN 2011fe. The violent merger model from Röpke et al. (2012, also see , ) can reproduce the near-peak observations of SN 2011fe and predict isotopic ratios in good agreement with our constraints. However, the violent merger model of Kromer et al. (2013) predicts strong [O I] emission lines due to unburned material near the center of the explosion. This was observed in the nebular spectrum of the subluminous SN Ia 2010lp (Taubenberger et al., 2013) but [O I] was not seen in nebular spectra of SN 2011fe (Shappee et al., 2013b; Lundqvist et al., 2015; Graham et al., 2015; Taubenberger et al., 2015; Fransson & Jerkstrand, 2015; Tucker et al., 2022). Thus, we focus on explosion models consistent with other observational constraints on SN 2011fe.
Double Detonations (e.g., Livne, 1990; Livne & Glasner, 1991; Fink et al., 2007, 2010; Woosley & Kasen, 2011; Gronow et al., 2021; Boos et al., 2021; Shen et al., 2021) use the ignition of a He-rich surface layer to then drive a compression wave into the WD core that induces the explosion. Bare C/O WD detonations (e.g., Sim et al., 2010; Shen et al., 2018; Nomoto & Leung, 2018; Bravo et al., 2019), which are qualitatively similar to double-detonation models without the surface ignition, are not shown in Fig. 8 for clarity but exhibit similar isotopic trends. Double-detonation models initially involved heavy surface shells in order for the He ignition to occur (; e.g., Woosley & Kasen, 2011) and the burning by-products near the surface produced heavy line-blanketing in early-phase optical spectra (e,g,. Polin et al., 2019) which is not observed in SN 2011fe. However, more recent simulations suggest mixing of other elements into the surface shell may facilitate ignition of the He envelope (Shen & Bildsten, 2014; Gronow et al., 2020) but the minimum mixing and shell mass needed for ignition is still unclear. We exclude double-detonation models with due to the non-detection of He ashes in the early spectra (e.g., Polin et al., 2019) and limits on 44Ti from the bolometric light curve (see §3.2), although this cutoff is somewhat arbitrary due to the model uncertainties. Thin-shell double-detonation models involving more massive WD cores () agree well with our isotopic constraints.
Deflagrations (e.g., Iwamoto et al., 1999; Travaglio et al., 2004, 2005; Fink et al., 2014; Kromer et al., 2015; Nomoto & Leung, 2018) are subsonic flames that ignite naturally in the core as the WD approaches due to compressional heating. Fig. 8 shows these models are broadly inconsistent with our isotopic ratios, likely due to the low amount of high-density burning. However, the density profiles of “fast” deflagration models appear to match the density structure of SN 2011fe reasonably well when modeling early- and nebular-phase spectra (Mazzali et al., 2014; Fransson & Jerkstrand, 2015; Mazzali et al., 2015).
Delayed Detonations (Röpke et al., 2012; Seitenzahl et al., 2013; Ohlmann et al., 2014; Dessart et al., 2014; Nomoto & Leung, 2018; Leung & Nomoto, 2018; Hoeflich et al., 2019, 2021) start with a deflagration near the center of the star as the WD approaches but the flame speed transitions from subsonic to supersonic at a specified density (Arnett & Livne, 1994; Niemeyer & Woosley, 1997; Khokhlov et al., 1997). The isotopic yields from delayed-detonation models are in poor agreement with our inferred isotopic ratios with the exception of the lowest central density () models of Hoeflich et al. (2017, 2019). However, the subsonic-to-supersonic transition density () is a free parameter which affects the resulting nucleosynthesis. For example, the models of Hoeflich et al. (2017, 2019) show how varying with a fixed affects the isotopic ratios whereas the models of Bravo et al. (2019) assume a single and vary . It remains unclear what areas in the parameter space can produce SNe Ia that match the observed isotopic ratios without introducing new discrepancies with near-peak and nebular-phase observables.
In summary, all deflagration models are disfavored, as are double-detonation models with low-mass () WDs and high- delayed-detonation models. The observed isotope ratios fall between the delayed-detonation models from Hoeflich et al. (2017, 2019), which corresponds to a model-dependent WD mass of (e.g., Fig. 13 from Diamond et al., 2015). Furthermore, Mazzali et al. (2015) find that the spectra of SN 2011fe can be reproduced by either a high-energy deflagration explosion or a low-energy delayed-detonation explosion, broadly consistent with our isotopic measurements.
Translating the isotope ratios into WD masses is more complicated for double-detonation scenarios. The central pressure () and density () are augmented during the explosion by the converging shockwave produced by the surface ignition (Shen & Bildsten, 2014). However, the central density and pressure in a degenerate medium are related by with () for non-relativistic (relativistic) electrons. The double-detonation models in best agreement with our observations have WD masses of and central densities of (Boos et al., 2021; Gronow et al., 2021). Assuming the converging shock increases by a factor of 10, a value well within the predictions of Shen & Bildsten (2014), this leads to an increase in of which is in rough agreement with the estimated from delayed-detonation models.
However, both classes of explosion models require further study. Multi-dimensional modeling of double-detonation explosions extending to the nebular phase are necessary to evaluate the effect of off-center detonations on the nebular-phase emission line profiles. Conversely, delayed-detonation models require additional simulations to test how these explosions occur without invoking a SD progenitor system since the SD scenario is disfavored for SN 2011fe (see §1). DD progenitors producing delayed-detonation explosions are possible (e.g., Piersanti et al., 2003) but the available parameter space leading to successful explosions is largely unexplored. Furthermore, WDs with are thought to be stable (e.g., Lesaffre et al., 2006; Wu et al., 2019) which poses a challenge to delayed-detonation explosions from low mass () WDs without an external ignition mechanism.
Finally, these results highlight several physical processes in need of additional modeling. It is unclear if the delayed deposition of 56Co positrons (§3.3, Kushnir & Waxman, 2020) affects the derived isotope ratios. Clumping in the ejecta has significant ramifications for local energy deposition, such as shortening the recombination time (§3.4.2) and decreasing the cooling efficiency of fine-structure emission lines in the MIR (§3.2). While we disfavor these effects biasing our analyses, stronger predictions will make these scenarios easier to test. Simulations of post-impact companion stars do not agree on the energy dissipation timescale within the stellar envelope (§3.4.1) which makes definitive conclusions about shock-heated companions difficult. Finally, a better understanding of the convective URCA process is required to accurately translate isotopic measurements into constraints on the explosion conditions (e.g., Lesaffre et al., 2005; Piersanti et al., 2022). These unprecedented observations of SN 2011fe have provided the first detection of 55Fe but also revealed gaps in our knowledge regarding these explosions.
Data Availability
The HST data is publicly available at the MAST archive and our pseudo-bolometric light curve (Fig. 4) is included as supplementary material.
Acknowledgements
We thank the referee for a very helpful suggestions which improved the manuscript. We also thank Zach Claytor, Connor Auge, and Michelle Togami for useful discussions.
M.A.T. acknowledges support from the DOE CSGF through grant DE-SC0019323. CSK and KZS are supported by NSF grants AST-1814440 and AST-1908570.
Based on observations with the NASA/ESA Hubble Space Telescope obtained from the Data Archive at the Space Telescope Science Institute, which is operated by the Association of Universities for Research in Astronomy, Incorporated, under NASA contract NAS5-26555. Support for program numbers 14678 and 15192 was provided through a grant from the STScI under NASA contract NAS5-26555.
References
- Anderson et al. (2021) Anderson, J., Baggett, S., & Kuhn, B. 2021, Updating the WFC3/UVIS CTE model and Mitigation Strategies, Space Telescope WFC Instrument Science Report
- Arnett & Livne (1994) Arnett, D., & Livne, E. 1994, ApJ, 427, 330, doi: 10.1086/174143
- Arnett (1982) Arnett, W. D. 1982, ApJ, 253, 785, doi: 10.1086/159681
- Asplund et al. (2009) Asplund, M., Grevesse, N., Sauval, A. J., & Scott, P. 2009, ARA&A, 47, 481, doi: 10.1146/annurev.astro.46.060407.145222
- Axelrod (1980) Axelrod, T. S. 1980, PhD thesis, California Univ., Santa Cruz.
- Bé et al. (1999) Bé, M.-M., Duchemin, B., Lamé, J., et al. 1999, Table de Radionucléides, Vol. 1 (DAMRI/LPRI BP 52, F-91193 Gif-sur-Yvette Cedex, France: Commissariat à l’Énergie Atomique)
- Bé et al. (2016) Bé, M.-M., Chisté, V., Dulieu, C., et al. 2016, Monographie BIPM-5, Vol. 8, Table of Radionuclides (Pavillon de Breteuil, F-92310 Sèvres, France: Bureau International des Poids et Mesures). http://www.bipm.org/utils/common/pdf/monographieRI/Monographie_BIPM-5_Tables_Vol8.pdf
- Beaton et al. (2019) Beaton, R. L., Seibert, M., Hatt, D., et al. 2019, ApJ, 885, 141, doi: 10.3847/1538-4357/ab4263
- Bellm et al. (2019) Bellm, E. C., Kulkarni, S. R., Graham, M. J., et al. 2019, PASP, 131, 018002, doi: 10.1088/1538-3873/aaecbe
- Bianco et al. (2011) Bianco, F. B., Howell, D. A., Sullivan, M., et al. 2011, ApJ, 741, 20, doi: 10.1088/0004-637X/741/1/20
- Black et al. (2016) Black, C. S., Fesen, R. A., & Parrent, J. T. 2016, MNRAS, 462, 649, doi: 10.1093/mnras/stw1680
- Blondin et al. (2017) Blondin, S., Dessart, L., Hillier, D. J., & Khokhlov, A. M. 2017, MNRAS, 470, 157, doi: 10.1093/mnras/stw2492
- Bloom et al. (2012) Bloom, J. S., Kasen, D., Shen, K. J., et al. 2012, ApJ, 744, L17, doi: 10.1088/2041-8205/744/2/L17
- Boehner et al. (2017) Boehner, P., Plewa, T., & Langer, N. 2017, MNRAS, 465, 2060, doi: 10.1093/mnras/stw2737
- Boos et al. (2021) Boos, S. J., Townsley, D. M., Shen, K. J., Caldwell, S., & Miles, B. J. 2021, arXiv e-prints, arXiv:2101.12330. https://arxiv.org/abs/2101.12330
- Botyánszki et al. (2018) Botyánszki, J., Kasen, D., & Plewa, T. 2018, ApJ, 852, L6, doi: 10.3847/2041-8213/aaa07b
- Brachwitz et al. (2000) Brachwitz, F., Dean, D. J., Hix, W. R., et al. 2000, ApJ, 536, 934, doi: 10.1086/308968
- Bravo (2020) Bravo, E. 2020, MNRAS, 494, 3037, doi: 10.1093/mnras/staa910
- Bravo et al. (2019) Bravo, E., Badenes, C., & Martínez-Rodríguez, H. 2019, MNRAS, 482, 4346, doi: 10.1093/mnras/sty2951
- Brown et al. (2012) Brown, P. J., Dawson, K. S., de Pasquale, M., et al. 2012, ApJ, 753, 22, doi: 10.1088/0004-637X/753/1/22
- Brown et al. (2016) Brown, W. R., Kilic, M., Kenyon, S. J., & Gianninas, A. 2016, ApJ, 824, 46, doi: 10.3847/0004-637X/824/1/46
- Caurier et al. (1999a) Caurier, E., Langanke, K., Martínez-Pinedo, G., & Nowacki, F. 1999a, Nucl. Phys. A, 653, 439, doi: 10.1016/S0375-9474(99)00240-7
- Caurier et al. (1999b) Caurier, E., Martínez-Pinedo, G., Nowacki, F., et al. 1999b, Phys. Rev. C, 59, 2033, doi: 10.1103/PhysRevC.59.2033
- Cendes et al. (2020) Cendes, Y., Drout, M. R., Chomiuk, L., & Sarbadhicary, S. K. 2020, ApJ, 894, 39, doi: 10.3847/1538-4357/ab6b2a
- Chambers et al. (2016) Chambers, K. C., Magnier, E. A., Metcalfe, N., et al. 2016, arXiv e-prints, arXiv:1612.05560. https://arxiv.org/abs/1612.05560
- Chandrasekhar (1931) Chandrasekhar, S. 1931, ApJ, 74, 81, doi: 10.1086/143324
- Chen et al. (2011) Chen, J., Singh, B., & Cameron, J. A. 2011, Nuclear Data Sheets, 112, 2357, doi: 10.1016/j.nds.2011.08.005
- Childress et al. (2015) Childress, M. J., Hillier, D. J., Seitenzahl, I., et al. 2015, MNRAS, 454, 3816, doi: 10.1093/mnras/stv2173
- Chomiuk et al. (2012) Chomiuk, L., Soderberg, A. M., Moe, M., et al. 2012, ApJ, 750, 164, doi: 10.1088/0004-637X/750/2/164
- Chomiuk et al. (2016) Chomiuk, L., Soderberg, A. M., Chevalier, R. A., et al. 2016, ApJ, 821, 119, doi: 10.3847/0004-637X/821/2/119
- Colgate & McKee (1969) Colgate, S. A., & McKee, C. 1969, ApJ, 157, 623, doi: 10.1086/150102
- Dean et al. (1998) Dean, D. J., Langanke, K., Chatterjee, L., Radha, P. B., & Strayer, M. R. 1998, Phys. Rev. C, 58, 536, doi: 10.1103/PhysRevC.58.536
- Dessart et al. (2014) Dessart, L., Blondin, S., Hillier, D. J., & Khokhlov, A. 2014, MNRAS, 441, 532, doi: 10.1093/mnras/stu598
- Dessart et al. (2020) Dessart, L., Leonard, D. C., & Prieto, J. L. 2020, A&A, 638, A80, doi: 10.1051/0004-6361/202037854
- Diamond et al. (2015) Diamond, T. R., Hoeflich, P., & Gerardy, C. L. 2015, ApJ, 806, 107, doi: 10.1088/0004-637X/806/1/107
- Dimitriadis et al. (2017) Dimitriadis, G., Sullivan, M., Kerzendorf, W., et al. 2017, MNRAS, 468, 3798, doi: 10.1093/mnras/stx683
- Do et al. (2021) Do, A., Shappee, B. J., De Cuyper, J.-P., et al. 2021, arXiv e-prints, arXiv:2102.07796. https://arxiv.org/abs/2102.07796
- Dolphin (2000) Dolphin, A. E. 2000, PASP, 112, 1383, doi: 10.1086/316630
- Dong et al. (2015) Dong, S., Katz, B., Kushnir, D., & Prieto, J. L. 2015, MNRAS, 454, L61, doi: 10.1093/mnrasl/slv129
- Dubay et al. (2021) Dubay, L. O., Tucker, M. A., Do, A., Shappee, B. J., & Anand, G. S. 2021, arXiv e-prints, arXiv:2104.02086. https://arxiv.org/abs/2104.02086
- Edwards et al. (2012) Edwards, Z. I., Pagnotta, A., & Schaefer, B. E. 2012, ApJ, 747, L19, doi: 10.1088/2041-8205/747/2/L19
- Fausnaugh et al. (2021) Fausnaugh, M. M., Vallely, P. J., Kochanek, C. S., et al. 2021, ApJ, 908, 51, doi: 10.3847/1538-4357/abcd42
- Fink et al. (2007) Fink, M., Hillebrandt, W., & Röpke, F. K. 2007, A&A, 476, 1133, doi: 10.1051/0004-6361:20078438
- Fink et al. (2010) Fink, M., Röpke, F. K., Hillebrandt, W., et al. 2010, A&A, 514, A53, doi: 10.1051/0004-6361/200913892
- Fink et al. (2014) Fink, M., Kromer, M., Seitenzahl, I. R., et al. 2014, MNRAS, 438, 1762, doi: 10.1093/mnras/stt2315
- Flörs et al. (2018) Flörs, A., Spyromilio, J., Maguire, K., et al. 2018, A&A, 620, A200, doi: 10.1051/0004-6361/201833512
- Flörs et al. (2020) Flörs, A., Spyromilio, J., Taubenberger, S., et al. 2020, MNRAS, 491, 2902, doi: 10.1093/mnras/stz3013
- Folatelli et al. (2010) Folatelli, G., Phillips, M. M., Burns, C. R., et al. 2010, AJ, 139, 120, doi: 10.1088/0004-6256/139/1/120
- Fransson & Jerkstrand (2015) Fransson, C., & Jerkstrand, A. 2015, ApJ, 814, L2, doi: 10.1088/2041-8205/814/1/L2
- Fransson & Kozma (1993) Fransson, C., & Kozma, C. 1993, ApJ, 408, L25, doi: 10.1086/186822
- Friesen et al. (2017) Friesen, B., Baron, E., Parrent, J. T., et al. 2017, MNRAS, 467, 2392, doi: 10.1093/mnras/stx241
- Giammichele et al. (2012) Giammichele, N., Bergeron, P., & Dufour, P. 2012, ApJS, 199, 29, doi: 10.1088/0067-0049/199/2/29
- Gilfanov & Bogdán (2010) Gilfanov, M., & Bogdán, Á. 2010, Nature, 463, 924, doi: 10.1038/nature08685
- Goldstein & Kasen (2018) Goldstein, D. A., & Kasen, D. 2018, ApJ, 852, L33, doi: 10.3847/2041-8213/aaa409
- Graham et al. (2015) Graham, M. L., Nugent, P. E., Sullivan, M., et al. 2015, MNRAS, 454, 1948, doi: 10.1093/mnras/stv1888
- Graham et al. (2017) Graham, M. L., Kumar, S., Hosseinzadeh, G., et al. 2017, MNRAS, 472, 3437, doi: 10.1093/mnras/stx2224
- Graham et al. (2019) Graham, M. L., Harris, C. E., Nugent, P. E., et al. 2019, ApJ, 871, 62, doi: 10.3847/1538-4357/aaf41e
- Graur et al. (2014) Graur, O., Maoz, D., & Shara, M. M. 2014, MNRAS, 442, L28, doi: 10.1093/mnrasl/slu052
- Graur et al. (2016) Graur, O., Zurek, D., Shara, M. M., et al. 2016, ApJ, 819, 31, doi: 10.3847/0004-637X/819/1/31
- Graur et al. (2018) Graur, O., Zurek, D. R., Rest, A., et al. 2018, ApJ, 859, 79, doi: 10.3847/1538-4357/aabe25
- Gronow et al. (2020) Gronow, S., Collins, C., Ohlmann, S. T., et al. 2020, A&A, 635, A169, doi: 10.1051/0004-6361/201936494
- Gronow et al. (2021) Gronow, S., Collins, C. E., Sim, S. A., & Röpke, F. K. 2021, A&A, 649, A155, doi: 10.1051/0004-6361/202039954
- Gupta et al. (2021) Gupta, S., Caprioli, D., & Haggerty, C. C. 2021, arXiv e-prints, arXiv:2106.07672. https://arxiv.org/abs/2106.07672
- Harris et al. (2021) Harris, C. E., Chomiuk, L., & Nugent, P. E. 2021, ApJ, 912, 23, doi: 10.3847/1538-4357/abe940
- Hayden et al. (2010) Hayden, B. T., Garnavich, P. M., Kasen, D., et al. 2010, ApJ, 722, 1691, doi: 10.1088/0004-637X/722/2/1691
- Hillebrandt et al. (2013) Hillebrandt, W., Kromer, M., Röpke, F. K., & Ruiter, A. J. 2013, Frontiers of Physics, 8, 116, doi: 10.1007/s11467-013-0303-2
- Hoeflich et al. (2017) Hoeflich, P., Hsiao, E. Y., Ashall, C., et al. 2017, ApJ, 846, 58, doi: 10.3847/1538-4357/aa84b2
- Hoeflich et al. (2019) Hoeflich, P., Ashall, C., Fisher, A., et al. 2019, in Nuclei in the Cosmos XV, Vol. 219, 187–194, doi: 10.1007/978-3-030-13876-9_31
- Hoeflich et al. (2021) Hoeflich, P., Ashall, C., Bose, S., et al. 2021, arXiv e-prints, arXiv:2109.03359. https://arxiv.org/abs/2109.03359
- Horesh et al. (2012) Horesh, A., Kulkarni, S. R., Fox, D. B., et al. 2012, ApJ, 746, 21, doi: 10.1088/0004-637X/746/1/21
- Hosseinzadeh et al. (2017) Hosseinzadeh, G., Sand, D. J., Valenti, S., et al. 2017, ApJ, 845, L11, doi: 10.3847/2041-8213/aa8402
- Hoyle & Fowler (1960) Hoyle, F., & Fowler, W. A. 1960, ApJ, 132, 565, doi: 10.1086/146963
- Hristov et al. (2021) Hristov, B., Hoeflich, P., & Collins, D. C. 2021, arXiv e-prints, arXiv:2106.14589. https://arxiv.org/abs/2106.14589
- Hsiao et al. (2007) Hsiao, E. Y., Conley, A., Howell, D. A., et al. 2007, ApJ, 663, 1187, doi: 10.1086/518232
- Hsiao et al. (2013) Hsiao, E. Y., Marion, G. H., Phillips, M. M., et al. 2013, ApJ, 766, 72, doi: 10.1088/0004-637X/766/2/72
- Iben & Tutukov (1984) Iben, I., J., & Tutukov, A. V. 1984, ApJS, 54, 335, doi: 10.1086/190932
- Iwamoto et al. (1999) Iwamoto, K., Brachwitz, F., Nomoto, K., et al. 1999, ApJS, 125, 439, doi: 10.1086/313278
- Jacobson-Galán et al. (2018) Jacobson-Galán, W. V., Dimitriadis, G., Foley, R. J., & Kilpatrick, C. D. 2018, ApJ, 857, 88, doi: 10.3847/1538-4357/aab716
- Jang & Lee (2017) Jang, I. S., & Lee, M. G. 2017, ApJ, 835, 28, doi: 10.3847/1538-4357/835/1/28
- Jerkstrand et al. (2011) Jerkstrand, A., Fransson, C., & Kozma, C. 2011, A&A, 530, A45, doi: 10.1051/0004-6361/201015937
- Jha et al. (2019) Jha, S. W., Maguire, K., & Sullivan, M. 2019, Nature Astronomy, 3, 706, doi: 10.1038/s41550-019-0858-0
- Johansson et al. (2013) Johansson, J., Amanullah, R., & Goobar, A. 2013, MNRAS, 431, L43, doi: 10.1093/mnrasl/slt005
- Kasen (2010) Kasen, D. 2010, ApJ, 708, 1025, doi: 10.1088/0004-637X/708/2/1025
- Kerzendorf et al. (2018) Kerzendorf, W. E., Strampelli, G., Shen, K. J., et al. 2018, MNRAS, 479, 192, doi: 10.1093/mnras/sty1357
- Kerzendorf et al. (2014) Kerzendorf, W. E., Taubenberger, S., Seitenzahl, I. R., & Ruiter, A. J. 2014, ApJ, 796, L26, doi: 10.1088/2041-8205/796/2/L26
- Kerzendorf et al. (2017) Kerzendorf, W. E., McCully, C., Taubenberger, S., et al. 2017, MNRAS, 472, 2534, doi: 10.1093/mnras/stx1923
- Khokhlov et al. (1997) Khokhlov, A. M., Oran, E. S., & Wheeler, J. C. 1997, ApJ, 478, 678, doi: 10.1086/303815
- Kilpatrick et al. (2018) Kilpatrick, C. D., Coulter, D. A., Dimitriadis, G., et al. 2018, MNRAS, 481, 4123, doi: 10.1093/mnras/sty2503
- Kromer et al. (2013) Kromer, M., Pakmor, R., Taubenberger, S., et al. 2013, ApJ, 778, L18, doi: 10.1088/2041-8205/778/1/L18
- Kromer et al. (2015) Kromer, M., Ohlmann, S. T., Pakmor, R., et al. 2015, MNRAS, 450, 3045, doi: 10.1093/mnras/stv886
- Kundu et al. (2017) Kundu, E., Lundqvist, P., Pérez-Torres, M. A., Herrero-Illana, R., & Alberdi, A. 2017, ApJ, 842, 17, doi: 10.3847/1538-4357/aa704c
- Kushnir & Waxman (2020) Kushnir, D., & Waxman, E. 2020, MNRAS, 493, 5617, doi: 10.1093/mnras/staa690
- Kuuttila et al. (2019) Kuuttila, J., Gilfanov, M., Seitenzahl, I. R., Woods, T. E., & Vogt, F. P. A. 2019, MNRAS, 484, 1317, doi: 10.1093/mnras/stz065
- Langer et al. (2000) Langer, N., Deutschmann, A., Wellstein, S., & Höflich, P. 2000, A&A, 362, 1046. https://arxiv.org/abs/astro-ph/0008444
- Law et al. (2009) Law, N. M., Kulkarni, S. R., Dekany, R. G., et al. 2009, PASP, 121, 1395, doi: 10.1086/648598
- Leonard (2007) Leonard, D. C. 2007, ApJ, 670, 1275, doi: 10.1086/522367
- Lesaffre et al. (2006) Lesaffre, P., Han, Z., Tout, C. A., Podsiadlowski, P., & Martin, R. G. 2006, MNRAS, 368, 187, doi: 10.1111/j.1365-2966.2006.10068.x
- Lesaffre et al. (2005) Lesaffre, P., Podsiadlowski, P., & Tout, C. A. 2005, MNRAS, 356, 131, doi: 10.1111/j.1365-2966.2004.08428.x
- Leung & Nomoto (2018) Leung, S.-C., & Nomoto, K. 2018, ApJ, 861, 143, doi: 10.3847/1538-4357/aac2df
- Li et al. (2011) Li, W., Bloom, J. S., Podsiadlowski, P., et al. 2011, Nature, 480, 348, doi: 10.1038/nature10646
- Liu et al. (2021) Liu, Z.-W., Roepke, F. K., Zeng, Y., & Heger, A. 2021, arXiv e-prints, arXiv:2109.09980. https://arxiv.org/abs/2109.09980
- Liu et al. (2013) Liu, Z.-W., Pakmor, R., Seitenzahl, I. R., et al. 2013, ApJ, 774, 37, doi: 10.1088/0004-637X/774/1/37
- Livne (1990) Livne, E. 1990, ApJ, 354, L53, doi: 10.1086/185721
- Livne & Glasner (1991) Livne, E., & Glasner, A. S. 1991, ApJ, 370, 272, doi: 10.1086/169813
- Lundqvist et al. (2015) Lundqvist, P., Nyholm, A., Taddia, F., et al. 2015, A&A, 577, A39, doi: 10.1051/0004-6361/201525719
- Maguire et al. (2016) Maguire, K., Taubenberger, S., Sullivan, M., & Mazzali, P. A. 2016, MNRAS, 457, 3254, doi: 10.1093/mnras/stv2991
- Maguire et al. (2018) Maguire, K., Sim, S. A., Shingles, L., et al. 2018, MNRAS, 477, 3567, doi: 10.1093/mnras/sty820
- Maoz et al. (2012) Maoz, D., Badenes, C., & Bickerton, S. J. 2012, ApJ, 751, 143, doi: 10.1088/0004-637X/751/2/143
- Maoz et al. (2018) Maoz, D., Hallakoun, N., & Badenes, C. 2018, MNRAS, 476, 2584, doi: 10.1093/mnras/sty339
- Maoz et al. (2014) Maoz, D., Mannucci, F., & Nelemans, G. 2014, ARA&A, 52, 107, doi: 10.1146/annurev-astro-082812-141031
- Margutti et al. (2014) Margutti, R., Parrent, J., Kamble, A., et al. 2014, ApJ, 790, 52, doi: 10.1088/0004-637X/790/1/52
- Margutti et al. (2012) Margutti, R., Soderberg, A. M., Chomiuk, L., et al. 2012, ApJ, 751, 134, doi: 10.1088/0004-637X/751/2/134
- Marietta et al. (2000) Marietta, E., Burrows, A., & Fryxell, B. 2000, ApJS, 128, 615, doi: 10.1086/313392
- Marion et al. (2016) Marion, G. H., Brown, P. J., Vinkó, J., et al. 2016, ApJ, 820, 92, doi: 10.3847/0004-637X/820/2/92
- Matheson et al. (2012) Matheson, T., Joyce, R. R., Allen, L. E., et al. 2012, ApJ, 754, 19, doi: 10.1088/0004-637X/754/1/19
- Mattila et al. (2005) Mattila, S., Lundqvist, P., Sollerman, J., et al. 2005, A&A, 443, 649, doi: 10.1051/0004-6361:20052731
- Mazzali et al. (2011) Mazzali, P. A., Maurer, I., Stritzinger, M., et al. 2011, MNRAS, 416, 881, doi: 10.1111/j.1365-2966.2011.19000.x
- Mazzali et al. (2014) Mazzali, P. A., Sullivan, M., Hachinger, S., et al. 2014, MNRAS, 439, 1959, doi: 10.1093/mnras/stu077
- Mazzali et al. (2015) Mazzali, P. A., Sullivan, M., Filippenko, A. V., et al. 2015, MNRAS, 450, 2631, doi: 10.1093/mnras/stv761
- Mazzali et al. (2020) Mazzali, P. A., Bikmaev, I., Sunyaev, R., et al. 2020, MNRAS, 494, 2809, doi: 10.1093/mnras/staa839
- McClelland et al. (2013) McClelland, C. M., Garnavich, P. M., Milne, P. A., Shappee, B. J., & Pogge, R. W. 2013, ApJ, 767, 119, doi: 10.1088/0004-637X/767/2/119
- Meakin et al. (2009) Meakin, C. A., Seitenzahl, I., Townsley, D., et al. 2009, ApJ, 693, 1188, doi: 10.1088/0004-637X/693/2/1188
- Milne et al. (1999) Milne, P. A., The, L. S., & Leising, M. D. 1999, ApJS, 124, 503, doi: 10.1086/313262
- Milne et al. (2001) —. 2001, ApJ, 559, 1019, doi: 10.1086/322352
- Milne et al. (2017) Milne, P. A., Williams, G. G., Porter, A., et al. 2017, ApJ, 835, 100, doi: 10.3847/1538-4357/835/1/100
- Munari et al. (2013) Munari, U., Henden, A., Belligoli, R., et al. 2013, New A, 20, 30, doi: 10.1016/j.newast.2012.09.003
- Niemeyer & Woosley (1997) Niemeyer, J. C., & Woosley, S. E. 1997, ApJ, 475, 740, doi: 10.1086/303544
- Nomoto (1982) Nomoto, K. 1982, ApJ, 253, 798, doi: 10.1086/159682
- Nomoto & Leung (2018) Nomoto, K., & Leung, S.-C. 2018, Space Sci. Rev., 214, 67, doi: 10.1007/s11214-018-0499-0
- Nouri et al. (2019) Nouri, A. G., Givi, P., & Livescu, D. 2019, Progress in Aerospace Sciences, 108, 156, doi: 10.1016/j.paerosci.2019.04.004
- Nugent et al. (2011) Nugent, P. E., Sullivan, M., Cenko, S. B., et al. 2011, Nature, 480, 344, doi: 10.1038/nature10644
- Ohlmann et al. (2014) Ohlmann, S. T., Kromer, M., Fink, M., et al. 2014, A&A, 572, A57, doi: 10.1051/0004-6361/201423924
- Pakmor et al. (2011) Pakmor, R., Hachinger, S., Röpke, F. K., & Hillebrandt, W. 2011, A&A, 528, A117, doi: 10.1051/0004-6361/201015653
- Pakmor et al. (2010) Pakmor, R., Kromer, M., Röpke, F. K., et al. 2010, Nature, 463, 61, doi: 10.1038/nature08642
- Pala et al. (2020) Pala, A. F., Gänsicke, B. T., Breedt, E., et al. 2020, MNRAS, 494, 3799, doi: 10.1093/mnras/staa764
- Pan et al. (2012a) Pan, K.-C., Ricker, P. M., & Taam, R. E. 2012a, ApJ, 750, 151, doi: 10.1088/0004-637X/750/2/151
- Pan et al. (2012b) —. 2012b, ApJ, 760, 21, doi: 10.1088/0004-637X/760/1/21
- Pan et al. (2013) —. 2013, ApJ, 773, 49, doi: 10.1088/0004-637X/773/1/49
- Panagia et al. (2006) Panagia, N., Van Dyk, S. D., Weiler, K. W., et al. 2006, ApJ, 646, 369, doi: 10.1086/504710
- Pankey (1962) Pankey, Titus, J. 1962, PhD thesis, HOWARD UNIVERSITY.
- Papish & Perets (2016) Papish, O., & Perets, H. B. 2016, ApJ, 822, 19, doi: 10.3847/0004-637X/822/1/19
- Parrent et al. (2012) Parrent, J. T., Howell, D. A., Friesen, B., et al. 2012, ApJ, 752, L26, doi: 10.1088/2041-8205/752/2/L26
- Patat et al. (2013) Patat, F., Cordiner, M. A., Cox, N. L. J., et al. 2013, A&A, 549, A62, doi: 10.1051/0004-6361/201118556
- Pereira et al. (2013) Pereira, R., Thomas, R. C., Aldering, G., et al. 2013, A&A, 554, A27, doi: 10.1051/0004-6361/201221008
- Perlmutter et al. (1999) Perlmutter, S., Aldering, G., Goldhaber, G., et al. 1999, ApJ, 517, 565, doi: 10.1086/307221
- Piersanti et al. (2022) Piersanti, L., Bravo, E., Straniero, O., Cristallo, S., & Domínguez, I. 2022, ApJ, 926, 103, doi: 10.3847/1538-4357/ac403b
- Piersanti et al. (2003) Piersanti, L., Gagliardi, S., Iben, Icko, J., & Tornambé, A. 2003, ApJ, 598, 1229, doi: 10.1086/378952
- Plewa (2007) Plewa, T. 2007, ApJ, 657, 942, doi: 10.1086/511412
- Plewa et al. (2004) Plewa, T., Calder, A. C., & Lamb, D. Q. 2004, ApJ, 612, L37, doi: 10.1086/424036
- Podsiadlowski (2003) Podsiadlowski, P. 2003, arXiv e-prints, astro. https://arxiv.org/abs/astro-ph/0303660
- Polin et al. (2019) Polin, A., Nugent, P., & Kasen, D. 2019, ApJ, 873, 84, doi: 10.3847/1538-4357/aafb6a
- Riess et al. (1998) Riess, A. G., Filippenko, A. V., Challis, P., et al. 1998, AJ, 116, 1009, doi: 10.1086/300499
- Röpke & Sim (2018) Röpke, F. K., & Sim, S. A. 2018, Space Sci. Rev., 214, 72, doi: 10.1007/s11214-018-0503-8
- Röpke et al. (2012) Röpke, F. K., Kromer, M., Seitenzahl, I. R., et al. 2012, ApJ, 750, L19, doi: 10.1088/2041-8205/750/1/L19
- Rosswog et al. (2009) Rosswog, S., Kasen, D., Guillochon, J., & Ramirez-Ruiz, E. 2009, ApJ, 705, L128, doi: 10.1088/0004-637X/705/2/L128
- Russell & Immler (2012) Russell, B. R., & Immler, S. 2012, ApJ, 748, L29, doi: 10.1088/2041-8205/748/2/L29
- Sand et al. (2018) Sand, D. J., Graham, M. L., Botyánszki, J., et al. 2018, ApJ, 863, 24, doi: 10.3847/1538-4357/aacde8
- Sand et al. (2021) Sand, D. J., Sarbadhicary, S. K., Pellegrino, C., et al. 2021, arXiv e-prints, arXiv:2108.11407. https://arxiv.org/abs/2108.11407
- Scalzo et al. (2014) Scalzo, R., Aldering, G., Antilogus, P., et al. 2014, MNRAS, 440, 1498, doi: 10.1093/mnras/stu350
- Schaefer & Pagnotta (2012) Schaefer, B. E., & Pagnotta, A. 2012, Nature, 481, 164, doi: 10.1038/nature10692
- Schlafly & Finkbeiner (2011) Schlafly, E. F., & Finkbeiner, D. P. 2011, ApJ, 737, 103, doi: 10.1088/0004-637X/737/2/103
- Schwarz et al. (2011) Schwarz, G. J., Ness, J.-U., Osborne, J. P., et al. 2011, ApJS, 197, 31, doi: 10.1088/0067-0049/197/2/31
- Seitenzahl et al. (2009) Seitenzahl, I. R., Taubenberger, S., & Sim, S. A. 2009, MNRAS, 400, 531, doi: 10.1111/j.1365-2966.2009.15478.x
- Seitenzahl et al. (2014) Seitenzahl, I. R., Timmes, F. X., & Magkotsios, G. 2014, ApJ, 792, 10, doi: 10.1088/0004-637X/792/1/10
- Seitenzahl & Townsley (2017) Seitenzahl, I. R., & Townsley, D. M. 2017, Nucleosynthesis in Thermonuclear Supernovae, ed. A. W. Alsabti & P. Murdin, 1955, doi: 10.1007/978-3-319-21846-5_87
- Seitenzahl et al. (2013) Seitenzahl, I. R., Ciaraldi-Schoolmann, F., Röpke, F. K., et al. 2013, MNRAS, 429, 1156, doi: 10.1093/mnras/sts402
- Seitenzahl et al. (2015) Seitenzahl, I. R., Summa, A., Krauß, F., et al. 2015, MNRAS, 447, 1484, doi: 10.1093/mnras/stu2537
- Seitenzahl et al. (2016) Seitenzahl, I. R., Kromer, M., Ohlmann, S. T., et al. 2016, A&A, 592, A57, doi: 10.1051/0004-6361/201527251
- Shappee et al. (2013a) Shappee, B. J., Kochanek, C. S., & Stanek, K. Z. 2013a, ApJ, 765, 150, doi: 10.1088/0004-637X/765/2/150
- Shappee et al. (2018) Shappee, B. J., Piro, A. L., Stanek, K. Z., et al. 2018, ApJ, 855, 6, doi: 10.3847/1538-4357/aaa1e9
- Shappee & Stanek (2011) Shappee, B. J., & Stanek, K. Z. 2011, ApJ, 733, 124, doi: 10.1088/0004-637X/733/2/124
- Shappee et al. (2017) Shappee, B. J., Stanek, K. Z., Kochanek, C. S., & Garnavich, P. M. 2017, ApJ, 841, 48, doi: 10.3847/1538-4357/aa6eab
- Shappee et al. (2013b) Shappee, B. J., Stanek, K. Z., Pogge, R. W., & Garnavich, P. M. 2013b, ApJ, 762, L5, doi: 10.1088/2041-8205/762/1/L5
- Shen & Bildsten (2014) Shen, K. J., & Bildsten, L. 2014, ApJ, 785, 61, doi: 10.1088/0004-637X/785/1/61
- Shen et al. (2021) Shen, K. J., Blondin, S., Kasen, D., et al. 2021, ApJ, 909, L18, doi: 10.3847/2041-8213/abe69b
- Shen et al. (2018) Shen, K. J., Kasen, D., Miles, B. J., & Townsley, D. M. 2018, ApJ, 854, 52, doi: 10.3847/1538-4357/aaa8de
- Silverman et al. (2013) Silverman, J. M., Nugent, P. E., Gal-Yam, A., et al. 2013, ApJS, 207, 3, doi: 10.1088/0067-0049/207/1/3
- Sim et al. (2010) Sim, S. A., Röpke, F. K., Hillebrandt, W., et al. 2010, ApJ, 714, L52, doi: 10.1088/2041-8205/714/1/L52
- Sollerman et al. (2004) Sollerman, J., Lindahl, J., Kozma, C., et al. 2004, A&A, 428, 555, doi: 10.1051/0004-6361:20041320
- Stritzinger & Sollerman (2007) Stritzinger, M., & Sollerman, J. 2007, A&A, 470, L1, doi: 10.1051/0004-6361:20066999
- Taubenberger et al. (2013) Taubenberger, S., Kromer, M., Pakmor, R., et al. 2013, ApJ, 775, L43, doi: 10.1088/2041-8205/775/2/L43
- Taubenberger et al. (2015) Taubenberger, S., Elias-Rosa, N., Kerzendorf, W. E., et al. 2015, MNRAS, 448, L48, doi: 10.1093/mnrasl/slu201
- Tonry et al. (2018) Tonry, J. L., Denneau, L., Heinze, A. N., et al. 2018, PASP, 130, 064505, doi: 10.1088/1538-3873/aabadf
- Townsley et al. (2007) Townsley, D. M., Calder, A. C., Asida, S. M., et al. 2007, ApJ, 668, 1118, doi: 10.1086/521013
- Townsley et al. (2019) Townsley, D. M., Miles, B. J., Shen, K. J., & Kasen, D. 2019, ApJ, 878, L38, doi: 10.3847/2041-8213/ab27cd
- Travaglio et al. (2005) Travaglio, C., Hillebrandt, W., & Reinecke, M. 2005, A&A, 443, 1007, doi: 10.1051/0004-6361:20052883
- Travaglio et al. (2004) Travaglio, C., Hillebrandt, W., Reinecke, M., & Thielemann, F. K. 2004, A&A, 425, 1029, doi: 10.1051/0004-6361:20041108
- Truran et al. (1967) Truran, J. W., Arnett, W. D., & Cameron, A. G. W. 1967, Canadian Journal of Physics, 45, 2315, doi: 10.1139/p67-184
- Tsvetkov et al. (2013) Tsvetkov, D. Y., Shugarov, S. Y., Volkov, I. M., et al. 2013, Contributions of the Astronomical Observatory Skalnate Pleso, 43, 94. https://arxiv.org/abs/1311.3484
- Tucker et al. (2022) Tucker, M. A., Ashall, C., Shappee, B. J., et al. 2022, ApJ, 926, L25, doi: 10.3847/2041-8213/ac4fbd
- Tucker et al. (2019) Tucker, M. A., Shappee, B. J., & Wisniewski, J. P. 2019, ApJ, 872, L22, doi: 10.3847/2041-8213/ab0286
- Tucker et al. (2020) Tucker, M. A., Shappee, B. J., Vallely, P. J., et al. 2020, MNRAS, 493, 1044, doi: 10.1093/mnras/stz3390
- Tully et al. (2016) Tully, R. B., Courtois, H. M., & Sorce, J. G. 2016, AJ, 152, 50, doi: 10.3847/0004-6256/152/2/50
- Tutukov & Yungelson (1979) Tutukov, A. V., & Yungelson, L. R. 1979, Acta Astron., 29, 665
- Vallely et al. (2020) Vallely, P. J., Tucker, M. A., Shappee, B. J., et al. 2020, MNRAS, 492, 3553, doi: 10.1093/mnras/staa003
- van Rossum et al. (2016) van Rossum, D. R., Kashyap, R., Fisher, R., et al. 2016, ApJ, 827, 128, doi: 10.3847/0004-637X/827/2/128
- Webbink (1984) Webbink, R. F. 1984, ApJ, 277, 355, doi: 10.1086/161701
- Wheeler et al. (1975) Wheeler, J. C., Lecar, M., & McKee, C. F. 1975, ApJ, 200, 145, doi: 10.1086/153771
- Whelan & Iben (1973) Whelan, J., & Iben, Icko, J. 1973, ApJ, 186, 1007, doi: 10.1086/152565
- Wilk et al. (2020) Wilk, K. D., Hillier, D. J., & Dessart, L. 2020, MNRAS, 494, 2221, doi: 10.1093/mnras/staa640
- Woods et al. (2017) Woods, T. E., Ghavamian, P., Badenes, C., & Gilfanov, M. 2017, Nature Astronomy, 1, 800, doi: 10.1038/s41550-017-0263-5
- Woods et al. (2018) —. 2018, ApJ, 863, 120, doi: 10.3847/1538-4357/aad1ee
- Woosley & Kasen (2011) Woosley, S. E., & Kasen, D. 2011, ApJ, 734, 38, doi: 10.1088/0004-637X/734/1/38
- Wu et al. (2019) Wu, C., Wang, B., & Liu, D. 2019, MNRAS, 483, 263, doi: 10.1093/mnras/sty3176
- Yang et al. (2018) Yang, Y., Wang, L., Baade, D., et al. 2018, ApJ, 852, 89, doi: 10.3847/1538-4357/aa9e4c
- Yoon & Langer (2003) Yoon, S. C., & Langer, N. 2003, A&A, 412, L53, doi: 10.1051/0004-6361:20034607
- Zhang et al. (2016) Zhang, K., Wang, X., Zhang, J., et al. 2016, ApJ, 820, 67, doi: 10.3847/0004-637X/820/1/67