Pressure-induced metal-insulator transition in oxygen-deficient LiNbO3-type ferroelectrics
Abstract
Hydrostatic pressure and oxygen vacancies usually have deleterious effects on ferroelectric materials because both tend to reduce their polarization. In this work we use first-principles calculations to study an important class of ferroelectric materials – LiNbO3-type ferroelectrics (LiNbO3 as the prototype), and find that in oxygen-deficient LiNbO3-δ, hydrostatic pressure induces an unexpected metal-insulator transition between 8 and 9 GPa. Our calculations also find that strong polar displacements persist in both metallic and insulating oxygen-deficient LiNbO3-δ and the size of polar displacements is comparable to pristine LiNbO3 under the same pressure. These properties are distinct from widely used perovskite ferroelectric oxide BaTiO3, whose polarization is quickly suppressed by hydrostatic pressure and/or oxygen vacancies. The anomalous pressure-driven metal-insulator transition in oxygen-deficient LiNbO3-δ arises from the change of an oxygen vacancy defect state. Hydrostatic pressure increases the polar displacements of oxygen-deficient LiNbO3-δ, which reduces the band width of the defect state and eventually turns it into an in-gap state. In the insulating phase, the in-gap state is further pushed away from the conduction band edge under hydrostatic pressure, which increases the fundamental gap. Our work shows that for LiNbO3-type strong ferroelectrics, oxygen vacancies and hydrostatic pressure combined can lead to new phenomena and potential functions, in contrast to the harmful effects occurring to perovskite ferroelectric oxides such as BaTiO3.
pacs:
Valid PACS appear hereI Introduction
Ferroelectricity is one of the most important functional properties of transition metal oxides Cohen (1992); Goto et al. (2004). Two classes of transition metal oxides: perovskite oxides (BaTiO3 as the prototype) and small -site LiNbO3-type oxides (LiNbO3 as the prototype) both exhibit robust ferroelectric polarization above room temperature Inbar and Cohen (1996); Smith et al. (2008); Inaguma et al. (2008); Shi et al. (2013), promising potential applications in ferroelectric-based electronic devices. The origin of ferroelectricity in BaTiO3 arises from the hybridization between Ti- and O- states, which leads to a second-order Jahn-Teller distortion (SOJT) Bersuker (1966); Bersuker and Vekhter (1978); Burdett (1981). SOJT weakens the short-range repulsive forces that favor the non-polar structure and allows the long-range Coulombic forces to dominate, so that a polar structure is stabilized in BaTiO3 Cohen (1992); Bersuker (2013). On the other hand, ferroelectricity in LiNbO3 originates from a geometric mechanism rather than charge transfer or hybridization Ederer and Spaldin (2006); Benedek and Fennie (2013). The very small Li ion size (thus a tolerance factor ) leads to a combined structural distortions of NbO6 octahedral rotation and a Li polar displacement, which altogether optimize the Li-O bond length Navrotsky (1998); Benedek and Birol (2016). For BaTiO3, it is known that either hydrostatic (positive) pressure Bousquet and Ghosez (2006); Wang et al. (2010) or (charge neutral) oxygen vacancies Jeong et al. (2011); Choi et al. (2011); Kolodiazhnyi (2008); Hwang et al. (2010); Kolodiazhnyi et al. (2010) can reduce its polarization, thereby limiting its applications under those unfavorable conditions Wang et al. (2012); Hickox-Young et al. (2020); Michel et al. (2021); Ma et al. (2021). Therefore it is interesting to explore how LiNbO3 responds to oxygen vacancies and/or hydrostatic pressure. In our previous study, we carefully compare oxygen-deficient BaTiO3-δ and LiNbO3-δ under ambient pressure Xia et al. (2019). We find that in BaTiO3-δ, the itinerant electrons doped by oxygen vacancies are uniformly distributed, but in LiNbO3-δ, the distribution of itinerant electrons is highly inhomogeneous.
In this work, we extend our study to hydrostatic pressure effects on oxygen-deficient BaTiO3-δ and LiNbO3-δ. We find a more striking distinction between these two representative ferroelectric materials. For BaTiO3, since either charge neutral oxygen vacancies or hydrostatic pressure tends to suppress its ferroelectric property, when these two factors are combined, expectedly it yields a more unfavorable condition for sustaining its polarization. Our first-principles calculations find that in oxygen-deficient BaTiO3-δ, hydrostatic pressure can completely suppress its polarization and drive it into a paraelectric state. However, for LiNbO3, in the presence of both charge neutral oxygen vacancies and external hydrostatic pressure, our calculations find an unexpected pressure-driven metal-insulator transition between 8 and 9 GPa, in a wide range of oxygen vacancy concentrations. The transition arises from the change of an oxygen vacancy defect state in oxygen-deficient LiNbO3-δ, which is mainly composed of Nb- orbitals. Applying a hydrostatic pressure increases the Nb-O polar displacements in LiNbO3-δ, due to a cooperative coupling between octahedral rotations and polarity Gu et al. (2018). This in turn reduces the band width of the defect state. When the applied pressure makes the band width of oxygen vacancy defect state sufficiently narrow in oxygen-deficient LiNbO3-δ, the defect state splits off the conduction bands and becomes an in-gap state, and thus the itinerant electrons get trapped around the oxygen vacancy and a metal-insulator transition occurs. Our calculations also find that in both metallic and insulating oxygen-deficient LiNbO3-δ, their polar displacements are comparable in magnitude to pristine LiNbO3 under the same pressure. These robust polar properties imply that LiNbO3-based ferroelectric materials can have a wider range of applications, especially when they are under various conditions that are unfavorable to perovskite ferroelectrics such as BaTiO3.
II Computational details
We perform density functional theory (DFT) calculations Hohenberg and Kohn (1964); Kohn and Sham (1965), as implemented in Vienna Ab-initio Simulation Package (VASP) Payne et al. (1992); Kresse and Furthmüller (1996). We use an energy cutoff of 600 eV. Charge self-consistent calculations are converged to 10-5 eV. Both cell and internal coordinates are fully relaxed until each force component is smaller than 10 meV/Å and stress tensor is smaller than 1 kbar. For the exchange-correlation functional, we use local spin density approximation (LSDA) Ceperley and Alder (1980). However, we do not find magnetization in either pristine BaTiO3/LiNbO3 or oxygen-deficient BaTiO3-δ/LiNbO3-δ (see Appendix A). Therefore we sum over both spins in the calculation of density of states. For pristine bulk calculations, we use a tetragonal cell (5-atom) with a Monkhorst-Pack k-point sampling of to study BaTiO3 and find that = 3.94 Å and = 1.01; we use a hexagonal cell (30-atom) with a Monkhorst-Pack k-point sampling of to study LiNbO3 and find that = 5.09 Å and = 13.80 Å. Both of them are in good agreement with the previous studies Zhang et al. (2017). Bulk polarization is calculated using Berry phase method Resta (1994); Resta and Vanderbilt (2007); Spaldin (2012). To study charge neutral oxygen vacancies, we use supercell calculations. For oxygen-deficient BaTiO3-δ, we start from the structure of pristine BaTiO3 and remove one charge neutral oxygen atom. There are two inequivalent Wyckoff positions for oxygen atoms in the structure Evarestov and Bandura (2012). We find similar results when oxygen vacancy is induced in either position. For oxygen-deficient LiNbO3-δ, we start from the structure of pristine LiNbO3 and remove one charge neutral oxygen atom. There is only one Wyckoff position for oxygen atoms in the LiNbO3, i.e. all the oxygen atom positions are equivalent Lee et al. (2010). To simulate different oxygen vacancy concentrations, we use supercells of different sizes in which we remove one charge neutral oxygen vacancy. In the supercell calculations, we turn off all symmetries and fully relax the structure (both lattice constants and internal coordinates) to accommodate possible oxygen octahedral distortions and obtain the ground state property. We use a Monkhorst-Pack k-point sampling of in supercell calculations. For the main results, we use a 59-atom supercell for BaTiO3-δ and LiNbO3-δ to simulate an oxygen vacancy concentration of . We also use a 79-atom, 119-atom and 179-atom supercell of LiNbO3-δ to simulate a wide range of oxygen vacancy concentrations ( and ) and test the robustness of our key results. We also use a higher energy cutoff (750 eV) and a denser k-point sampling to test the key results and we do not find any qualitative difference.
III Results
For completeness and benchmarking, we first study hydrostatic pressure effects on pristine BaTiO3 and LiNbO3. Then we compare oxygen-deficient BaTiO3-δ and LiNbO3-δ under hydrostatic pressure, and carefully study the pressure-driven metal-insulator transition in oxygen-deficient LiNbO3-δ.
III.1 Pressure effects on pristine BaTiO3 and LiNbO3
We summarize the hydrostatic pressure effects on pristine BaTiO3 and LiNbO3 in Fig. 1. In both BaTiO3 and LiNbO3, the transition metal atoms (Ti and Nb) are in an oxygen octahedron and thus the crystal field splitting removes the orbital degeneracy and separates the orbitals into two energy groups Streltsov et al. (2005). The group with the lower (higher) energy is called () states. We focus on states for conciseness (we find similar results for states). Panel a shows the band widths of Ti- and Nb- states as a function of applied hydrostatic pressure (the electronic band structures of pristine BaTiO3 and LiNbO3 under a representative hydrostatic pressure are shown in Appendix B). Pressure naturally decreases the volumes of BaTiO3 and LiNbO3 (see panel b), which increases the hopping between Ti-/Nb- orbitals and O- orbitals. As expected, the band width of both Ti- and Nb- states increases under hydrostatic pressure. However, as panel a shows, the band width of Nb- states increases much more slowly than that of Ti- states. To understand that, we compare the polar displacements (the definition of polar displacements in BaTiO3 and LiNbO3 can be found in Appendix C) and the polarization of BaTiO3 and LiNbO3 under hydrostatic pressure (panels c and d). Our calculations find that hydrostatic pressure reduces the polar displacements and polarization of BaTiO3 and completely suppresses them above a critical value, due to the destabilization of short-range interaction at high pressure Bousquet and Ghosez (2006). By contrast, our calculations find that hydrostatic pressure increases the polar displacements and polarization of LiNbO3, due to a cooperative coupling between octahedral rotations and polarity Gu et al. (2018). Similar results have been obtained in ferroelectric ZnSnO3 Gu et al. (2018) and polar metal LiOsO3 Paredes Aulestia et al. (2018). This means that in LiNbO3, there are two competing forces: the overall volume reduction facilitates hopping, but the increased polar displacements make hopping more difficult; while in BaTiO3, both volume reduction and weakened polar displacements help increase hopping. Since band width is proportional to hopping, this explains why the band width of Nb- bands increases much more slowly than that of Ti- bands under hydrostatic pressure.
III.2 Pressure effects on oxygen-deficient BaTiO3-δ and LiNbO3-δ
Next we study hydrostatic pressure effects on oxygen-deficient BaTiO3-δ and oxygen-deficient LiNbO3-δ and show that under pressure the electronic structure of these two materials behaves much more differently than pristine ones. Charge neutral oxygen vacancies are a common defect in complex oxides Qi et al. (2011); Lin et al. (2012); Aschauer et al. (2013); Zhou et al. (2021); Freysoldt et al. (2014), which are electron donors and induce defect states that are close to conduction band edge Janotti et al. (2014); Sarkar and Khan (2019); Gunkel et al. (2020). If the band width of the defect states is large enough so that the Fermi level cuts through both defect bands and conduction bands, then the system is conducting and the doped electrons are itinerant.
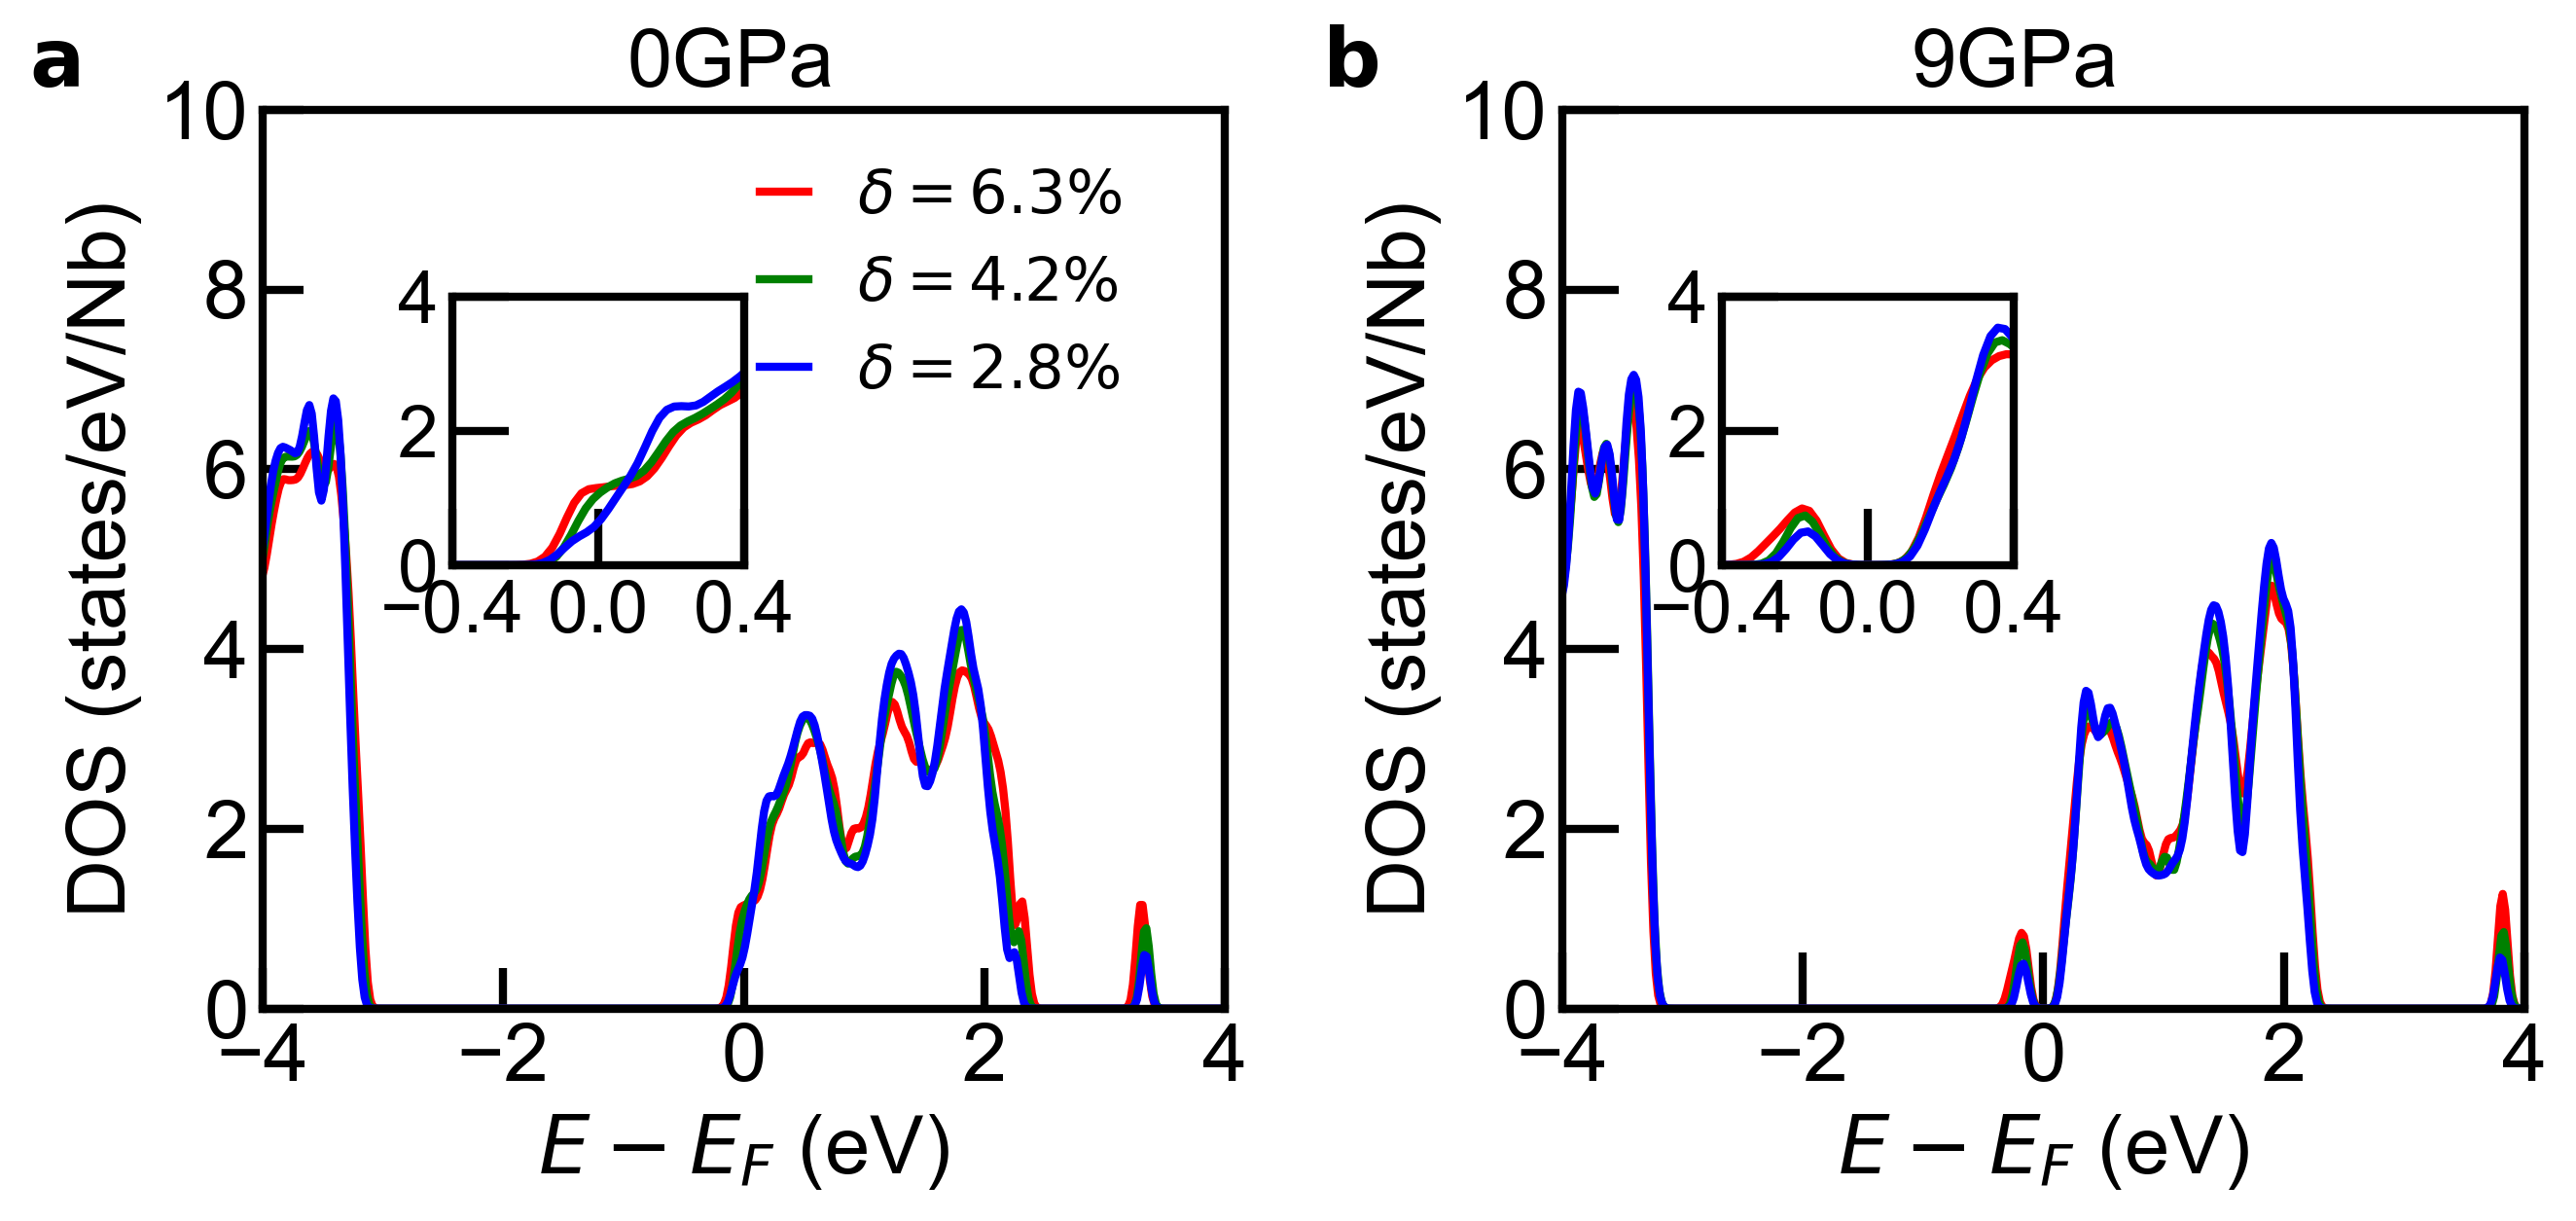
Fig. 2 shows the density of states (DOS) of oxygen-deficient BaTiO3-δ and LiNbO3-δ (with ) as a function of applied hydrostatic pressure. We find that under hydrostatic pressure, oxygen-deficient BaTiO3-δ is conducting and its DOS almost does not change under increasing pressure (panels a, b, c). By contrast, our calculations find that LiNbO3-δ undergoes a metal-insulator transition. When the applied hydrostatic pressure is smaller than 8 GPa, LiNbO3-δ is conducting; and above 8 GPa, a small gap is opened in the electronic structure of LiNbO3-δ and the gap is further increased with pressure (see the insets of panels e and f). For pristine materials, this pressure-driven metal-insulator transition is rare, because pressure generically decreases volume and usually closes gap and makes materials more conducting.
To understand the origin of this pressure-driven metal-insulator transition, we study polar displacements (the definition of polar displacements in BaTiO3-δ and LiNbO3-δ is also found in Appendix C) and band structure of oxygen-deficient LiNbO3-δ and compare them to those of oxygen-deficient BaTiO3-δ (with ). Fig. 3a shows the site-resolved Ti-O polar displacements in BaTiO3-δ under hydrostatic pressure. Different from pristine BaTiO3, each oxygen vacancy donates two mobile electrons, which already suppress the average Ti-O polar displacements under ambient pressure. Applying a hydrostatic pressure does not affect the Ti-O polar displacements. Fig. 3b shows the electronic band structure of oxygen-deficient BaTiO3-δ. The lowest band that crosses the Fermi level is an oxygen vacancy defect state. Applying a hydrostatic pressure only slightly increases the band width of the defect state and has little effect on the overall electronic structure. Fig. 3c and d show the site-resolved Li-O and Nb-O polar displacements in oxygen-deficient LiNbO3-δ under hydrostatic pressure. The red (blue) squares in Fig. 3c and d refer to the polar displacements in the conducting (insulating) LiNbO3-δ. In the inset of panel d, we compare the average Li-O and Nb-O polar displacements between oxygen-deficient LiNbO3-δ and pristine LiNbO3 under hydrostatic pressure. We find that similar to pristine LiNbO3 (see Fig. 1), hydrostatic pressure increases the polar displacements of oxygen-deficient LiNbO3-δ. In particular, the Nb atom and the Li atom that are closest to the oxygen vacancy have the most substantial increase in the polar displacement. However, different from pristine LiNbO3, there is a sudden “jump” in the polar displacements between 7 and 8 GPa, which is evident in the inset of panel d. For a given hydrostatic pressure, the average polar displacements of conducting oxygen-deficient LiNbO3-δ are slightly smaller than those of pristine LiNbO3. This is because mobile electrons in conducting LiNbO3-δ can screen internal electric fields and suppress the polar displacements Xia et al. (2019). However, in insulating LiNbO3-δ, the average polar displacements are almost the same as those of pristine LiNbO3 because screening from mobile electrons is absent.
Accompanying this sudden “jump” in the polar displacements is a metal-insulator transition. Fig. 3e and f show the electronic band structures of conducting and insulating oxygen-deficient LiNbO3-δ, respectively. In conducting LiNbO3-δ, the band width of the defect state is reduced by hydrostatic pressure, which is in contrast to pristine LiNbO3 and BaTiO3 in which hydrostatic pressure always increases their band width. This anomalous pressure effect is because the defect state is closely related to Nb #6, which is the nearest neighbor of the oxygen vacancy. The substantially increased polar displacement of Nb #6 makes the electron hopping much more difficult, which overweighs the volume reduction from hydrostatic pressure. In insulating LiNbO3-δ, the defect state becomes an in-gap state. Similar to defects in semiconductors, hydrostatic pressure increases the repulsion between conduction band edge and in-gap states, which further increases the fundamental band gap of oxygen-deficient LiNbO3-δ (i.e. the gap between the conduction band edge and the defect state) Ren et al. (1982); Robertson (2003); Lany and Zunger (2008); Svane et al. (2006); Huang et al. (2015).
Next we study how hydrostatic pressure changes the spatial distribution of doped electrons in oxygen-deficient BaTiO3-δ and oxygen-deficient LiNbO3-δ. Each oxygen vacancy donates two electrons and they occupy the defect state and conduction bands, which are mainly composed of Ti- or Nb- states. Fig. 4 shows the spatial distribution of doped electrons and the number of doped electrons on each Ti and Nb atoms in oxygen-deficient BaTiO3-δ and LiNbO3-δ (with ). Oxygen-deficient BaTiO3-δ is always conducting and the doped electrons are almost homogeneously distributed, as is shown explicitly in Fig. 4a and b. Hydrostatic pressure makes the electron distribution even more homogeneous in BaTiO3-δ (see Fig. 4c). However, in oxygen-deficient LiNbO3-δ, the distribution of doped electrons is highly inhomogeneous Xia et al. (2019). As we showed previously in Fig. 3, hydrostatic pressure increases the polar displacements of LiNbO3-δ and narrows the band width of the defect state, which means the reduction of electron hopping. Correspondingly, the doped electrons tend to be localized in real space. From ambient pressure to 7 GPa, the doped electrons are distributed on all Nb sites (see Fig. 4d). However, under a hydrostatic pressure of 8 GPa that is just above the critical pressure, most doped electrons are concentrated in the void space between Nb #6 and Nb #12, which are the two nearest neighbors of the oxygen vacancy (see Fig. 4e). Such a localization effect can be more clearly seen from the two peaks in the Nb site-resolved electron distribution, shown in Fig. 4f. In oxygen-deficient LiNbO3-δ, applying hydrostatic pressure localizes itinerant electrons and leads to a metal-insulator transition, in stark contrast to oxygen-deficient BaTiO3-δ. We note that the localized carriers in the insulating LiNbO3-δ (Fig. 4e) correspond to two electrons that are donated by an oxygen vacancy. These two electrons completely fill the defect band (see Fig. 3f) and thus spin up and spin down channels have equal occupancy. Therefore, no local magnetic moment emerges from this charge localization. Our case is different from a recent work on doped BaTiO3 under epitaxial strain Xu et al. (2019) in which one electron half-fills a band and occupies a single spin channel. Correlation effects localize the lone electron and a magnetic polaron state is formed Mott (1949).
So far, we have only studied one concentration of oxygen vacancy . In Fig. 5 we study different oxygen vacancy concentrations in oxygen-deficient LiNbO3-δ. We find that the pressure-driven metal-insulator transition occurs in a wide range of vacancy concentrations. In addition to (59-atom cell), we also calculate (79-atom cell), (119-atom) and (179-atom cell). In all three cases, under ambient pressure, LiNbO3-δ is conducting (Fig. 5a) while under a hydrostatic pressure of 9 GPa, LiNbO3-δ becomes insulating with the defect state turning into an in-gap state and lying below the conduction bands (Fig. 5b). The critical pressure weakly depends on vacancy concentration, which ranges between 8 and 9 GPa for oxygen-deficient LiNbO3-δ.
Finally, we make two comments. One is that the pressure-driven metal-insulator transition in our study is fundamentally different from the pressure-driven insulator-to-metal transition in correlated materials Kuneš et al. (2008); Kuneš et al. (2009); Shorikov et al. (2015); Huang et al. (2017). In the former, high pressure stabilizes an insulating state in oxygen-deficient LiNbO3-δ; while in the latter, increasing pressure closes the Mott gap and leads to a metallic state. The pressure-driven insulator-to-metal transition in correlated materials is usually strongly first-order, accompanied by abrupt reduction in volume and/or collapse of local magnetic moment Yoo et al. (2005); Greenberg et al. (2018); Leonov et al. (2020). By contrast, the pressure-driven metal-insulator transition in our study is associated with a defect band, which is fully occupied when the fundamental gap is opened. As we mentioned above, since the defect band is fully occupied (in both spin up and spin down channels), no local magnetic moment is found in our calculations and correlation effects play a minor role. The second comment is the connection between our results and available experimental data.Oxygen vacancies have been widely found in important ferroelectric oxides, such as BaTiO3 Qiao et al. (2015), PbTiO3 Nishida et al. (2013), (Pb1-xBax)(Zr0.95Ti0.05)O3 Zhang et al. (2014); Glinchuk et al. (2018), KNbO3 Singh et al. (2010), LiNbO3 Banerjee et al. (2012), HfO2 Starschich et al. (2016); Strand et al. (2018), and amorphous Al2O3 Peng et al. (2020). The presence of oxygen vacancies can substantially change the structural, dielectric, and transport properties of ferroelectrics Wang et al. (2012); Ma et al. (2021), such as the reduction of polarization Islamov et al. (2020); Peng et al. (2021) and the emergence of conduction Singh et al. (2010); Zhang et al. (2014). Sometimes combining oxygen vacancies and polar structure in ferroelectrics can also lead to new functions Noguchi et al. (2019); Peng et al. (2020); Yu et al. (2021). Most pertinent to the current study are oxygen-deficient BaTiO3-δ and LiNbO3-δ. Oxygen vacancies in BaTiO3 have been observed and studied in a few experiments Kolodiazhnyi (2008); Hwang et al. (2010); Kolodiazhnyi et al. (2010). The theoretical results in the current study are qualitatively consistent with the experiments in that 1) conduction appears in BaTiO3-δ due to oxygen vacancies Kolodiazhnyi (2008); Hwang et al. (2010); 2) Ti-O polar displacements are reduced by itinerant electrons and are completely suppressed above a critical electron concentration of cm-3 Kolodiazhnyi et al. (2010). For LiNbO3, various types of defects such as Li-vacancies, O-vacancies, Li-Nb antisite defects, etc. are found in experiments Bredikhin et al. (2000); Lu et al. (2003); Karapetyan et al. (2006); Lengyel et al. (2015). In particular, oxygen-deficient LiNbO3-δ in nanocrystallites and single crystals have been reported in several experiments Díaz-Moreno et al. (2014); Manikandan et al. (2015); Díaz-Moreno et al. (2012); Wang et al. (2019), but high-pressure study has not been performed. We hope that our theoretical study may stimulate further experiments on oxygen-deficient LiNbO3-δ under hydrostatic pressure.
IV Conclusion
In summary, we compare the pressure effects on two important and representative ferroelectric oxides BaTiO3 and LiNbO3 in the pristine form and in a defective form with oxygen vacancies. In pristine BaTiO3, hydrostatic pressure reduces the polar displacements and increases the band width of Ti- states. In oxygen-deficient BaTiO3-δ, pressure makes the doped electrons more homogeneously distributed. Both phenomena are within expectation. By contrast, in both pristineLiNbO3 and oxygen-deficient LiNbO3-δ, pressure increases their polar displacements. More strikingly, in oxygen-deficient LiNbO3-δ, we find an unexpected pressure-driven metal-insulator transition. The anomalous transition arises from the fact that the substantially increased polar displacements in oxygen-deficient LiNbO3-δ under hydrostatic pressure reduce the overlap between Nb- and O- orbitals and thus decrease the band width of the defect state. When the band width of the defect state is sufficiently narrow, it turns into an in-gap state and the system becomes insulating with itinerant electrons trapped around the oxygen vacancy. This pressure-driven metal-insulator transition occurs to oxygen-deficient LiNbO3-δ in a wide range of oxygen vacancy concentrations.
Our work shows that LiNbO3-type ferroelectric materials have more robust polar properties against oxygen vacancies and hydrostatic pressure than BaTiO3. Furthermore, the intriguing pressure-driven metal-insulator transition in oxygen-deficient LiNbO3-δ is not found in widely used ferroelectric materials BaTiO3 or BaTiO3-δ. This implies that LiNbO3-based ferroelectric devices may have a wider range of applications, in particular when they are under conditions that are unfavorable to perovskite ferroelectrics such as BaTiO3.
Acknowledgements.
Hanghui Chen is supported by the National Natural Science Foundation of China under project number 11774236 and NYU University Research Challenge Fund. Yue Chen and Chengliang Xia are supported by the Research Grants Council of Hong Kong under Project Number 17201019. The authors are grateful for the research computing facilities offered by ITS, HKU and high-performance computing resources from NYU Shanghai.Appendix A LSDA calculations for possible magnetization
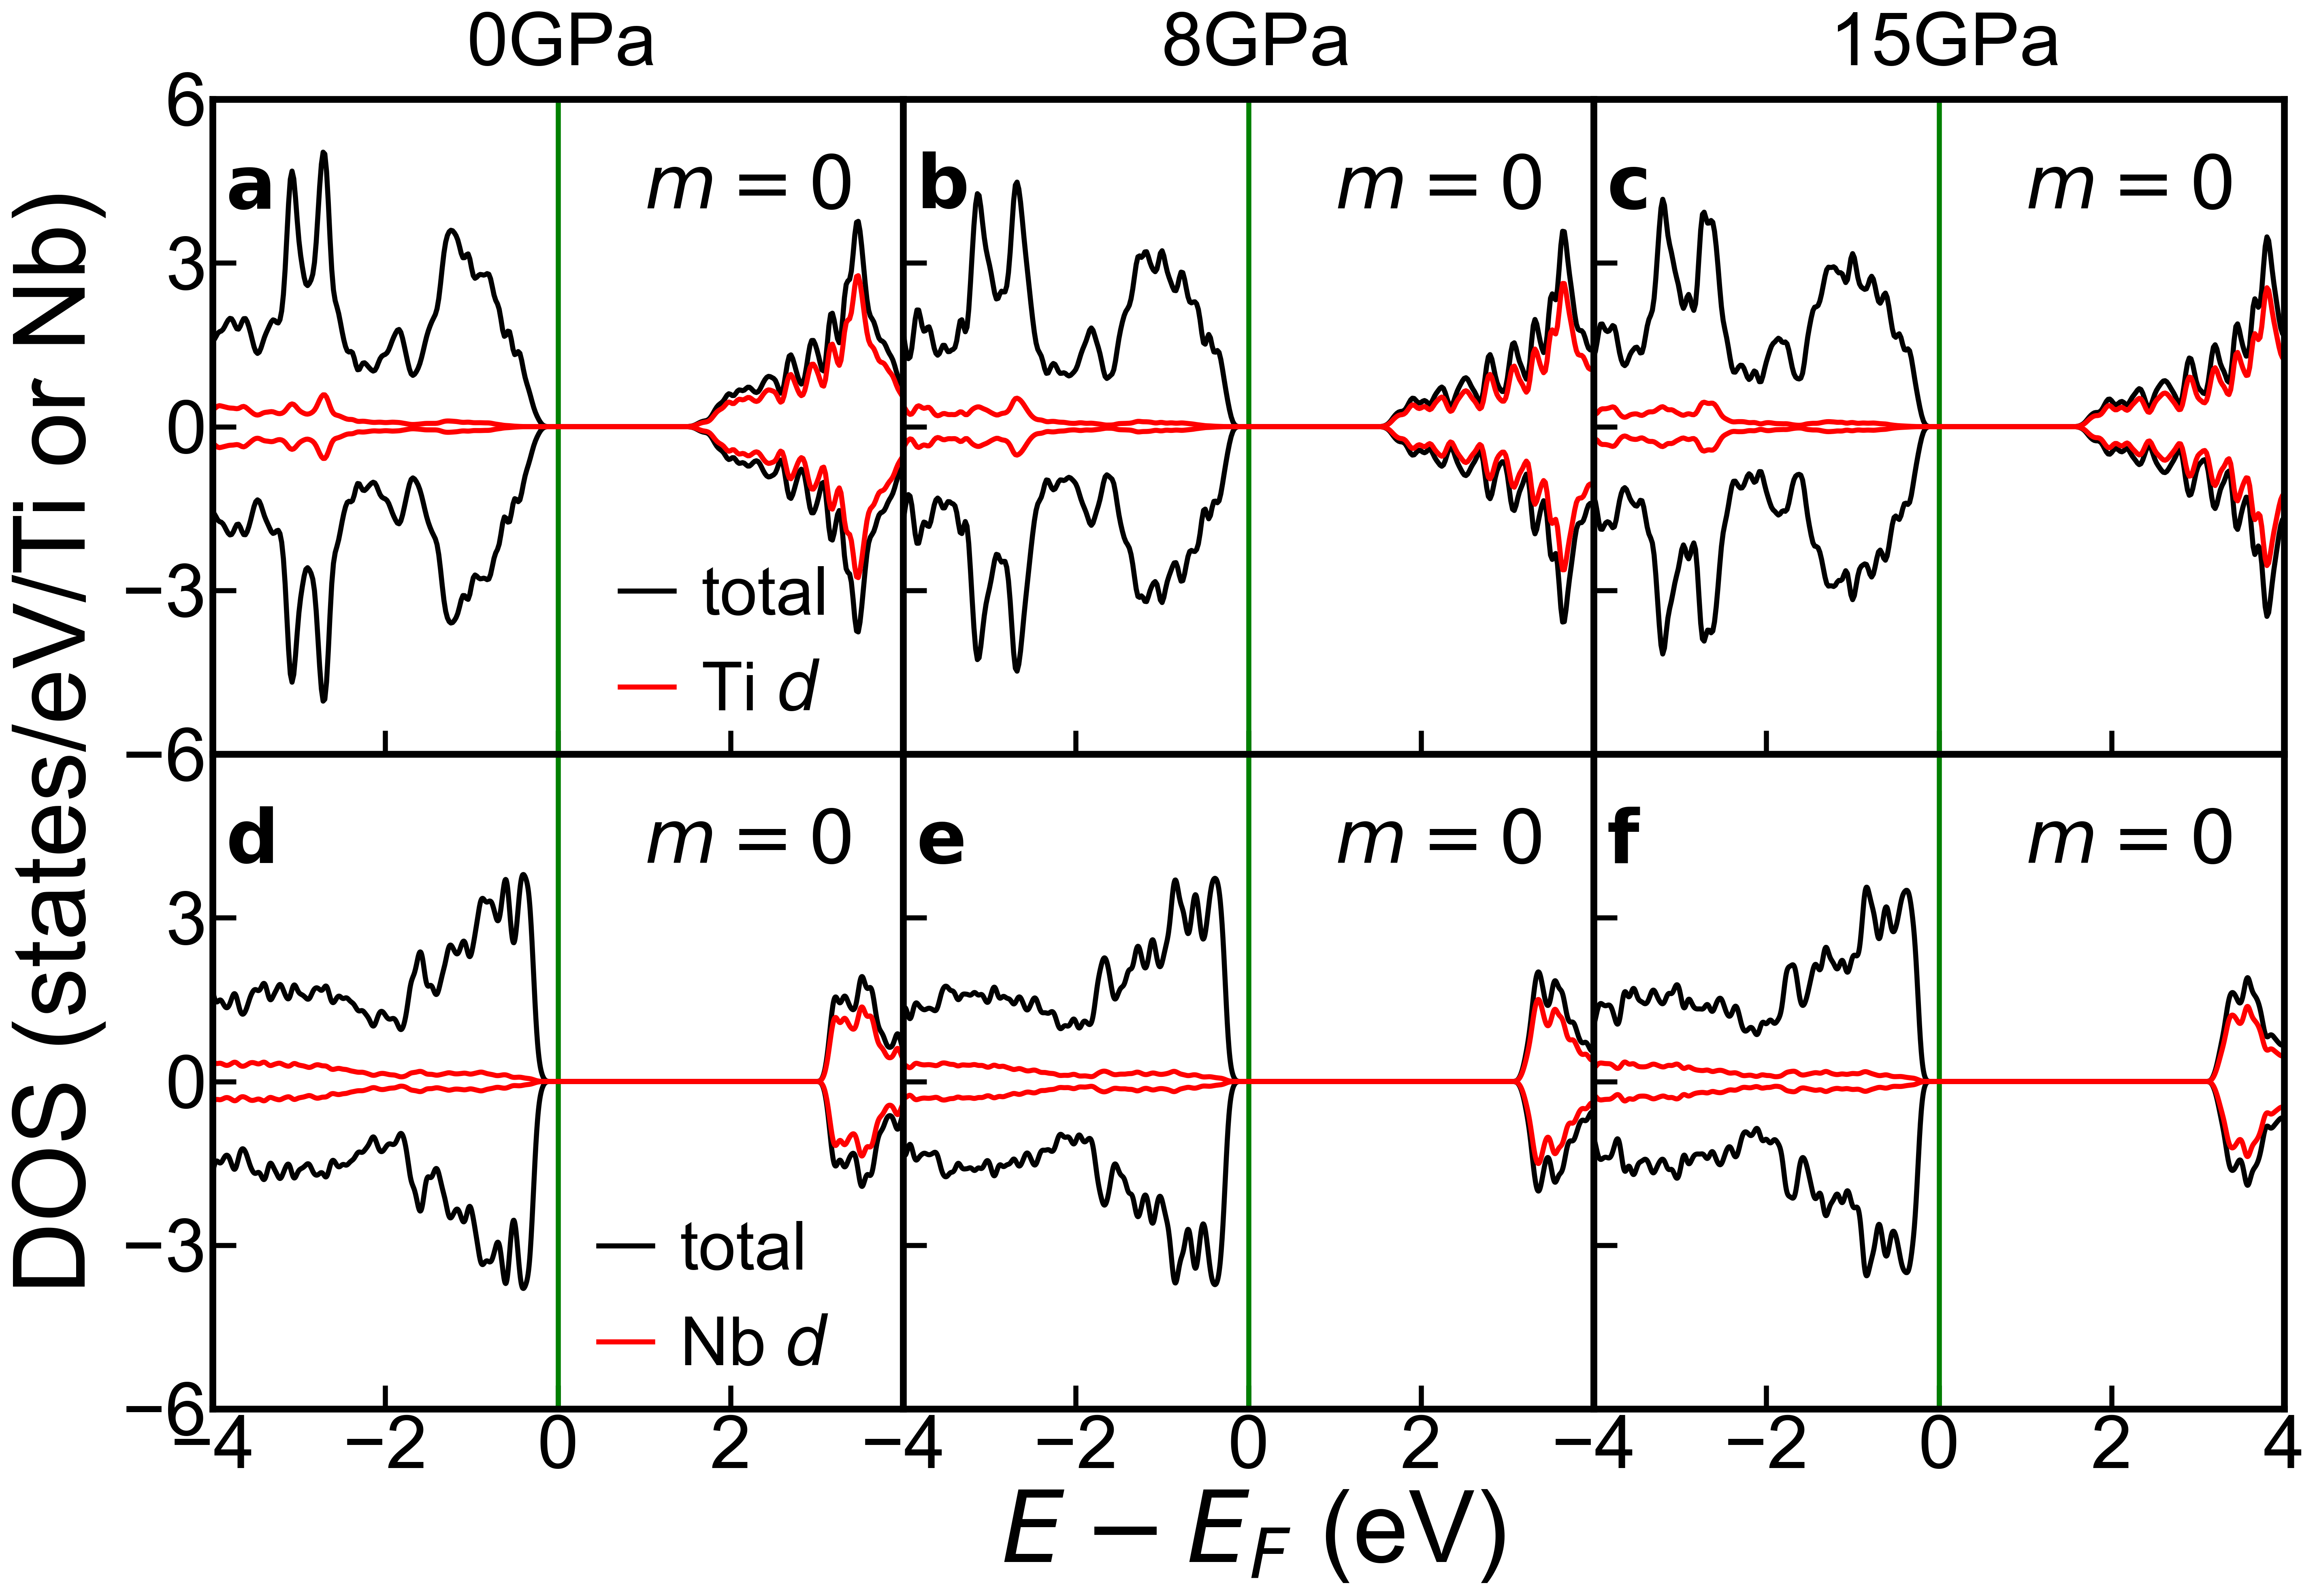
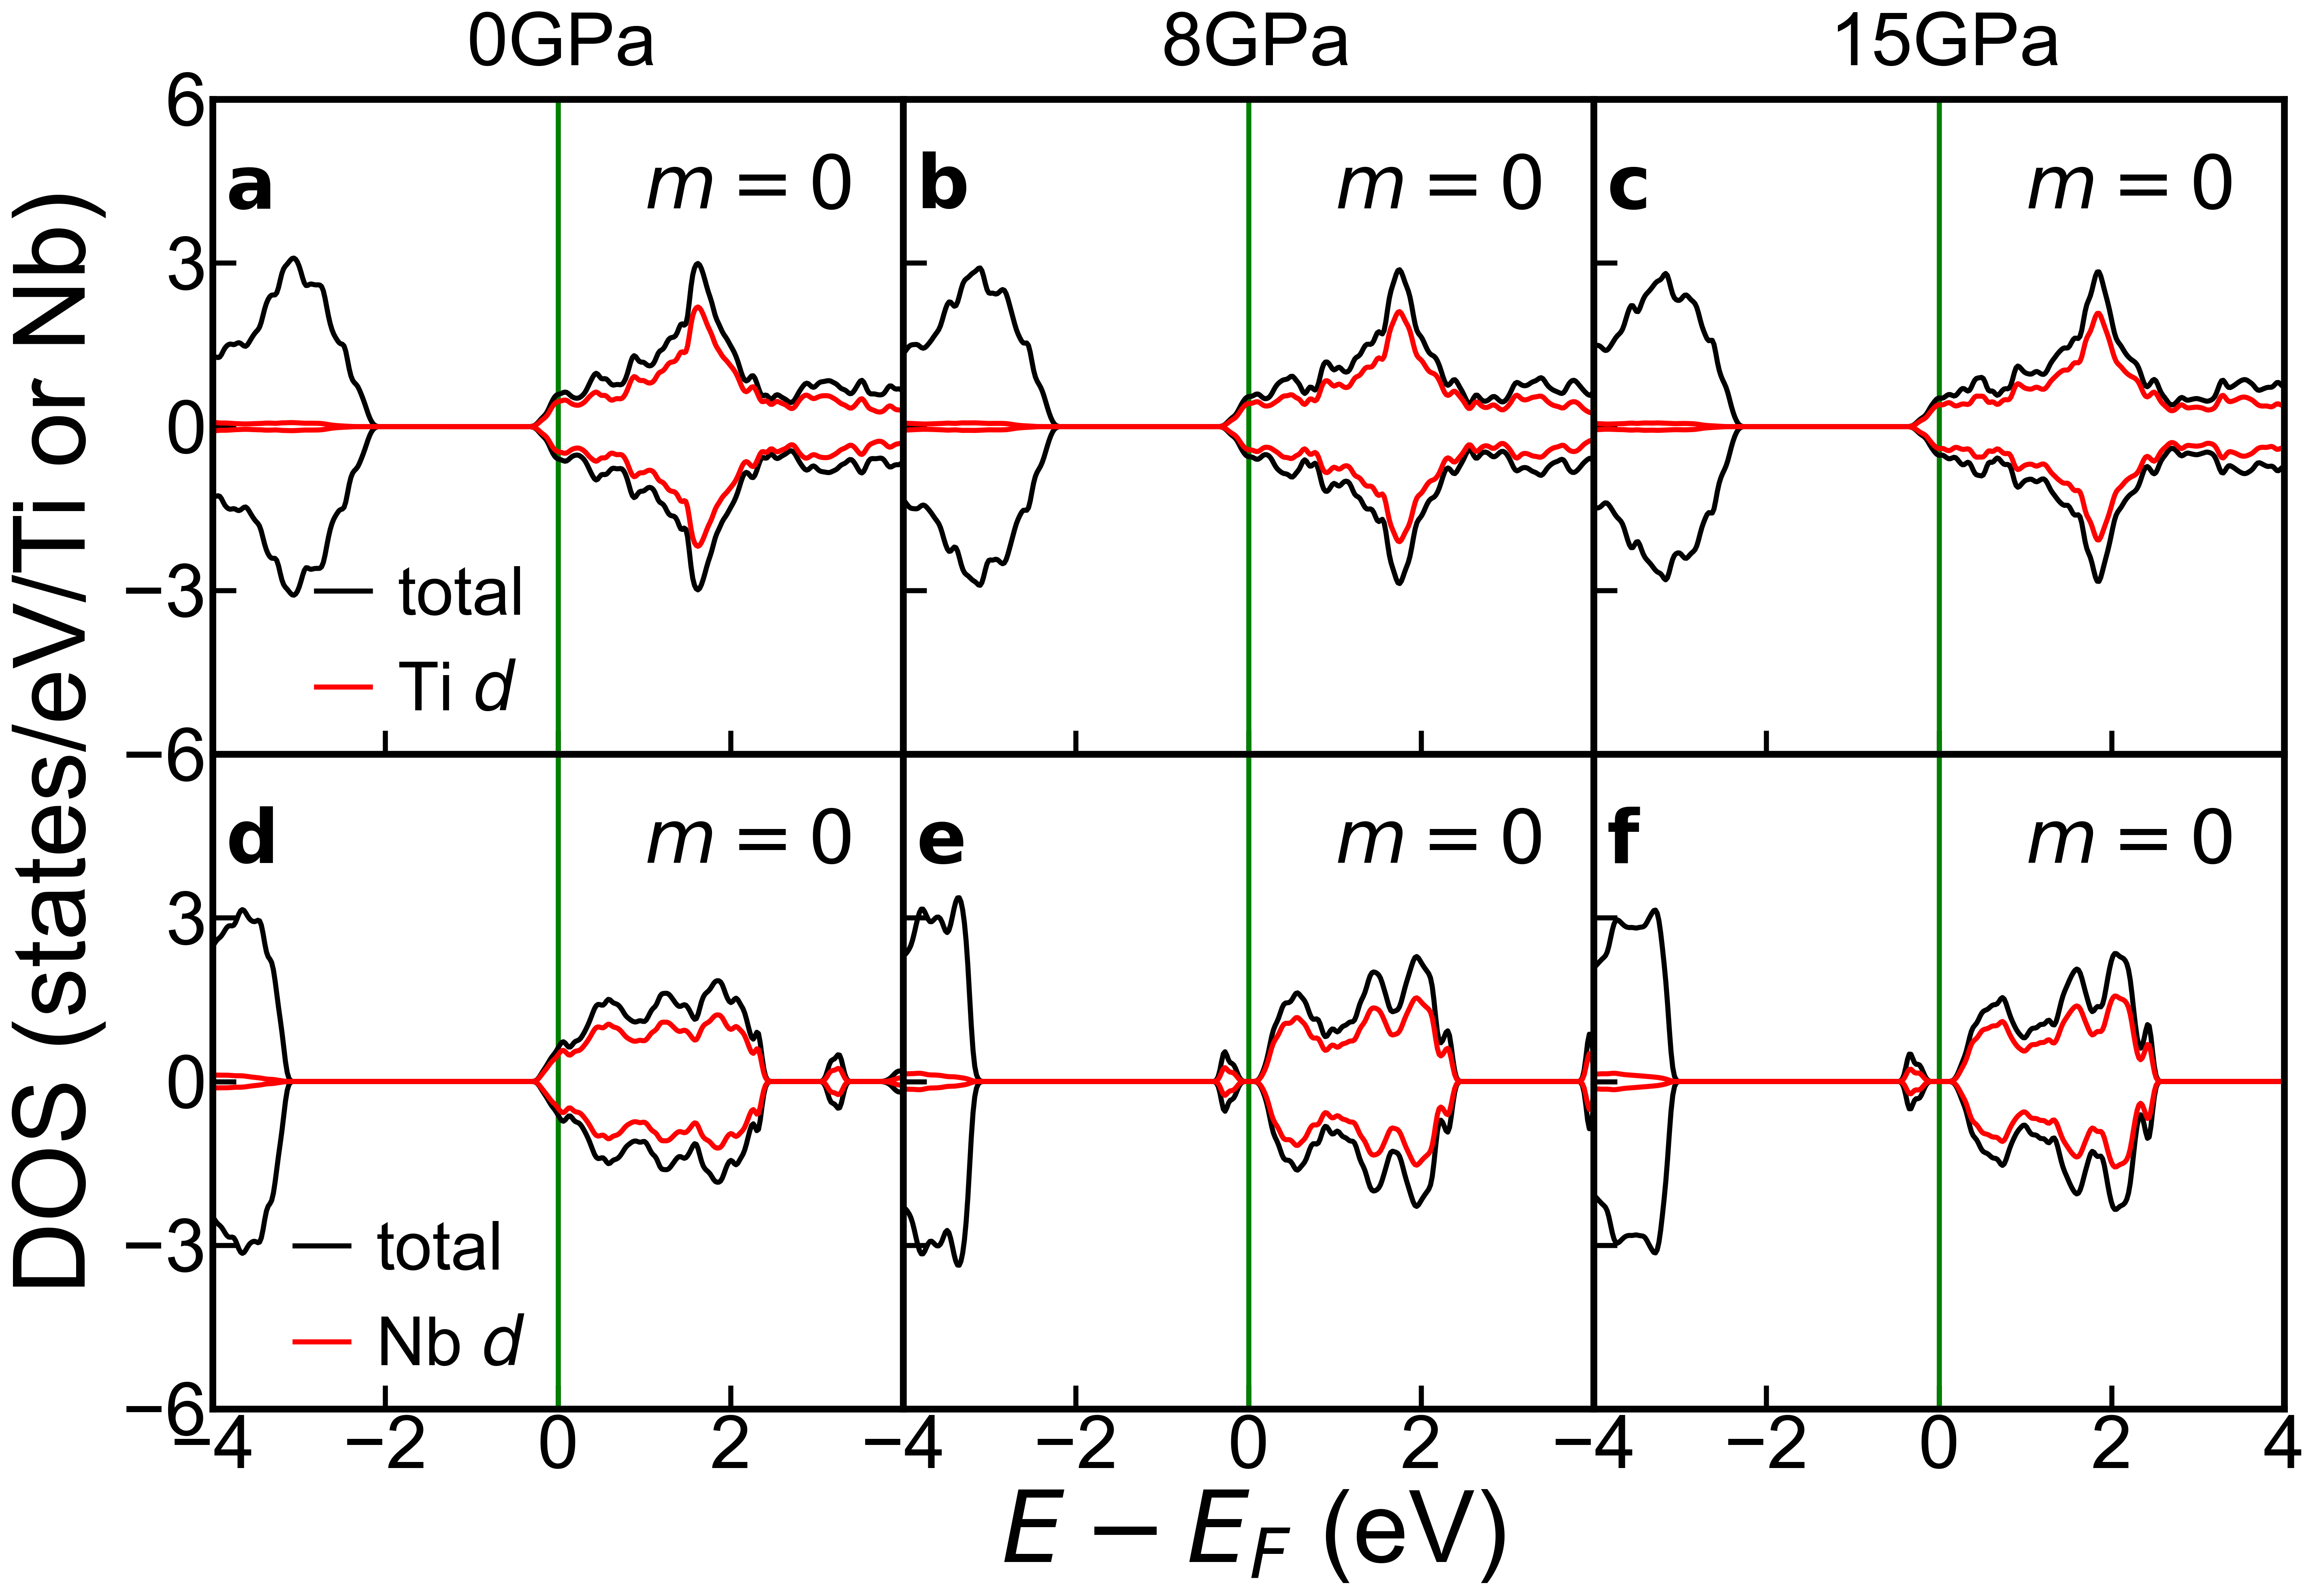
In this section, we show the LSDA calculations of pristine BaTiO3 and LiNbO3, as well as oxygen-deficient BaTiO3-δ and LiNbO3-δ. We find that while we intentionally break the spin symmetry, the resulting density of states do not exhibit any magnetization in our calculations.
Fig. 6 shows the density of states of pristine BaTiO3 and LiNbO3 under a hydrostatic pressure of 0, 8 and 15 GPa. Fig. 7 shows the density of states of oxygen-deficient BaTiO3-δ and LiNbO3-δ under a hydrostatic pressure of 0, 8 and 15 GPa.
Appendix B Electronic band structure of pristine BaTiO3 and LiNbO3 under a hydrostatic pressure
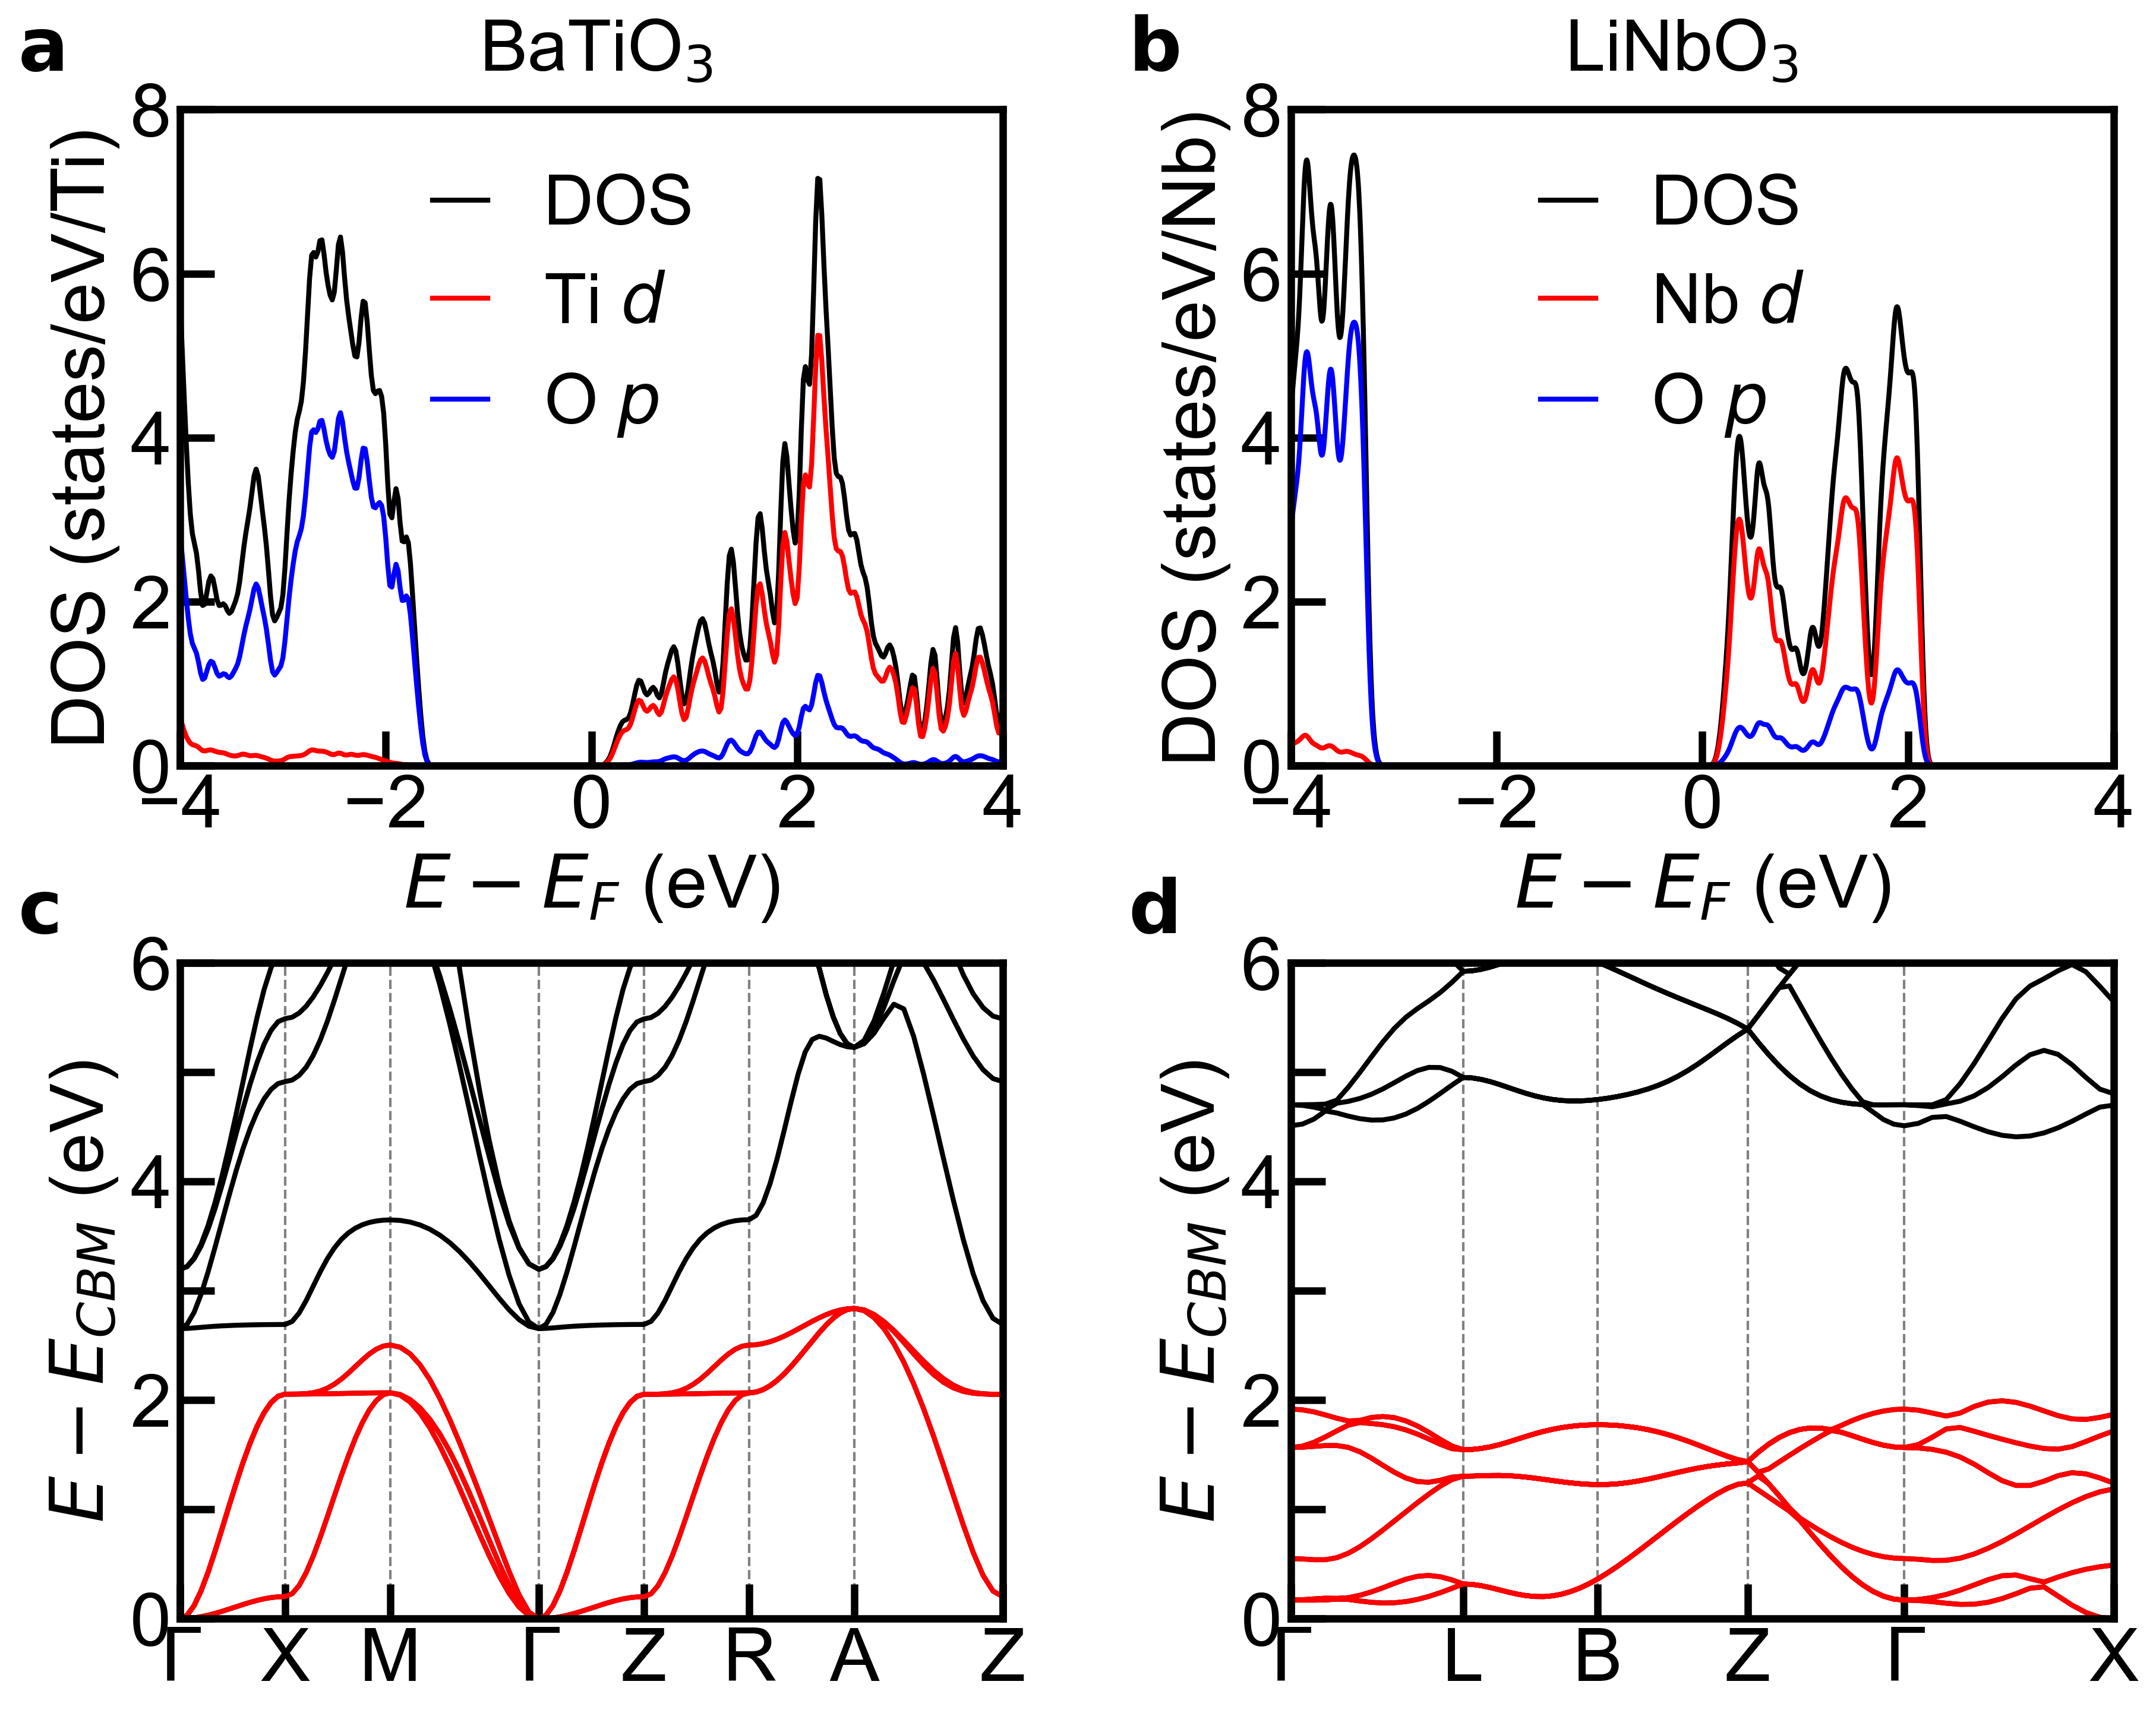
Fig. 8 shows densities of states and electronic band structure of pristine BaTiO3 (panels a and c) and pristine LiNbO3 (panels b and d) under a representative hydrostatic pressure of 8 GPa. Both pristine BaTiO3 and LiNbO3 are wide gap insulators under ambient pressure and they remain insulating under a hydrostatic pressure of 8 GPa. In the calculations, we find that the overall electronic structures of BaTiO3 and LiNbO3 do not change substantially with pressure but the band width of Ti- and Nb- states increase under pressure. Since we are interested in the band width of Ti- and Nb- states, we only show the electronic band structure above the conduction band minimum (CBM). Due to the crystal field splitting in BaTiO3 and LiNbO3, both Ti- and Nb- orbitals are split into and states. The Ti- and Nb- states are highlighted in red in panels c and d of Fig. 8. Our calculations find that the band width of both and states increase under pressure. For conciseness, we only show the pressure dependence of Ti- and Nb- band width in Fig. 1 in the main text.
Appendix C Definition of polar displacements
The advantage of using polar displacements to characterize ferroelectric-like distortions is that they are well defined in both insulating and conducting systems, while polarization is ill-defined in metals Stengel et al. (2011); Wang et al. (2012); Kim et al. (2016).
Pristine BaTiO3 and LiNbO3 are both insulators. However, oxygen vacancies donate itinerant electrons and make oxygen-deficient BaTiO3-δ and LiNbO3-δ conducting under ambient pressure. We follow the previous definition of polar displacements when we study BaTiO3 and LiNbO3 under ambient pressure Xia et al. (2019) and now extend the definition to the case in which both materials are under hydrostatic pressure. For self-containedness, we outline the definition of polar displacement briefly below.
Fig. 9a and b show the crystal structure of pristine BaTiO3 and oxygen-deficient BaTiO3-δ with . In the plane, each Ti atom is surrounded by four O atoms in TiO2 layer and Ti atoms move along the axis, therefore Ti-O displacement is defined as:
| (1) |
where is the position of Ti and is the position of the four nearest O atoms. is defined in a similar way as . We note that in oxygen-deficient BaTiO3-δ, the two Ti atoms that are closest to the oxygen vacancy only have three nearest O atoms in TiO2 layer in plane, therefore the Ti-O displacement for these two Ti atoms is defined as:
| (2) |
where is the position of the three nearest O atoms around the Ti atom in plane.
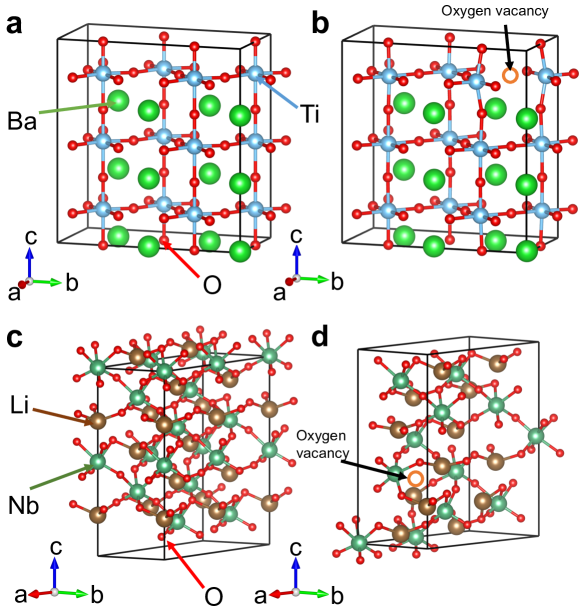
Fig. 9c and d show the crystal structure of pristine LiNbO3 and oxygen-deficient LiNbO3-δ with . and are defined in slightly different ways. Each Li atom is surrounded by three O atoms and Li atoms move along the axis. Li-O displacement is defined as:
| (3) |
where is the position of Li and is the position of the three nearest O atoms. Each Nb atom is surrounded by six O atoms and Nb atoms move along the axis. Nb-O displacement is defined as:
| (4) |
where is the position of Nb and is the position of the six nearest O atoms. We note that in oxygen-deficient LiNbO3-δ, the Li atom that is closest to the oxygen vacancy only has two nearest O atoms, and the two Nb atoms that are closest to the oxygen vacancy only have five nearest O atoms. Therefore, the Li-O displacement for this Li atom and the Nb-O displacement for these two Nb atoms are defined as:
| (5) |
where is position of the two nearest O atoms for the Li atom and
| (6) |
where is position of the five nearest O atoms around the Nb atom.
References
- Cohen (1992) R. E. Cohen, Nature 358, 136 (1992).
- Goto et al. (2004) T. Goto, T. Kimura, G. Lawes, A. P. Ramirez, and Y. Tokura, Phys. Rev. Lett. 92, 257201 (2004).
- Inbar and Cohen (1996) I. Inbar and R. E. Cohen, Phys. Rev. B 53, 1193 (1996).
- Smith et al. (2008) M. B. Smith, K. Page, T. Siegrist, P. L. Redmond, E. C. Walter, R. Seshadri, L. E. Brus, and M. L. Steigerwald, Journal of the American Chemical Society 130, 6955 (2008).
- Inaguma et al. (2008) Y. Inaguma, M. Yoshida, and T. Katsumata, Journal of the American Chemical Society 130, 6704 (2008).
- Shi et al. (2013) Y. Shi, Y. Guo, X. Wang, A. J. Princep, D. Khalyavin, P. Manuel, Y. Michiue, A. Sato, K. Tsuda, S. Yu, et al., Nature Materials 12, 1024 (2013).
- Bersuker (1966) I. Bersuker, Physics Letters 20, 589 (1966).
- Bersuker and Vekhter (1978) I. B. Bersuker and B. Vekhter, Ferroelectrics 19, 137 (1978).
- Burdett (1981) J. K. Burdett, Inorganic Chemistry 20, 1959 (1981).
- Bersuker (2013) I. B. Bersuker, Journal of Physics: Conference Series 428, 012028 (2013).
- Ederer and Spaldin (2006) C. Ederer and N. A. Spaldin, Phys. Rev. B 74, 024102 (2006).
- Benedek and Fennie (2013) N. A. Benedek and C. J. Fennie, The Journal of Physical Chemistry C 117, 13339 (2013).
- Navrotsky (1998) A. Navrotsky, Chemistry of Materials 10, 2787 (1998).
- Benedek and Birol (2016) N. A. Benedek and T. Birol, J. Mater. Chem. C 4, 4000 (2016).
- Bousquet and Ghosez (2006) E. Bousquet and P. Ghosez, Phys. Rev. B 74, 180101 (2006).
- Wang et al. (2010) J. J. Wang, P. P. Wu, X. Q. Ma, and L. Q. Chen, Journal of Applied Physics 108, 114105 (2010).
- Jeong et al. (2011) I.-K. Jeong, S. Lee, S.-Y. Jeong, C. J. Won, N. Hur, and A. Llobet, Phys. Rev. B 84, 064125 (2011).
- Choi et al. (2011) M. Choi, F. Oba, and I. Tanaka, Applied Physics Letters 98, 172901 (2011).
- Kolodiazhnyi (2008) T. Kolodiazhnyi, Phys. Rev. B 78, 045107 (2008).
- Hwang et al. (2010) J. Hwang, T. Kolodiazhnyi, J. Yang, and M. Couillard, Phys. Rev. B 82, 214109 (2010).
- Kolodiazhnyi et al. (2010) T. Kolodiazhnyi, M. Tachibana, H. Kawaji, J. Hwang, and E. Takayama-Muromachi, Phys. Rev. Lett. 104, 147602 (2010).
- Wang et al. (2012) Y. Wang, X. Liu, J. D. Burton, S. S. Jaswal, and E. Y. Tsymbal, Phys. Rev. Lett. 109, 247601 (2012).
- Hickox-Young et al. (2020) D. Hickox-Young, D. Puggioni, and J. M. Rondinelli, Phys. Rev. B 102, 014108 (2020).
- Michel et al. (2021) V. F. Michel, T. Esswein, and N. A. Spaldin, J. Mater. Chem. C 9, 8640 (2021).
- Ma et al. (2021) J. Ma, R. Yang, and H. Chen, Nat. Commun. 12, 1 (2021).
- Xia et al. (2019) C. Xia, Y. Chen, and H. Chen, Phys. Rev. Materials 3, 054405 (2019).
- Gu et al. (2018) T. Gu, T. Scarbrough, Y. Yang, J. Íñiguez, L. Bellaiche, and H. J. Xiang, Phys. Rev. Lett. 120, 197602 (2018).
- Hohenberg and Kohn (1964) P. Hohenberg and W. Kohn, Phys. Rev. 136, B864 (1964).
- Kohn and Sham (1965) W. Kohn and L. J. Sham, Phys. Rev. 140, A1133 (1965).
- Payne et al. (1992) M. C. Payne, M. P. Teter, D. C. Allan, T. A. Arias, and J. D. Joannopoulos, Rev. Mod. Phys. 64, 1045 (1992).
- Kresse and Furthmüller (1996) G. Kresse and J. Furthmüller, Phys. Rev. B 54, 11169 (1996).
- Ceperley and Alder (1980) D. M. Ceperley and B. J. Alder, Phys. Rev. Lett. 45, 566 (1980).
- Zhang et al. (2017) Y. Zhang, J. Sun, J. P. Perdew, and X. Wu, Phys. Rev. B 96, 035143 (2017).
- Resta (1994) R. Resta, Rev. Mod. Phys. 66, 899 (1994).
- Resta and Vanderbilt (2007) R. Resta and D. Vanderbilt, Physics of Ferroelectrics pp. 31–68 (2007).
- Spaldin (2012) N. A. Spaldin, Journal of Solid State Chemistry 195, 2 (2012).
- Evarestov and Bandura (2012) R. A. Evarestov and A. V. Bandura, Journal of Computational Chemistry 33, 1123 (2012).
- Lee et al. (2010) D. Lee, H. Xu, V. Dierolf, V. Gopalan, and S. R. Phillpot, Phys. Rev. B 82, 014104 (2010).
- Streltsov et al. (2005) S. V. Streltsov, A. S. Mylnikova, A. O. Shorikov, Z. V. Pchelkina, D. I. Khomskii, and V. I. Anisimov, Phys. Rev. B 71, 245114 (2005).
- Paredes Aulestia et al. (2018) E. I. Paredes Aulestia, Y. W. Cheung, Y.-W. Fang, J. He, K. Yamaura, K. T. Lai, S. K. Goh, and H. Chen, Applied Physics Letters 113, 012902 (2018).
- Qi et al. (2011) T. Qi, M. T. Curnan, S. Kim, J. W. Bennett, I. Grinberg, and A. M. Rappe, Phys. Rev. B 84, 245206 (2011).
- Lin et al. (2012) C. Lin, C. Mitra, and A. A. Demkov, Phys. Rev. B 86, 161102 (2012).
- Aschauer et al. (2013) U. Aschauer, R. Pfenninger, S. M. Selbach, T. Grande, and N. A. Spaldin, Phys. Rev. B 88, 054111 (2013).
- Zhou et al. (2021) Z. Zhou, D. Chu, and C. Cazorla, Sci. Rep. 11, 11499 (2021).
- Freysoldt et al. (2014) C. Freysoldt, B. Grabowski, T. Hickel, J. Neugebauer, G. Kresse, A. Janotti, and C. G. Van de Walle, Rev. Mod. Phys. 86, 253 (2014).
- Janotti et al. (2014) A. Janotti, J. B. Varley, M. Choi, and C. G. Van de Walle, Phys. Rev. B 90, 085202 (2014).
- Sarkar and Khan (2019) A. Sarkar and G. G. Khan, Nanoscale 11, 3414 (2019).
- Gunkel et al. (2020) F. Gunkel, D. V. Christensen, Y. Z. Chen, and N. Pryds, Applied Physics Letters 116, 120505 (2020).
- Ren et al. (1982) S. Y. Ren, J. D. Dow, and D. J. Wolford, Phys. Rev. B 25, 7661 (1982).
- Robertson (2003) J. Robertson, Journal of Applied Physics 93, 1054 (2003).
- Lany and Zunger (2008) S. Lany and A. Zunger, Phys. Rev. B 78, 235104 (2008).
- Svane et al. (2006) A. Svane, N. E. Christensen, L. Petit, Z. Szotek, and W. M. Temmerman, Phys. Rev. B 74, 165204 (2006).
- Huang et al. (2015) B. Huang, M. Yoon, B. G. Sumpter, S.-H. Wei, and F. Liu, Phys. Rev. Lett. 115, 126806 (2015).
- Xu et al. (2019) T. Xu, T. Shimada, Y. Araki, M. Mori, G. Fujimoto, J. Wang, T.-Y. Zhang, and T. Kitamura, npj Comput Mater 5, 23 (2019).
- Mott (1949) N. F. Mott, Proceedings of the Physical Society. Section A 62, 416 (1949).
- Kuneš et al. (2008) J. Kuneš, A. V. Lukoyanov, V. I. Anisimov, R. T. Scalettar, and W. E. Pickett, Nature Materials 7, 198 (2008).
- Kuneš et al. (2009) J. Kuneš, D. M. Korotin, M. A. Korotin, V. I. Anisimov, and P. Werner, Phys. Rev. Lett. 102, 146402 (2009).
- Shorikov et al. (2015) A. O. Shorikov, A. V. Lukoyanov, V. I. Anisimov, and S. Y. Savrasov, Phys. Rev. B 92, 035125 (2015).
- Huang et al. (2017) L. Huang, Y. Wang, and P. Werner, EPL (Europhysics Letters) 119, 57007 (2017).
- Yoo et al. (2005) C. S. Yoo, B. Maddox, J.-H. P. Klepeis, V. Iota, W. Evans, A. McMahan, M. Y. Hu, P. Chow, M. Somayazulu, D. Häusermann, et al., Phys. Rev. Lett. 94, 115502 (2005).
- Greenberg et al. (2018) E. Greenberg, I. Leonov, S. Layek, Z. Konopkova, M. P. Pasternak, L. Dubrovinsky, R. Jeanloz, I. A. Abrikosov, and G. K. Rozenberg, Phys. Rev. X 8, 031059 (2018).
- Leonov et al. (2020) I. Leonov, A. O. Shorikov, V. I. Anisimov, and I. A. Abrikosov, Phys. Rev. B 101, 245144 (2020).
- Qiao et al. (2015) Q. Qiao, Y. Zhang, R. Contreras-Guerrero, R. Droopad, S. T. Pantelides, S. J. Pennycook, S. Ogut, and R. F. Klie, Applied Physics Letters 107, 201604 (2015).
- Nishida et al. (2013) K. Nishida, M. Osada, J. Sakai, N. Ito, T. Katoda, R. Ikariyama, H. Funakubo, H. Moriwake, and T. Yamamoto, Journal of the Ceramic Society of Japan 121, 598 (2013).
- Zhang et al. (2014) T.-F. Zhang, X.-G. Tang, Q.-X. Liu, S.-G. Lu, Y.-P. Jiang, X.-X. Huang, and Q.-F. Zhou, AIP Advances 4, 107141 (2014).
- Glinchuk et al. (2018) M. D. Glinchuk, E. A. Eliseev, G. Li, J. Zeng, S. V. Kalinin, and A. N. Morozovska, Phys. Rev. B 98, 094102 (2018).
- Singh et al. (2010) G. Singh, V. S. Tiwari, and P. K. Gupta, Journal of Applied Physics 107, 064103 (2010).
- Banerjee et al. (2012) S. Banerjee, M. Kumar Bhunia, A. Bhaumik, and D. Chakravorty, Journal of Applied Physics 111, 054310 (2012).
- Starschich et al. (2016) S. Starschich, S. Menzel, and U. Böttger, Applied Physics Letters 108, 032903 (2016).
- Strand et al. (2018) J. Strand, M. Kaviani, D. Gao, A.-M. El-Sayed, V. V. Afanas’ev, and A. L. Shluger, Journal of Physics: Condensed Matter 30, 233001 (2018).
- Peng et al. (2020) Y. Peng, G. Han, F. Liu, W. Xiao, Y. Liu, N. Zhong, C. Duan, Z. Feng, H. Dong, and Y. Hao, Nanoscale Research Letters 15, 1 (2020).
- Islamov et al. (2020) D. R. Islamov, T. M. Zalyalov, O. M. Orlov, V. A. Gritsenko, and G. Y. Krasnikov, Applied Physics Letters 117, 162901 (2020).
- Peng et al. (2021) W. Peng, J. Mun, Q. Xie, J. Chen, L. Wang, M. Kim, and T. W. Noh, npj Quantum Materials 6, 48 (2021).
- Noguchi et al. (2019) Y. Noguchi, H. Matsuo, Y. Kitanaka, and M. Miyayama, Scientific Reports 9, 4225 (2019).
- Yu et al. (2021) H. Yu, F. Chen, X. Li, H. Huang, Q. Zhang, S. Su, K. Wang, E. Mao, B. Mei, G. Mul, et al., Nature Communications 12, 4594 (2021).
- Bredikhin et al. (2000) S. Bredikhin, S. Scharner, M. Klingler, V. Kveder, B. Red’kin, and W. Weppner, Journal of Applied Physics 88, 5687 (2000).
- Lu et al. (2003) M. Lu, B. N. Makarenko, Y.-Z. Hu, and J. W. Rabalais, The Journal of Chemical Physics 118, 2873 (2003).
- Karapetyan et al. (2006) K. G. Karapetyan, A. A. Kteyan, and R. A. Vardanyan, Solid State Communications 140, 474 (2006).
- Lengyel et al. (2015) K. Lengyel, A. Peter, L. Kovács, G. Corradi, L. Pálfalvi, J. Hebling, M. Unferdorben, G. Dravecz, I. Hajdara, Z. Szaller, et al., Applied Physics Reviews 2, 040601 (2015).
- Díaz-Moreno et al. (2014) C. Díaz-Moreno, R. Farías-Mancilla, J. Matutes-Aquino, J. Elizalde-Galindo, F. Espinosa-Magaña, J. González-Hernández, and A. Hurtado-Macías, Journal of Magnetism and Magnetic Materials 356, 82 (2014).
- Manikandan et al. (2015) M. Manikandan, K. Saravana Kumar, N. Aparnadevi, N. Praveen Shanker, and C. Venkateswaran, Journal of Magnetism and Magnetic Materials 391, 156 (2015).
- Díaz-Moreno et al. (2012) C. Díaz-Moreno, R. Farias, A. Hurtado-Macias, J. Elizalde-Galindo, and J. Hernandez-Paz, Journal of Applied Physics 111, 07D907 (2012).
- Wang et al. (2019) C. Wang, J. Sun, W. Ni, B. Yue, F. Hong, H. Liu, and Z. Cheng, Journal of the American Ceramic Society 102, 6705 (2019).
- Stengel et al. (2011) M. Stengel, P. Aguado-Puente, N. A. Spaldin, and J. Junquera, Phys. Rev. B 83, 235112 (2011).
- Kim et al. (2016) T. Kim, D. Puggioni, Y. Yuan, L. Xie, H. Zhou, N. Campbell, P. Ryan, Y. Choi, J.-W. Kim, J. Patzner, et al., Nature 533, 68 (2016).