The environmental dependence of gas properties in dense cores of a protocluster
at revealed with ALMA
Abstract
In a protocluster USS1558-003 at , galaxies in the dense cores show systematically elevated star-forming activities than those in less dense regions. To understand its origin, we look into the gas properties of the galaxies in the dense cores by conducting deep 1.1 mm observations with Atacama Large Millimeter/submillimeter Array (ALMA). We detect interstellar dust continuum emissions from 12 member galaxies and estimate their molecular gas masses. Comparing these gas masses with our previous measurements from CO(3–2) line, we infer that the latter might be overestimated. We find that the gas to stellar mass ratios of the galaxies in the dense cores tend to be higher (at where we see the enhanced star-forming activities), suggesting that such large gas masses can sustain their high star-forming activities. However, if we compare the gas properties of these protocluster galaxies with the gas scaling relations constructed for field galaxies at similar cosmic epoch, we find no significant environmental difference at the same stellar mass and star formation rate. Although both gas mass ratios and star-forming activities are enhanced in the majority of member galaxies, they appear to follow the same scaling relation as field galaxies. Our results are consistent with the scenario that the cold gas is efficiently supplied to protocluster cores and to galaxies therein along surrounding filamentary structures, which leads to the high gas mass fractions and thus the elevated star-formation activities, but without changing the star formation law.
1 Introduction
In the local Universe, it is well known that the properties of galaxies are strongly correlated with surrounding environments (e.g., Dressler, 1980; Dressler et al., 1997; Kauffmann et al., 2004; Balogh et al., 2004; Blanton et al., 2005; Christlein & Zabludoff, 2005; Peng et al., 2010). For example, active star-forming galaxies often reside in low-density environments while passively evolving, older galaxies are preferentially found in galaxy clusters (e.g., Balogh et al., 1998; Poggianti et al., 1999; Gómez et al., 2003; Goto et al., 2003). Because the majority of galaxies in clusters in the present-day Universe have already finished their star-formation activities, we need to go back in time by observing galaxies in the past to reveal the origin of the strong environmental dependence of galaxy properties. At higher redshifts, active star-forming galaxies are often found in high-density environments, such as galaxy clusters and protoclusters (e.g., Tran et al., 2010; Fassbender et al., 2011; Hayashi et al., 2012; Koyama et al., 2013; Alberts et al., 2014). Star-forming activities in (proto)clusters are said to increase dramatically with redshift as (Shimakawa et al., 2014). Chiang et al. (2017) showed that (proto)cluster galaxies account for as much as 20% of the cosmic star formation rate (SFR) density at with N-body simulations and semi-analytic models. (Proto)clusters at are ideal laboratories to see the early environmental effects working on member galaxies in the phase of the rapid growth with active star formation.
Many environmental effects preferentially affect the gaseous component of cluster galaxies, subsequently star formation. For instance, the sudden gas removal from infalling galaxies by ram pressure of the hot intracluster medium (ICM; Gunn & Gott, 1972) or by galaxy harassment (Moore et al., 1996), and the halt of the gas supply to galaxies due halo gas stripping (strangulation; e.g., Larson et al., 1980; Kawata & Mulchaey, 2008; Peng et al., 2015) are proposed as such environmental effects. Many observations of galaxies in the local Universe reported a deficiency of atomic hydrogen in galaxies in denser regions due to ram pressure stripping (e.g., Vollmer et al., 2001; Chung et al., 2007; Roediger & Brüggen, 2007; Jaffé et al., 2015; Brown et al., 2017). However, it is yet to be clarified whether molecular gas is also affected by ram pressure as it is more centrally concentrated and strongly bound to host galaxies. Some studies showed no environmental dependence in the molecular gas fraction (Kenney & Young, 1989; Koyama et al., 2017). The absence of environmental dependence may also be related to longer depletion timescale due to heating processes or higher turbulent pressure in the cluster environment (Mok et al., 2016). On the other hand, some works reported the deficiencies of molecular gas in cluster environments (Fumagalli et al., 2009; Scott et al., 2013). In the case of protoclusters at high redshifts, the situation would be different. Cosmological simulations suggest that galaxies/clusters are fed by cold gas inflow along the surrounding filamentary structures (e.g., Birnboim & Dekel, 2003; Kereš et al., 2005; Dekel & Birnboim, 2006; Ocvirk et al., 2008; Kereš et al., 2009; Dekel et al., 2009). Because galaxy clusters are located at intersections of filamentary structures, the gas accretion is expected to be more prominent in cluster environments in the distant Universe. Such a different mode of gas accretion in high-density environments, if any, could affect the gas properties of member galaxies.
All these considerations have led us to investigate any possible environmental dependence on gas contents in galaxies at high redshifts. Although studies on gas contents in high-density environments at high redshifts are progressing, how the gas properties of galaxies depend on the surrounding environments at is inconclusive yet. Some studies found similar or even higher gas content in protocluster galaxies compared to field counterparts (Lee et al., 2017; Zavala et al., 2019; Tadaki et al., 2019). In contrast, some studies reported a deficit of gas content in the core of matured clusters (Coogan et al., 2018; Wang et al., 2018).
When we estimate the molecular gas contents in galaxies, CO molecular lines are commonly used as good tracers (e.g., Daddi et al., 2010; Genzel et al., 2010; Tacconi et al., 2010). This method is well-established, but time-consuming for high redshift galaxies even with the Atacama Large Millimeter/Submillimeter Array (ALMA). An alternative way is to observe the rest-frame far-infrared thermal emission from the dust associated with star-forming regions in galaxies. Dust grains absorb rest-frame ultraviolet (UV) photons emitted from young stars and re-emit thermal, black body-like continuum radiation in the infrared. Scoville et al. (2016) pointed out that the dust continuum emission is optically thin, and therefore it is a good tracer of the total amount of interstellar gas which hosts the dust. Since the bulk of dust in a galaxy is cold (), it can be observed at long wavelengths () where the sensitivity of ALMA is high. Moreover, we can explore even heavily dust-obscured star-forming galaxies (DSFGs) which would be otherwise hidden and missed by UV-optical observations. Therefore, we can construct a large, relatively unbiased sample of star-forming galaxies efficiently by deep dust continuum observations at high redshifts.
In this paper, we present the results of ALMA deep dust continuum imaging observations of protocluster cores at to study the environmental dependence of gas properties in detail. This paper is organized as follows. In Section 2, we explain the details of our target protocluster and the ALMA observations. In Section 3, we describe our analyses to obtain the gas properties of our target cluster galaxies and the field galaxies for comparison. Our results and discussion about the environmental dependence of gas properties at are shown in Section 4. In Section 5, we summarize the main findings of this study. Throughout this paper, we assume the flat CDM cosmology with , , and . We use the Chabrier (2003) initial mass function (IMF).
2 Observations
2.1 A protocluster at , USS1558-03
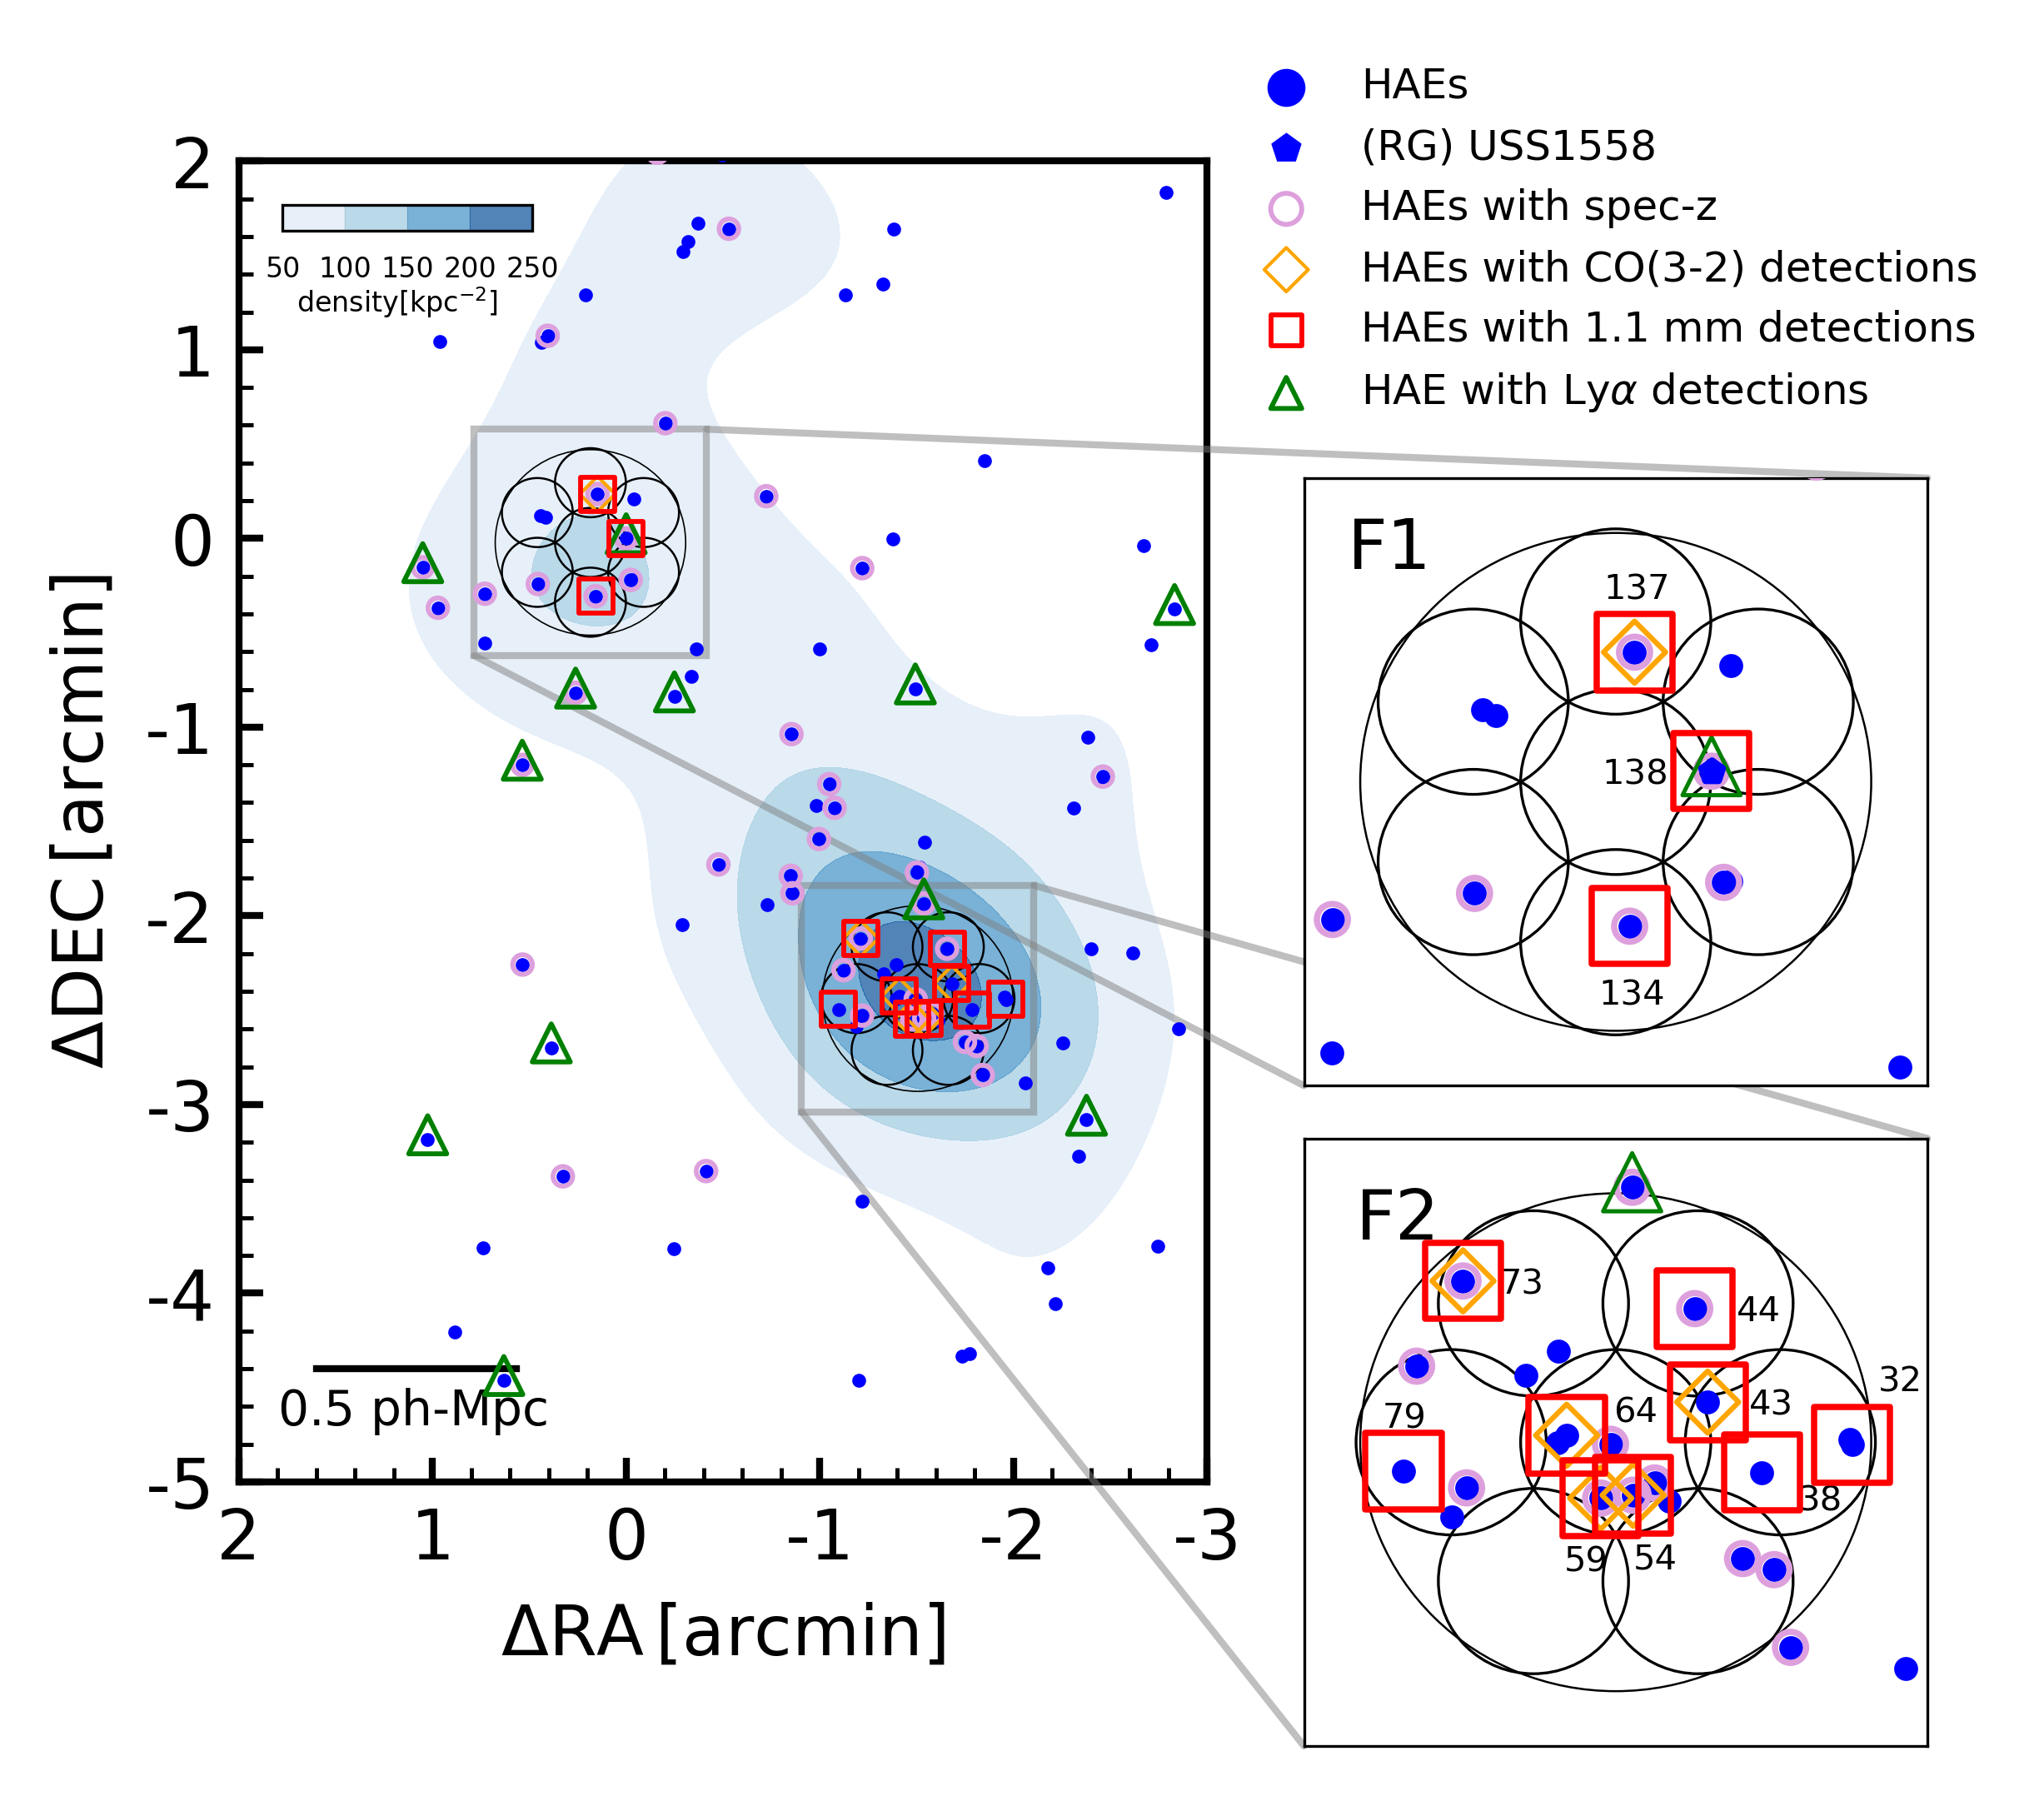
A protocluster USS1558-003 (hereafter USS1558) was first discovered as an over-density of distant red galaxies (DRGs) with around a radio galaxy (RG), USS1558-03 (Kajisawa et al., 2006). Narrow-band (NB) imaging observations for this protocluster were conducted with the Multi-Object InfraRed Camera and Spectrograph (MOIRCS; Ichikawa et al. 2006; Suzuki et al. 2008) on the Subaru telescope as a part of a systematic NB imaging survey called MApping H-Alpha and Lines of Oxygen with Subaru (MAHALO-Subaru; Kodama et al., 2013). With deep NB imaging observations targeting H emission at , 100 H emitters (HAEs) are identified as member galaxies associated with this protocluster so far (Hayashi et al., 2012, 2016; Shimakawa et al., 2018a).
Member galaxies were selected based on and color-color selection (Shimakawa et al., 2018a). So far, 43 HAEs were spectroscopically confirmed with the rest-frame optical emission lines and/or CO(3–2) line (Shimakawa et al., 2014, 2015b; Tadaki et al., 2019).
Figure 1 shows the spatial distribution of HAEs in USS1558. HAEs appear to distribute along a filamentary structure and to form several dense groups (Hayashi et al., 2012). The densest group of HAEs is located at ph-Mpc away from RG to the southwest. The number density of HAEs in the densest group is times higher than that of the general fields. USS1558 is one of the densest star-forming protoclusters discovered to date at . We also see a spatial concentration of HAEs in the vicinity of RG (Figure 1). Hereafter, we call the dense group of HAEs in the immediate vicinity of RG and the densest group of HAEs Field-1 (F1) and Field-2 (F2), respectively (Figure 1). The mean separation of HAEs in F1 and F2 is and ph-kpc, respectively (Shimakawa et al., 2018a). Such a close separation is enough to overlap individual halos of HAEs, which means that some kind of physical interaction is expected. Given the group-like structure and no diffuse X-ray emission detection in this field, USS1558 is considered to be an immature system at the stage of vigorous assembly. One of the notable features of USS1558 is that the HAEs in the two dense groups (F1 and F2) have systematically high SFRs than those in the intergroup regions (Shimakawa et al., 2018a).
In order to further investigate the origin of the elevated star-forming activities in USS1558 and the environmental effects on the gas properties of the member galaxies, we conducted ALMA Band-6 observations for the two dense cores in the protocluster. In this field, we have conducted ALMA Band-3 observations targeting CO(3–2) emission lines in Cycle 3 (2015.1.00395.S; PI: T. Kodama; Tadaki et al. 2019).
2.2 ALMA Band-6 observations
ALMA Band-6 observations were performed in Cycle5 (2017.1.00506.S, PI: T. Kodama) with a total on-source time of hours for 14-pointing mosaic observation (Figure 1). We observed the two dense groups in USS1558, namely, F1 and F2. Four spectral windows with an effective width of 1.875 GHz are set to observe continuum emission at the central frequency of 265 GHz (). The data was taken in the Time Division Mode (TDM).
The data calibration was done using the Common Astronomy Software Application Package (casa; McMullin et al., 2007) version 5.4.0. The continuum maps were obtained by a casa task tclean with natural weighting of the visibilities to obtain the highest sensitivity. The beam size of the constructed maps is at a position angle of deg. The root-mean-square (RMS) error noise is . Since a typical size of the member galaxies is smaller than the beam size (Shimakawa et al., 2018a), we consider that the integrated flux density is the same as the peak flux after primary beam correction.
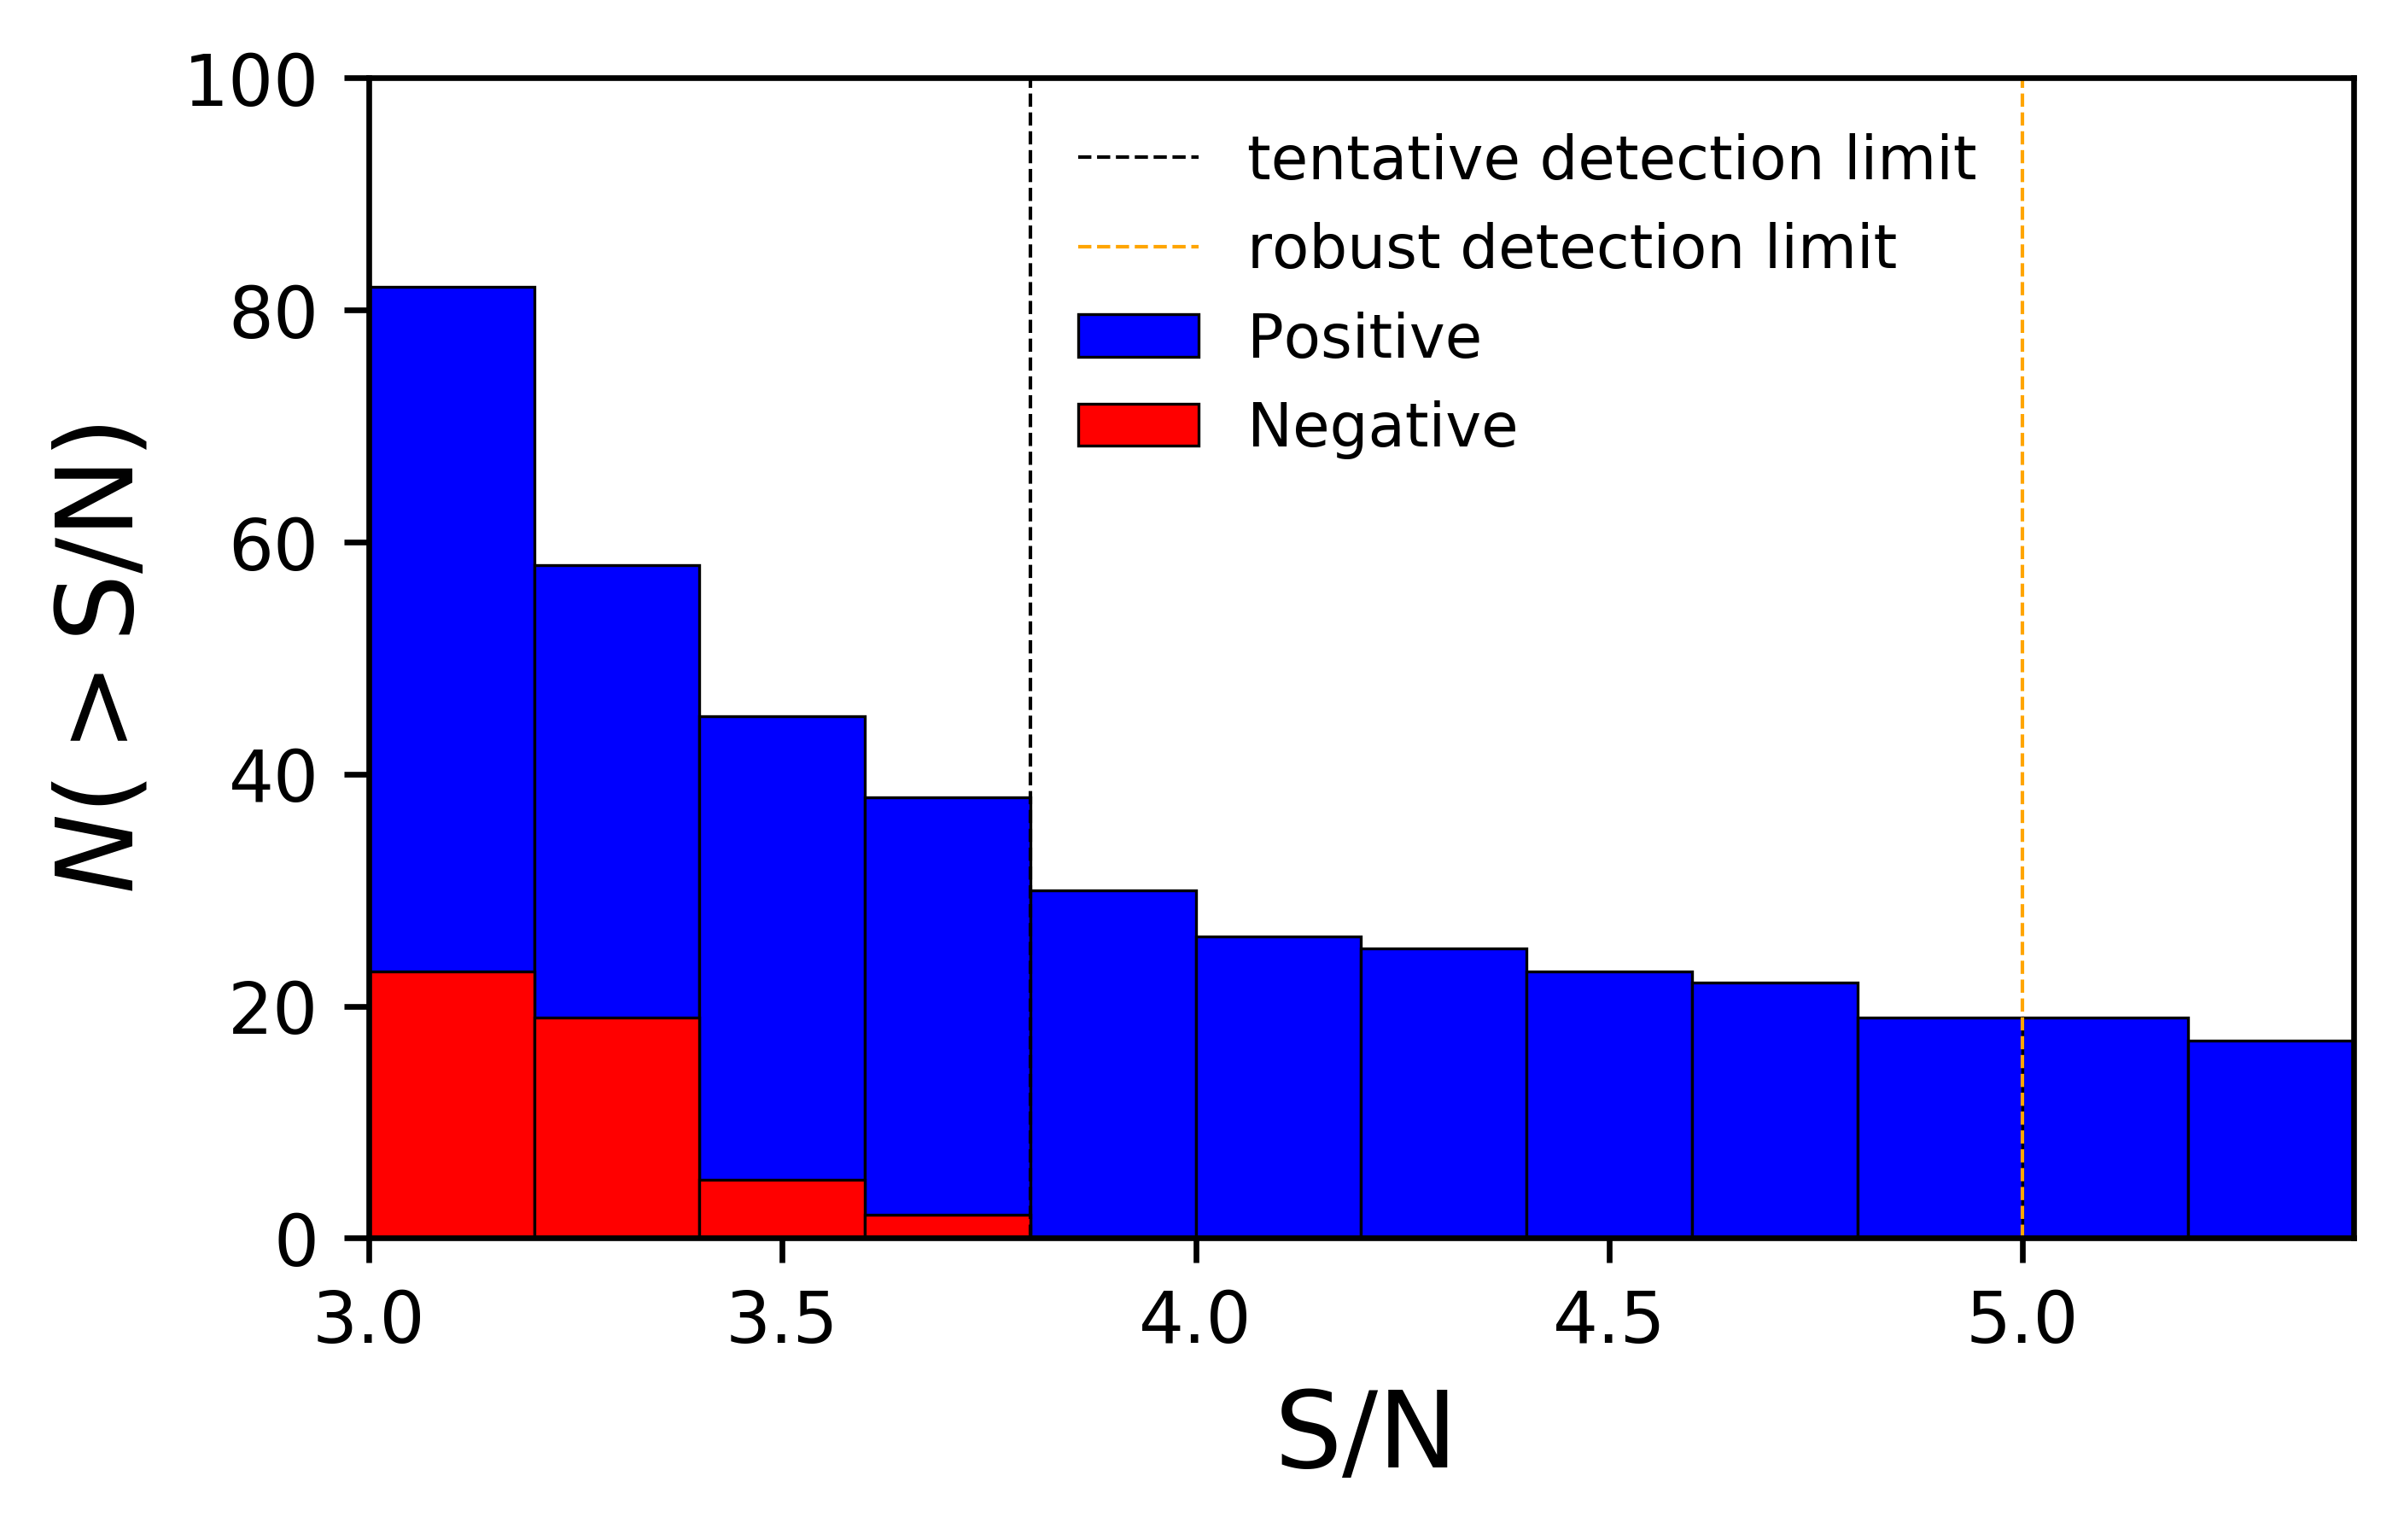
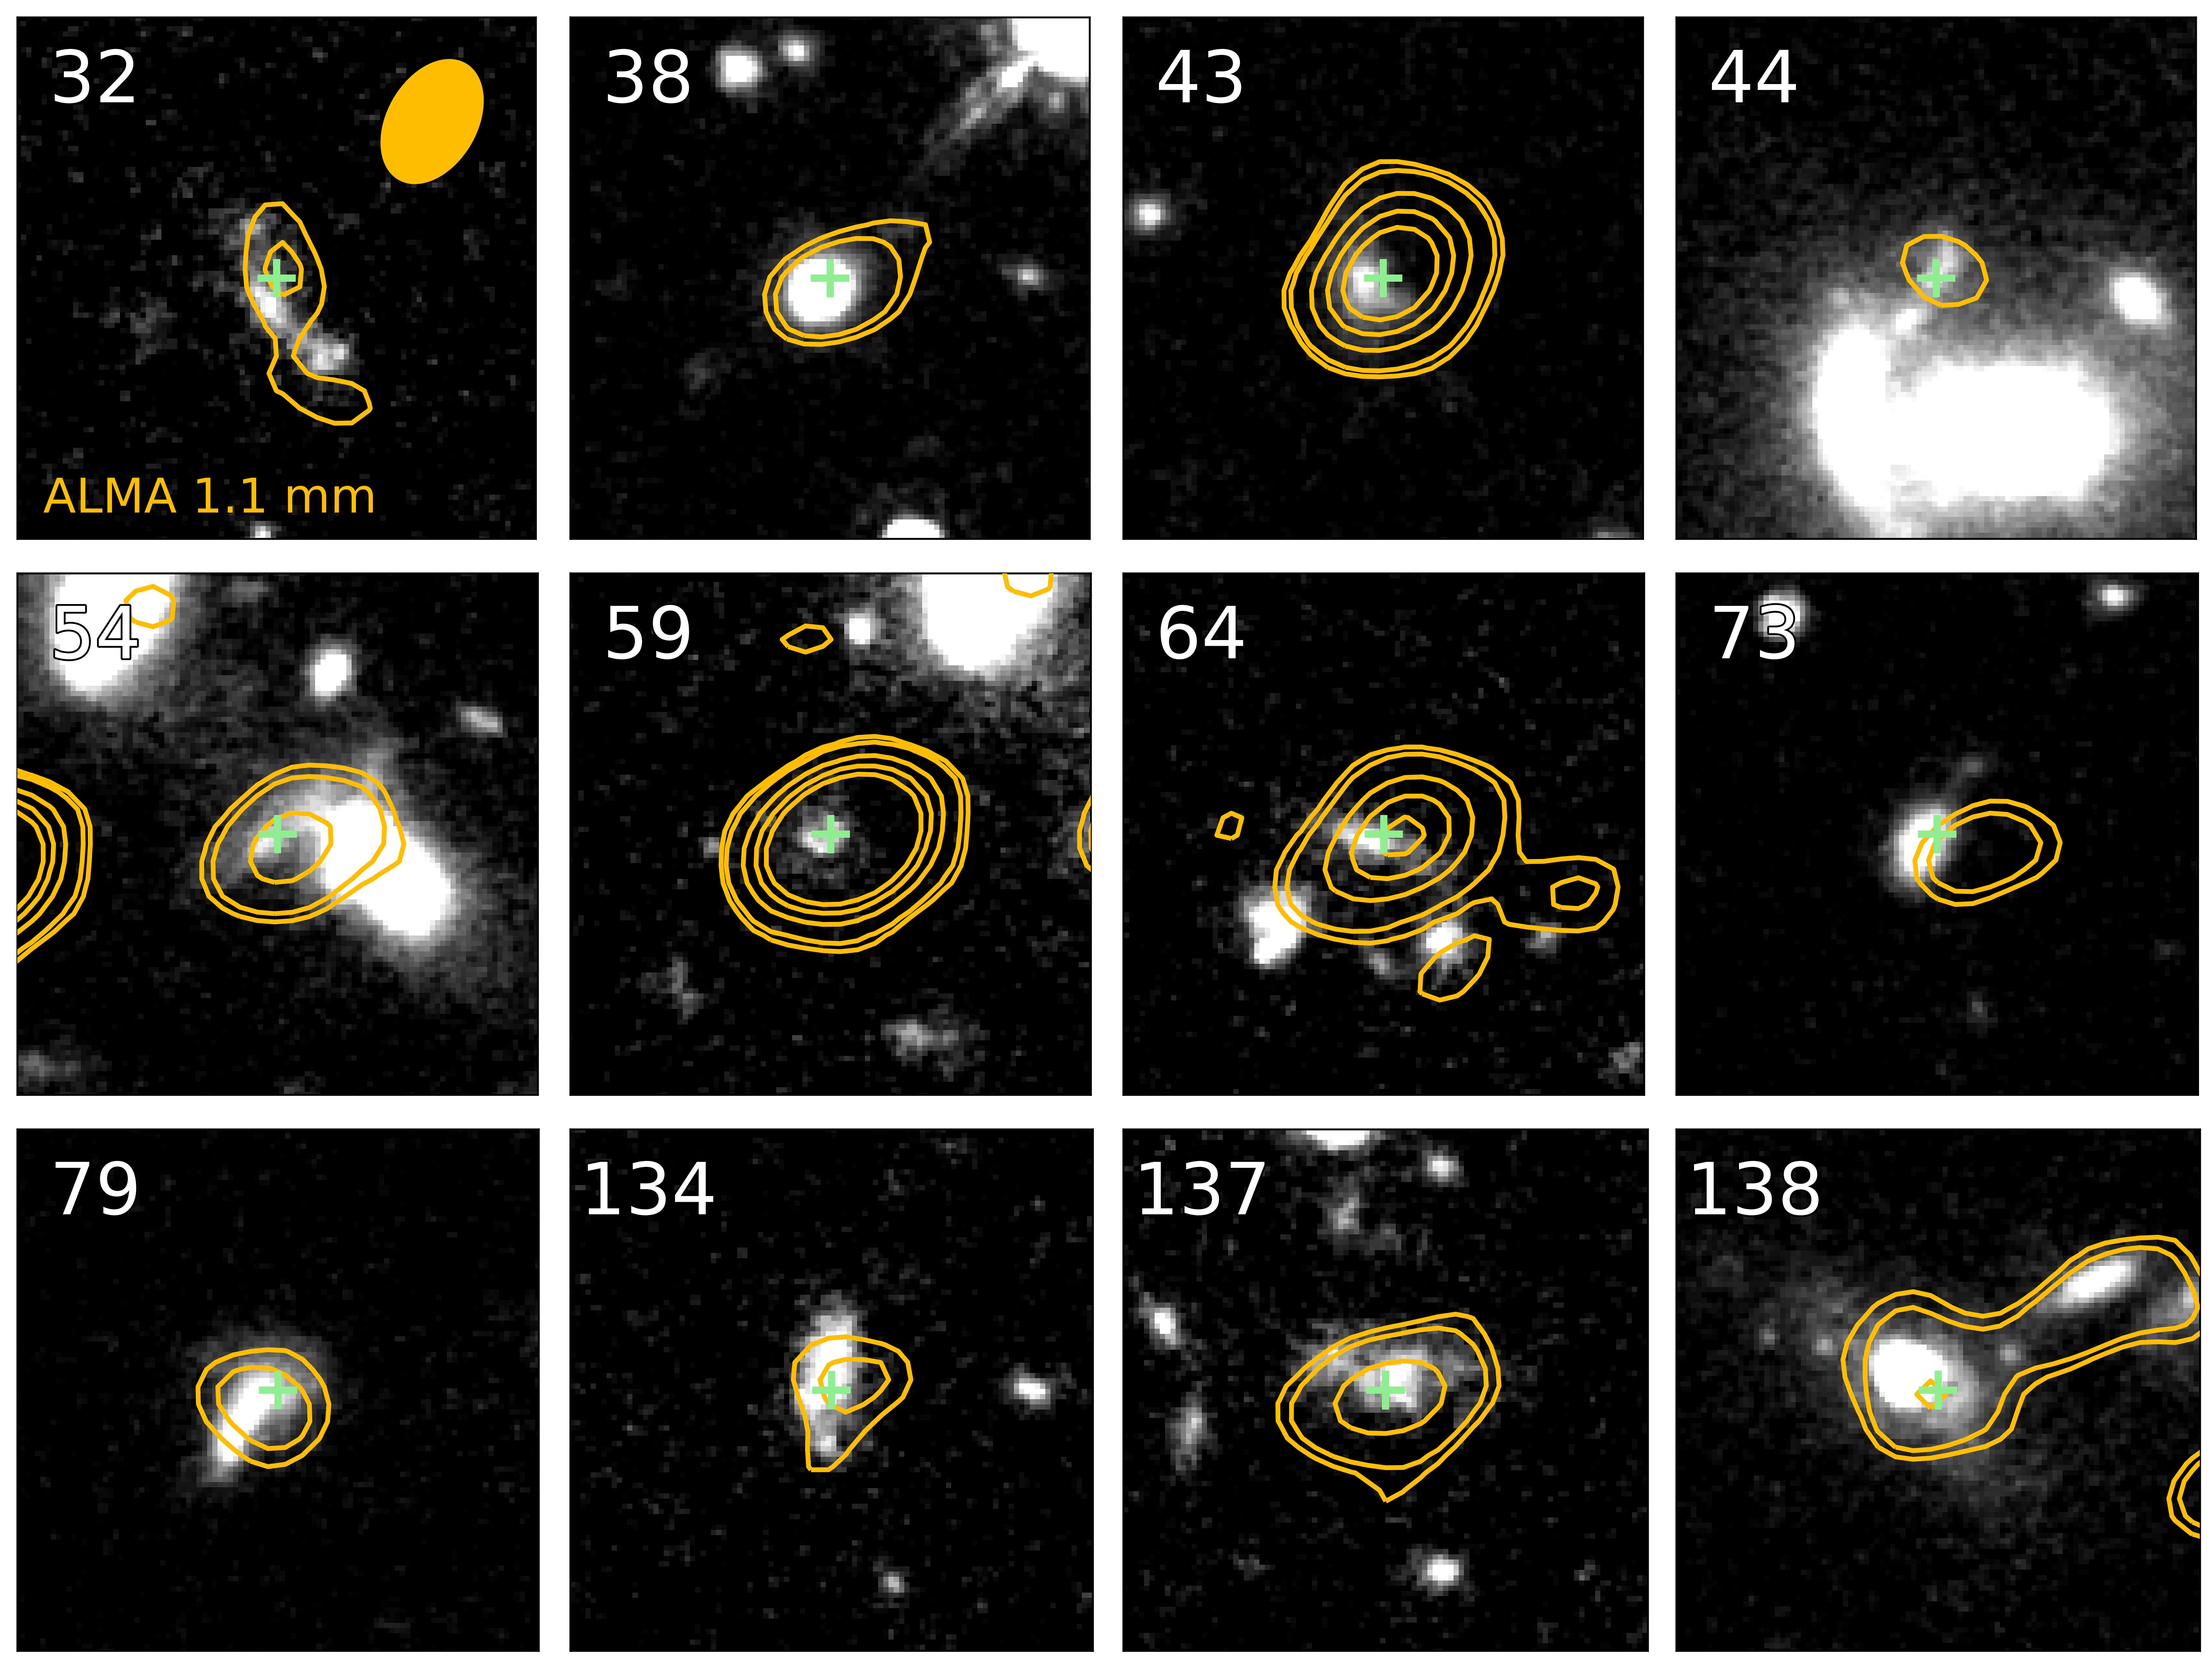
In order to determine a detection threshold, we count the number of positive/negative peaks as a function of the signal-to-noise ratio (S/N), as shown in Figure 2. No negative peaks below were found. It is suggested that, however, there is a systematic overestimation of fluxes due to the effect of noise and confusion called “flux boosting” (Scott et al., 2002; Umehata et al., 2017). Since the flux boosting effects become non-negligible at lower S/N, we regard detections as robust detections and 3.8–5 detections as tentative detections in the following analyses. In total, 19 and 11 sources were detected at and 3.8–5, respectively. As a result, we obtained nine HAEs with robust ALMA detection and three with tentative ALMA detection. The images of the 1.1 mm-detected HAEs are shown in Figure 3.
As for 18 1.1 mm sources left, ten sources have counterparts in the UV-to-optical images. None of the ten sources with the UV/optical counterparts satisfied the selection criteria of NB emitters or the color-color selections ( and ) used to select H emitters at in Shimakawa et al. (2018a). Therefore these ten sources are likely to be foreground/background sources.
Out of eight sources that do not have UV/optical counterparts, one source is located at arcsec away from the RG (a separate source located toward the right edge). Figure 4 shows the VLA 8.44 GHz image around the RG taken from the NRAO Science Data Archive111https://archive.nrao.edu/archive/archiveimage.html. We found that this 1.1 mm continuum source is spatially associated to a radio emission detected with VLA, which is called the southern hot spot in Pentericci et al. (2000). Therefore it likely corresponds to a jet ejected from the RG, and its 1.1-mm flux is probably dominated by the synchrotron emission from the radio jet.
Three sources among the 1.1 mm continuum sources without UV/optical counterpart are detected in ALMA 3 mm continuum maps (2016.1.00461.S; PI: M. Hayashi). We compared the photometries from UV-to-sub-mm (upper limit values are used for the UV-optical bands) with the average SED of ALESS sources with mag (da Cunha et al., 2015) by changing redshifts as done in Yamaguchi et al. (2019). The three sources are expected to be dusty sources at higher redshifts () from this comparison. As for the remaining four sources with no UV/optical counterpart, S/N of their 1.1 mm continuum fluxes is less than 5. Given their relatively low S/N, these four sources with no UV/optical counterpart may be false detections.
To summarize, in the 1.1 mm dust continuum maps, we find no additional plausible member galaxies except for HAEs. In the following analyses, we focus on nine HAEs with a robust detection and three HAEs with a tentative detection at 1.1 mm. As mentioned above, the 1.1 mm continuum fluxes of the HAEs with a tentative detection might be slightly overestimated due to the flux boosting effect. The measured 1.1 continuum fluxes of the HAEs after primary beam correction are summarized in Table 1.
We conducted some tests to check the validity of the flux measurements based on the peak flux. In the first place, we measured aperture photometry at the positions of the HAEs in the 1.1 mm continuum maps. We set a radius ( beam size) and measure the flux using a casa task imstat. RMS is calculated by running imstat at random positions in the 1.1 mm maps. The aperture fluxes are consistent with the peak fluxes within the margin of error, which means that the flux measurement based on the peak flux seems to be valid. Some of the HAEs (HAE 32, 64, and 138), however, have nearby companions with S/N in the 1.1 mm continuum maps as shown in Figure 3. The peak flux of the three HAEs might be contaminated by the continuum emission from their companions. We measured their fluxes by fitting a 2D Gaussian to the HAEs and their companions simultaneously with a casa task imfit. As for the HAEs, the positions were fixed to the coordinates measured in the NB image. As for the companions, the positions were fixed at the flux peak in the 1.1 mm maps. The peak fluxes measured with imfit of the three HAEs turned out to be 10–30 % smaller than the peak fluxes measured as a single galaxy. However, we confirmed that the gas to stellar mass ratios and star-formation efficiencies estimated from the two fluxes agree with each other within the uncertainties, which means that our final results are not affected by the flux contamination from nearby companions.
2.3 Physical quantities from ancillary data
Multi-wavelength photometries from UV to near-infrared (NIR) are available in USS1558. In addition to broad-band/NB images (, and NB2315 with Suprime-Cam and MOIRCS on Subaru), images taken with the Hubble Space Telescope (HST)/WFC3 are available (Hayashi et al., 2016). With the multi-wavelength data, the fundamental properties of galaxies, such as stellar mass, star formation rate (SFR), and effective radius (), have been already derived in the previous studies (Hayashi et al., 2012, 2016; Shimakawa et al., 2018a). We briefly introduce how to derive them in the following sections.
2.3.1 Stellar mass and SFR measurement
The stellar masses and SFRs of HAEs were estimated by Shimakawa et al. (2018a). The stellar mass was derived with the Spectral Energy Distribution (SED) fitting code, fast (Kriek et al., 2009). They used -band photometries for the SED fitting. The SFR was derived from the H NB fluxes with the Kennicutt (1998) prescription assuming the Chabrier (2003) IMF. The dust extinction is corrected for with the Calzetti et al. (2000) attenuation law and from fast assuming (e.g., Erb et al., 2006; Reddy et al., 2010, 2015).
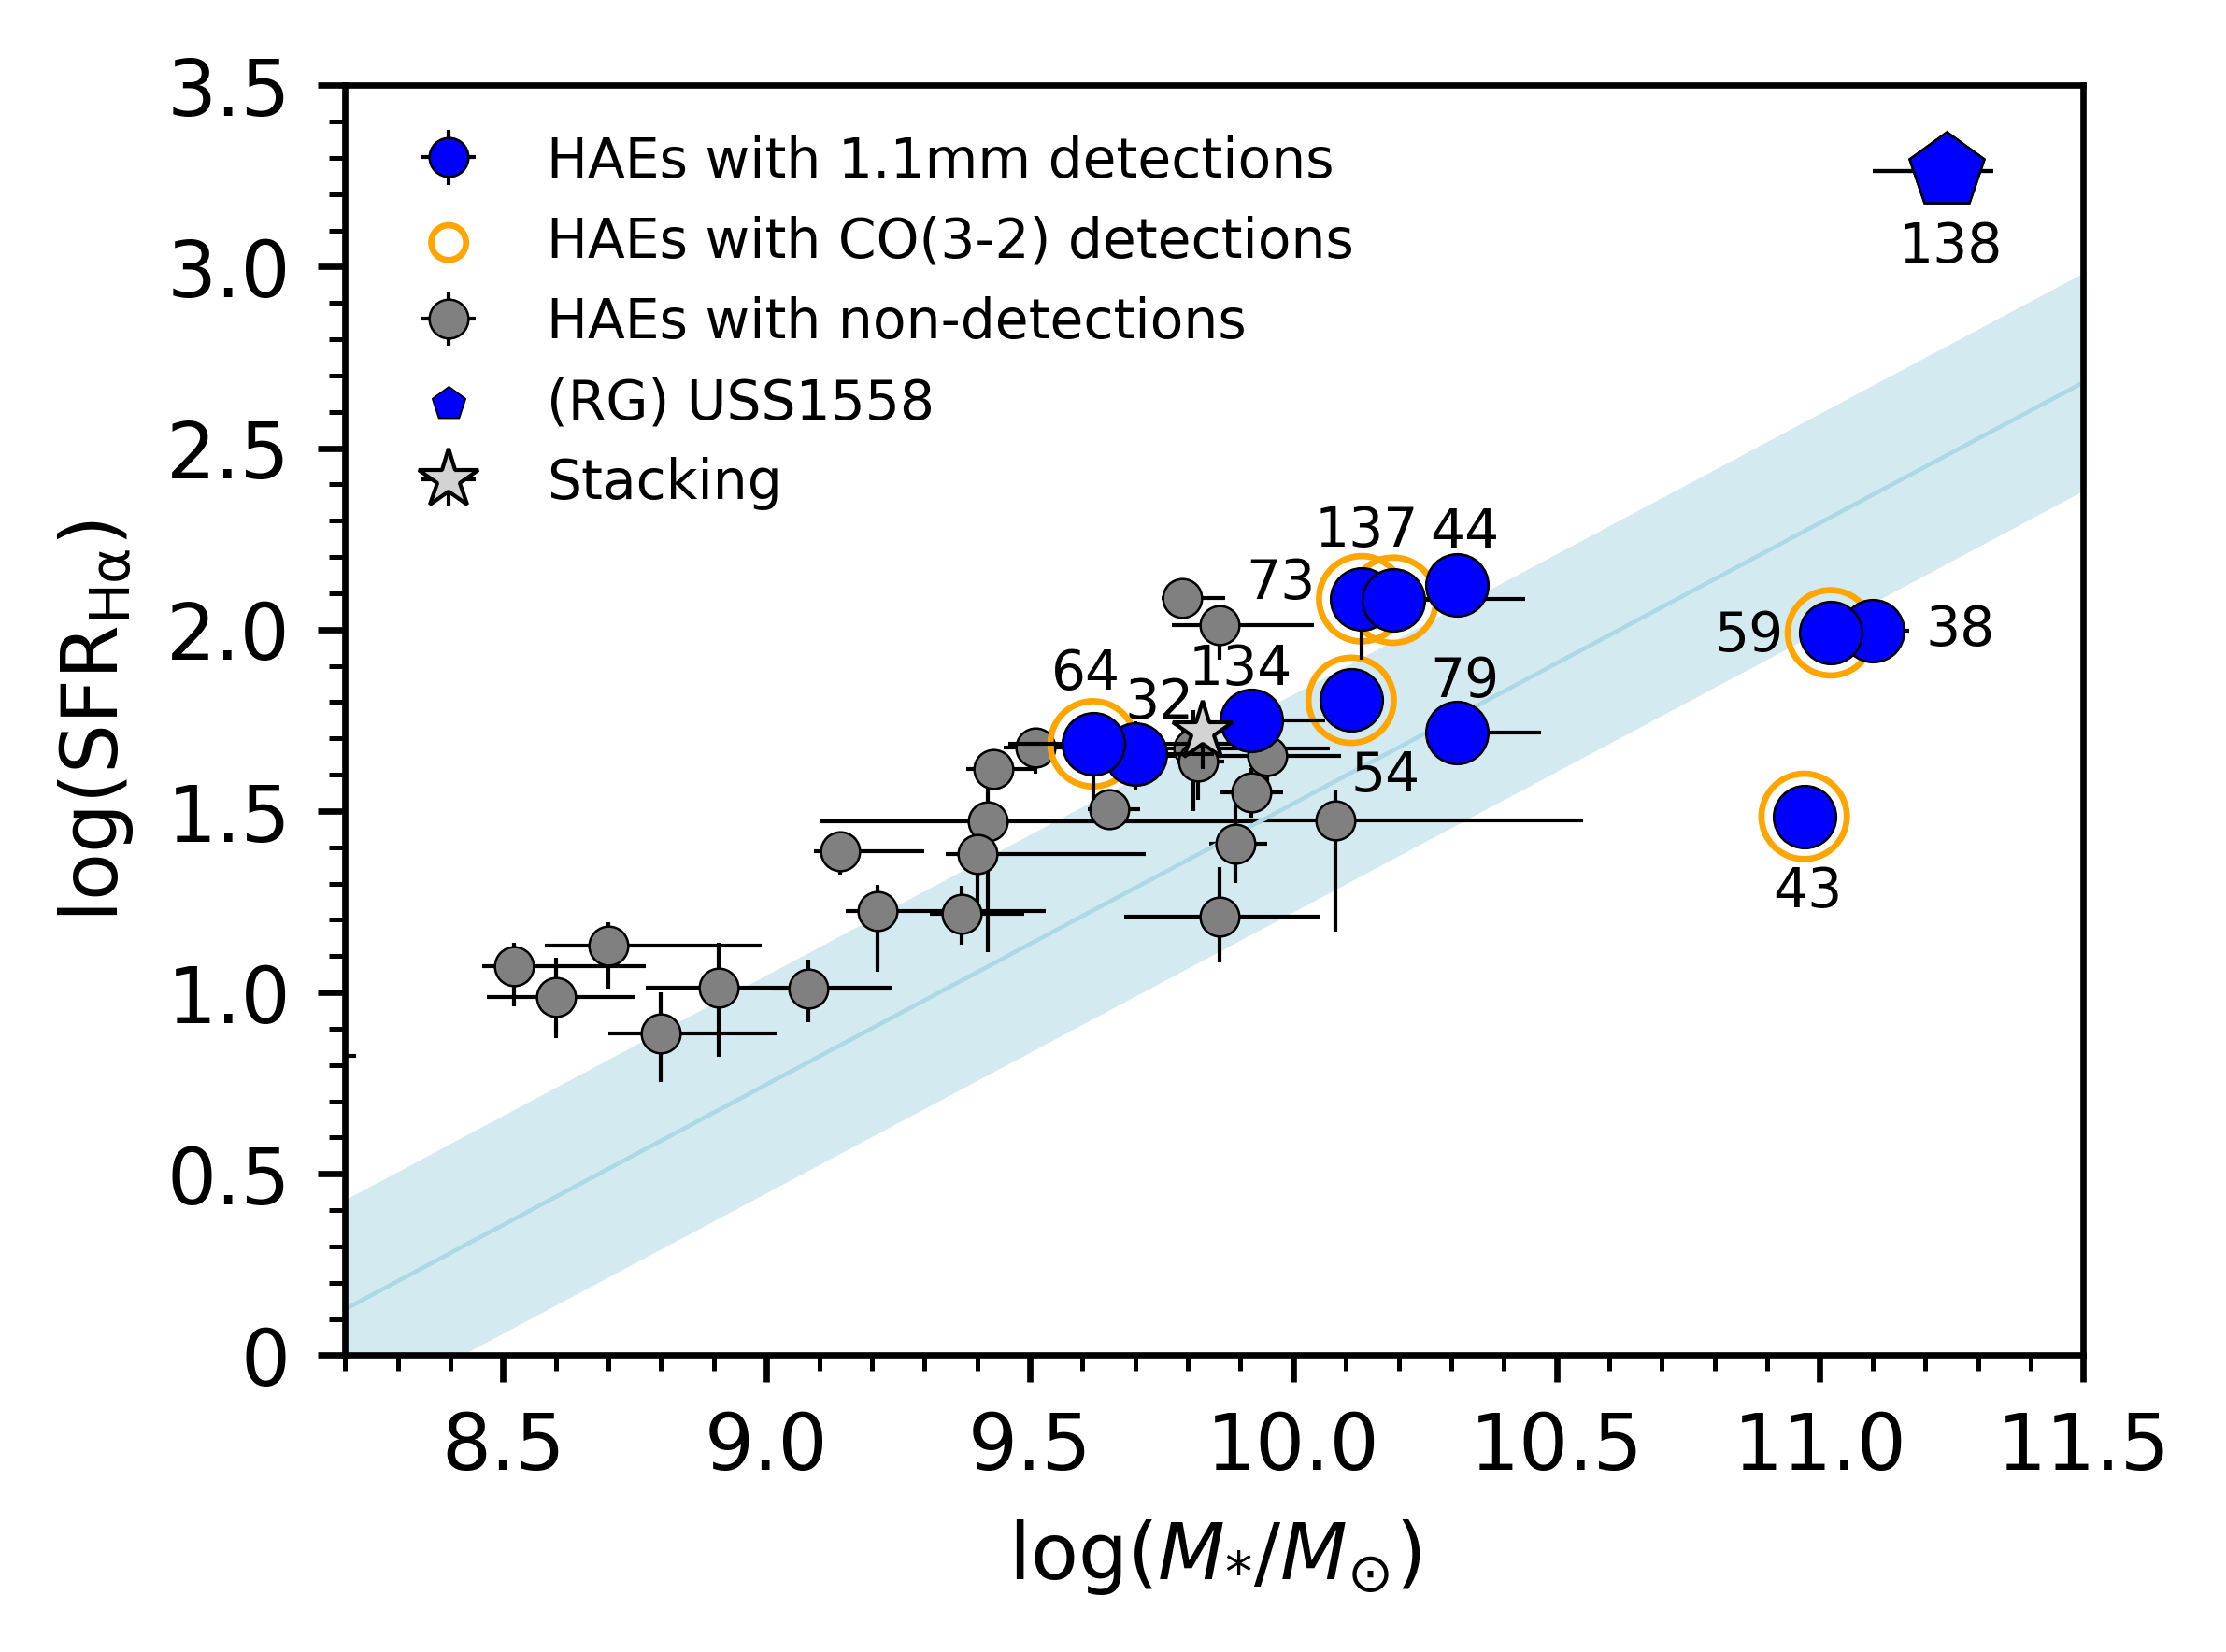
Figure 5 shows the relation between stellar mass and SFR for the HAEs in the two dense groups of USS1558. As shown in Shimakawa et al. (2018a), the majority of the HAEs in the dense groups are located dex above the –SFR relation (the so-called main sequence (MS) of star-forming galaxies) at from Speagle et al. (2014). We note that Chabrier (2003) IMF is consistently assumed here (The original –SFR relation in Speagle et al. (2014) assumed the Kroupa (2001) IMF). RG (ID138) is an only X-ray source with in these regions (Macuga et al., 2019). Note that the SFR of RG from H luminosity may be overestimated due to the contribution from the active galactic nuclei (AGN).
We also estimated SFRs using a different SED fitting code, magphys (da Cunha et al., 2008, 2015). We used ancillary photometry as mentioned above and 1.1 mm continuum flux for SED fitting. We confirmed that the SFR from magphys are consistent with the H-based SFR at least for the HAEs located above the main sequence, which means that the enhanced star-formation activities observed in the dense cores seem to be valid.
2.3.2 Size measurement
The half-light radii of the HAEs were estimated by Shimakawa et al. (2018a). They measured the size from F160W images by using galfit the version 3.0 code (Peng et al., 2010). They use SExtractor (Bertin & Arnouts, 1996) to get the initial parameters needed for fitting. As for HAE44 and HAE54, half-light radii were not estimated in the previous study because these two HAEs are close to bright sources. We measured the half-light radii of the two HAEs by masking the nearby bright sources with a segmentation map from SExtractor.
We note that the estimated size of HAE59 ( kpc) is a factor of 3 larger as compared to the mass-size relation of star-forming galaxies at similar redshifts (van der Wel et al., 2014). Given that this source is relatively faint in the F160W image with mag as compared to the other HAEs, galfit might not be able to well fit the structural properties of this source, and thus, overestimate its size.
3 Analysis
3.1 Gas mass estimation
As for HAEs detected with both dust continuum and CO(3–2) line, we derive molecular gas masses with the two tracers to check the consistency between them (Section 4.1). We describe how to derive the molecular gas mass with each tracer below.
3.1.1 CO-based gas mass
We derived molecular gas masses from the CO(3–2) emission line as done in Tadaki et al. (2019). We used CO(3–2) line fluxes measured by Tadaki et al. (2019) but assumed different line ratios between CO(3–2) and CO(1–0) as discussed in Section 4.1. Molecular gas mass considering a metallicity-dependent conversion factor of is derived as follows:
| (1) | |||
| (2) | |||
| (3) |
where is a conversion factor of -to-(–1) transition CO line luminosity to a molecular gas mass, , , and is the correction factor of metallicity dependence of (Tacconi et al., 2018). Here, is the gas-phase metallicity measured with [NII]/H ratio and a calibration relation by Pettini & Pagel (2004). The gas-phase metallicities for the CO(3–2)-detected HAEs are inferred from their stellar masses and the mass–metallicity relation in Genzel et al. (2015) (Equations 12a). The metallicity correction factor for galaxies with and is , and , respectively. In Tadaki et al. (2019), the line ratio between CO(3–2) and CO(1–0), , is assumed to be 0.56 (Genzel et al., 2012). values for star-forming galaxies at high redshifts reported in the literature show a large ( 0.2 dex) variety (e.g., Aravena et al., 2014; Daddi et al., 2015; Sharon et al., 2016; Riechers et al., 2020). On top of that, a variation in yields dex uncertainties (Genzel et al., 2012). We will discuss the assumption of for the HAEs in USS1558 in Section 4.1. Considering these errors, and add them in quadrature, the measurement of CO-based molecular gas mass yields 0.25 dex of systematic error in total.
3.1.2 Dust-based gas mass
We derived molecular gas masses with the Rayleigh-Jeans (RJ) dust continuum method presented in Scoville et al. (2016, hereafter S16). The dust emission at RJ-tail () can be used as a probe of global cold gas mass. S16 empirically calibrated the conversion factor from dust continuum luminosity at RJ-tail to gas mass using 145 galaxies, including star-forming galaxies and starburst galaxies at low redshifts and sub-millimeter bright galaxies (SMGs) at 2–3. The molecular gas mass is given by
| (4) |
where is the luminosity distance and . The dust spectral index is assumed to be 1.8. The correction term from RJ to Plank function is given by
| (5) |
and . The dust temperature is assumed to be , a typical value of the mass-weighted temperature in the local star-forming galaxies (S16).
S16 selected massive galaxies with , which have similar gas-phase metallicities as the solar value, for their calibration. Their sample galaxies are expected to have an almost constant dust-to-gas mass ratio of . The gas-to-dust mass ratio is included in the conversion factor. Because our sample consists of less massive galaxies than those used in the calibration by S16, we tried to consider the metallicity effects of this method further. As in Section 3.1.1, we infer the gas-phase metallicity from the mass–metallicity relation presented by Genzel et al. (2015). We then use the relation between the dust-to-gas mass ratio () and the gas-phase metallicity given in Genzel et al. (2015) in order to correct for the metallicity dependence as follows:
| (6) | |||||
| (7) | |||||
| (8) |
The metallicity correction factor for galaxies with and is , and , respectively.
We assume that the HAEs in USS1558 follow the mass–metallicity relation for field galaxies at similar redshifts. How the mass–metallicity relation of star-forming galaxies depends on the environments at has been discussed, and it is not conclusive yet (e.g., Valentino et al., 2015; Shimakawa et al., 2015a; Kacprzak et al., 2015; Chartab et al., 2021). Shimakawa et al. (2015a) investigated the average gas-phase metallicities of HAEs in USS1558 by conducting stacking analyses, and they only gave the upper limits to the metallicities for the HAEs with . It is still unclear whether the HAEs in USS1558 have a different mass–metallicity relation or follow the same relation as field galaxies. Therefore, we have decided to use the mass–metallicity relation for field galaxies.
When we use the mass–metallicity relation for protocluster galaxies shown in Shimakawa et al. (2015a), molecular gas masses become 0.2 and 0.1 dex lower for galaxies with and , respectively. We note that our results are not significantly affected by the assumed mass-metallicity relations when taking into account the uncertainties on our gas mass measurements and the scatter of the field gas scaling relations (Section 4.3). We would need individual metallicity measurements for more precise metallicity correction. We note that we do not consider the flux boosting effect on our 1.1 mm continuum flux measurement (Section 2.2). The estimated molecular gas masses of the two sources with S/N 3.8–5.0 (HAE 32, 44, and 134) maybe overestimated due to the flux boosting effect.
The uncertainty on the conversion factor in S16 causes dex uncertainty on the estimated molecular gas masses. Since the mass–matallicity relation has a scatter of dex as well, our molecular gas measurement based on the dust continuum emission has a systematic uncertainty of dex in total. We also note that, because the impact of AGN contribution peak in mid-IR but trails off in longer wavelength, the molecular gas estimation is not suffered significantly from the AGN contribution (Kirkpatrick et al., 2012; Brown et al., 2017).
3.2 Stacking analysis
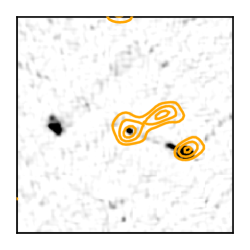
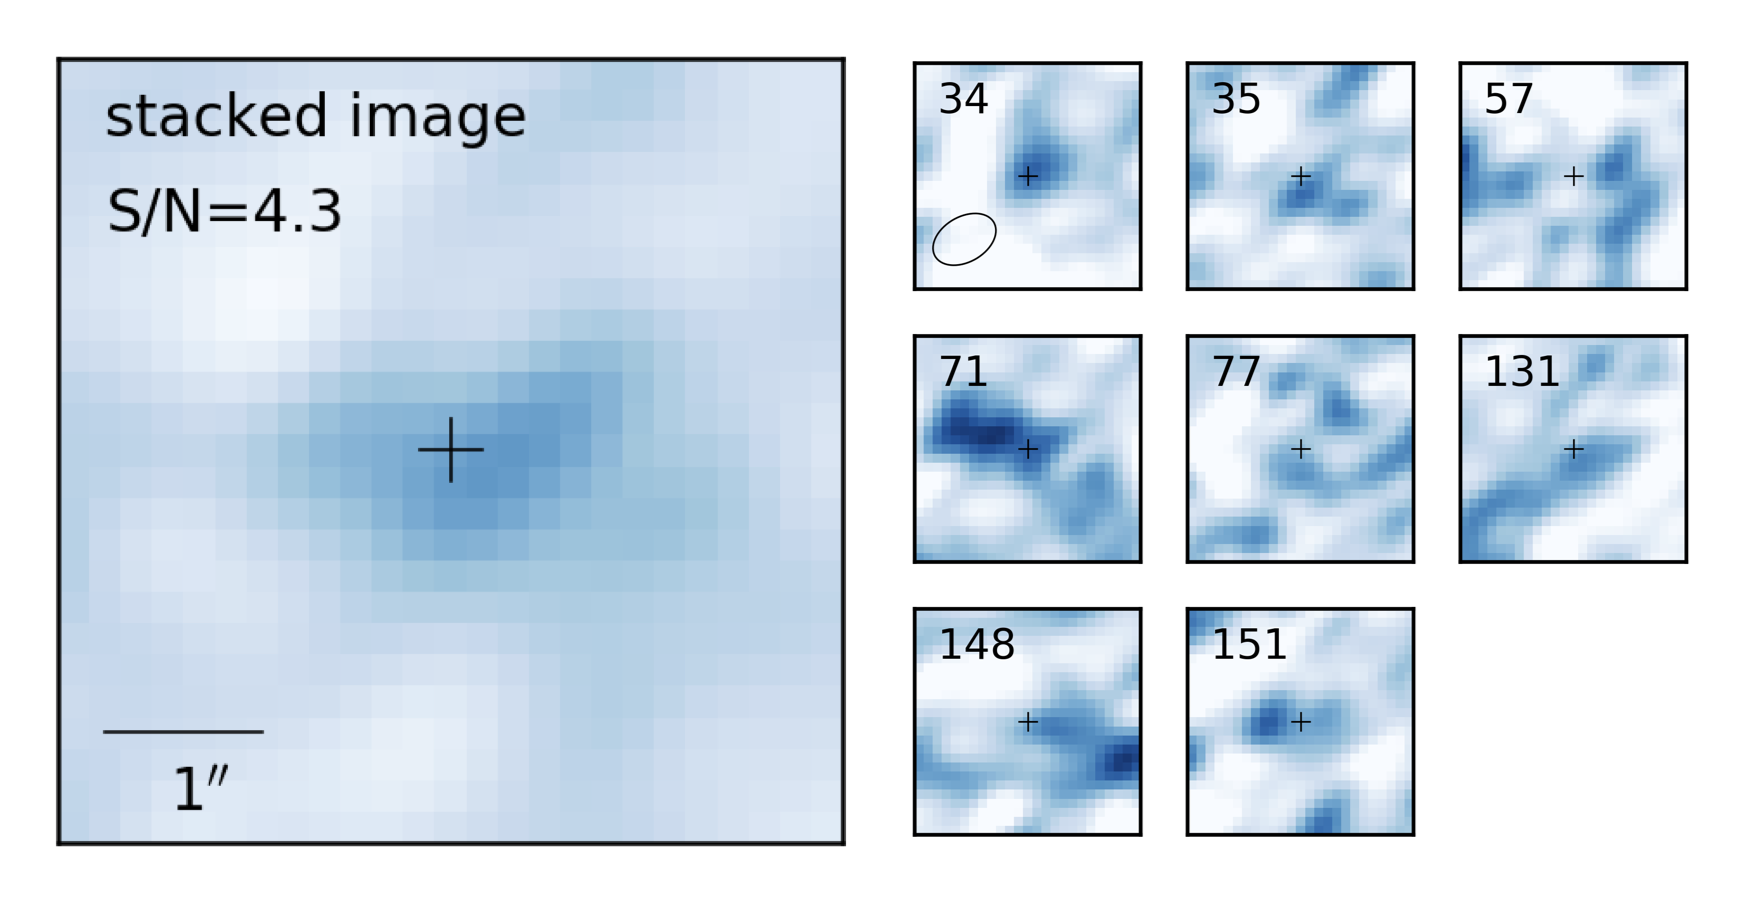
As shown in Figure 5, the detection rate is high (9/10) for massive galaxies with but low for less-massive galaxies (3/12) with . In order to investigate the average gas properties of less massive galaxies, we conducted a stacking analysis for less massive galaxies. We choose the non-detected HAEs with . We excluded one HAEs contaminated by nearby bright sources in Band-6 continuum maps. We stacked the cutout images of the remaining eight HAEs at the position determined in the Subaru/MOIRCS NB image. Figure 6 shows the stacked image and the cutout images of the HAEs used for stacking. The stacked image has significance at the center, which satisfies our detection criterion (Section 2.2).
=0.002in {rotatetable*}
| aaFrom Shimakawa et al. (2018a). | aaFrom Shimakawa et al. (2018a). | aaFrom Shimakawa et al. (2018a). | aaFrom Shimakawa et al. (2018a). | aaFrom Shimakawa et al. (2018a). | aaFrom Shimakawa et al. (2018a). | aaFrom Shimakawa et al. (2018a). | bbCorrected for the primary beam attenuation. | ccDerived from CO(3–2) line fluxes from Tadaki et al. (2019) using method described in Section 3.1.1. is assumed to be 0.53. | |||
|---|---|---|---|---|---|---|---|---|---|---|---|
| (J2000) | (J2000) | ||||||||||
| ddTentative detection. | |||||||||||
| ddTentative detection. | |||||||||||
| ddTentative detection. | |||||||||||
| eeRadio galaxy. | – |
Note. —
4 Result/Discussion
4.1 Comparison between CO-based and dust-based molecular gas masses
When using CO(3–2) line to estimate molecular gas masses, we need a line ratio between CO(3–2) and CO(1–0) (). The CO excitation state in star-forming galaxies is one of the uncertainties in molecular gas mass estimation based on high-J CO lines. Observations of nearby galaxies indicated that the mean line ratio () is about , but it spans a wide range () across various galaxies (Yao et al., 2003). Mao et al. (2010) discussed by using more than 60 nearby galaxies, finding that active galaxies such as starbursts and AGNs tend to have higher values than normal star-forming galaxies (Aravena et al., 2010; Swinbank et al., 2010; Ivison et al., 2011).
As for the ratio for galaxies at high redshifts, some studies reported a similar mean ratio of with a large dispersion for a handful of galaxies (Aravena et al., 2014; Daddi et al., 2015). On the other hand, Sharon et al. (2016) indicated a higher value of for DSFGs at . Moreover, Riechers et al. (2020) obtained a mean ratio of for the galaxies selected with CO(3-2) line strength, suggesting that the CO(3-2)-selected galaxies tend to have higher CO line excitation on average.
The CO excitation states of galaxies residing in high-density environments are not well-understood yet. Coogan et al. (2018) investigated the gas excitation of galaxies in the cluster CL J1449+0856 at . They found high gas excitation, as seen in the starbursts, implying that environments can impact the CO excitation states through galaxy interactions/mergers. a
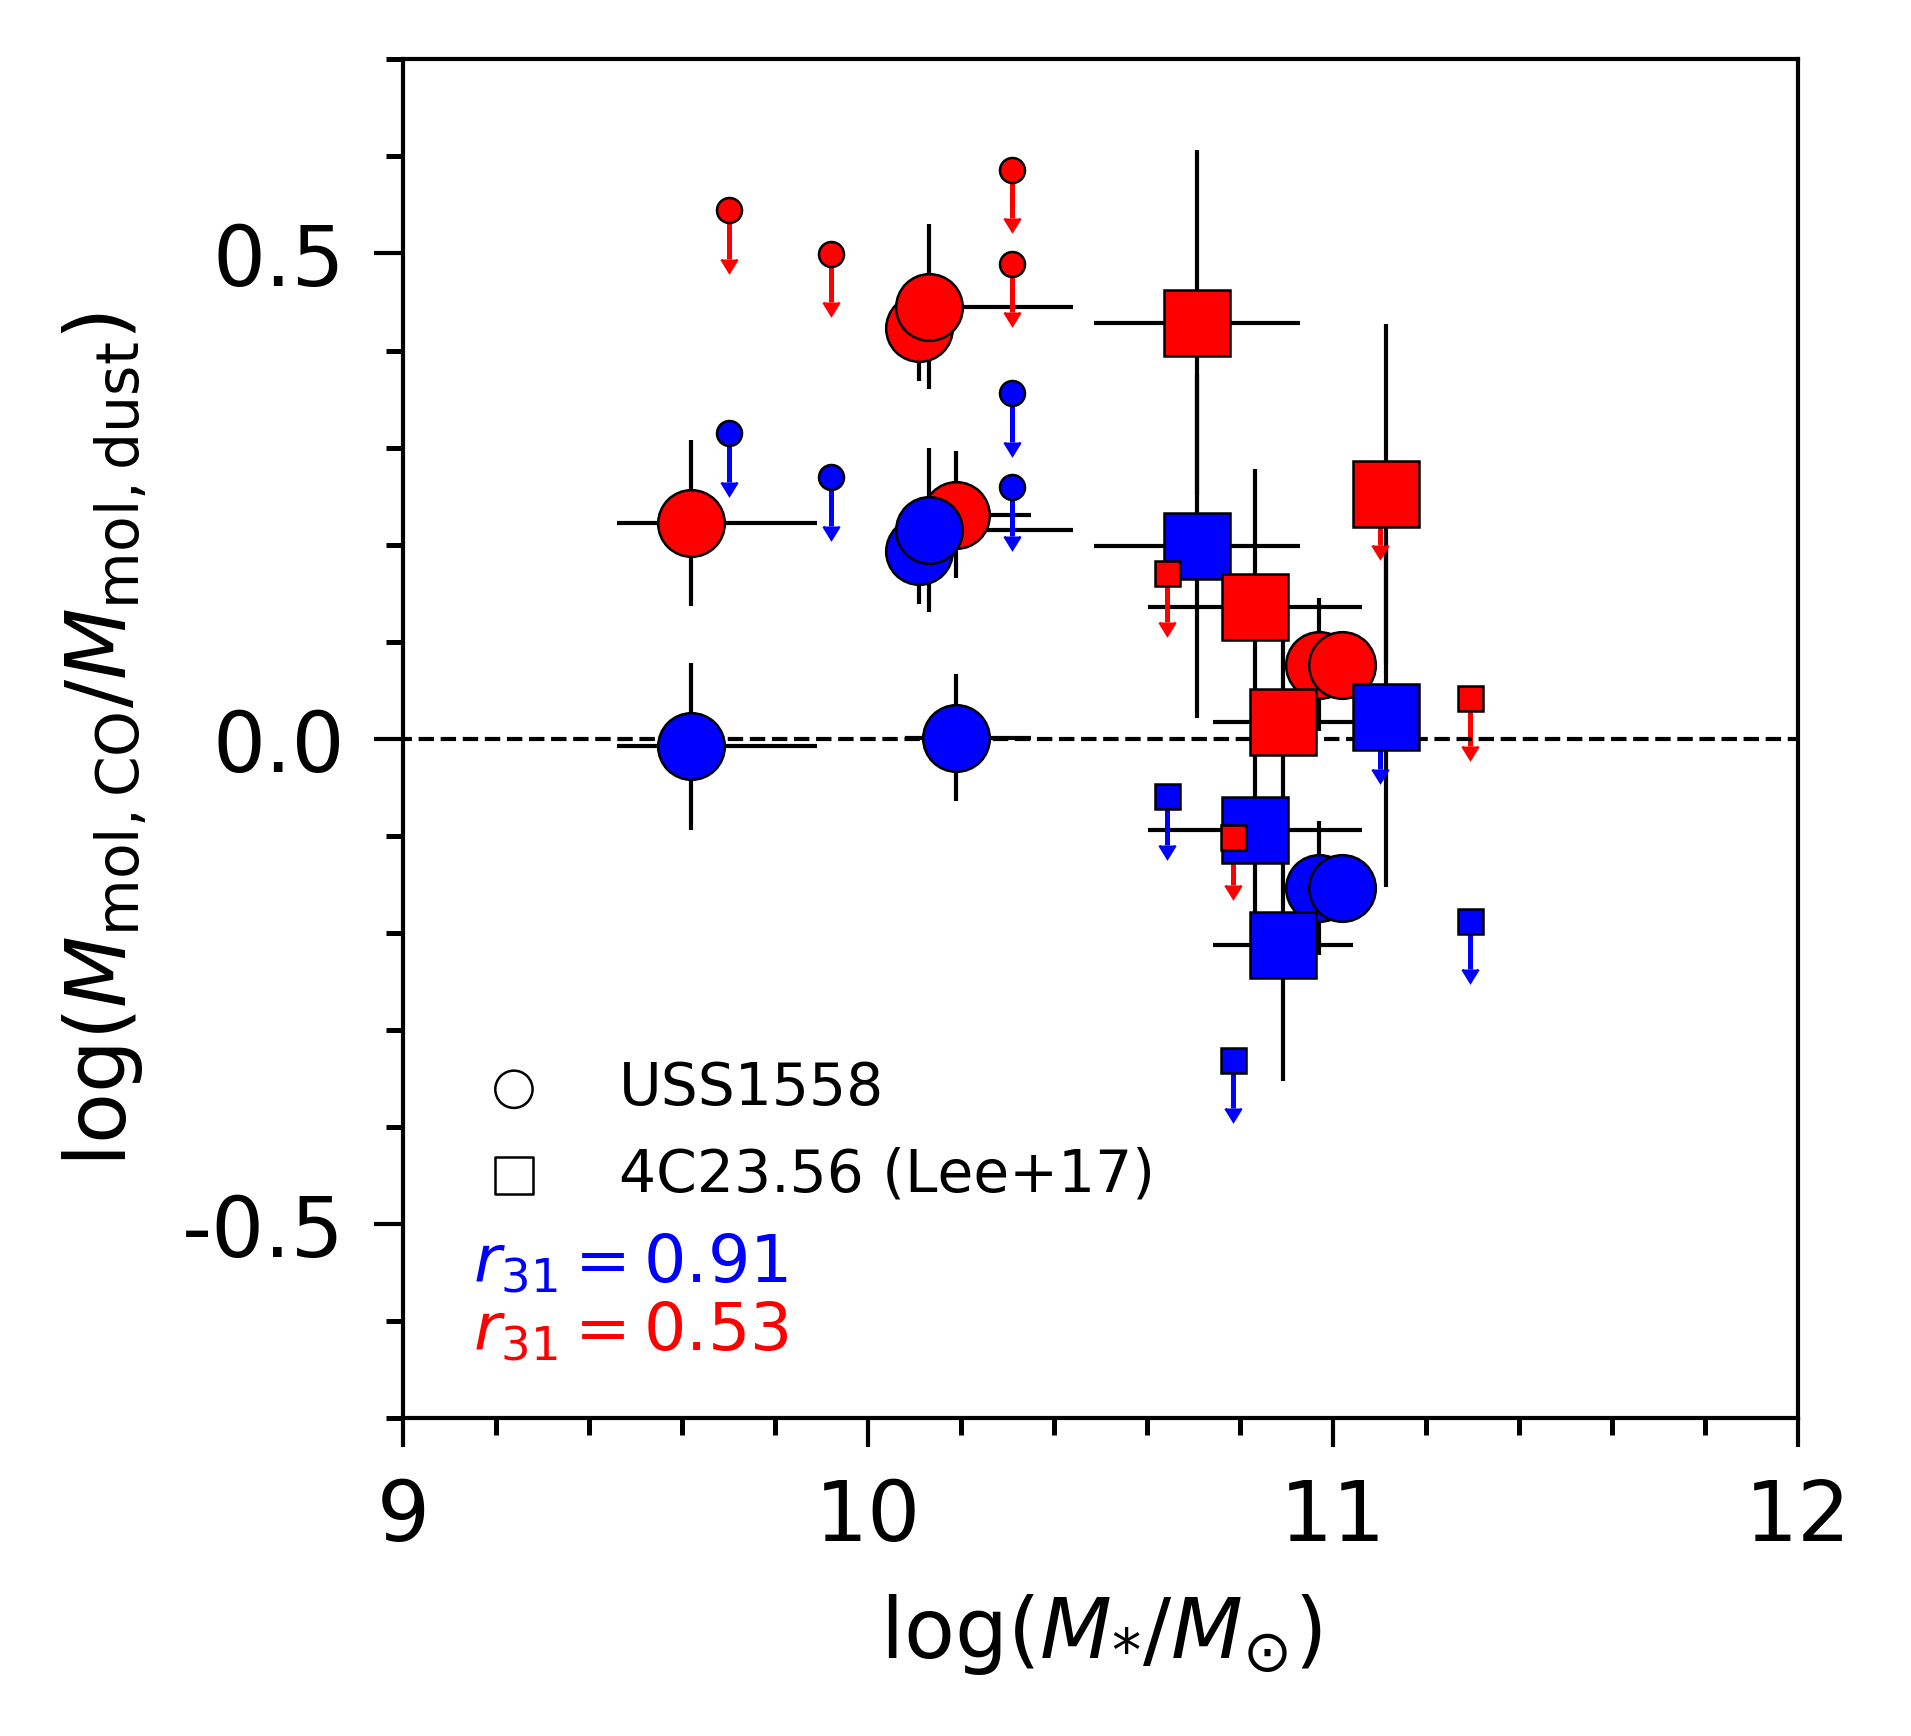
Figure 7 shows the difference between the two gas mass measurements as a function of stellar mass for the HAEs in USS1558. We also show star-forming galaxies in a different protocluster at , 4C23.56, from Lee et al. (2017) to increase the number of galaxies on this plot. In 4C23.56, similar observational data, such as NB imaging data and ALMA Band-3 and 6 data, are available (Lee et al., 2017). As for the CO(3–2)-based gas masses, we here assume two different values, namely, 0.53 (Lee et al., 2017) and 0.91 (a typical value of CO(3–2)-detected galaxies at 2–3; Riechers et al., 2020). In the case of , we find that the CO(3–2)-based gas mass tends to be higher than the dust-based gas mass for the HAEs in the two protoclusters. The difference between the two gas measurements appears to become larger for less massive galaxies with (Figure 7).
This result suggests that a higher value would be more applicable for the HAEs in USS1558, especially less massive ones, in terms of the consistency between the two gas mass measurements. As shown in Figure 5, the HAEs with in USS1558 have systematically high SFRs than the MS of star-forming galaxies at the same redshift. Given that a positive correlation between the CO excitation and SFR surface density is reported (Daddi et al., 2015), the high star-forming activities of the HAEs in USS1558 may lead to a high CO excitation state within them. We note that the individual measurements of are necessary in order to confirm whether the HAEs in USS1558 have a high CO excitation state on average and to investigate how the excitation states correlate with their star-forming activities.
Tadaki et al. (2019) estimated the CO(3–2)-based gas masses of the HAEs in USS1558 assuming . When a higher is more applicable for the HAEs in this protocluster as suggested above, their gas mass values might be overestimated by a factor of 1.5.
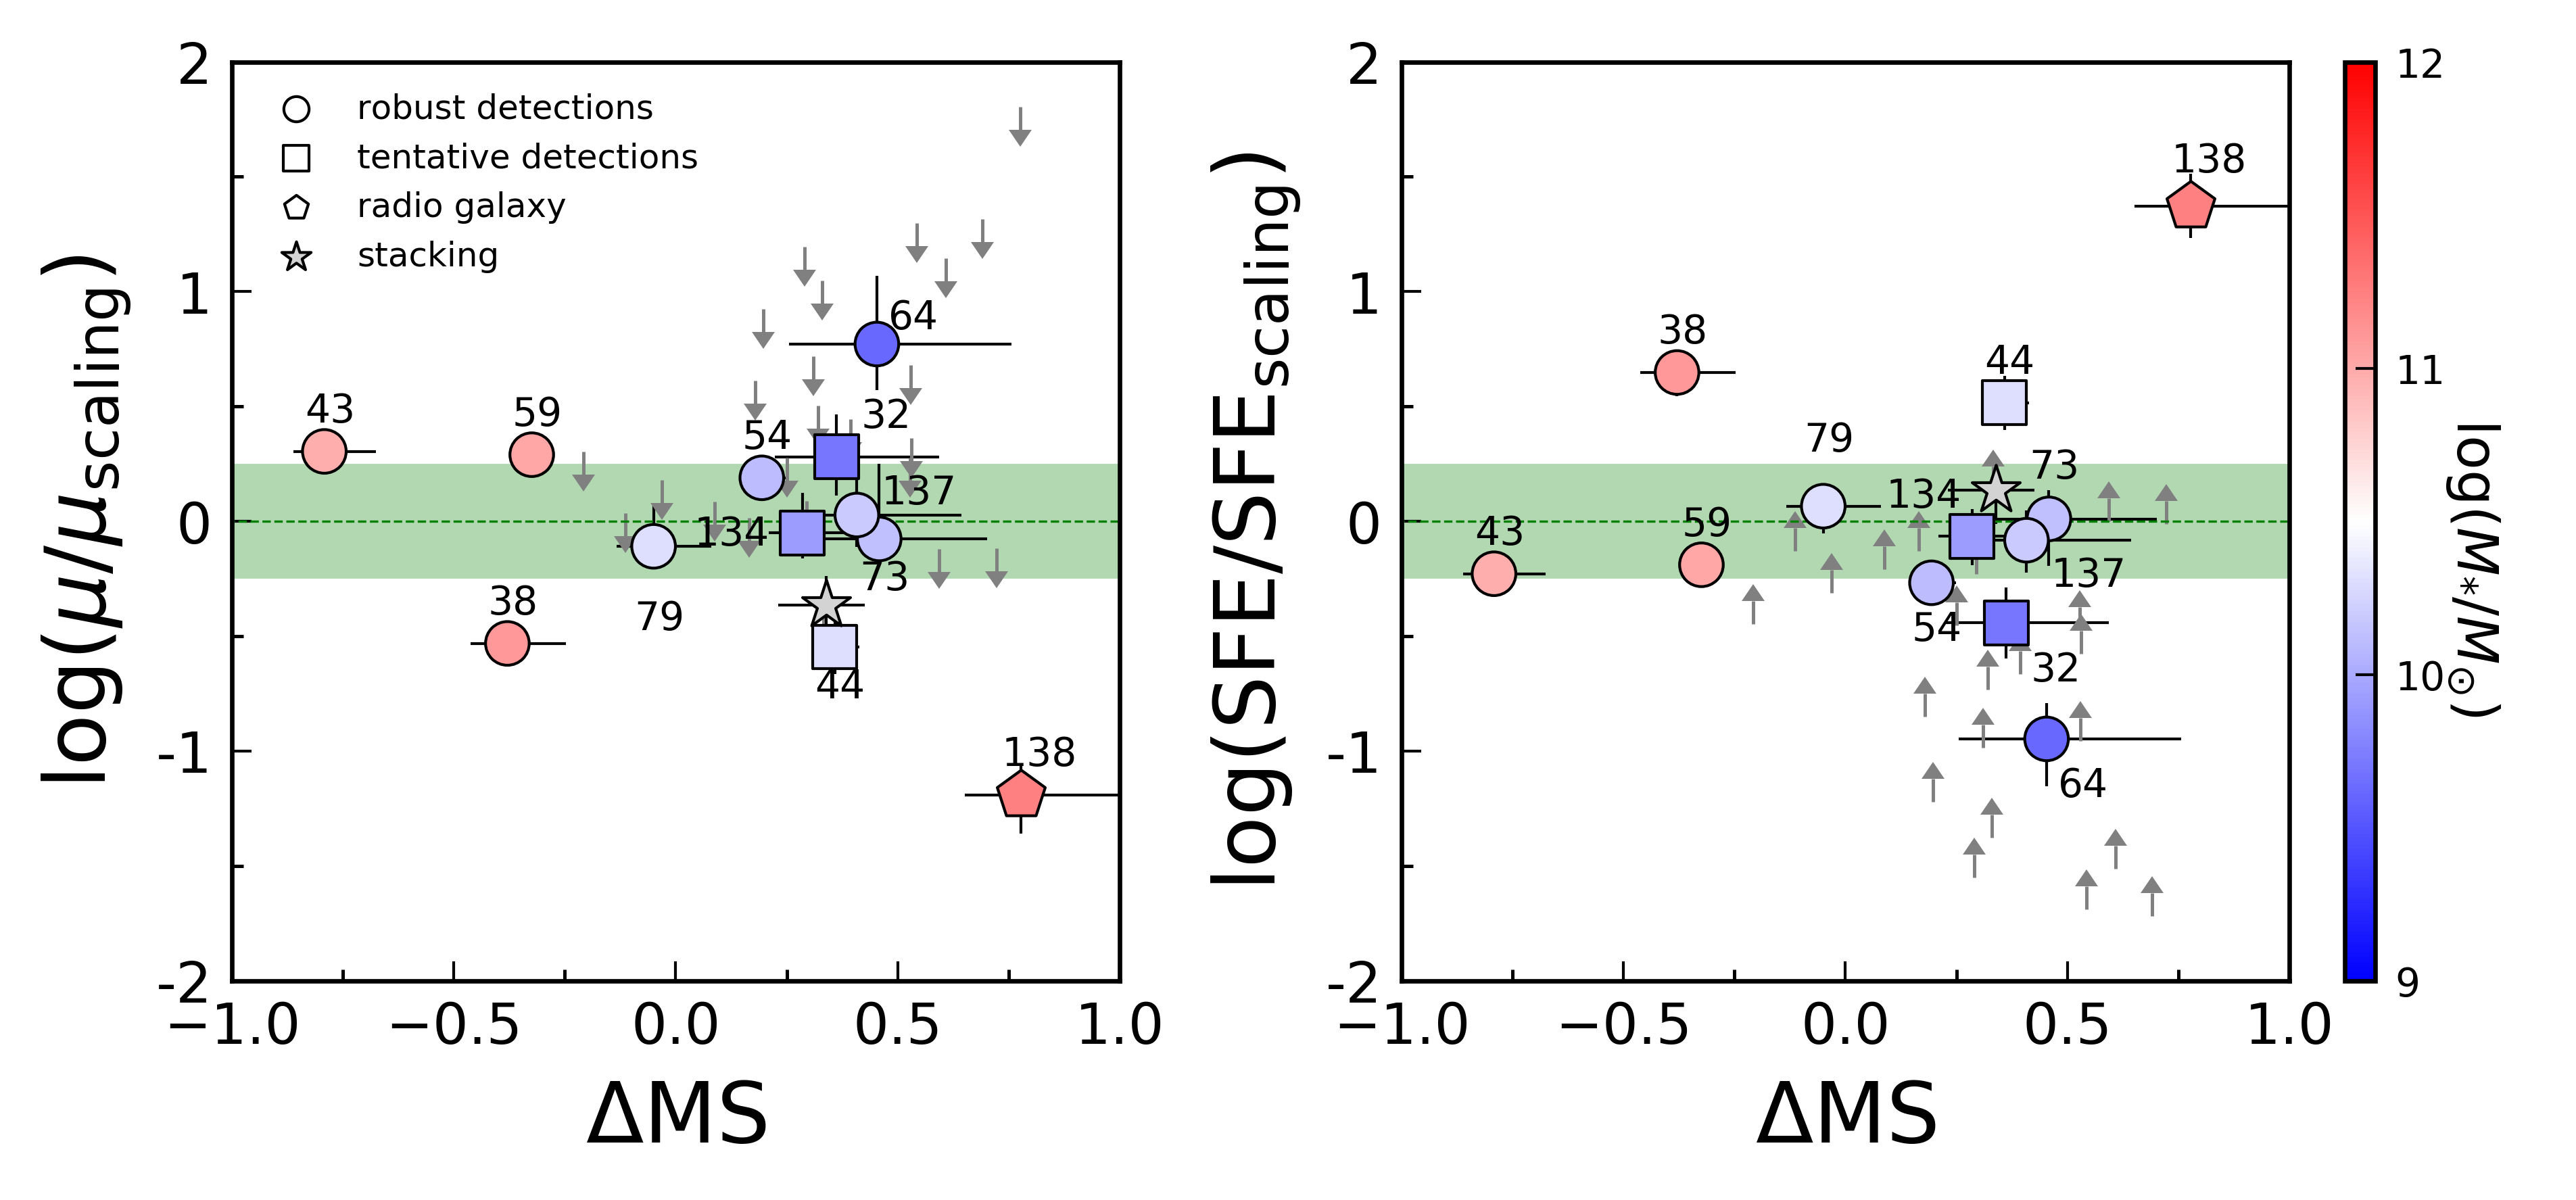
4.2 Comparison with field galaxies on the MS
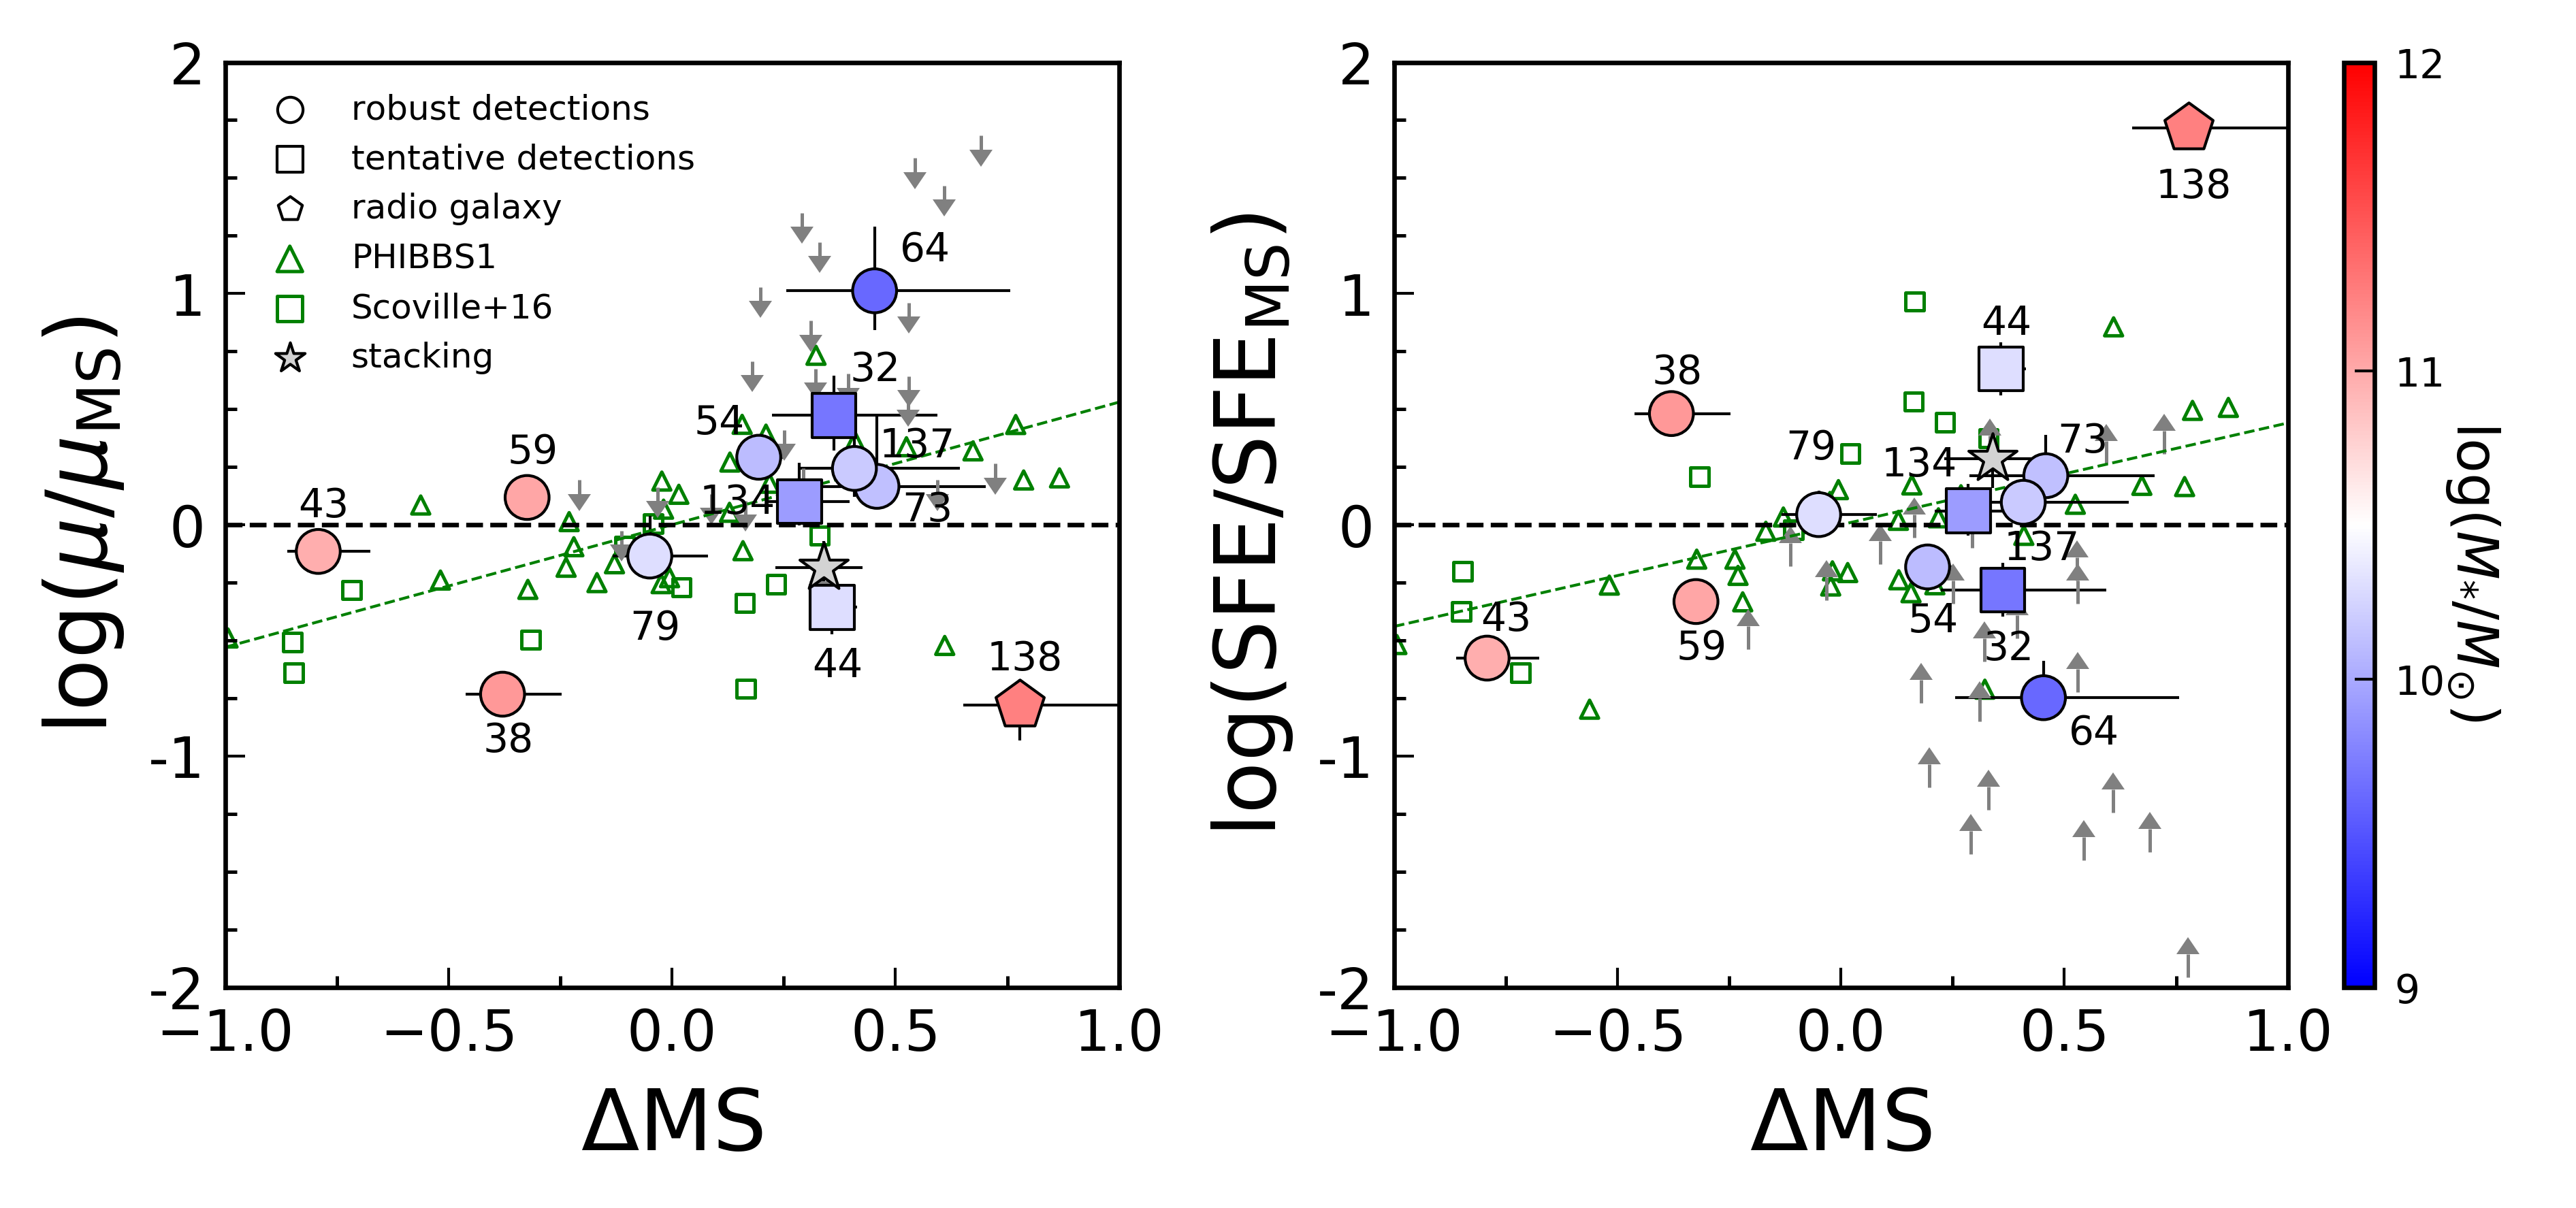
Figure 8 shows the gas properties, namely, gas mass to stellar mass ratio () and star-formation efficiency (SFE), as a function of the deviation from the MS (). Those quantities are normalized by the expected values from the gas scaling relation (Tacconi et al., 2018) with . This is equivalent to a comparison of protocluster galaxies to the field galaxies on the MS at a given stellar mass. We find that the protocluster galaxies with larger tend to be more gas-rich and have higher SFEs, but they still seem to follow the same relations for the field galaxies shown with the dashed line in Figure 8. The protocluster galaxies tend to be slightly more gas-rich than the field MS galaxies, but they form stars according to their gas contents just like the field galaxies equally above the main sequence do.
The slightly higher gas mass ratios seen for protocluster galaxies might be partly attributed to the effective cold accretion by cold streams along the surrounding filamentary structures. At the earlier stage of cluster formation, cold gas can be efficiently supplied through cold streams penetrating the hot ICM (Dekel et al., 2009), while such cold mode accretion is prevented by hot ICM in matured clusters such as X-ray clusters. The dynamical masses of F1 and F2 groups are estimated to be and , respectively, assuming a local virialization (Shimakawa et al., 2014). This protocluster is thought to be yet in the accretion-dominated phase before it becomes to an accretion-inefficient phase (Dekel et al., 2009). In addition, Shimakawa et al. (2017) found that Ly emitters in this field are distributed so as to avoid the densest protocluster core regions traced by HAEs. This indicates that Ly emissions from those HAEs in the densest regions are suppressed by the associated, abundant Hi gas and/or larger dust contents in the HAEs in the densest regions. This result also supports the idea that this protocluster is in a young, accretion-dominated phase, and thus, member galaxies can efficiently obtain gas from the outside.
Galaxy interactions or mergers are also expected to be happening in the cores of this protocluster. In dense regions, a merger rate is naturally expected to be higher than that in the field. Jian et al. (2012) reported such a trend using semi-analytic models and showed that the merger rate peaks in the halos in the mass range of , which corresponds to group environments. In fact, HAE32 and HAE64, which are the most gas-rich galaxies among our sample (Table 1 and Figure 8), are accompanied by another HAE. The projected distance to the companion is and for HAE32 and HAE64, respectively, corresponding to 3.4 and 11.9 kpc at , and therefore the companions are likely to be interacting with the host HAEs. Moreover, Tadaki et al. (2014) pointed out the possibility that HAE54 and HAE59 are interacting with each other based on the CO(1-0) observations with Jansky Very Large Array (JVLA). These interacting galaxies tend to show higher gas mass ratios compared to normal star-forming galaxies on the MS (the left panel of Figure 8).
A recent study by Moreno et al. (2021) investigated the evolution of star formation and ISM in interacting galaxies using FIRE-2 simulations. They showed that the molecular gas budget increases during the galaxy-pair or the interaction-phase before coalescence. Violino et al. (2018) also reported the molecular gas enhancement ( dex) in pair galaxies at selected from the Sloan Digital Sky Survey Data Release 7 (SDSS DR7, Abazajian et al., 2009). One of the plausible mechanisms to explain enhanced molecular gas during the interaction-phase is that the gas is driven into the galaxy centers by losing the angular momentum and the dense molecular gas is formed (Braine & Combes, 1993; Combes et al., 1994; Moreno et al., 2015). Based on these studies, we suggest that the protocluster galaxies which have close companions are at the early stage of interactions and their high gas mass ratios are driven by the interactions.
For massive galaxies with , except for the RG, their star formation rates are below the MS (Figure 5). One possibility to explain this trend is that the assumption of when estimating H-based SFRs (Section 2.3.1) is inappropriate for the massive HAEs. The ratio of is suggested to become larger for more massive galaxies in the local universe (Koyama et al., 2019). When this is also the case for the massive HAEs in USS1558, their dust extinction values for H would be underestimated. Another possibility is that their low SFRs relative to the MS are intrinsic signatures and that the massive HAEs are in the transitional phase to quiescent galaxies. As discussed in Tadaki et al. (2019), given that the massive galaxies reside in massive dark matter halos, the cold gas accretion to massive galaxies would be suppressed due to the virial shock heating, which would then lead to the suppression of their star-forming activities.
Based on the stacking analyses of non-detected galaxies with , their averaged gas mass ratio is relatively low while the averaged SFE is comparable to that in the field. A part of the molecular gas in these less massive galaxies might be removed via galaxy harassment, halo gas stripping, or ram pressure stripping, although it is still under debate whether the ram pressure stripping could affect molecular gas components in galaxies. The relatively low gas mass ratio of the stacked sample might be driven by the fact that the sample includes less active, and thus, gas-poorer HAEs on and below the MS (Figure 5). Deeper observations and thus individual gas mass measurements are needed for further discussion on the gas properties of those less massive galaxies.
4.3 Comparison with gas scaling relation
We investigate the environmental dependence of gas properties by comparing with the field galaxies’ scaling relation at a fixed stellar mass and SFR (offset from the MS). Figure 9 shows the gas mass ratio and SFE as a function of stellar mass. Gas properties are normalized by the values inferred from the scaling relation of general field galaxies (Tacconi et al., 2018) at the same stellar mass and the same SFR (or ). Many of the protocluster galaxies have gas mass ratios comparable to those in the field within the intrinsic scatter of the field scaling relation of dex. Similarly, even though there are some galaxies that are significantly offset from the scaling relation, our protocluster galaxies tend to have similar SFEs as field galaxies. These results suggest that there is no significant environmental dependence in gas properties if we compare galaxies at the same stellar masses and SFR. In other words, the relation between star formation activity and gas content can be universal across the environment at .
4.4 Comparison with other protoclusters
Recently, there is an increasing number of studies on gas properties of distant clusters in the literature. However, how the environments can actually affect or alter the gas properties of galaxies at 2–3 is still highly controversial (Tacconi et al., 2020). Wang et al. (2018) investigated the gas properties of galaxies in the most distant X-ray cluster, CLJ1001 at , by conducting CO(1–0) line observations with JVLA. They found a strong environmental dependence of gas properties on the clustercentric radius. They discussed the environmental effects such as stopping gas accretion onto galaxies or removing gas out of galaxies due to ram-pressure or tidal force. Another X-ray cluster, J1449+0856 at =1.99, was also observed by Coogan et al. (2018) with ALMA and JVLA, and it showed a deficit of gas mass fractions in member galaxies. Tadaki et al. (2019) showed an enhancement of gas mass in less-massive galaxies in three protoclusters at 2–2.5, including USS1558. They discussed that higher gas fraction in the protocluster galaxies is due to efficient cold gas accretion via cosmic filaments. Gómez-Guijarro et al. (2019) also showed two Herschel selected protoclusters at and showed the enhancement of gas mass fractions based on ALMA CO(3–2) line observations, which lead to the enhancement in star formation rate above the main-sequence, while keeping the star formation efficiency almost constant. This result is fully consistent with ours. On the other hand, Lee et al. (2017) found no clear environmental dependence of the gas properties of seven CO(3–2)-detected galaxies in 4C23.56 protocluster at . Also, Zavala et al. (2019) investigated two protoclusters at and 2.49 in the COSMOS field and showed that the gas properties of the protocluster galaxies are consistent with the field scaling relation. Moreover, Darvish et al. (2018) found that the gas properties do not depend on the local density using the sample of Scoville et al. (2017).
The contradicting results mentioned above may reflect the difference in the evolutionary stage of (proto)clusters, considering that the dominant physical processes working on member galaxies are expected to vary depending on the evolutionary stages of (proto)clusters (Shimakawa et al., 2018b). For instance, in matured clusters with extended X-ray emission, the gas within cluster galaxies can be stripped by ram-pressure and turn out to be gas-poor. In fact we see a deficit in gas fractions for the above two X-ray clusters (CLJ1001 and J1449). On the contrary, in immatured (proto)clusters, (proto)cluster galaxies can acquire fresh gas through cold accretion and be more gas-rich with respect to the field galaxies.
Our USS-1558 protocluster is considered to be in a growing phase, where fragmented groups are hierarchically assembling and merging to form a single viriarized cluster. We suggest that, at this early assembly stage, cold accretion is vigorously occurring, and the accreted gas is converted to stars to sustain their high star formation activities, but in a way that the relation between molecular gas properties and star formation activities is kept the same following the scaling relation.
4.5 Relation between galaxy size and gas properties
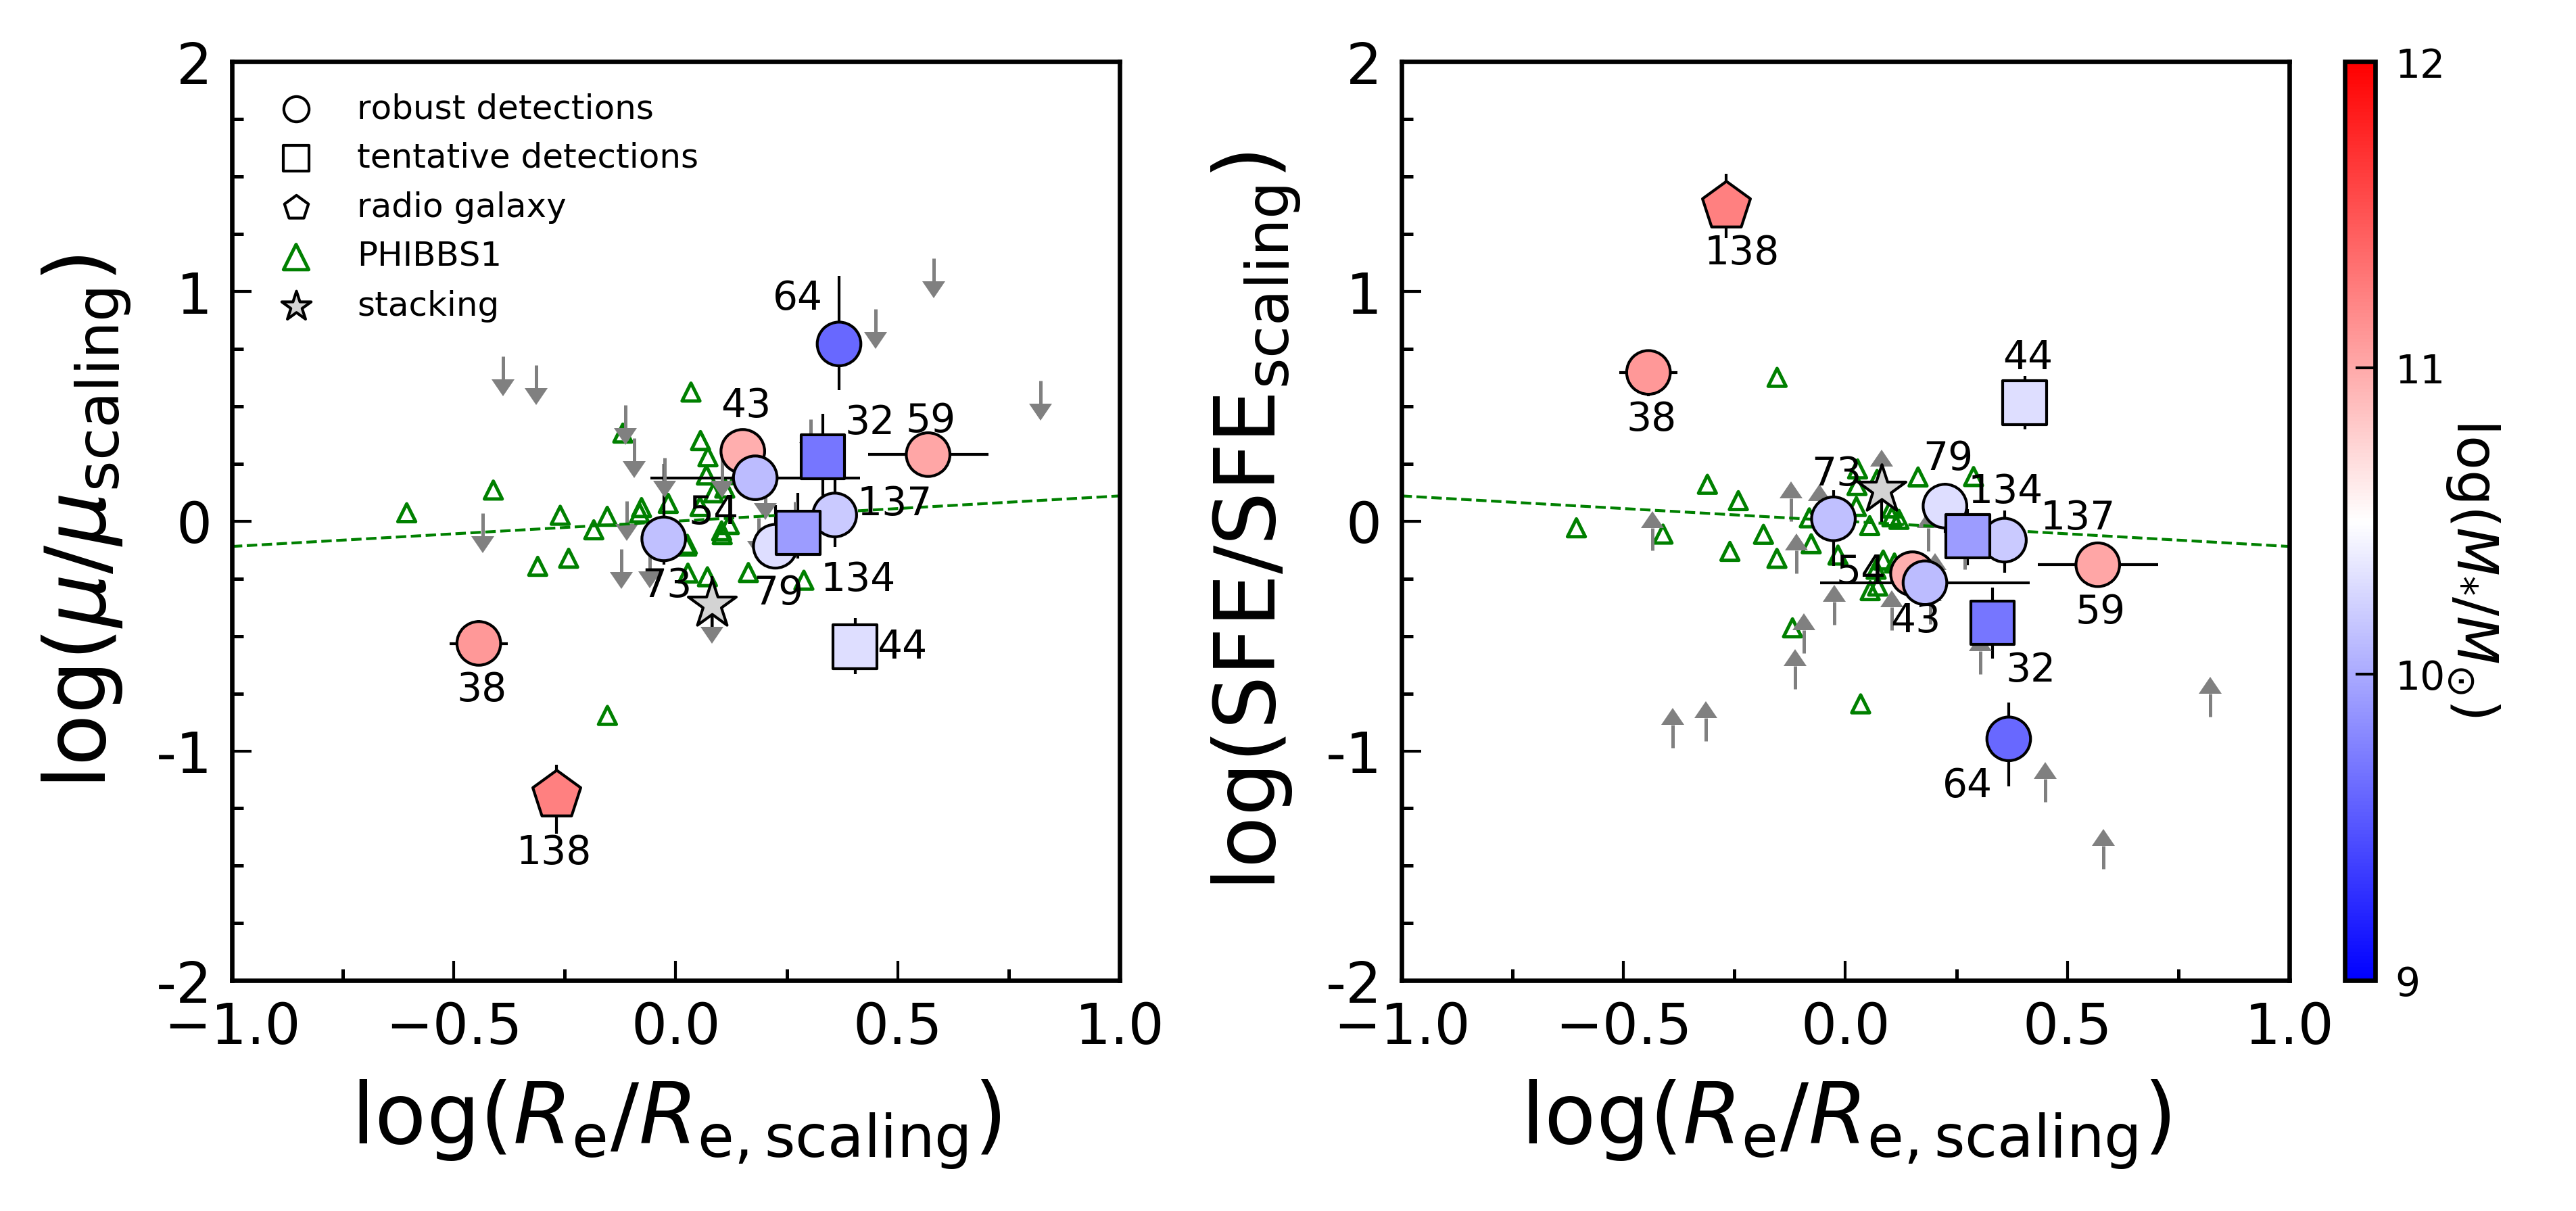
The galaxy size is an important property for galaxies’ characterization and further understanding of environmental effects. Tacconi et al. (2018) found a weak size dependence of gas properties in field galaxies. The size dependence is almost negligible considering that the slope of , and the intrinsic scatter of mass-size relation is for all galaxy types and redshifts (van der Wel et al., 2014).
Here, we investigate the size dependence of gas properties for the protocluster galaxies. Figure 10 shows the relation between size and gas properties. Whereas the overall trend of the protocluster galaxies follows the trend seen in the field galaxies, the protocluster galaxies have a large scatter compared to the field galaxies from PHIBBS1 (Tacconi et al., 2013). We find some outliers among the protocluster galaxies. This suggests that these outliers experience peculiar physical processes such as galaxy mergers.
In particular, HAE38 has a remarkably compact size ( kpc) and shows a relatively low gas mass ratio () and high SFE (0.7) among the HAEs in USS1558. Spilker et al. (2016) investigated the gas reservoir in massive and compact star-forming galaxies at in the CANDELS fields with CO(1–0) emission line. The gas mass ratios and SFE of the compact star-forming galaxies are and , respectively (including one CO-detected source). The gas properties as well as size of HAE38 appear to be similar as those of the massive and compact star-forming galaxies at similar redshifts (Spilker et al., 2016). Given the relatively low active star-formation of HAE38 (Figure 5), HAE38 might be in a transition phase from compact and massive star-forming galaxies to compact and massive quiescent galaxies, the so-called “red nugget” (e.g., Daddi et al., 2005; Damjanov et al., 2009). Compact and massive star-forming galaxies are suggested to be formed by gas-rich dissipational processes, such as gas-rich galaxy-galaxy mergers or violent disk instabilities caused by intense gas inflow (e.g., Barro et al. 2013; Dekel & Burkert 2014, but see also van Dokkum et al. 2015). The starburst-like gas properties and the compact size of HAE38 are likely to be consistent with this scenario.
RG (HAE138) has a small radius probably because the emission from the central bright AGN is dominant. Galaxies in the interaction-phase such as HAE32 and HAE64 have relatively large radii compared to expected values from the mass-size relation of van der Wel et al. (2014). This indicates that these interacting galaxies are physically disturbed and thus have extended structures or central regions of these galaxies are highly affected by dust attenuation and show higher effective radii than intrinsic ones.
5 Summary
In this study, we conducted the ALMA Band-6 observations of the dense cores of the protocluster USS1558 at , to investigate the environmental dependence of gas properties, and to understand the origin of the star formation enhancement seen in those galaxies. We detected interstellar dust emissions from 12 member galaxies and estimated their molecular gas masses based on the Rayleigh-Jeans dust continuum fluxes (S16). We summarize our findings as follows:
-
•
We compared the dust-based molecular gas mass and the CO-based molecular gas mass to check the consistency between the two independent gas mass measurements. We found that the CO(3–2)-based gas masses are systematically offset upward ( dex) from the dust-based gas masses when the CO line ratio of is assumed. This offset is reduced if a higher line ratio is assumed, which suggests that the molecular gas in protocluster galaxies may be more excited due to high star formation activities.
-
•
When the HAEs in USS1558 have a higher CO gas excitation state as suggested from the comparison of the two gas mass measurements, our previous work (Tadaki et al., 2019), in which =0.53 is assumed to estimate the molecular gas masses from CO(3–2) line, might overestimate the gas masses by a factor of 1.5.
-
•
The enhancement of both star formation and gas content can be seen in star-forming member galaxies with at least. This suggests that the high gas mass fraction led by cold accretion along the filamentary structures is sustaining their enhanced star-forming activities. Besides, galaxy interactions are also expected to be occurring more frequently in the protocluster cores due to the high number density of galaxies, and contributing to the elevated star formation activities to some extent.
-
•
There is no significant difference between protocluster galaxies and coeval field galaxies if we compare gas properties at fixed and SFR (or ). This result indicates that the relationship between gas content and star formation activity is universal even in the densest protocluster cores.
-
•
We investigated the dependence of gas properties on galaxy sizes. While a clear correlation is not seen in the protocluster galaxies as well as in the coeval field galaxies, there are some outliers that are offset from normal size, suggesting that some galaxies are evolving via the peculier processes such as mergers.
Our deep observations with ALMA revealed the global gas properties in protocluster galaxies with . Because the number of individual detections of dust continuum is not yet sufficient for a statistical discussion, more observations of protoclusters at high redshifts are needed to obtain a global picture of the environmental impacts on the gas properties of galaxies in the early Universe. Additionally, CO(1-0) observations are required to reveal the gas excitation and kinematics. Moreover, gas kinematics observation would be ideal as it will give us valuable information on the physical processes at work in galaxies in young protoclusters. The information of atomic gas (Hi) associated to this field is also important to explore the mode of gas accretion of this protocluster. Hi tomographic mapping will enable us to reveal the large-scale structure of Hi gas associated with the protocluster cores and to discuss the relation between the surrounding Hi gas structures and the gas contents in individual member galaxies.
References
- Abazajian et al. (2009) Abazajian, K. N., Adelman-McCarthy, J. K., Agüeros, M. A., et al. 2009, ApJS, 182, 543, doi: 10.1088/0067-0049/182/2/543
- Alberts et al. (2014) Alberts, S., Pope, A., Brodwin, M., et al. 2014, MNRAS, 437, 437, doi: 10.1093/mnras/stt1897
- Aravena et al. (2010) Aravena, M., Carilli, C., Daddi, E., et al. 2010, ApJ, 718, 177, doi: 10.1088/0004-637X/718/1/177
- Aravena et al. (2014) Aravena, M., Hodge, J. A., Wagg, J., et al. 2014, MNRAS, 442, 558, doi: 10.1093/mnras/stu838
- Balogh et al. (2004) Balogh, M. L., Baldry, I. K., Nichol, R., et al. 2004, ApJ, 615, L101, doi: 10.1086/426079
- Balogh et al. (1998) Balogh, M. L., Schade, D., Morris, S. L., et al. 1998, ApJ, 504, L75, doi: 10.1086/311576
- Barro et al. (2013) Barro, G., Faber, S. M., Pérez-González, P. G., et al. 2013, ApJ, 765, 104, doi: 10.1088/0004-637X/765/2/104
- Bertin & Arnouts (1996) Bertin, E., & Arnouts, S. 1996, A&AS, 117, 393, doi: 10.1051/aas:1996164
- Birnboim & Dekel (2003) Birnboim, Y., & Dekel, A. 2003, MNRAS, 345, 349, doi: 10.1046/j.1365-8711.2003.06955.x
- Blanton et al. (2005) Blanton, M. R., Eisenstein, D., Hogg, D. W., Schlegel, D. J., & Brinkmann, J. 2005, ApJ, 629, 143, doi: 10.1086/422897
- Braine & Combes (1993) Braine, J., & Combes, F. 1993, A&A, 269, 7
- Brown et al. (2017) Brown, T., Catinella, B., Cortese, L., et al. 2017, MNRAS, 466, 1275, doi: 10.1093/mnras/stw2991
- Calzetti et al. (2000) Calzetti, D., Armus, L., Bohlin, R. C., et al. 2000, ApJ, 533, 682, doi: 10.1086/308692
- Chabrier (2003) Chabrier, G. 2003, PASP, 115, 763, doi: 10.1086/376392
- Chartab et al. (2021) Chartab, N., Mobasher, B., Shapley, A. E., et al. 2021, ApJ, 908, 120, doi: 10.3847/1538-4357/abd71f
- Chiang et al. (2017) Chiang, Y.-K., Overzier, R. A., Gebhardt, K., & Henriques, B. 2017, ApJ, 844, L23, doi: 10.3847/2041-8213/aa7e7b
- Christlein & Zabludoff (2005) Christlein, D., & Zabludoff, A. I. 2005, ApJ, 621, 201, doi: 10.1086/427427
- Chung et al. (2007) Chung, A., van Gorkom, J. H., Kenney, J. D. P., & Vollmer, B. 2007, ApJ, 659, L115, doi: 10.1086/518034
- Combes et al. (1994) Combes, F., Prugniel, P., Rampazzo, R., & Sulentic, J. W. 1994, A&A, 281, 725
- Coogan et al. (2018) Coogan, R. T., Daddi, E., Sargent, M. T., et al. 2018, MNRAS, 479, 703, doi: 10.1093/mnras/sty1446
- da Cunha et al. (2008) da Cunha, E., Charlot, S., & Elbaz, D. 2008, MNRAS, 388, 1595, doi: 10.1111/j.1365-2966.2008.13535.x
- da Cunha et al. (2015) da Cunha, E., Walter, F., Smail, I. R., et al. 2015, ApJ, 806, 110, doi: 10.1088/0004-637X/806/1/110
- Daddi et al. (2005) Daddi, E., Renzini, A., Pirzkal, N., et al. 2005, ApJ, 626, 680, doi: 10.1086/430104
- Daddi et al. (2010) Daddi, E., Bournaud, F., Walter, F., et al. 2010, ApJ, 713, 686, doi: 10.1088/0004-637X/713/1/686
- Daddi et al. (2015) Daddi, E., Dannerbauer, H., Liu, D., et al. 2015, A&A, 577, A46, doi: 10.1051/0004-6361/201425043
- Damjanov et al. (2009) Damjanov, I., McCarthy, P. J., Abraham, R. G., et al. 2009, ApJ, 695, 101, doi: 10.1088/0004-637X/695/1/101
- Darvish et al. (2018) Darvish, B., Scoville, N. Z., Martin, C., et al. 2018, ApJ, 860, 111, doi: 10.3847/1538-4357/aac836
- Dekel & Birnboim (2006) Dekel, A., & Birnboim, Y. 2006, MNRAS, 368, 2, doi: 10.1111/j.1365-2966.2006.10145.x
- Dekel & Burkert (2014) Dekel, A., & Burkert, A. 2014, MNRAS, 438, 1870, doi: 10.1093/mnras/stt2331
- Dekel et al. (2009) Dekel, A., Birnboim, Y., Engel, G., et al. 2009, Nature, 457, 451, doi: 10.1038/nature07648
- Dressler (1980) Dressler, A. 1980, ApJ, 236, 351, doi: 10.1086/157753
- Dressler et al. (1997) Dressler, A., Oemler, Augustus, J., Couch, W. J., et al. 1997, ApJ, 490, 577, doi: 10.1086/304890
- Erb et al. (2006) Erb, D. K., Steidel, C. C., Shapley, A. E., et al. 2006, ApJ, 647, 128, doi: 10.1086/505341
- Fassbender et al. (2011) Fassbender, R., Böhringer, H., Nastasi, A., et al. 2011, New Journal of Physics, 13, 125014, doi: 10.1088/1367-2630/13/12/125014
- Fumagalli et al. (2009) Fumagalli, M., Krumholz, M. R., Prochaska, J. X., Gavazzi, G., & Boselli, A. 2009, ApJ, 697, 1811, doi: 10.1088/0004-637X/697/2/1811
- Genzel et al. (2010) Genzel, R., Tacconi, L. J., Gracia-Carpio, J., et al. 2010, MNRAS, 407, 2091, doi: 10.1111/j.1365-2966.2010.16969.x
- Genzel et al. (2012) Genzel, R., Tacconi, L. J., Combes, F., et al. 2012, ApJ, 746, 69, doi: 10.1088/0004-637X/746/1/69
- Genzel et al. (2015) Genzel, R., Tacconi, L. J., Lutz, D., et al. 2015, ApJ, 800, 20, doi: 10.1088/0004-637X/800/1/20
- Gómez et al. (2003) Gómez, P. L., Nichol, R. C., Miller, C. J., et al. 2003, ApJ, 584, 210, doi: 10.1086/345593
- Gómez-Guijarro et al. (2019) Gómez-Guijarro, C., Riechers, D. A., Pavesi, R., et al. 2019, ApJ, 872, 117, doi: 10.3847/1538-4357/ab002a
- Goto et al. (2003) Goto, T., Yamauchi, C., Fujita, Y., et al. 2003, MNRAS, 346, 601, doi: 10.1046/j.1365-2966.2003.07114.x
- Gunn & Gott (1972) Gunn, J. E., & Gott, III, J. R. 1972, ApJ, 176, 1, doi: 10.1086/151605
- Hayashi et al. (2012) Hayashi, M., Kodama, T., Tadaki, K.-i., Koyama, Y., & Tanaka, I. 2012, ApJ, 757, 15, doi: 10.1088/0004-637X/757/1/15
- Hayashi et al. (2016) Hayashi, M., Kodama, T., Tanaka, I., et al. 2016, ApJ, 826, L28, doi: 10.3847/2041-8205/826/2/L28
- Ichikawa et al. (2006) Ichikawa, T., Suzuki, R., Tokoku, C., et al. 2006, in Proc. SPIE, Vol. 6269, Society of Photo-Optical Instrumentation Engineers (SPIE) Conference Series, 626916, doi: 10.1117/12.670078
- Ivison et al. (2011) Ivison, R. J., Papadopoulos, P. P., Smail, I., et al. 2011, MNRAS, 412, 1913, doi: 10.1111/j.1365-2966.2010.18028.x
- Jaffé et al. (2015) Jaffé, Y. L., Smith, R., Candlish, G. N., et al. 2015, MNRAS, 448, 1715, doi: 10.1093/mnras/stv100
- Jian et al. (2012) Jian, H.-Y., Lin, L., & Chiueh, T. 2012, ApJ, 754, 26, doi: 10.1088/0004-637X/754/1/26
- Kacprzak et al. (2015) Kacprzak, G. G., Yuan, T., Nanayakkara, T., et al. 2015, ApJ, 802, L26, doi: 10.1088/2041-8205/802/2/L26
- Kajisawa et al. (2006) Kajisawa, M., Kodama, T., Tanaka, I., Yamada, T., & Bower, R. 2006, MNRAS, 371, 577, doi: 10.1111/j.1365-2966.2006.10704.x
- Kauffmann et al. (2004) Kauffmann, G., White, S. D. M., Heckman, T. M., et al. 2004, MNRAS, 353, 713, doi: 10.1111/j.1365-2966.2004.08117.x
- Kawata & Mulchaey (2008) Kawata, D., & Mulchaey, J. S. 2008, ApJ, 672, L103, doi: 10.1086/526544
- Kenney & Young (1989) Kenney, J. D. P., & Young, J. S. 1989, ApJ, 344, 171, doi: 10.1086/167787
- Kennicutt (1998) Kennicutt, Robert C., J. 1998, ARA&A, 36, 189, doi: 10.1146/annurev.astro.36.1.189
- Kereš et al. (2009) Kereš, D., Katz, N., Davé, R., Fardal, M., & Weinberg, D. H. 2009, MNRAS, 396, 2332, doi: 10.1111/j.1365-2966.2009.14924.x
- Kereš et al. (2005) Kereš, D., Katz, N., Weinberg, D. H., & Davé, R. 2005, MNRAS, 363, 2, doi: 10.1111/j.1365-2966.2005.09451.x
- Kirkpatrick et al. (2012) Kirkpatrick, A., Pope, A., Alexander, D. M., et al. 2012, ApJ, 759, 139, doi: 10.1088/0004-637X/759/2/139
- Kodama et al. (2013) Kodama, T., Hayashi, M., Koyama, Y., et al. 2013, in IAU Symposium, Vol. 295, The Intriguing Life of Massive Galaxies, ed. D. Thomas, A. Pasquali, & I. Ferreras, 74–77, doi: 10.1017/S1743921313004353
- Koyama et al. (2017) Koyama, S., Koyama, Y., Yamashita, T., et al. 2017, ApJ, 847, 137, doi: 10.3847/1538-4357/aa8a6c
- Koyama et al. (2013) Koyama, Y., Kodama, T., Tadaki, K.-i., et al. 2013, MNRAS, 428, 1551, doi: 10.1093/mnras/sts133
- Koyama et al. (2019) Koyama, Y., Shimakawa, R., Yamamura, I., Kodama, T., & Hayashi, M. 2019, PASJ, 71, 8, doi: 10.1093/pasj/psy113
- Kriek et al. (2009) Kriek, M., van Dokkum, P. G., Labbé, I., et al. 2009, ApJ, 700, 221, doi: 10.1088/0004-637X/700/1/221
- Kroupa (2001) Kroupa, P. 2001, MNRAS, 322, 231, doi: 10.1046/j.1365-8711.2001.04022.x
- Larson et al. (1980) Larson, R. B., Tinsley, B. M., & Caldwell, C. N. 1980, ApJ, 237, 692, doi: 10.1086/157917
- Lee et al. (2017) Lee, M. M., Tanaka, I., Kawabe, R., et al. 2017, ApJ, 842, 55, doi: 10.3847/1538-4357/aa74c2
- Macuga et al. (2019) Macuga, M., Martini, P., Miller, E. D., et al. 2019, ApJ, 874, 54, doi: 10.3847/1538-4357/ab0746
- Mao et al. (2010) Mao, R.-Q., Schulz, A., Henkel, C., et al. 2010, ApJ, 724, 1336, doi: 10.1088/0004-637X/724/2/1336
- McMullin et al. (2007) McMullin, J. P., Waters, B., Schiebel, D., Young, W., & Golap, K. 2007, Astronomical Society of the Pacific Conference Series, Vol. 376, CASA Architecture and Applications, ed. R. A. Shaw, F. Hill, & D. J. Bell, 127
- Mok et al. (2016) Mok, A., Wilson, C. D., Golding, J., et al. 2016, MNRAS, 456, 4384, doi: 10.1093/mnras/stv2958
- Moore et al. (1996) Moore, B., Katz, N., Lake, G., Dressler, A., & Oemler, A. 1996, Nature, 379, 613, doi: 10.1038/379613a0
- Moreno et al. (2015) Moreno, J., Torrey, P., Ellison, S. L., et al. 2015, MNRAS, 448, 1107, doi: 10.1093/mnras/stv094
- Moreno et al. (2021) —. 2021, MNRAS, 503, 3113, doi: 10.1093/mnras/staa2952
- Ocvirk et al. (2008) Ocvirk, P., Pichon, C., & Teyssier, R. 2008, MNRAS, 390, 1326, doi: 10.1111/j.1365-2966.2008.13763.x
- Peng et al. (2010) Peng, C. Y., Ho, L. C., Impey, C. D., & Rix, H.-W. 2010, AJ, 139, 2097, doi: 10.1088/0004-6256/139/6/2097
- Peng et al. (2015) Peng, Y., Maiolino, R., & Cochrane, R. 2015, Nature, 521, 192, doi: 10.1038/nature14439
- Pentericci et al. (2000) Pentericci, L., Van Reeven, W., Carilli, C. L., Röttgering, H. J. A., & Miley, G. K. 2000, A&AS, 145, 121, doi: 10.1051/aas:2000104
- Pettini & Pagel (2004) Pettini, M., & Pagel, B. E. J. 2004, MNRAS, 348, L59, doi: 10.1111/j.1365-2966.2004.07591.x
- Poggianti et al. (1999) Poggianti, B. M., Smail, I., Dressler, A., et al. 1999, ApJ, 518, 576, doi: 10.1086/307322
- Reddy et al. (2010) Reddy, N. A., Erb, D. K., Pettini, M., Steidel, C. C., & Shapley, A. E. 2010, ApJ, 712, 1070, doi: 10.1088/0004-637X/712/2/1070
- Reddy et al. (2015) Reddy, N. A., Kriek, M., Shapley, A. E., et al. 2015, ApJ, 806, 259, doi: 10.1088/0004-637X/806/2/259
- Riechers et al. (2020) Riechers, D. A., Boogaard, L. A., Decarli, R., et al. 2020, ApJ, 896, L21, doi: 10.3847/2041-8213/ab9595
- Roediger & Brüggen (2007) Roediger, E., & Brüggen, M. 2007, MNRAS, 380, 1399, doi: 10.1111/j.1365-2966.2007.12241.x
- Scott et al. (2002) Scott, S. E., Fox, M. J., Dunlop, J. S., et al. 2002, MNRAS, 331, 817, doi: 10.1046/j.1365-8711.2002.05193.x
- Scott et al. (2013) Scott, T. C., Usero, A., Brinks, E., et al. 2013, MNRAS, 429, 221, doi: 10.1093/mnras/sts328
- Scoville et al. (2016) Scoville, N., Sheth, K., Aussel, H., et al. 2016, ApJ, 820, 83, doi: 10.3847/0004-637X/820/2/83
- Scoville et al. (2017) Scoville, N., Lee, N., Vanden Bout, P., et al. 2017, ApJ, 837, 150, doi: 10.3847/1538-4357/aa61a0
- Sharon et al. (2016) Sharon, C. E., Riechers, D. A., Hodge, J., et al. 2016, ApJ, 827, 18, doi: 10.3847/0004-637X/827/1/18
- Shimakawa et al. (2015a) Shimakawa, R., Kodama, T., Tadaki, K.-i., et al. 2015a, MNRAS, 448, 666, doi: 10.1093/mnras/stv051
- Shimakawa et al. (2014) Shimakawa, R., Kodama, T., Tadaki, K. I., et al. 2014, MNRAS, 441, L1, doi: 10.1093/mnrasl/slu029
- Shimakawa et al. (2015b) Shimakawa, R., Kodama, T., Steidel, C. C., et al. 2015b, MNRAS, 451, 1284, doi: 10.1093/mnras/stv915
- Shimakawa et al. (2017) Shimakawa, R., Kodama, T., Hayashi, M., et al. 2017, MNRAS, 468, L21, doi: 10.1093/mnrasl/slx019
- Shimakawa et al. (2018a) —. 2018a, MNRAS, 473, 1977, doi: 10.1093/mnras/stx2494
- Shimakawa et al. (2018b) Shimakawa, R., Koyama, Y., Röttgering, H. J. A., et al. 2018b, MNRAS, 481, 5630, doi: 10.1093/mnras/sty2618
- Speagle et al. (2014) Speagle, J. S., Steinhardt, C. L., Capak, P. L., & Silverman, J. D. 2014, ApJS, 214, 15, doi: 10.1088/0067-0049/214/2/15
- Spilker et al. (2016) Spilker, J. S., Bezanson, R., Marrone, D. P., et al. 2016, ApJ, 832, 19, doi: 10.3847/0004-637X/832/1/19
- Suzuki et al. (2008) Suzuki, R., Tokoku, C., Ichikawa, T., et al. 2008, PASJ, 60, 1347, doi: 10.1093/pasj/60.6.1347
- Swinbank et al. (2010) Swinbank, A. M., Smail, I., Longmore, S., et al. 2010, Nature, 464, 733, doi: 10.1038/nature08880
- Tacconi et al. (2020) Tacconi, L. J., Genzel, R., & Sternberg, A. 2020, ARA&A, 58, 157, doi: 10.1146/annurev-astro-082812-141034
- Tacconi et al. (2010) Tacconi, L. J., Genzel, R., Neri, R., et al. 2010, Nature, 463, 781, doi: 10.1038/nature08773
- Tacconi et al. (2013) Tacconi, L. J., Neri, R., Genzel, R., et al. 2013, ApJ, 768, 74, doi: 10.1088/0004-637X/768/1/74
- Tacconi et al. (2018) Tacconi, L. J., Genzel, R., Saintonge, A., et al. 2018, ApJ, 853, 179, doi: 10.3847/1538-4357/aaa4b4
- Tadaki et al. (2014) Tadaki, K.-i., Kodama, T., Tamura, Y., et al. 2014, ApJ, 788, L23, doi: 10.1088/2041-8205/788/2/L23
- Tadaki et al. (2019) Tadaki, K.-i., Kodama, T., Hayashi, M., et al. 2019, PASJ, 71, 40, doi: 10.1093/pasj/psz005
- Tran et al. (2010) Tran, K.-V. H., Papovich, C., Saintonge, A., et al. 2010, ApJ, 719, L126, doi: 10.1088/2041-8205/719/2/L126
- Umehata et al. (2017) Umehata, H., Tamura, Y., Kohno, K., et al. 2017, ApJ, 835, 98, doi: 10.3847/1538-4357/835/1/98
- Valentino et al. (2015) Valentino, F., Daddi, E., Strazzullo, V., et al. 2015, ApJ, 801, 132, doi: 10.1088/0004-637X/801/2/132
- van der Wel et al. (2014) van der Wel, A., Franx, M., van Dokkum, P. G., et al. 2014, ApJ, 788, 28, doi: 10.1088/0004-637X/788/1/28
- van Dokkum et al. (2015) van Dokkum, P. G., Nelson, E. J., Franx, M., et al. 2015, ApJ, 813, 23, doi: 10.1088/0004-637X/813/1/23
- Violino et al. (2018) Violino, G., Ellison, S. L., Sargent, M., et al. 2018, MNRAS, 476, 2591, doi: 10.1093/mnras/sty345
- Vollmer et al. (2001) Vollmer, B., Cayatte, V., Balkowski, C., & Duschl, W. J. 2001, ApJ, 561, 708, doi: 10.1086/323368
- Wang et al. (2018) Wang, T., Elbaz, D., Daddi, E., et al. 2018, ApJ, 867, L29, doi: 10.3847/2041-8213/aaeb2c
- Yamaguchi et al. (2019) Yamaguchi, Y., Kohno, K., Hatsukade, B., et al. 2019, ApJ, 878, 73, doi: 10.3847/1538-4357/ab0d22
- Yao et al. (2003) Yao, L., Seaquist, E. R., Kuno, N., & Dunne, L. 2003, ApJ, 588, 771, doi: 10.1086/374333
- Zavala et al. (2019) Zavala, J. A., Casey, C. M., Scoville, N., et al. 2019, ApJ, 887, 183, doi: 10.3847/1538-4357/ab5302