20XX Vol. X No. XX, 000–000
22institutetext: School of Astronomy and Space Science, University of Chinese Academy of Sciences, Beijing 10049, China
33institutetext: Instituto de Astrofísica, Pontificia Universidad Católica de Chile, Av. Vicuña Mackenna 4860, Macul, Santiago, Chile; rongyuastrophysics@gmail.com
44institutetext: Institute of Computational Cosmology, Department of Physics, University of Durham, Science Laboratories, South Road, Durham DH1 3LE, UK
\vs\noReceived 20XX Month Day; accepted 20XX Month Day
The Formation and Evolution of Massive Galaxies
Abstract
The discovery of massive galaxies at high redshifts, especially the passive ones, poses a big challenge for the current standard galaxy formation models. Here we use the semi-analytic galaxy formation model developed by Henriques et al. to explore the formation and evolution of massive galaxies (MGs, stellar-mass M). Different from previous works, we focus on the ones just formed (e.g. just reach M). We find that most of the MGs are formed around , with the earliest formation at . Interestingly, although most of the MGs in the local Universe are passive, we find that only of the MGs are quenched at the formation time. Most of the quenched MGs at formation already hosts a very massive supermassive black hole (SMBH) which could power the very effective AGN feedback. For the star-forming MGs, the ones with more massive SMBH prefer to quench in shorter timescales; in particular, those with M have a quenching timescale of Gyr and the characteristic depends on the chosen stellar mass threshold in the definition of MGs as a result of their co-evolution. We also find that the “in-situ” star formation dominates the stellar mass growth of MGs until they are formed. Over the whole redshift range, we find the quiescent MGs prefer to stay in more massive dark matter halos, and have more massive SMBH and less cold gas masses. Our results provide a new angle on the whole life of the growth of MGs in the Universe.
keywords:
galaxies: evolution — galaxies: formation — galaxies: star formation — galaxies: high-redshift — methods: numerical1 Introduction
The studies based on semi-analytic galaxy formation models (e.g. Kauffmann et al. 1993; Baugh et al. 1996; De Lucia et al. 2006; De Lucia & Blaizot 2007; Neistein et al. 2006; Guo & White 2008; Parry et al. 2009; Lee & Yi 2013) and hydrodynamical simulations (e.g. Oser et al. 2010; Lackner et al. 2012; Qu et al. 2017; Rodriguez-Gomez et al. 2016) show that the low-redshift massive galaxies may form most of stellar masses in their progenitor galaxies at high redshifts through in-situ star formation (50 per cent at ; De Lucia & Blaizot (2007)), and then assemble through galaxy mergers later (e.g. Rong et al. 2018). This formation scenario can explain the observational results that the most massive galaxies appear to have a large number of older stellar populations (e.g. Bower et al. 1992; Cowie et al. 1996; Heavens et al. 2004; Cimatti et al. 2004; Glazebrook et al. 2004; Gallazzi et al. 2005; Thomas et al. 2019), and higher -element enhancement/shorter star-formation timescales (e.g. Thomas et al. 2010; Johansson et al. 2012; Zheng et al. 2019), which is referred to as ‘downsizing’ effect. However, the observational surveys (e.g. Mobasher et al. 2005; Wiklind et al. 2008) have also found a significant population of massive galaxies at high redshifts (), supporting a drastic stellar mass growth in these galaxies at early epochs.
Most of the nearby massive galaxies are quiescent; besides, a noticeable fraction ( per cent) of the massive galaxies have already been quenched at (e.g. Daddi et al. 2005; Kriek et al. 2008; Fontana et al. 2009; Castro-Rodríguez & López-Corredoira 2012; Nayyeri et al. 2014; Wang et al. 2016; Merlin et al. 2018; Deshmukh et al. 2018). Particularly, recent studies report several extremely-high-redshift () quiescent galaxies (Glazebrook et al. 2017; Simpson et al. 2017; Schreiber et al. 2018; Valentino et al. 2020), which provide a challenge to the current galaxy formation models. We note that it is essential to investigate the formation of these quiescent massive galaxies, at high-redshift particularly, as the current formation models are difficult to reconcile the required high star-formation rates (SFRs; e.g., /yr) in the short star-formation timescales ( Gyr represented by the high [/Fe]; Kriek et al. (2016)) and thus drastic stellar mass growth, as well as efficient AGN/stellar feedback ceasing the violent star formation at early Universe.
The studies of Rong et al. (2017b) and Qin et al. (2017), based on semi-analytic models, suggest that the AGN feedback indeed can cause the formation of the extremely-high-redshift (e.g., ) massive quiescent galaxies, if their progenitors host more massive central black holes. Terrazas et al. (2016) also found that the quiescent galaxies host more massive black holes, comparing with the star-forming counterparts, with the data of 91 nearby massive galaxies (), which also suggests a correlation between the central black hole masses and quiescence of galaxies.
In this work, we will present more details on the formation and evolution, particularly the quenching process, of the massive galaxies during the entire cosmic epoch by using the semi-analytic model developed by Henriques et al. (2015) based on the Millennium simulation (Springel et al. 2005). Semi-analytic galaxy formation models have been proven successful in reproducing the properties for both of the massive and dwarf galaxies in the local Universe and at high redshifts (e.g., Guo et al. 2011, 2013; Yates et al. 2012; Buitrago et al. 2017; Rong et al. 2017a, b).
The organization of the paper is as follows. In Section 2, we briefly introduce the simulation and galaxy formation model used in this study. Then the formation and evolution of MGs and the properties at different redshift will be studied. Finally, the conclusions and discussions will be followed. Throughout this paper, we use ’log’ to represent ’log10’.
2 Semi-analytic galaxy catalogue
The galaxy catalogue we used is based on a semi-analytic galaxy formation model described in Henriques et al. (2015, hereafter H15) implemented on the Millennium simulation (MS; Springel et al. 2005). The MS adopts a flat CDM cosmology model with cosmological parameters based on a combined analysis of the 2dFGRS (Colless et al. 2001) and the first-year WMAP data (Spergel et al. 2003). The full particle data were stored at 64 snapshots approximately logarithmically spaced from until and then at approximately 300 Myr intervals until . At each snapshot, the particles were linked with a separation of less than 0.2 of the mean inter-particle separation (Davis et al. 1985) to generate a friend-of-friend (FOF) group catalogue. Subsequently, the SUBFIND algorithm (Springel et al. 2001) was applied to each FOF group to identify all its self-bounded subhaloes.
H15 used the technique detailed in Angulo & White (2010) and Angulo & Hilbert (2015) to scale the evolution of dark matter structure predicted by the MS to Planck cosmology. The cosmological parameters adopted from Planck Collaboration XVI (2014) are , , (), , and km s-1 Mpc-1. After scaled, the simulation has a resolution of particles in a periodic box of side length Mpc with a particle mass of M⊙. The box volume is large enough to investigate the statistical properties of massive galaxies.
H15 updated the previous Munich models (Guo et al. 2011, 2013) and provided a good fit to the observed stellar mass functions and passive fractions over the full redshift range, . This makes it possible to trace the evolution of the massive galaxies to high redshift.
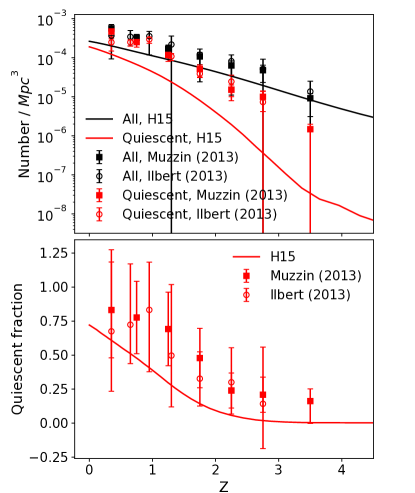
We define the massive galaxies(MGs) as the galaxies with the stellar masses M, and identify a galaxy as quiescent when its specific SFR (sSFR) satisfied , where is the Hubble time at the redshift of the galaxy. Otherwise, the galaxies are regarded as star-forming ones. Fig. 1 shows the number density (top panel) and the quiescent fraction (bottom panel) of MGs as a function of redshift. The observational data from Muzzin et al. (2013) and Ilbert et al. (2013) are presented by circles and square symbols individually, while the simulation result from H15 (H15) are presented as solid curves. The black and red indicate the total and quiescent galaxies, respectively. To consider the magnitude bias effect in the simulated sample, the stellar mass of each simulated galaxy is convolved with a Gaussian in log, with width 0.08 .
We find that the number density of all simulated MGs increases with decreasing redshifts, by about orders from to . While the number density of the quiescent simulated MGs increases more drastically. The observed number density of all MGs and quiescent MGs are a slightly more than our simulated results but within 3 sigma confidence level. The difference becomes bigger as the redshift increases. This possibly indicates that the quenching mechanism should have a weaker dependence on the cosmic time in the SAM model. This should be investigated carefully in the development of the models next time. Although there is a divergence in the number density between the simulation and observational results, the predicted quiescent fraction coincide with the observations very well.
The quiescent fraction increase from a few per cent at to about at . This ensures we could study the quenching process of MGs in the following sections.
3 Formation and Evolution of Massive Galaxies
In this section, we will check the formation and evolution of MGs. Firstly we define a formation time of an MG, , as the cosmic time when its stellar mass grows to 1011M for the first time; the corresponding redshift as its formation redshift . We will study the different evolution phases of MGs: before and after their , respectively.
3.1 The formation of MGs
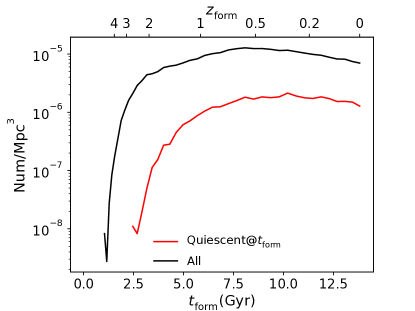
In Fig. 2, we checked the formation time of the MGs. The number density of new forming MGs at each cosmic time is presented as the black solid curve. While the number density of those MGs already being quiescent at is presented as the red solid curve. A few MGs form even earlier than , though their number density is less than . The number density of MGs increases (from to ) rapidly from to , then slowly climbs to the peak around . The MGs which have been quiescent at emerge for the first time at . Note that, in Fig. 1, the “quiescent MGs” already exist at . Those galaxies are not quiescent at their forming time but became quiescent later around . Different from the high fraction of quiescent MGs at the low redshifts as shown in Fig. 1, we find that the fraction of quiescent MG at the formation time is always low (% at , and % at ), and only %, including MGs with all .
It will be interesting to understand how an MG assembles its stellar components in such a short time (noting the formation time of some MGs is kind of Gyr) and why a fraction of them gets quiescent at their formation time. In the following, we study the stellar mass assembly of MGs before their . In the hierarchical formation scenario, the stellar mass of a galaxy can assemble through in-situ star formation or ex-situ (i.e., mergers; e.g. Guo & White 2008; Oser et al. 2010; Lackner et al. 2012; Rodriguez-Gomez et al. 2016; Qu et al. 2017).
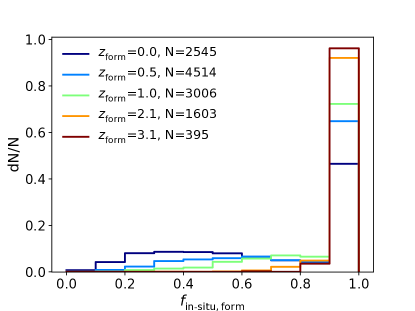
The galaxy merger can also be classified as a major merger and minor merger according to the stellar mass ratio, , of the main progenitor to the sum of its companions in a merging system. We classify as the major mergers, while as the minor mergers (e.g. Cole et al. 2000; De Lucia & Blaizot 2007; Guo & White 2008; Xie et al. 2015). For each MG, we calculate the fraction of stellar mass assembly from the three channels: major mergers (), minor mergers () and in-situ star formation (), where , , and denotes the total stellar mass formed in major mergers, minor mergers, and in-situ star formation before , respectively, and shows the stellar mass of an MG at ( is slightly larger than because is defined as the redshift of the first snapshot after the mass of MG is greater than .)
In Fig. 3, we show the distributions of of the MGs at the different redshifts with different colours. And the number of MGs in each bin is given in the legend. We find that, in statistics, the in-situ star formation dominates the stellar mass assembly of the MGs at all redshifts. At higher redshift , about MGs assemble their stellar mass by in-situ way ( ). This fraction is still as high as at redshift zero. With the decreasing redshift, the mass contribution from mergers is becoming more important for the formation of the MGs. At , the contribution from in-situ way decreases down to less than 50 per cent and the star formation is dominated by galaxy mergers.
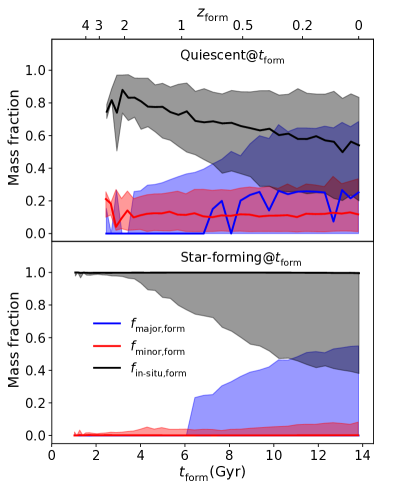
The existence of quiescent MGs at poses an interesting question: what processes quench them after they grow quickly to be MGs at high redshift? So we subsequently study the stellar mass assembly of MGs being quiescent (MG-FQs) and star-forming (MG-FSFs) at , respectively. Fig. 4 shows the fractions of the stellar masses assembled from the major, minor mergers, and in-situ star formation as a function of , for the MG-FQs (top panel) and MG-FSFs (bottom panel), respectively. The black, blue and red curves represent the median , , and , respectively. The coloured shaded regions bracket the fraction ranges (from 16% to 84%). Most of the MG-FSFs assemble their stars mostly through the in-situ way and almost have undergone neither major nor minor mergers. While for MG-FQs, the in-situ way is still dominating for the stellar assembly, but the minor mergers constantly contribute about more than 10% at any . At , more than 20% have major mergers before they form, and the younger MG-FSFs are more likely to have undergone major mergers. This indicates, although the in-situ dominate the growth of the MGs, the mergers, especially the major mergers, are possibly responsible for the quenching of MGs. These results are in qualitative agreement with results from the Illustris simulation (Rodriguez-Gomez et al. 2016, fig. 6), as well as EAGLE simulation (Qu et al. 2017, fig. 6).
In the H15 model, galaxy mergers can significantly enhance the growth of central black holes (BHs) in the galaxies, then trigger the AGN activity and feedback (Kauffmann & Haehnelt 2000; Benson et al. 2003; Granato et al. 2004; Springel et al. 2005; Bower et al. 2006; Croton et al. 2006). AGN feedback can suppress gas cooling and prevent star formation. In H15, the power of AGN feedback is positively related to the BH mass and halo mass.
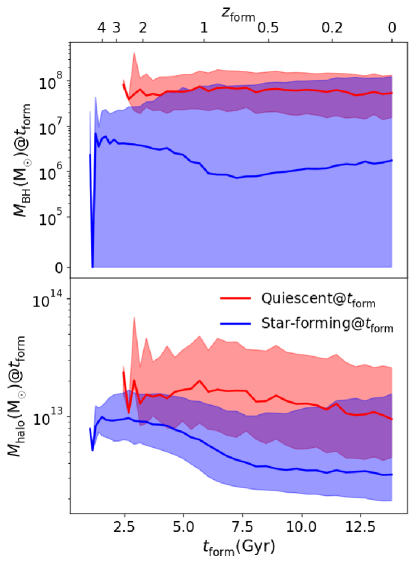
We therefore present the BH mass (, top panel) and halo mass (, bottom panel) of the MGs as a function of , as shown in Fig. 5. The blue and red curves highlight the median values of MG-FSFs and MG-FQs at each , respectively. The coloured shaded components bracket the mass ranges.
For the MG-FSFs and MG-FQs with the same , the BH and halo masses of the MG-BQs are more massive than those of the MG-FSFs. It indicates the fact that the MG-FQs have undergone more galaxy mergers, compared with the star-forming counterparts, and more mergers trigger the faster growth of the central BHs of galaxies and reproduce stronger AGN feedback which leads to a quicker suppression of star formation activity. This result agrees with that of Terrazas et al. (2016), in which the authors compared the central BH masses of the quiescent and star-forming galaxies with the similar stellar masses in the nearby universe (), and found that the quiescent galaxies host more massive BHs.
We also find that the of the MG-FQs are always about M, independent of the different . The value is higher than the ( M) of the star-forming counterparts. It implies that a BH with M is not massive enough to quench MGs. However, this characteristic value depends on the chosen stellar-mass threshold in defining the MGs. The dependence approximates and agrees with the earlier found black hole mass – stellar mass relation (e.g. Malbon et al. 2007; Somerville et al. 2008; Terrazas et al. 2020). This indicates the strong co-evolution of the black holes and its host galaxies: the strength to quench the galaxies depends on the strength of the AGN feedback, and as well on the mass of the black hole.
From the bottom panel of Fig. 5, we find that the MGs with earlier tend to be hosted in the more massive halos, which is in agreement with the evolution of the stellar mass - halo mass (SMHM) relation in Matthee et al. (2017). They find that the ratio between stellar mass and halo mass decrease with increasing redshift at .
3.2 The evolution of MGs
In this subsection, we investigate the evolution of MGs after . In H15, a galaxy initially emerges at the centre of a halo, named the “central galaxy”, and the halo (together with the galaxy) may fall into another halo with a deeper gravitational potential, becoming a subhalo orbiting within the FOF group, then the galaxy is named as the “satellite galaxy”. A satellite may merge into the central galaxy after an episode of dynamical time from infall. During this time, the satellite may be disrupted by tidal force and contribute to the intra-cluster light (Guo et al. 2011).
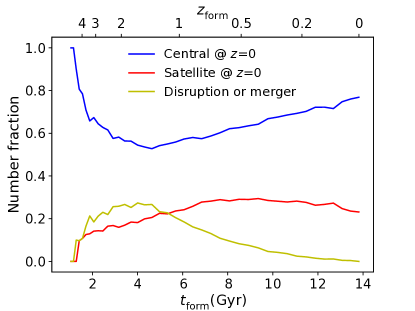
Therefore, an MG may have three different fates at , i.e. being a central, or a satellite, or vanished (i.e., have been disrupted or have merged into other more massive galaxies before ). For the MGs with the different , Fig. 6 shows the number fraction of the MGs ends with three different fates at . The blue and red colours highlight the number fraction of the MGs which are the central and satellite galaxies at , respectively. The fraction of galaxies that have been vanished before is shown by the yellow colour.
For the MGs with , the fraction of MGs still being central at decreases with the decreasing , and a fraction of MGs vanished before increases with decreasing , which is due to the fact that MGs with earlier tend to be hosted in more massive halos (bottom panel of Fig. 5) and have deeper gravitational potential. Therefore, they are more likely to cannibalize the other satellite galaxies, rather than fall into another halo potential and become satellites. However, for the MGs with , the fraction of MGs still being central at increases with the decreasing , while the fraction of the vanished MGs before decreases with the decreasing . It is primarily because that the number of new-formation MGs is approximately uniform when , as shown in Fig. 2, and therefore, the MGs with later do not have enough time to merge into other systems or be disrupted.
Note, the total number fraction of MGs which are vanished before accounts for of the MGs sample. Therefore, we will only study the evolution of the survived MGs at hereafter.
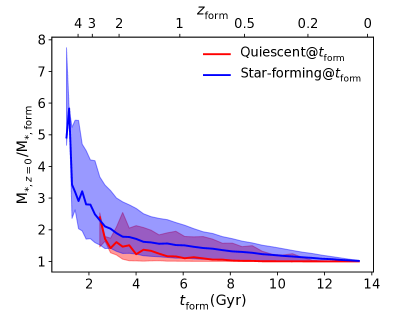
First, we investigate how many stellar masses the MGs can assemble from to . In Fig. 7, we plot their ratios of the stellar masses at to , as a function of . The blue and red components show the median value and scatter of the ratios of MG-FSFs and MG-FQs, respectively. We find that the MGs only grows about a factor of a few even some of them formed at . We also find that the stellar mass growth of MG-FSFs is more significant, compared with the MG-FQs with the same .
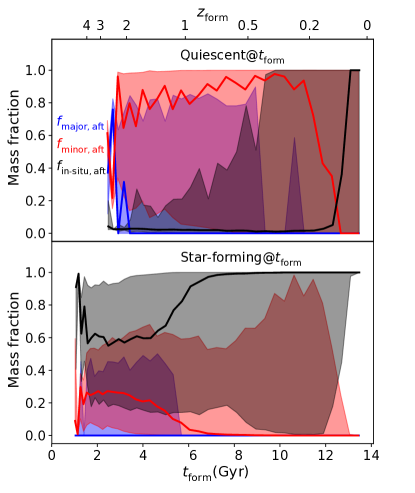
Subsequently, for each MG, we calculate the fraction of the stellar mass assembly through major mergers (), minor mergers (), and in-situ star formation (), respectively; the , , and denotes the total stellar mass formed in major mergers, minor mergers, and in-situ star formation after , respectively, and the denotes the stellar mass of the MG at .
In Fig. 8, we present the stellar mass assembly fractions as a function of for the MG-FQs (upper panel) and MG-FSFs (lower panel), respectively. The black, blue and red components respectively represent the median , and , and their scatters. For the MG-FQs, unlike the stellar mass growth before , the stellar mass growth after is dominated by the minor mergers. For some MG-FQs form close to , the in-situ way plays the key role although the mass growth is tiny.
For the MG-FSFs, in statistics, the in-situ star formation is responsible for their stellar mass growth after , particularly for the MG-FSFs with . This result is consistent with the conclusion of Fig. 7 which we mentioned before. While for MG-FSFs with , the minor merge is also important in their stellar mass assembly after .
As shown in Fig. 2, only a small fraction of MGs has been quenched when they formed. However, most of the MGs at lack star formation activity. In order to study the quenching mechanism of MG-FSFs after , for each MG-FSF, we trace its evolution history after and define the quenching timescale, , as the interval between and the critical time of sSFR. Note, a quiescent galaxy may resume a large sSFR during a later gas-rich merger; in this case, denotes the first time its sSFR decreases to the critical value .
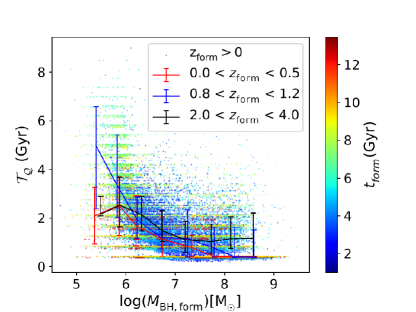
As Fig. 5 indicates, the supermassive black hole in the MGs may be responsible for their quenching. In Fig. 9, we checked the dependence of on their black hole mass at . Every data point presents a galaxy, and its colour labels its . The red, blue and black lines represent the median value of in each log() bin for MGs with , and , respectively. The error bars are for the ranges. The MGs whose sSFR never decreases to less than and MGs with no black hole at are not shown in this figure. We find that the has noticeable dependence on for MGs forms at different . The decrease sharply with increasing until M, and then almost remains as a very small time scale. The median value of the of MGs with M is only Gyr. About 45% of MGs with no black hole at (not shown) are quenched before and the median value of their is Gyr, roughly equal to of MGs with lowest ( M). These results indicates that the balck halo with mass M drives the quenching process of the MGs by their strong AGN feedback which are more effectively to suppress cooling and star formation. However, the characteristic value of the depend on our chosen stellar mass threshold in MGs definition, which reflects the strong relation between the black hole mass and the mass of their host galaxies.
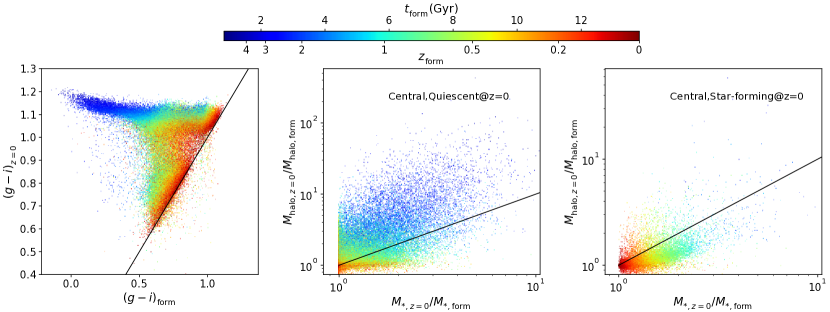
It is also interesting to check the evolution of the MGs’s colours from their formation time until redshift . The left panel of Fig. 10 shows the scatter plot of at vs. at for MGs with different . Almost all of MGs with have changed into red at . For those MGs formed after , most of them don’t change too much, but some of them turn red soon, indicating they just suffered a very quick quenching. More than half of these quickly quenched galaxies host a BH with a mass larger than M⊙, and the later could be responsible for the quenching.
In the middle and right panels of Fig 10, we check the co-evolution of these MGs and their host dark matter haloes by showing the increase of the mass of host dark matter halo vs. the increase of their stellar mass. In the right panel, for those MGs which are still in the star-forming phase at redshift zero, their stellar mass growth is even a little faster than the mass growth of their host dark matter halo; while for those quiescent MGs at redshift zero in the middle panel, the mass growth of the host dark matter halo is quicker than stellar mass, especially for the MGs formed before , dark halo mass of some is almost 10 times faster than the growth of stellar component.
4 The properties of Massive Galaxies with redshift
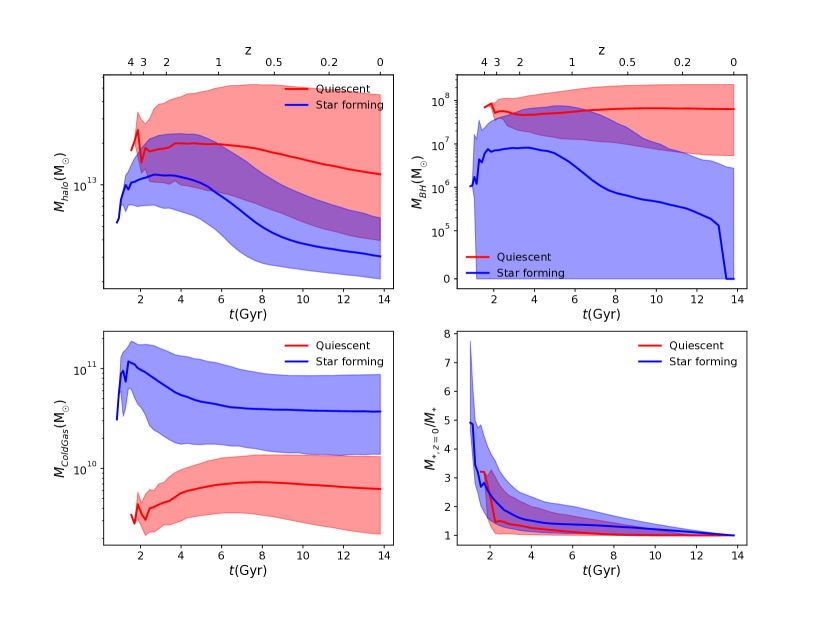
In this section, we will focus our attention on the statistical properties of MGs at different redshifts. The upper left, upper right and bottom left panels of Fig. 11 present the halo mass, black hole mass and cold gas mass as a function of the cosmic time for quiescent (red) and star-forming (blue) MGs, respectively. The solid lines denote the median value and the shaded regions for the range from the 16th to 84th percentiles. As shown in the figure, the properties of these two populations are obviously different. The quiescent MGs tend to stay in a more massive halo, with a larger black hole mass and less cold gas than star-forming MGs at all redshifts. The median value of the halo mass significantly decreases with the increase of cosmic time. This indicates that MGs prefer to stay in more massive haloes at high redshifts, and at low redshift, the MGs formed in smaller haloes becomes possible, especially for the star-forming MGs.
The black hole mass of quiescent MGs, about thousandths of their stellar mass, have little change with redshifts, while the mass of BH in the star-forming MGs is almost always less than reflecting the very low AGN feedback inside. The bottom right panel of Fig. 11 shows the stellar mass ratio of their descendant at and their own. Unlike the other three panels, the MGs not evolved to are not included in this panel. We can find that the stellar mass assembly in the star formation MGs is a slightly quicker than the quiescent counterparts, but the difference is not so big given the former population is keeping to form star continuously.
5 Discussion and Conclusions
The formation and evolution of massive galaxies play an important role in understanding galaxies formation. In this paper, we have utilised the semi-analytic model developed by H15 to explore the formation and evolution of massive galaxies. When the stellar mass of a galaxy exceeds M, we treat the galaxy as a massive galaxy (MGs) and its formation time defined by the comic time when its stellar mass grow to larger than M for the first time. We list here our principal findings:
-
1.
A few MGs have a very high (). The number density of MGs increases from to , and then almost remains unchanged until .
-
2.
There are only a small fraction (13%) of MGs been quiescent at (MG-FQs). They have a more massive black hole and halo mass than the star-forming counterparts (MG-FSFs). We also find their black hole masses are always about M, independent with their . However, this characteristic value depends on the chosen stellar-mass threshold in the definition of MGs, which hints at the co-evolution of the black hole and their host galaxies.
-
3.
We find that the in-situ star formation always dominates the stellar mass assembly at although the mass factions of in-situ star formation are decreasing with increasing formation time. For the MG-FQs, although the in-situ star-formation still dominates the formation of their stellar masses, they are more likely to have undergone more galaxy mergers, compared with the formation scenario of MG-FSFs. These results are in qualitative agreement with results from the Illustris simulation (Rodriguez-Gomez et al. 2016, Fig. 6), as well as the EAGLE simulation (Qu et al. 2017, Fig. 6). In these simulations, the stellar mass fraction from the merger (“ex-situ”) in MGs is to , lower than “in-situ”. Our results also suggest the MGs has undergone very few major mergers before , but some other models argued more major merger events in the formation of MGs (e.g. De Lucia & Blaizot 2007; Guo & White 2008). This agrees with the fact found in (Yang et al. 2019, Fig. 2): the merger rates in H15 model is relatively lower than other models.
-
4.
We find that about % of MGs sample have become satellite galaxies and % of MGs sample have been disrupted or merged into other more massive galaxies before .
-
5.
For the MGs with at , their stellar mass assembly through mergers after is comparable to that through in-situ star formation. But for the MGs with , the in-situ star formation dominates their stellar mass assembly after .
-
6.
We find that the quenching timescales of MGs have a noticeable correlation with their and the correlation is not dependent on . The MGs with more massive have a shorter quenching timescale, suggesting the important effect of AGN feedback in the quenching of MGs.
We noticed that a small fraction () of quenched MGs rejuvenated to becoming star-forming galaxies. Some of them will pass away again just less than 1Gyr, while a small fraction of them will keep star formation more than a few Gyr, and even keep alive at present. This rejuvenation phenomenon is also discovered in the observation (e.g. Thomas et al. 2010; Chauke et al. 2019; Cleland & McGee 2021). It is possible that the merger or some other gas supply mechanism is responsible for that. Next, we plan to carry on more further detailed studies on that in the model used in this study and also in the new state-of-the-art high-resolution hydrodynamic simulation.
Acknowledgements.
We thank the referee for the valuable comments. We acknowledge supports from National Key R&D Program of China (grant number 2018YFA0404503, 2018YFE0202902), the National Key Program for Science and Technology Research and Development of China (2017YFB0203300, 2015CB857005), the National Natural Science Foundation of China (Nos. 11988101, 11425312, 11503032, 11773032, 11390372, 11873051, 118513, 11573033, 11622325, 12033008, and 11622325). Y.R. acknowledges funding supports from FONDECYT Postdoctoral Fellowship Project No. 3190354 and NSFC grant No. 11703037.References
- Angulo & Hilbert (2015) Angulo, R. E., & Hilbert, S. 2015, MNRAS, 448, 364
- Angulo & White (2010) Angulo, R. E., & White, S. D. M. 2010, MNRAS, 405, 143
- Baugh et al. (1996) Baugh, C. M., Cole, S., & Frenk, C. S. 1996, MNRAS, 283, 1361
- Benson et al. (2003) Benson, A. J., Bower, R. G., Frenk, C. S., et al. 2003, ApJ, 599, 38
- Bower et al. (2006) Bower, R. G., Benson, A. J., Malbon, R., et al. 2006, MNRAS, 370, 645
- Bower et al. (1992) Bower, R. G., Lucey, J. R., & Ellis, R. S. 1992, MNRAS, 254, 601
- Buitrago et al. (2017) Buitrago, F., Trujillo, I., Curtis-Lake, E., et al. 2017, MNRAS, 466, 4888
- Castro-Rodríguez & López-Corredoira (2012) Castro-Rodríguez, N., & López-Corredoira, M. 2012, A&A, 537, A31
- Chauke et al. (2019) Chauke, P., van der Wel, A., Pacifici, C., et al. 2019, ApJ, 877, 48
- Cimatti et al. (2004) Cimatti, A., Daddi, E., Renzini, A., et al. 2004, Nature, 430, 184
- Cleland & McGee (2021) Cleland, C., & McGee, S. L. 2021, MNRAS, 500, 590
- Cole et al. (2000) Cole, S., Lacey, C. G., Baugh, C. M., & Frenk, C. S. 2000, MNRAS, 319, 168
- Colless et al. (2001) Colless, M., Dalton, G., Maddox, S., et al. 2001, MNRAS, 328, 1039
- Cowie et al. (1996) Cowie, L. L., Songaila, A., Hu, E. M., & Cohen, J. G. 1996, AJ, 112, 839
- Croton et al. (2006) Croton, D. J., Springel, V., White, S. D. M., et al. 2006, MNRAS, 365, 11
- Daddi et al. (2005) Daddi, E., Renzini, A., Pirzkal, N., et al. 2005, ApJ, 626, 680
- Davis et al. (1985) Davis, M., Efstathiou, G., Frenk, C. S., & White, S. D. M. 1985, ApJ, 292, 371
- De Lucia & Blaizot (2007) De Lucia, G., & Blaizot, J. 2007, MNRAS, 375, 2
- De Lucia et al. (2006) De Lucia, G., Springel, V., White, S. D. M., Croton, D., & Kauffmann, G. 2006, MNRAS, 366, 499
- Deshmukh et al. (2018) Deshmukh, S., Caputi, K. I., Ashby, M. L. N., et al. 2018, ApJ, 864, 166
- Fontana et al. (2009) Fontana, A., Santini, P., Grazian, A., et al. 2009, A&A, 501, 15
- Gallazzi et al. (2005) Gallazzi, A., Charlot, S., Brinchmann, J., White, S. D. M., & Tremonti, C. A. 2005, MNRAS, 362, 41
- Glazebrook et al. (2004) Glazebrook, K., Abraham, R. G., McCarthy, P. J., et al. 2004, Nature, 430, 181
- Glazebrook et al. (2017) Glazebrook, K., Schreiber, C., Labbé, I., et al. 2017, Nature, 544, 71
- Granato et al. (2004) Granato, G. L., De Zotti, G., Silva, L., Bressan, A., & Danese, L. 2004, ApJ, 600, 580
- Guo et al. (2013) Guo, Q., White, S., Angulo, R. E., et al. 2013, MNRAS, 428, 1351
- Guo & White (2008) Guo, Q., & White, S. D. M. 2008, MNRAS, 384, 2
- Guo et al. (2011) Guo, Q., White, S., Boylan-Kolchin, M., et al. 2011, MNRAS, 413, 101
- Heavens et al. (2004) Heavens, A., Panter, B., Jimenez, R., & Dunlop, J. 2004, Nature, 428, 625
- Henriques et al. (2015) Henriques, B. M. B., White, S. D. M., Thomas, P. A., et al. 2015, MNRAS, 451, 2663
- Ilbert et al. (2013) Ilbert, O., McCracken, H. J., Le Fèvre, O., et al. 2013, A&A, 556, A55
- Johansson et al. (2012) Johansson, J., Thomas, D., & Maraston, C. 2012, MNRAS, 421, 1908
- Kauffmann & Haehnelt (2000) Kauffmann, G., & Haehnelt, M. 2000, MNRAS, 311, 576
- Kauffmann et al. (1993) Kauffmann, G., White, S. D. M., & Guiderdoni, B. 1993, MNRAS, 264, 201
- Kriek et al. (2008) Kriek, M., van der Wel, A., van Dokkum, P. G., Franx, M., & Illingworth, G. D. 2008, ApJ, 682, 896
- Kriek et al. (2016) Kriek, M., Conroy, C., van Dokkum, P. G., et al. 2016, Nature, 540, 248
- Lackner et al. (2012) Lackner, C. N., Cen, R., Ostriker, J. P., & Joung, M. R. 2012, MNRAS, 425, 641
- Lee & Yi (2013) Lee, J., & Yi, S. K. 2013, ApJ, 766, 38
- Malbon et al. (2007) Malbon, R. K., Baugh, C. M., Frenk, C. S., & Lacey, C. G. 2007, MNRAS, 382, 1394
- Matthee et al. (2017) Matthee, J., Schaye, J., Crain, R. A., et al. 2017, MNRAS, 465, 2381
- Merlin et al. (2018) Merlin, E., Fontana, A., Castellano, M., et al. 2018, MNRAS, 473, 2098
- Mobasher et al. (2005) Mobasher, B., Dickinson, M., Ferguson, H. C., et al. 2005, ApJ, 635, 832
- Muzzin et al. (2013) Muzzin, A., Marchesini, D., Stefanon, M., et al. 2013, ApJ, 777, 18
- Nayyeri et al. (2014) Nayyeri, H., Mobasher, B., Hemmati, S., et al. 2014, ApJ, 794, 68
- Neistein et al. (2006) Neistein, E., van den Bosch, F. C., & Dekel, A. 2006, MNRAS, 372, 933
- Oser et al. (2010) Oser, L., Ostriker, J. P., Naab, T., Johansson, P. H., & Burkert, A. 2010, ApJ, 725, 2312
- Parry et al. (2009) Parry, O. H., Eke, V. R., & Frenk, C. S. 2009, MNRAS, 396, 1972
- Planck Collaboration et al. (2014) Planck Collaboration, Ade, P. A. R., Aghanim, N., et al. 2014, A&A, 571, A16
- Qin et al. (2017) Qin, Y., Mutch, S. J., Duffy, A. R., et al. 2017, MNRAS, 471, 4345
- Qu et al. (2017) Qu, Y., Helly, J. C., Bower, R. G., et al. 2017, MNRAS, 464, 1659
- Rodriguez-Gomez et al. (2016) Rodriguez-Gomez, V., Pillepich, A., Sales, L. V., et al. 2016, MNRAS, 458, 2371
- Rong et al. (2017a) Rong, Y., Guo, Q., Gao, L., et al. 2017a, MNRAS, 470, 4231
- Rong et al. (2017b) Rong, Y., Jing, Y., Gao, L., et al. 2017b, MNRAS, 471, L36
- Rong et al. (2018) Rong, Y., Li, H., Wang, J., et al. 2018, MNRAS, 477, 230
- Schreiber et al. (2018) Schreiber, C., Labbé, I., Glazebrook, K., et al. 2018, A&A, 611, A22
- Simpson et al. (2017) Simpson, J. M., Smail, I., Wang, W.-H., et al. 2017, ApJ, 844, L10
- Somerville et al. (2008) Somerville, R. S., Hopkins, P. F., Cox, T. J., Robertson, B. E., & Hernquist, L. 2008, MNRAS, 391, 481
- Spergel et al. (2003) Spergel, D. N., Verde, L., Peiris, H. V., et al. 2003, ApJS, 148, 175
- Springel et al. (2001) Springel, V., White, S. D. M., Tormen, G., & Kauffmann, G. 2001, MNRAS, 328, 726
- Springel et al. (2005) Springel, V., White, S. D. M., Jenkins, A., et al. 2005, Nature, 435, 629
- Terrazas et al. (2016) Terrazas, B. A., Bell, E. F., Henriques, B. M. B., et al. 2016, ApJ, 830, L12
- Terrazas et al. (2020) Terrazas, B. A., Bell, E. F., Pillepich, A., et al. 2020, MNRAS, 493, 1888
- Thomas et al. (2010) Thomas, D., Maraston, C., Schawinski, K., Sarzi, M., & Silk, J. 2010, MNRAS, 404, 1775
- Thomas et al. (2019) Thomas, R., Le Fèvre, O., Zamorani, G., et al. 2019, A&A, 630, A145
- Valentino et al. (2020) Valentino, F., Tanaka, M., Davidzon, I., et al. 2020, ApJ, 889, 93
- Wang et al. (2016) Wang, T., Elbaz, D., Schreiber, C., et al. 2016, ApJ, 816, 84
- Wiklind et al. (2008) Wiklind, T., Dickinson, M., Ferguson, H. C., et al. 2008, ApJ, 676, 781
- Xie et al. (2015) Xie, L., Guo, Q., Cooper, A. P., et al. 2015, MNRAS, 447, 636
- Yang et al. (2019) Yang, Q., Hu, B., & Li, X.-D. 2019, MNRAS, 483, 503
- Yates et al. (2012) Yates, R. M., Kauffmann, G., & Guo, Q. 2012, MNRAS, 422, 215
- Zheng et al. (2019) Zheng, Z., Li, C., Mao, S., et al. 2019, ApJ, 873, 63