Towards Intelligent Load Balancing in Data Centers
Abstract
Network load balancers are important components in data centers to provide scalable services. Workload distribution algorithms are based on heuristics, e.g., Equal-Cost Multi-Path (ECMP), Weighted-Cost Multi-Path (WCMP) or naive machine learning (ML) algorithms, e.g., ridge regression. Advanced ML-based approaches help achieve performance gain in different networking and system problems. However, it is challenging to apply ML algorithms on networking problems in real-life systems. It requires domain knowledge to collect features from low-latency, high-throughput, and scalable networking systems, which are dynamic and heterogenous. This paper proposes Aquarius to bridge the gap between ML and networking systems and demonstrates its usage in the context of network load balancers. This paper demonstrates its ability of conducting both offline data analysis and online model deployment in realistic systems. The results show that the ML model trained and deployed using Aquarius improves load balancing performance yet they also reveals more challenges to be resolved to apply ML for networking systems.
1 Introduction
In data centers, applictions are replicated on multiple instances running e.g., in containers or virtual machines (VMs) to provide scalable services [1]. One of the main components in such data centers for optimal resource utilization is network (load balancers), whose role is to distribute network traffic fairly among application instances. As ML-based approaches achieve performance gains in different networking problems [2, 3], this paper investigates whether ML helps improve network load balancing performance.
The challenges of applying ML on network load balancing problem, especially in real-world systems, are -fold. First, feature collections require domain knowledge. Unlike task schedulers [4] or application-level load balancers [5], network load balancers have limited observations and are not aware of task size and duration before distributing workloads. They can only extract features from packet headers below the transport layer. Second, networking systems favor low-latency, high-throughput and scalability. Adding ML algorithms in the system incurs additional computational overhead for collecting and processing features, making predictions, and online training, which degrades data plane performance and scalability [6]. Third, networking environments are dynamic and heterogenous [7, 8]. Asynchronous closed-loop design is required to bring ML algorithms online so that the models can be adapted over time without blocking the system.
This paper proposes Aquarius to bridge the different requirements for networking system and ML. Aquarius is an asynchronous and scalable data collection and exploitation mechanism that enables ML-based decisions based on fine-grained observations. This paper implements Aquarius in Vector Packet Processing (VPP) [9], which is easy to deploy in real-world systems. Using Aquarius, the potential benefits and challenges of ML for network load balancing problem are investigated.
2 Related Work
ML techniques (e.g., graph neural networks [10], and convolutional neural networks [11]) help optimize and classify network traffic in data centers. However, applying these techniques alongside the data plane on the fly is computationally intractable [12, 6]. In [13], it is shown that asynchronous design helps achieve performance gain without degrading networking performance on emulators. This paper implements Aquarius on a platform compatible to commodity CPUs so that it can be deployed in real-world system.
In [8], the challenges of applying ML algorithms on networking systems are studied using system configurations as features. In the context of network load balancing[14], ridge regression [15] is used to improve workload distribution fairness using actively probed server load information (CPU and memory usage) as features. With Aquarius, the same problem can be investigated using a wide range of runtime networking features extracted from packet headers, which makes load balancers no longer necessary to maintain the active probing channel with all servers.
3 Overview
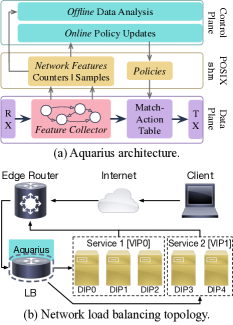
Aquarius has a -layer architecture (figure 2a). It extracts network features from the data plane (parser layer) and makes the features available via shared memory (partitioner layer) for the control plane (processor layer).
In the context of network load balancing problem, Aquarius is deployed on load balancers. As depicted in figure 2b, cloud services provided in data centers are identified by virtual IPs (VIPs). Each VIP corresponds to a cluster of virtualized application servers, each identified by a unique direct IP (DIP). Within each VIP, Aquarius needs to track the state of each server to distinguish the overloaded or malfunctioning ones and make more-informed load balancing decisions.
4 Design
In order to apply ML in an asynchronous close-loop load balancing framework with high scalability and low latency, communication between the load balancer data plane and the ML application is implemented via POSIX shared memory (shm). The design of Aquarius allows features to be extracted from the data plane and conveyed to the ML application, and allows data-driven decisions generated by the ML application to be updated asynchronously on the load balancer.
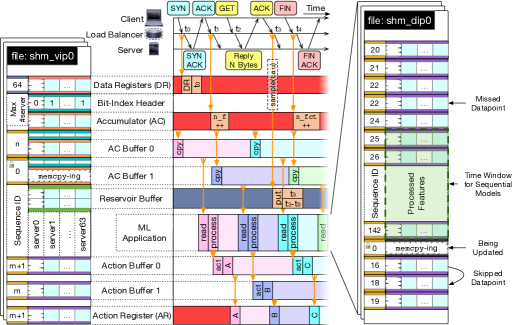
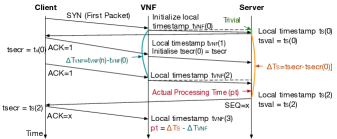
The pipeline of the data flow over the lifetime of a TCP connection is depicted in figure 2. On receipt of different networking packets, networking features are gathered as counters or samples. To avoid I/O conflicts, sampled features are collected using reservoir sampling over the latest time window and counters are collected atomically and made available to the data processing agent using multi-buffering. The bit-index binary header helps efficiently identify active application servers. Gathered features are organized by the packets’ corresponding VIP and DIP in shm files identified by VIP (e.g., shm_vip0). With no disruption in the data plane, these features are fetched by ML application periodically to shm files identified by DIP (e.g., shm_dip0), which serve as a database for the ML application. Only the features with the highest sequence ID are fetched and sequence ID is used as a writing “lock”. Using the same multi-buffering scheme, action buffes and registers allow to effectuate policies generated by the ML application.
This design is asynchronous and has no blocking steps. This design also favors the discrete arrivals of networking packets, and allows to gather networking features111The whole list of networking features are listed in figure 10 in appendix A.. This design separates gathered networking features by VIP and DIP, and allows to aggregate the features at different levels and make predictions for different purposes. Updating (adding or removing) services (VIPs) and their associated servers (DIPs) can be achieved by managing different shm files in a scalable way using this design, incurring no disruption on data planes.
5 Experiments
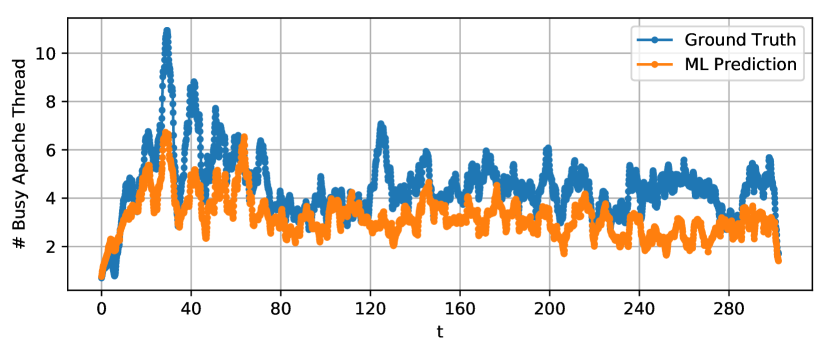
Using the same topology as in figure 2b, different network traces222Wiki, Poisson for-loop and file traces. See appendix B for details. are applied as network traffic over groups of (-CPU and -CPU) servers with different processing capacities. Throughout the set of experiments, network features ( counters and sampled features) are collected as input data for ML models to predict ground truth values, i.e., number of provisioned CPUs (#cpu), CPU usage, and number of busy worker threads (#thread). Each sampled feature channel is reduced to scalars, i.e., average, th-percentile, standard deviation, exponential moving average (decay) of average and th-percentile. This section illustrates both offline (section 5.1) and online (section 5.2) application of Aquarius for developing an ML-based load balancer.
5.1 Offline ML Applications
An ECMP load balancer is implemented with Aquarius. Features and ground truth values are collected every ms along with the different types of input network traffic with different traffic rate.
Feature process pipeline: Collected dataset is preprocessed and converted to have zero mean and unit standard deviation. They are subtracted by the mean and divided by the standard diviation across the entire training set. Outlier data-points (any feature or ground truth value beyond th-percentile) are dropped.
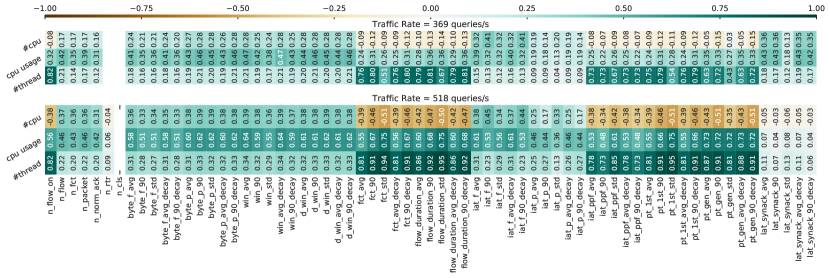
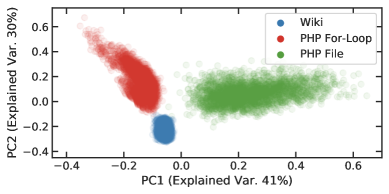
Data analysis: Correlation between networking features and the ground truth values using Wiki trace are plotted in figrue 3. It can be observed that under higher traffic rate, the flow completion time (fct) and flow duration have higher positive correlation with the actual server load states (CPU usage and #thread) and negative correlation with the provisioned processing capacities. This makes sense since under heavy workloads, servers processing speed decreases and more powerful servers finish tasks faster. Conducting principal component analysis (PCA) on the collected networking features using types of traffic gives clustering results as depicted in figure 5. Projected on two principal components (PCs), which accounts for and of the overall variability, clusters can be clearly observed. This is a promising result for potential ML-based traffic classifiers, which distinguish traffic types and allocate different computational resources to meet corresponding requirements of quality of service (QoS).
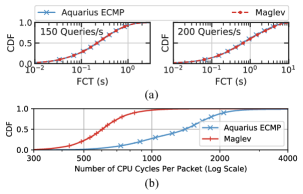
Overhead analysis: The performance of Aquarius is compared with state-of-the-art Maglev load balancer [14]. As depicted in figure 5a, Aquarius does not induce notable degradation of QoS. Aquarius introduces an additional k per-packet processing CPU cycles (s on a GHz CPU) on average (figure 5b), which is trivial comparing with the typical round trip time (higher than s) between network equipments [16].
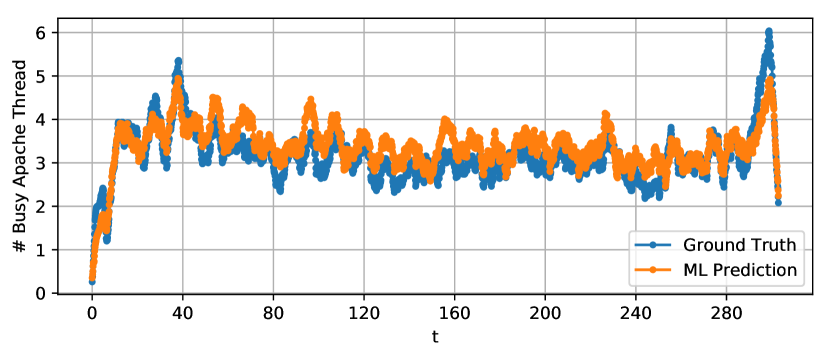
Training: ML models are trained to predict #thread as server load estimators to make load-aware load balancing decisions. To adapt the dataset for sequential models, the sequence length is and stride is , which give k datapoints in total. These sequential datapoints are randomly splited into training and testing datasets. Tensorflow [17] is used for model training. The hyperparameters for different models are described in appendix D.
Results: As shown in table 1, recurrent models have better performance in general (i.e., LSTM and RNN). Applying convolutional layers helps reduce inference delay (i.e., 1DConv-GRU1). More complicated models do not necessarily improve model performance (i.e., Wavenet models).
| Task | Metrics | Dense1 | RNN2 | LSTM2 | GRU2 |
|
|
|
||||||
|---|---|---|---|---|---|---|---|---|---|---|---|---|---|---|
| Wiki | MSE | |||||||||||||
| RMSE | ||||||||||||||
| MAE | ||||||||||||||
| Delay (ms) | ||||||||||||||
| Poisson | MSE | |||||||||||||
| RMSE | ||||||||||||||
| MAE | ||||||||||||||
| Delay (ms) |
5.2 Online ML Applications
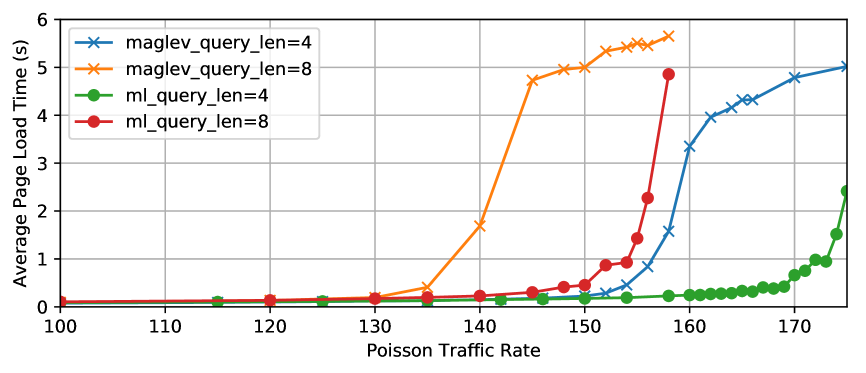
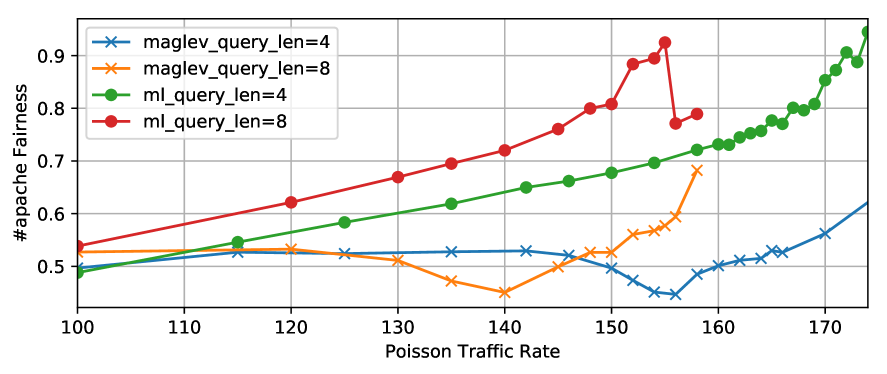
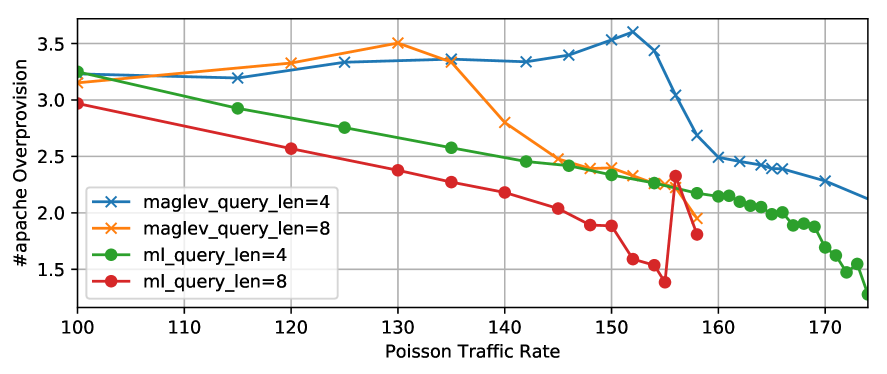
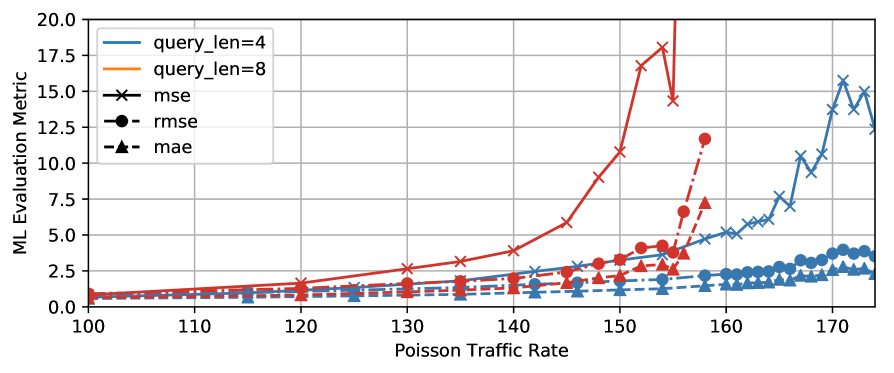
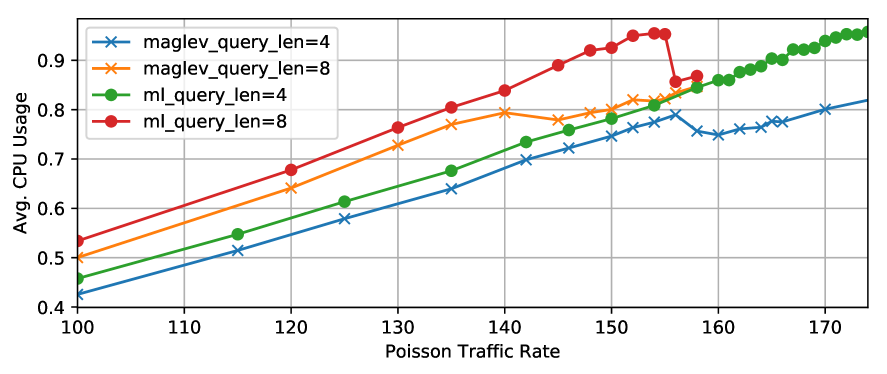
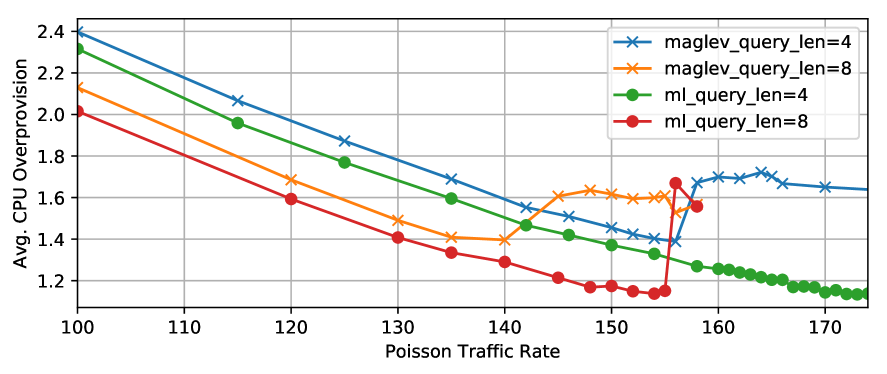
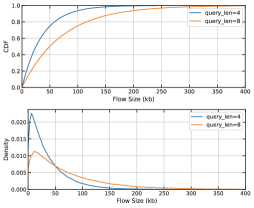
Online performance: Aquarius enables open and closed-loop control. Based on the results from previous section, LSTM2 model is brought online to make load balancing decisions (changing the server weights and assigning more tasks to servers with higher weights) based on latest observation every ms. Two Poisson for-loop traces are applied as input traffic. The average completion times for each query are ms for query_len=4 and ms query_len=4). The load balancing performance is compared with Maglev in figure 6 across a wide range of traffic rates. It is shown that with trained ML models, load balancers allow the same server cluster to serve heavier workloads with reduced page load time (fct), by optimizing resource utilization (improving workload distribution fairness and reducing overprovision factor).
Generality: To study whether the trained ML models is able to generalize, model LSTM2 is trained only using Poisson for-loop traffic and brought online to work with both for-loop and Wiki traces. Figure 7 shows that the trained model generalizes poorly if the applied traffic is not seen by the model before, which is consistent to [8].
6 Conclusion and Future Work
ML algorithms show promising results on different problems yet it is challenging to apply on realistic networking problems and in real-life systems. This paper proposes Aquarius to bridge ML and distributed networking systems and takes a preliminary step to integrate ML approaches in networking field. It allows to gather a wide range of networking features and feed them to offline data analysis pipelines or online ML models to make decisions on the fly. The results demonstrates the potential of Aquarius to conduct feature engineering, traffic classification, model selection, and online model deployment. The models applied in this paper shows the ability to learn and infer server load states with networking features. It also shows that networking problems are dynamic and heterogenous, thus it is challenging to train a model that generalizes well. Reinforcement learning will be studied in future work to improve model generality in the interactive real-world system. This work has several limitations. ML models and their hyperparameters are not sufficiently explored. The asynchronous decisions are delayed and impacts of delayed decisions along with action updating frequencies are not fully investigated.
References
- [1] Nicola Dragoni, Saverio Giallorenzo, Alberto Lluch Lafuente, Manuel Mazzara, Fabrizio Montesi, Ruslan Mustafin, and Larisa Safina. Microservices: yesterday, today, and tomorrow. In Present and Ulterior Software Engineering, pages 195–216. Springer, 2017.
- [2] Muhammad Usama, Junaid Qadir, Aunn Raza, Hunain Arif, Kok-Lim Alvin Yau, Yehia Elkhatib, Amir Hussain, and Ala Al-Fuqaha. Unsupervised machine learning for networking: Techniques, applications and research challenges. arXiv preprint arXiv:1709.06599, 2017.
- [3] Junfeng Xie, F Richard Yu, Tao Huang, Renchao Xie, Jiang Liu, Chenmeng Wang, and Yunjie Liu. A survey of machine learning techniques applied to software defined networking (sdn): Research issues and challenges. IEEE Communications Surveys & Tutorials, 21(1):393–430, 2018.
- [4] Li Chen, Justinas Lingys, Kai Chen, and Feng Liu. Auto: Scaling deep reinforcement learning for datacenter-scale automatic traffic optimization. In Proceedings of the 2018 Conference of the ACM Special Interest Group on Data Communication, pages 191–205. ACM, 2018.
- [5] Rohan Gandhi, Y Charlie Hu, and Ming Zhang. Yoda: a highly available layer-7 load balancer. In Proceedings of the Eleventh European Conference on Computer Systems, page 21. ACM, 2016.
- [6] Tushar Swamy, Alexander Rucker, Muhammad Shahbaz, and Kunle Olukotun. Taurus: An intelligent data plane. arXiv preprint arXiv:2002.08987, 2020.
- [7] Adithya Kumar, Iyswarya Narayanan, Timothy Zhu, and Anand Sivasubramaniam. The fast and the frugal: Tail latency aware provisioning for coping with load variations. In Proceedings of The Web Conference 2020, pages 314–326, 2020.
- [8] Silvery Fu, Saurabh Gupta, Radhika Mittal, and Sylvia Ratnasamy. On the use of ml for blackbox system performance prediction. In NSDI, pages 763–784, 2021.
- [9] The Fast Data Project (fd.io). Vector Packet Processing (VPP). https://wiki.fd.io/view/VPP/.
- [10] Hongzi Mao, Malte Schwarzkopf, Shaileshh Bojja Venkatakrishnan, Zili Meng, and Mohammad Alizadeh. Learning scheduling algorithms for data processing clusters. arXiv preprint arXiv:1810.01963, 2018.
- [11] Sheraz Naseer, Yasir Saleem, Shehzad Khalid, Muhammad Khawar Bashir, Jihun Han, Muhammad Munwar Iqbal, and Kijun Han. Enhanced network anomaly detection based on deep neural networks. IEEE access, 6:48231–48246, 2018.
- [12] Mohiuddin Ahmed, Abdun Naser Mahmood, and Jiankun Hu. A survey of network anomaly detection techniques. Journal of Network and Computer Applications, 60:19–31, 2016.
- [13] Viswanath Sivakumar, Tim Rocktäschel, Alexander H Miller, Heinrich Küttler, Nantas Nardelli, Mike Rabbat, Joelle Pineau, and Sebastian Riedel. Mvfst-rl: An asynchronous rl framework for congestion control with delayed actions. arXiv preprint arXiv:1910.04054, 2019.
- [14] Daniel E Eisenbud, Cheng Yi, Carlo Contavalli, Cody Smith, Roman Kononov, Eric Mann-Hielscher, Ardas Cilingiroglu, Bin Cheyney, Wentao Shang, and Jinnah Dylan Hosein. Maglev: A fast and reliable software network load balancer. In NSDI, pages 523–535, 2016.
- [15] Jiao Zhang, Shubo Wen, Jinsheng Zhang, Hua Chai, Tian Pan, Tao Huang, Linquan Zhang, Yunjie Liu, and F. Richard Yu. Fast switch-based load balancer considering application server states. IEEE/ACM Transactions on Networking, page 1–14, 2020.
- [16] Chuanxiong Guo, Lihua Yuan, Dong Xiang, Yingnong Dang, Ray Huang, Dave Maltz, Zhaoyi Liu, Vin Wang, Bin Pang, Hua Chen, et al. Pingmesh: A large-scale system for data center network latency measurement and analysis. In Proceedings of the 2015 ACM Conference on Special Interest Group on Data Communication, pages 139–152, 2015.
- [17] Martín Abadi et al. TensorFlow: Large-scale machine learning on heterogeneous systems, 2015. Software available from tensorflow.org.
- [18] Arjun Roy, Hongyi Zeng, Jasmeet Bagga, George Porter, and Alex C. Snoeren. Inside the social network’s (datacenter) network. In Proceedings of the 2015 ACM Conference on Special Interest Group on Data Communication, SIGCOMM ’15, page 123–137. ACM, 2015. event-place: London, United Kingdom.
- [19] Erik-Jan van Baaren. Wikibench: A distributed, wikipedia based web application benchmark. Master’s thesis, VU University Amsterdam, 2009.
- [20] Guido Urdaneta, Guillaume Pierre, and Maarten van Steen. Wikipedia workload analysis for decentralized hosting. Elsevier Computer Networks, 53(11):1830–1845, July 2009.
Appendix A Feature Collection
The whole list of networking features coleected in Aquarius are shown in figure 10. They can be categorized into counters and sampled features, which can be further divided into time- and throughput-related features. Figure 10 depicts the computation process of server processing time derived from TCP timestamp option. TCP traffic is used in this paper to illustrate the workflow since it is the most widely used protocol in content delivery network [18]. The same workflow and discussion apply to other network traffic (UDP and QUIC).

Appendix B Testbed Configuration
B.1 System Platform
Application servers are virtualized on UCS B200 M4 servers, each with one Intel Xeon E5-2690 v3 processor (12 physical cores and 48 logical cores), interconnected by UCS 6332 16UP fabric. Operating systems are Ubuntu 18.04.3 LTS (GNU/Linux 4.15.0-128-generic x86_64). Compilers are gcc version 7.5.0 (Ubuntu 7.5.0-3ubuntu1 18.04). Applications employed in this paper are the following: Apache 2.4.29, VPP v20.05, MySQL 5.7.25-0ubuntu0.18.04.2, and MediaWiki v1.30. The VMs are deployed on the same layer- link, with statically configured routing tables. Apache HTTP servers share the same VIP address on one end of GRE tunnels with the load balancer on the other end.
B.2 Apache HTTP Servers
The Apache servers use mpm_prefork module to boost performance. Each server has maximum worker threads and TCP backlog is set to . In the Linux kernel, the tcp_abort_on_overflow parameter is enabled, so that a TCP RST will be triggered when the queue capacity of TCP connection backlog is exceeded, instead of silently dropping the packet and waiting for a SYN retransmit. With this configuration, the FCT measures application response delays rather than potential TCP SYN retransmit delays. Two metrics are gathered as ground truth server load state on the servers: CPU utilization and instant number of Apache busy threads. CPU utilization is calculated as the ratio of non-idle cpu time to total cpu time measured from the file /proc/stat and the number of Apache busy threads is assessed via Apache’s scoreboard shared memory.
B.3 -Hour Wikipedia Replay Trace
To create Wikipedia server replicas, an instance of MediaWiki333https://www.mediawiki.org/wiki/Download of version , a MySQL server and the memcached cache daemon are installed on each of the application server instance. WikiLoader tool [19] and a copy of the English version of Wikipedia database [20], are used to populate MySQL databases. The 24-hour trace is obtained from the authors of [20] and for privacy reasons, the trace does not contain any information that exposes user identities.
B.4 PHP for-Loop Trace
To study CPU-bound applications, a PHP for-loop script is used, whose requested number of iterations #iter follows an exponential distribution. The sizes of the queries’ replies are proportional to the number of iterations. This allows to generate a heavy-tail distribution of flow durations and transmitted bytes as in [18].
B.5 PHP File Trace
To simulate IO-bound applications, PHP queries for static files of different sizes are used as in [15]. The sizes of files are KB, KB, KB, KB, MB, MB, and MB. files are generated for each size.
B.6 Configurations for Traces
|
Wiki | for-loop | file | |
|---|---|---|---|---|
| Group servers | -CPU | -CPU | -CPU | |
| Group servers | -CPU | -CPU | -CPU | |
| Queries/s |
Appendix C Reproducibility
The proposed mechanism (Aquarius) and artifacts (including code and datasets) will be open-sourced at https://github.com/ZhiyuanYaoJ/Aquarius. It allows to reproduce results in the submitted paper, and to generating more benchmark datasets that potentially benefit interdisciplinary research on computer networking and machine learning. A pipeline will be provided and documented to make the best use of Aquarius for both offline and online applications. Examples are illustrated by way of jupyter notebooks, which serve as step-by-step tutorials.
Appendix D ML Models
Dense1 is a benchmark model for sequential with flatten layer and fully connected layer of neural network. RNN2 is a model -hidden-unit SimpleRNN layers (first layer with return_sequence=True) and fully connected layers (the first layer with hidden units and the second as output layer). LSTM2 replaces the SimpleRNN RNN2 model with LSTM layers and GRU2 with GRU layers. 1DConv-GRU1 applies 1-dimentional CNN (as in textCNN) before applying layer of GRU networks and fully connected layers (output layer). 1DConv-GRU1 is modified by adding GRU layer between the CNN and the GRU layer with return_sequence=True, which gives limited improvement on sacrifying computational overhead. This variant model is omitted in this paper. Wavenet-GRU1 stacks dilated 1D convolutional layers with layer of -hidden-unit GRU and fully connected layers (output layer). Wavenet-Reconst puts -hidden-unit embedding layer before stacked dilated 1D convolutional layers and layer of -hidden-unit GRU layer, together with output layer.