Arvindkumar Krishnakumarakrishna@gatech.edu1
\addauthorViraj Prabhuvirajp@gatech.edu1
\addauthorSruthi Sudhakarsruthis@gatech.edu1
\addauthorJudy Hoffmanjudy@gatech.edu1
\addinstitution
Georgia Institute of Technology
Atlanta, GA
Unsupervised Discovery of Bias in Deep Models
UDIS: Unsupervised Discovery of Bias in Deep Visual Recognition Models
Abstract
Deep learning models have been shown to learn spurious correlations from data that sometimes lead to systematic failures for certain subpopulations. Prior work has typically diagnosed this by crowdsourcing annotations for various protected attributes and measuring performance, which is both expensive to acquire and difficult to scale. In this work, we propose UDIS, an unsupervised algorithm for surfacing and analyzing such failure modes. UDIS identifies subpopulations via hierarchical clustering of dataset embeddings and surfaces systematic failure modes by visualizing low performing clusters along with their gradient-weighted class-activation maps. We show the effectiveness of UDIS in identifying failure modes in models trained for image classification on the CelebA and MSCOCO datasets. UDIS is available at https://github.com/akrishna77/bias-discovery.
1 Introduction
Computer vision technology has become increasingly dependent on deep learning models to help make intelligent decisions in high-stakes applications. Such models are often trained on large datasets of images like ImageNet [Russakovsky et al.(2015)Russakovsky, Deng, Su, Krause, Satheesh, Ma, Huang, Karpathy, Khosla, Bernstein, Berg, and Fei-Fei] and MSCOCO [Lin et al.(2014)Lin, Maire, Belongie, Hays, Perona, Ramanan, Dollár, and Zitnick], which have been shown to contain implicit biases [Torralba and Efros(2011), Wang et al.(2020a)Wang, Narayanan, and Russakovsky] that are imbibed and sometimes amplified [Shankar et al.(2017)Shankar, Halpern, Breck, Atwood, Wilson, and Sculley, Bolukbasi et al.(2016)Bolukbasi, Chang, Zou, Saligrama, and Kalai] by these models. Further, these pretrained models are frequently used as an initialization for other downstream tasks through transfer learning [Tan et al.(2018)Tan, Sun, Kong, Zhang, Yang, and Liu]. It is thus crucial that in addition to being accurate, models be fair and perform equitably across different dataset subpopulations.
However, recent studies have shown several examples where state-of-the-art deep computer vision models learn spurious correlations from their training data which leads to significant performance variance across subpopulations, sometimes across sensitive attributes like race and gender [Hendricks et al.(2018)Hendricks, Burns, Saenko, Darrell, and Rohrbach, Angwin et al.(2016)Angwin, Larson, Mattu, and Kirchner, Buolamwini and Gebru(2018), Zhao et al.(2017)Zhao, Wang, Yatskar, Ordonez, and Chang, Wilson et al.(2019)Wilson, Hoffman, and Morgenstern], or even contextual and reporting biases [Eykholt et al.(2018)Eykholt, Evtimov, Fernandes, Li, Rahmati, Xiao, Prakash, Kohno, and Song, de Vries et al.(2019)de Vries, Misra, Wang, and van der Maaten, Rosenfeld et al.(2018)Rosenfeld, Zemel, and Tsotsos, Beery et al.(2018)Beery, Horn, and Perona]. Learning such spurious correlations typically leads to poor performance on underrepresented dataset subpopulations and out-of-distribution test data. These models are typically evaluated based on standard performance metrics like test set accuracy, but it is equally important to ensure that the model will perform fairly across different subpopulations when provided with previously unseen data.
Determining whether a trained model is biased is a challenging problem. Prior work has relied on enumerating sensitive attributes (such as race and gender), collecting annotations from domain experts, and measuring performance across these [Joo and Kärkkäinen(2020), Bellamy et al.(2018)Bellamy, Dey, Hind, Hoffman, Houde, Kannan, Lohia, Martino, Mehta, Mojsilovic, Nagar, Ramamurthy, Richards, Saha, Sattigeri, Singh, Varshney, and Zhang, Cabrera et al.(2019)Cabrera, Epperson, Hohman, Kahng, Morgenstern, and Chau, Brandao(2019), Klare et al.(2012)Klare, Burge, Klontz, Vorder Bruegge, and Jain, KrishnapriyaK. et al.(2019)KrishnapriyaK., Vangara, King, Albiero, and Bowyer]. This process requires considerable manual effort and cost, and is challenging to scale to large datasets.
In this work we present UDIS, a tool to audit deep learning models for biases before deploying them in the wild. UDIS discovers subpopulations of the dataset for which the model systematically underperforms, without requiring any protected attribute annotations whatsoever and using only the dataset test split. UDIS performs hierarchical clustering of dataset embeddings and identifies systematic failure modes by visualizing low performing clusters along with their gradient-weighted class-activation (GradCAM [Selvaraju et al.(2017)Selvaraju, Cogswell, Das, Vedantam, Parikh, and Batra]) maps. We show the effectiveness of UDIS in identifying failure modes in visual recognition models trained on the CelebA and MSCOCO datasets. We make the following contributions:
-
•
We present UDIS, the first unsupervised method for discovering model bias which identifies dataset subpopulations on which the model systematically underperforms, without the need for protected attribute annotations.
-
•
We demonstrate the effectiveness of UDIS at identifying failure modes on the CelebA and MSCOCO datasets.
2 Related Work
While there has been considerable prior work in measuring bias in deep learning models, to the best of our knowledge all of them require apriori knowledge as well as annotations for protected classes across which we desire the model to be unbiased. We summarize these lines of prior work below:
Observational methods. Torralba and Efros [Torralba and Efros(2011), Ponce et al.(2006)Ponce, Berg, Everingham, Forsyth, Hebert, Lazebnik, Marszalek, Schmid, Russell, Torralba, Williams, Zhang, and Zisserman] were among the first to stir up the conversation of dataset bias in computer vision, introducing simple measures like cross-dataset generalization and negative set bias to understand how datasets may bias trained models. Recently, Singh et al\bmvaOneDot[Singh et al.(2020)Singh, Mahajan, Grauman, Lee, Feiszli, and Ghadiyaram] proposed the use of statistical information to identify biased categories. They define a category b as biased by category c if (1) the prediction probability of b drops significantly in the absence of c and (2) b co-occurs frequently with c. This requires knowledge of the dataset attributes to determine categories that are biased, along with their co-occurring context category. Other related works tackle the problem of dataset bias by defining algorithms [Dwork et al.(2012)Dwork, Hardt, Pitassi, Reingold, and Zemel, Khosla et al.(2012)Khosla, Zhou, Malisiewicz, Efros, and Torralba, Wang et al.(2020b)Wang, Qinami, Karakozis, Genova, Nair, Hata, and Russakovsky] and metrics [Zhang et al.(2018)Zhang, Lemoine, and Mitchell, Pleiss et al.(2017)Pleiss, Raghavan, Wu, Kleinberg, and Weinberger, Kilbertus et al.(2017)Kilbertus, Rojas-Carulla, Parascandolo, Hardt, Janzing, and Schölkopf, Gajane(2017)] to establish fairness. In contrast, our method leverages dataset embeddings that can be computed using a forward pass with the model, and is able to identify model biases on the dataset without explicit knowledge of protected attributes and their annotations.
Bias detection toolkits. Most recently, Wang et al\bmvaOneDot[Wang et al.(2020a)Wang, Narayanan, and Russakovsky] released an open-source tool that assists in investigating biases within visual datasets, surfacing potential biases along three specific dimensions: object-based, gender-based, and geography-based. Their method however requires datasets to have object, gender, and geography annotations to discover these biases. Two limitations of their method are that i) these annotations may not be easily available, ii) the method would miss failure modes along other dimensions. Further, as they acknowledge, some of their insights are derived from pretrained models and external tools that may themselves contain implicit biases. IBM’s AI Fairness 360 [Bellamy et al.(2018)Bellamy, Dey, Hind, Hoffman, Houde, Kannan, Lohia, Martino, Mehta, Mojsilovic, Nagar, Ramamurthy, Richards, Saha, Sattigeri, Singh, Varshney, and Zhang] uses a comprehensive set of metrics, algorithms and mitigation strategies to measure, report and reduce biases in datasets and machine learning models. Similarly, FairML [Adebayo(2016)] is a toolbox that helps audit predictive models by computing the relative significance of the model’s inputs. Models are then queried with sample data that emulates real world inputs, and perturbing this data helps determine model fairness. Cabrera et al\bmvaOneDotpresent Fairvis [Cabrera et al.(2019)Cabrera, Epperson, Hohman, Kahng, Morgenstern, and Chau], a visual analytics tool that helps audit fairness in machine learning models by allowing domain experts to investigate subgroups of data, reporting a high-level overview of their performance and suggesting similar subgroups to explore for detecting bias. These methods require full knowledge of the dataset and report bias through well-defined fairness metrics. Our tool works explicitly with visual recognition models and reports bias through underperforming data subpopulations, utilizing visual explanations to understand failure modes. A few methods rely on small image perturbations to determine salient regions of the input image for tasks to establish the presence of bias [Chang et al.(2019)Chang, Creager, Goldenberg, and Duvenaud, Dabkowski and Gal(2017), Fong and Vedaldi(2017), Goyal et al.(2019)Goyal, Wu, Ernst, Batra, Parikh, and Lee].
Counterfactual Approaches. Denton et al\bmvaOneDot[Hutchinson et al.(2019)Hutchinson, Denton, Mitchell, and Gebru] and Balakrishnan et al\bmvaOneDot[Balakrishnan et al.(2020)Balakrishnan, Xiong, Xia, and Perona] present a counterfactual method to identify biases in a smiling attribute classifier. They accomplish this by building a generative model of face images that manipulates specific image characteristics along meaningful factors of variation. They then test how the prediction of the trained classifier changes if a characteristic (deemed irrelevant to the classification task by humans) is altered in a specific targeted manner. They use this technique to identify a causal relationship between features in an image and the classifier output and establish a source of bias. The effectiveness of such methods highly depend on how well the model is able to sufficiently disentangle different image attributes, and ensuring that the newly generated images contain no other significant changes that may affect the outcome of the task. Dash et al\bmvaOneDot[Dash et al.(2022)Dash, Balasubramanian, and Sharma] and Joo and Kärkkäinen [Joo and Kärkkäinen(2020)] also propose counterfactual methods to identify bias in visual models. However, they explore bias with respect to specific protected attributes like race and gender. Our method does not require specific sensitive attributes and tries to identify sources of bias of any form that lead to systematic failure modes.
3 Approach

We introduce UDIS for the unsupervised discovery of model biases. We combine a hierarchical clustering technique to discover data subsets deemed similar by the model and use a performance ranking criteria to sort hundreds of clusters and propose to the developer only the few sets most likely to be caused by model bias (see Figure 1), eliminating the cost of annotating large-scale data.
Given attribute annotations, prior work [Hutchinson et al.(2019)Hutchinson, Denton, Mitchell, and Gebru] has shown it is possible to learn latent vectors corresponding to semantic concepts, and using these to detect bias via evaluating counterfactual queries. More recent work [Peebles et al.(2020)Peebles, Peebles, Zhu, Efros, and Torralba] has shown that it may be possible to learn such disentangled latent vectors in an unsupervised fashion. But image generation is hard and learning to manipulate one specific attribute at a time is even harder, even in a supervised manner. Further, it is not guaranteed that the learned attributes will be semantic or correspond to features we care about. It is also not clear if this approach will generalize to more complex / smaller datasets. One possible approach is to use off-the-shelf attribute predictors as an alternative to not having attribute annotations, but such models may contain implicit biases themselves.
Our method utilizes model interpretability, in an effort to find similar sets of images where the model behaves similarly. Since we would like to use this tool mainly for error analysis, we focus on the groups of images for which the model performs poorly.
3.1 Notation
Let and represent the input images and predicted class respectively. Then for a trained convolutional neural network, , our goal is to identify clusters of similar images that could potentially suggest model biases. For a given input image , the model M generates a -dimensional output (for classes) for the classification task,
| (1) |
where is the penultimate layer embeddings and is the final classifier layer.
We define the overall accuracy of the model on the test dataset as ACC and accuracy of the model on a cluster of images, as ACC. In the multi-label classification setting, when discovering biases with respect to a category b, ACC represents the model accuracy with respect to category b over the full test dataset .
3.2 Visual Explanations
On retrieving clusters of images, we wish to discover the features of the input image that is responsible for the classification decision. In this regard, we use heatmaps based on GradCAM [Selvaraju et al.(2017)Selvaraju, Cogswell, Das, Vedantam, Parikh, and Batra] to visualize a mask over the region of the image that the model is focusing on for its classification decision. We compute this mask by computing the gradient of the score for the predicted class , with respect to the feature map activations of the final convolutional layer and global-average-pooling them to obtain importance values for the feature maps. We then apply a ReLU over the weighted linear combination of feature maps and their importances, to obtain a localization heatmap on the region of interest for the class .
3.3 UDIS: Unsupervised Discovery of Bias in Deep Visual Recognition Models
3.3.1 Feature Extraction and Cluster Tree Generation
In both the binary and multi-label classification settings, we compute hidden representations using the penultimate layer of the network (i.e. the layer before the logits layer). For the binary classification setting, we do so for each image in the test dataset, whereas, for multi-label classification, to observe bias with respect to a category b we compute for all the images in the test dataset where the model’s predictions contain the category b.
We then perform hierarchical bottom-up clustering [Ward(1963)] on these hidden representations . We begin with each hidden vector as a singleton cluster, and recursively merge the pair of clusters that leads to the least increase in total within-cluster variance after merging. We use euclidean distance as the metric to compute linkage. This results in a binary tree of image clusters, where leaf nodes represent each image in as an individual cluster and the root node represents . Parsing the tree from the root, we notice that clustering in this feature space recursively splits clusters into a relatively high accuracy cluster and a relatively low accuracy cluster at every iteration (see Figure 1, left).
3.3.2 Cluster Selection and Thresholding
We now present our approach for selecting a set of disjoint and important clusters from our binary cluster tree to present to the developer (see Figure 1, right). We begin by exploring the binary tree bottom-up and evaluating the silhouette score [Rousseeuw(1987)] for each cluster at different clustering iterations. Since our method focuses on determining failure modes indicative of model bias, we treat the highest ancestor with 100% cluster accuracy along any tree branch as a single cluster, while evaluating the silhouette score.
The silhouette score is a measure of how similar an image is to other images within the same cluster and different from images in other clusters. Our goal is to find a disjoint set of image clusters with the highest silhouette score. Here, the silhouette score for a given clustering refers to the mean silhouette coefficient across all samples. The silhouette coefficient for a single sample is defined using its mean intra-cluster distance and its mean nearest-cluster distance as:
| (2) |
The silhouette scores at different clustering iterations form a bitonic sequence, which is strictly increasing, and after the bitonic point, strictly decreasing. This is indicative of poor clustering at the top of the tree where all the images form a single cluster and poor clustering at the bottom of the tree where each image is its own cluster. Thus, the best clustering of images corresponds to the clustering with the bitonic point as its silhouette score. To determine this right set of image clusters optimally, we use a modified binary search. Consider an array of silhouette scores corresponding to every clustering iteration, we check the right subarray if the silhouette score of the array midpoint is part of an increasing subsequence, and the left subarray otherwise. We also impose an additional size constraint on the cluster, to ensure that the smallest cluster contains at least 5 images, and the largest cluster contains no more than 100 images, for the sake of visualization.
For a given clustering , we sort the retrieved clusters in increasing order of their cluster accuracies. Our interest lies in finding failure modes that lead to a large drop in performance. Clusters with small drops in performance compared to ACC tend to be misclassifications or errors and not biases. To surface clusters indicative of bias, we filter the retrieved clusters to obtain by dropping the clusters where the cluster accuracy is more than two-thirds of the overall model accuracy on the test set, i.e.
| (3) |
We experiment with different thresholds to filter the clusters that are potentially indicative of bias. We notice across our different settings that clusters with accuracies below 50% (for binary problems) are reflective of systematic errors and potentially model bias. To allow for the examination of additional, less obvious or cohesive error types, we return a superset which includes all clusters with accuracy less than 66% of the overall test accuracy.
For each cluster, , we also compute the average feature vector as,
| (4) |
which is used to provide the user with the nearest neighbor cluster with a high accuracy, based on the euclidean distance metric in the feature space. This provides the user with insight on deviant features amongst similar images that may be responsible for failures. If ground truth attribute information is present, the tool also presents the developer with the nearest neighbor cluster with a high accuracy, based on euclidean distance in ground truth attribute distribution space (details in supplementary material).
4 Experiments
4.1 Overview
We show the results of our method for three settings – two single attribute prediction tasks on the CelebA [Liu et al.(2015)Liu, Luo, Wang, and Tang] dataset and multilabel classification on the MS COCO [Lin et al.(2014)Lin, Maire, Belongie, Hays, Perona, Ramanan, Dollár, and Zitnick] dataset.
-
1.
Smiling prediction on CelebA. We train a Resnet50 [He et al.(2016)He, Zhang, Ren, and Sun] backbone (initialized with ImageNet weights) on the CelebA dataset to predict if a person is Smiling/Not Smiling. The trained model has an accuracy of 92% on test data.
-
2.
Smiling prediction on biased CelebA. In this setting, we intentionally induce bias in the dataset towards the “Black Hair” attribute. We do this by manually subsampling the training dataset to increase the proportion of images containing the “Black Hair” attribute that are labeled as “Smiling”. Conversely, we increase the proportion of images not having the “Black Hair” attribute that are labeled as “Not Smiling”. We ensure that the despite the induced bias, we have a model that performs well on test data (93% accuracy).
-
3.
Multilabel classification on MS COCO. As UDIS is model agnostic, we also include a multi-label 80-way classification task. We use an open-source DenseNet [Huang et al.(2017)Huang, Liu, van der Maaten, and Weinberger, Huang et al.(2019)Huang, Liu, Pleiss, van der Maaten, and Weinberger] classifier trained on the MSCOCO dataset from Wang et al\bmvaOneDot[Wang et al.(2019)Wang, Kembhavi, Farhadi, Yuille, and Rastegari], that uses a binary cross-entropy loss to predict multiple labels for an input image.
4.2 Implementation details
The ResNet50 models are trained with PyTorch [Paszke et al.(2019)Paszke, Gross, Massa, Lerer, Bradbury, Chanan, Killeen, Lin, Gimelshein, Antiga, Desmaison, Kopf, Yang, DeVito, Raison, Tejani, Chilamkurthy, Steiner, Fang, Bai, and Chintala] on 8 NVIDIA RTX 2080 GPUs with the SGD optimizer, batch size , weight decay , learning rate , momentum and a dropout of . The model accuracy in both the settings is comparable to that presented in Denton et al\bmvaOneDot[Hutchinson et al.(2019)Hutchinson, Denton, Mitchell, and Gebru].
For UDIS, we cluster the 2048-dimensional average pooled outputs of the ‘layer4’ module of the ResNet50 model. For the DenseNet model, we use the 1920-dimensional output of the final BatchNorm layer (‘norm5’) at the end of the dense blocks.
4.3 Biases Discovered by UDIS
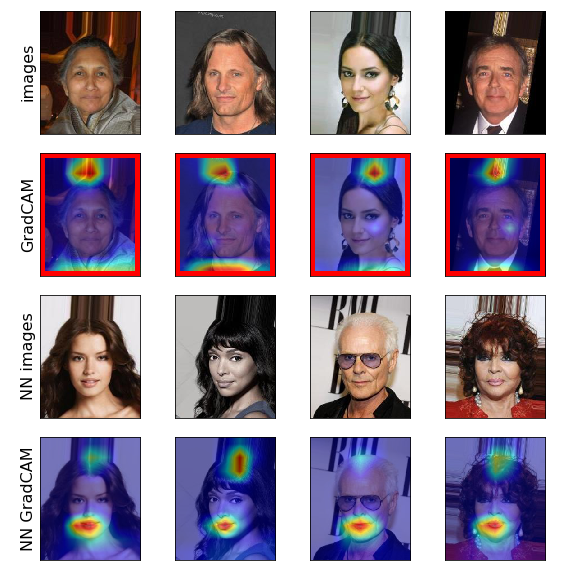
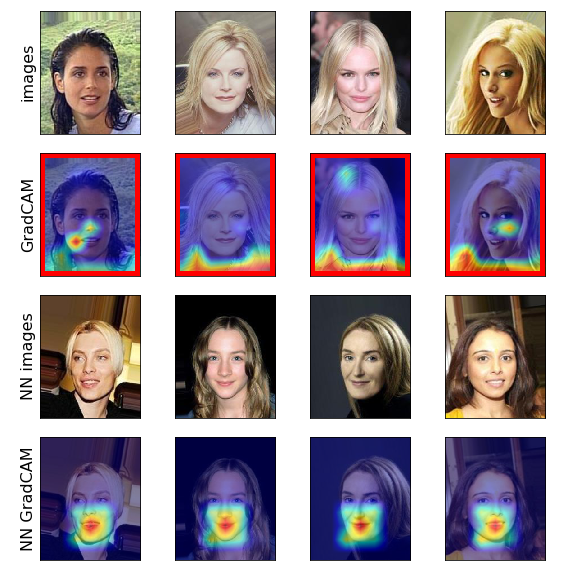
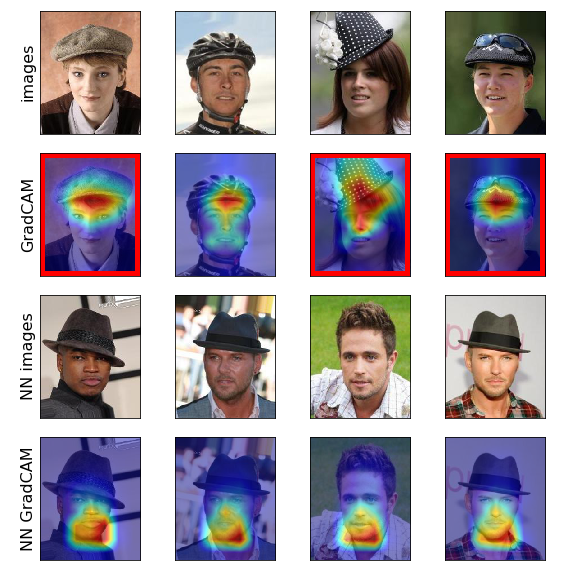
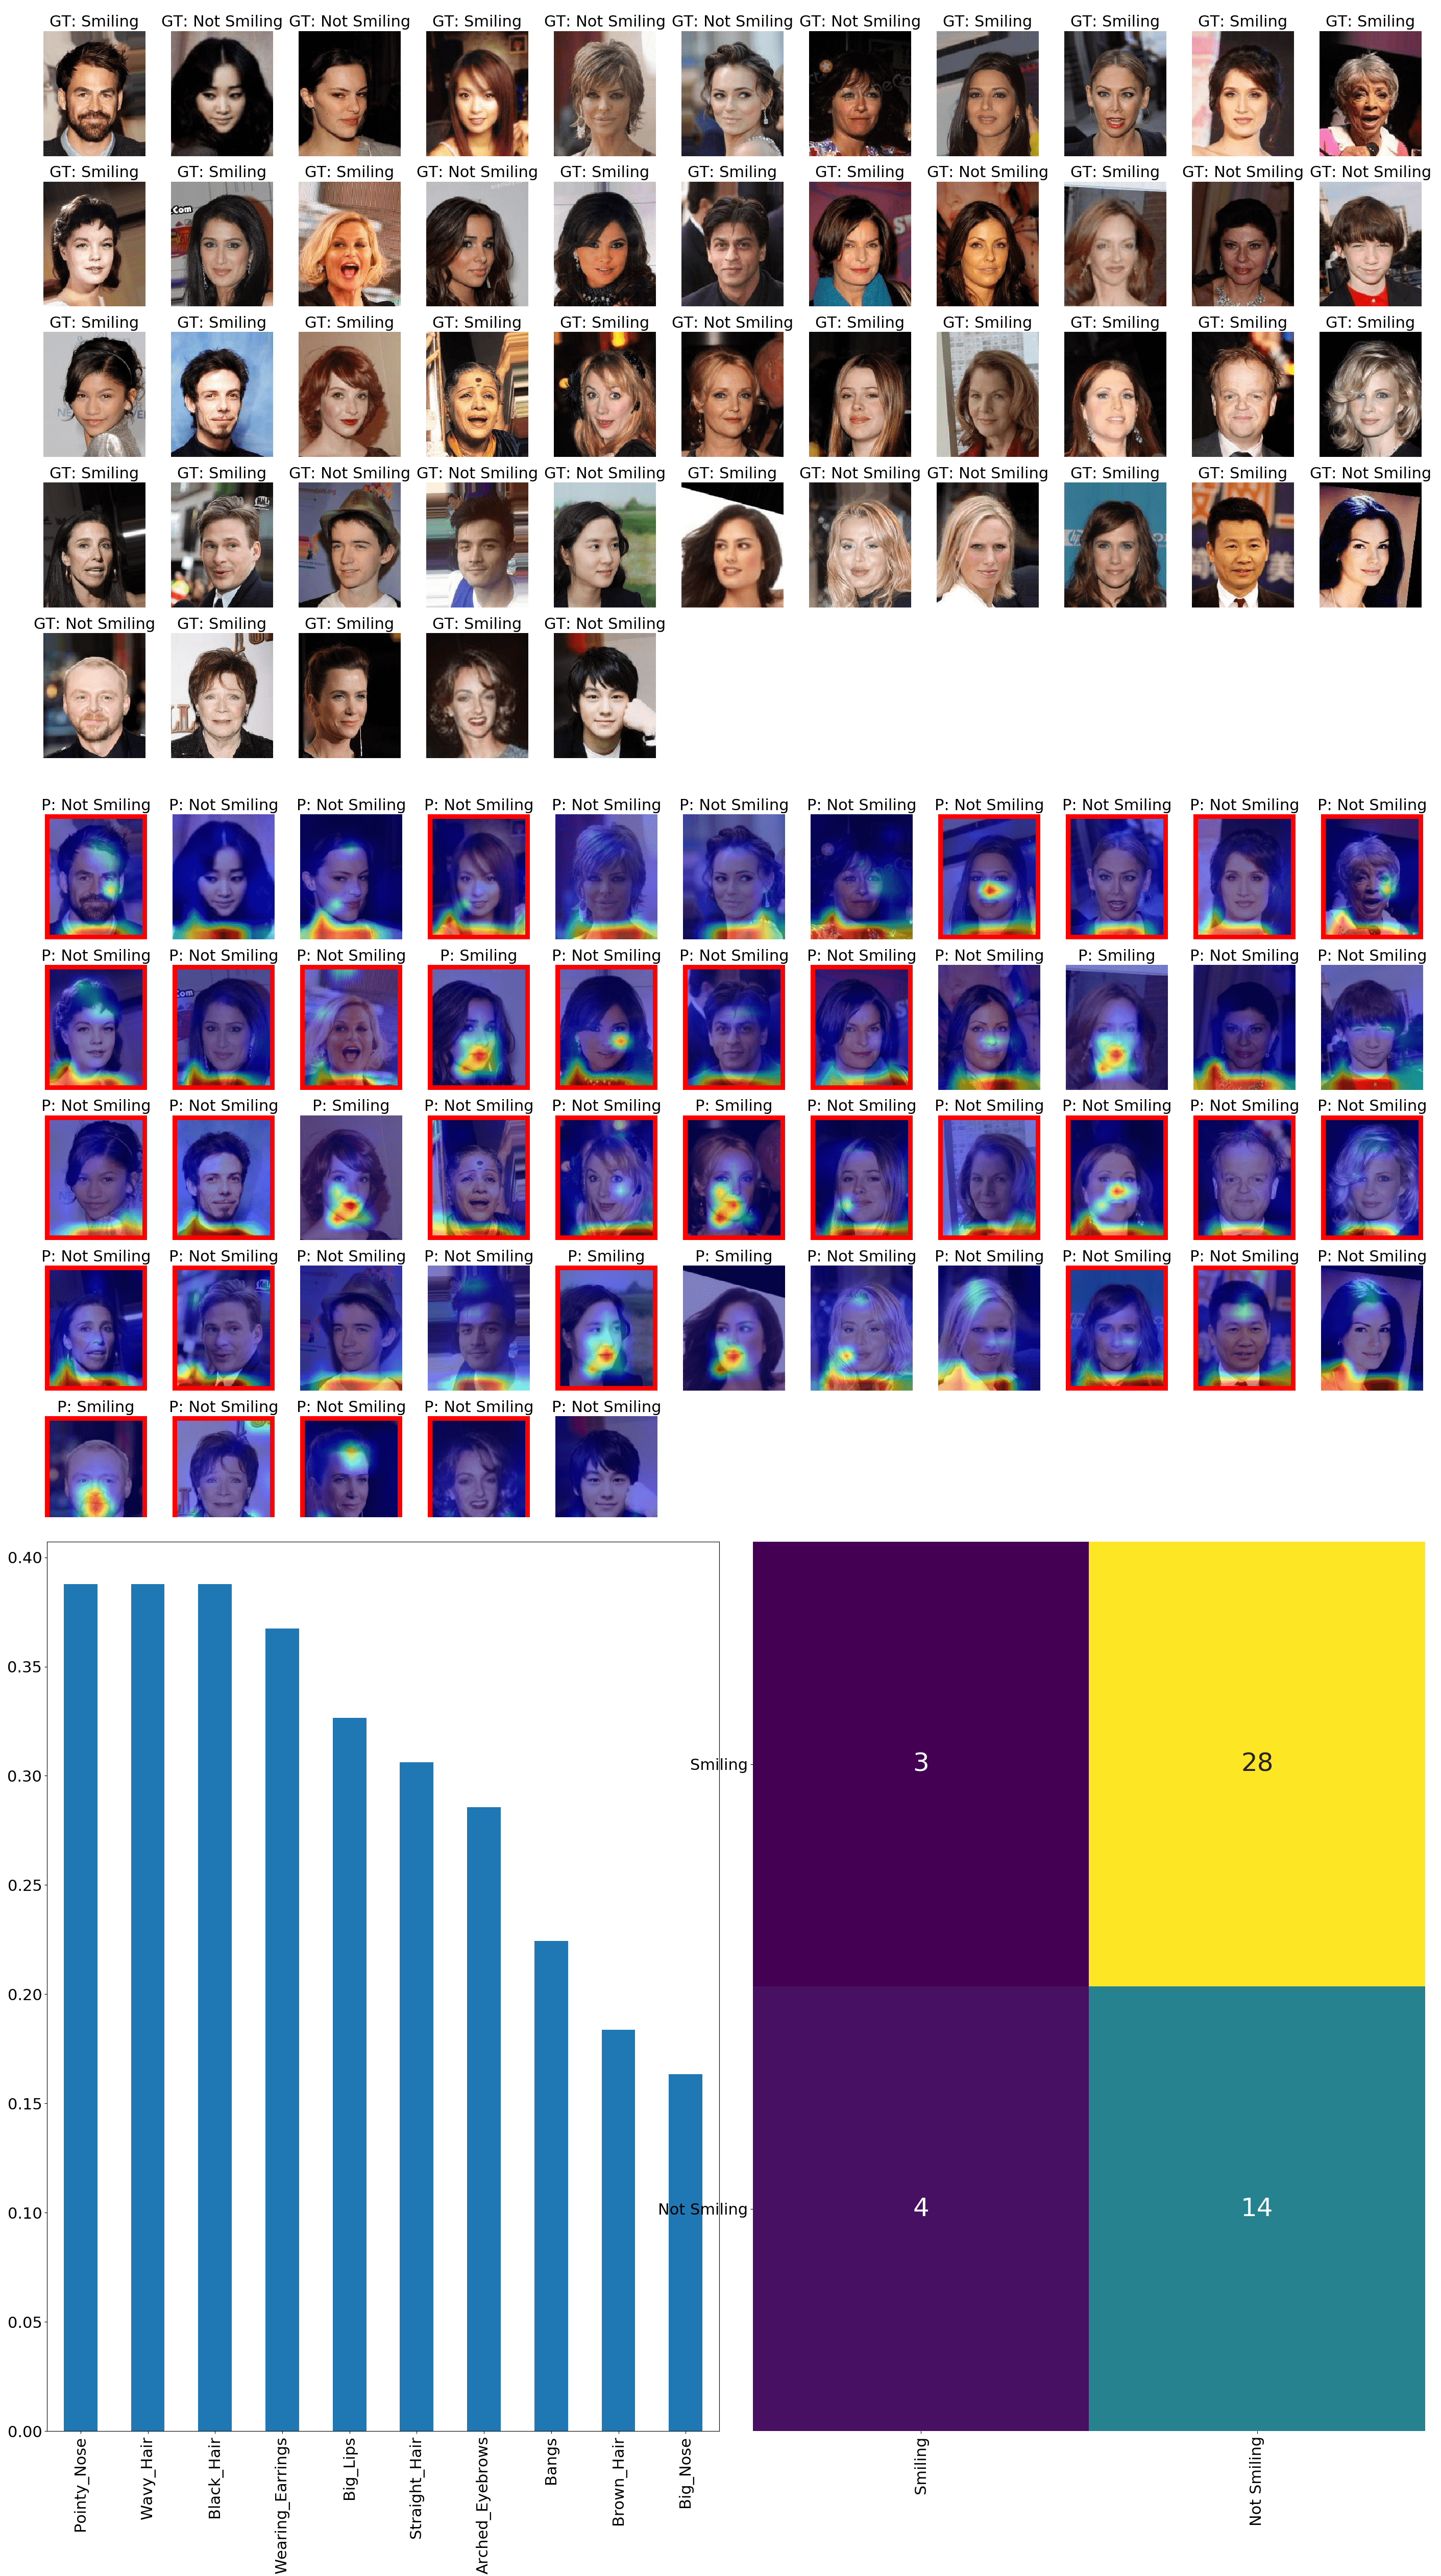
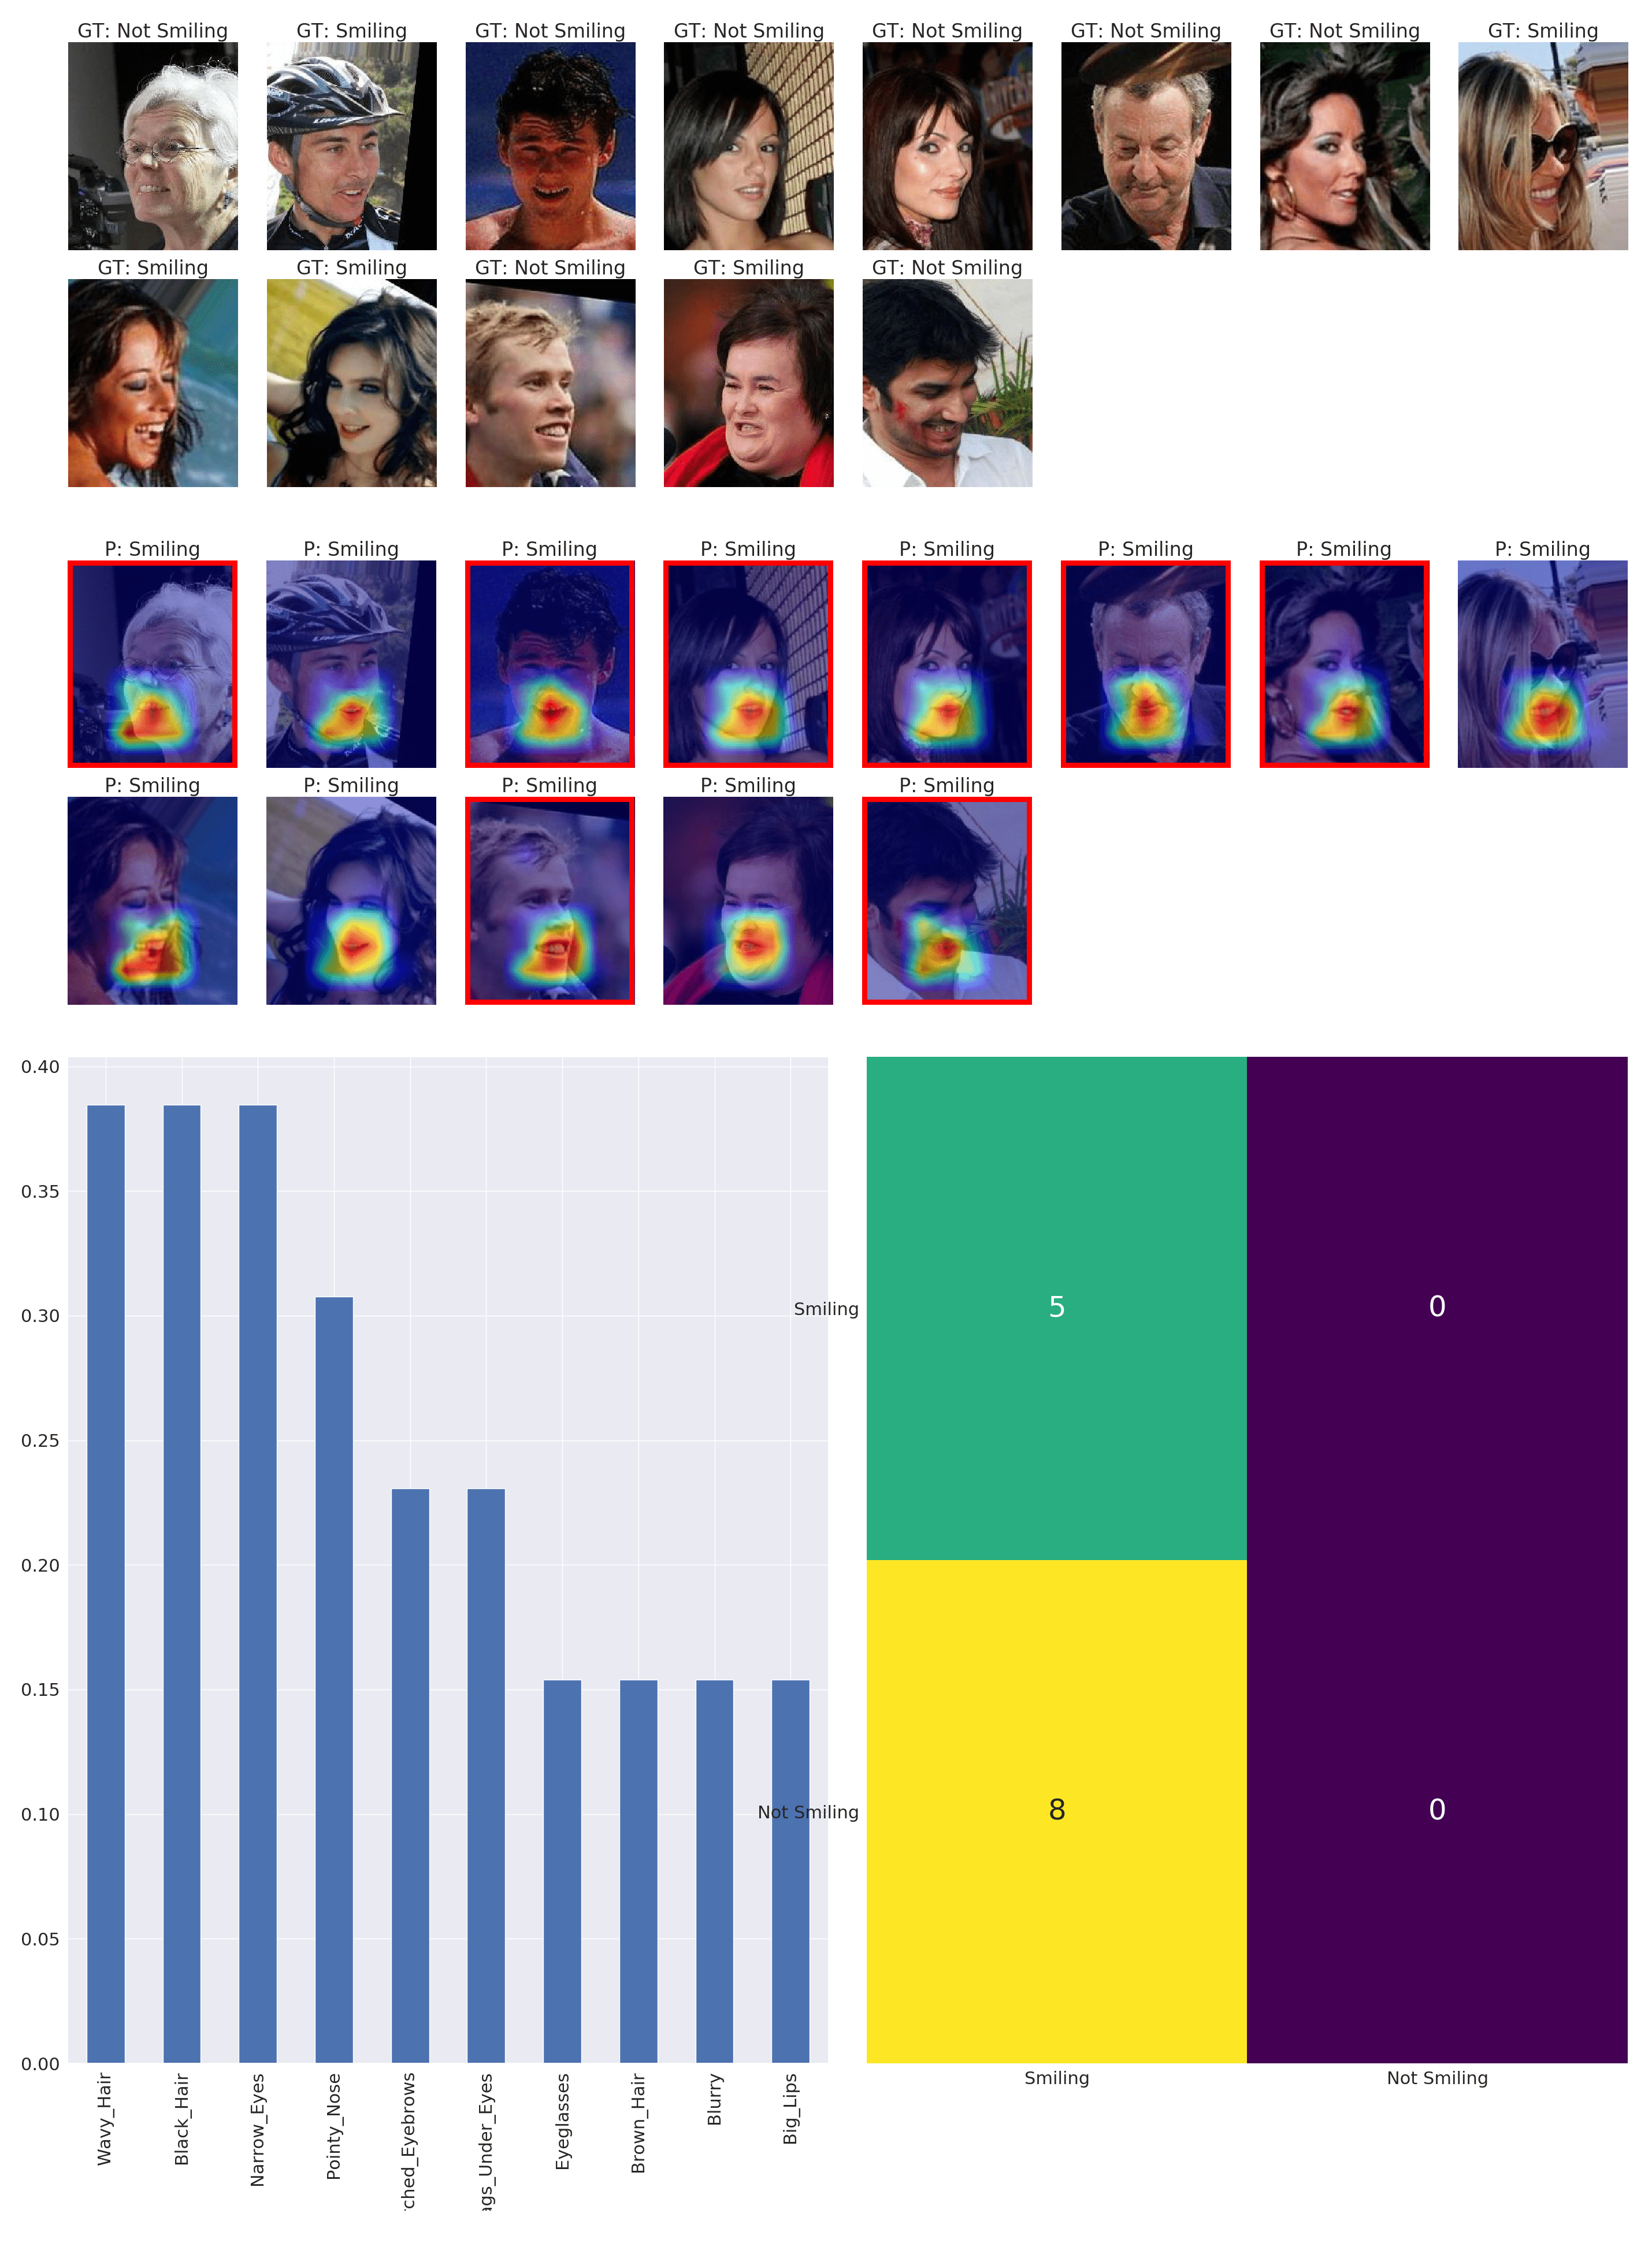
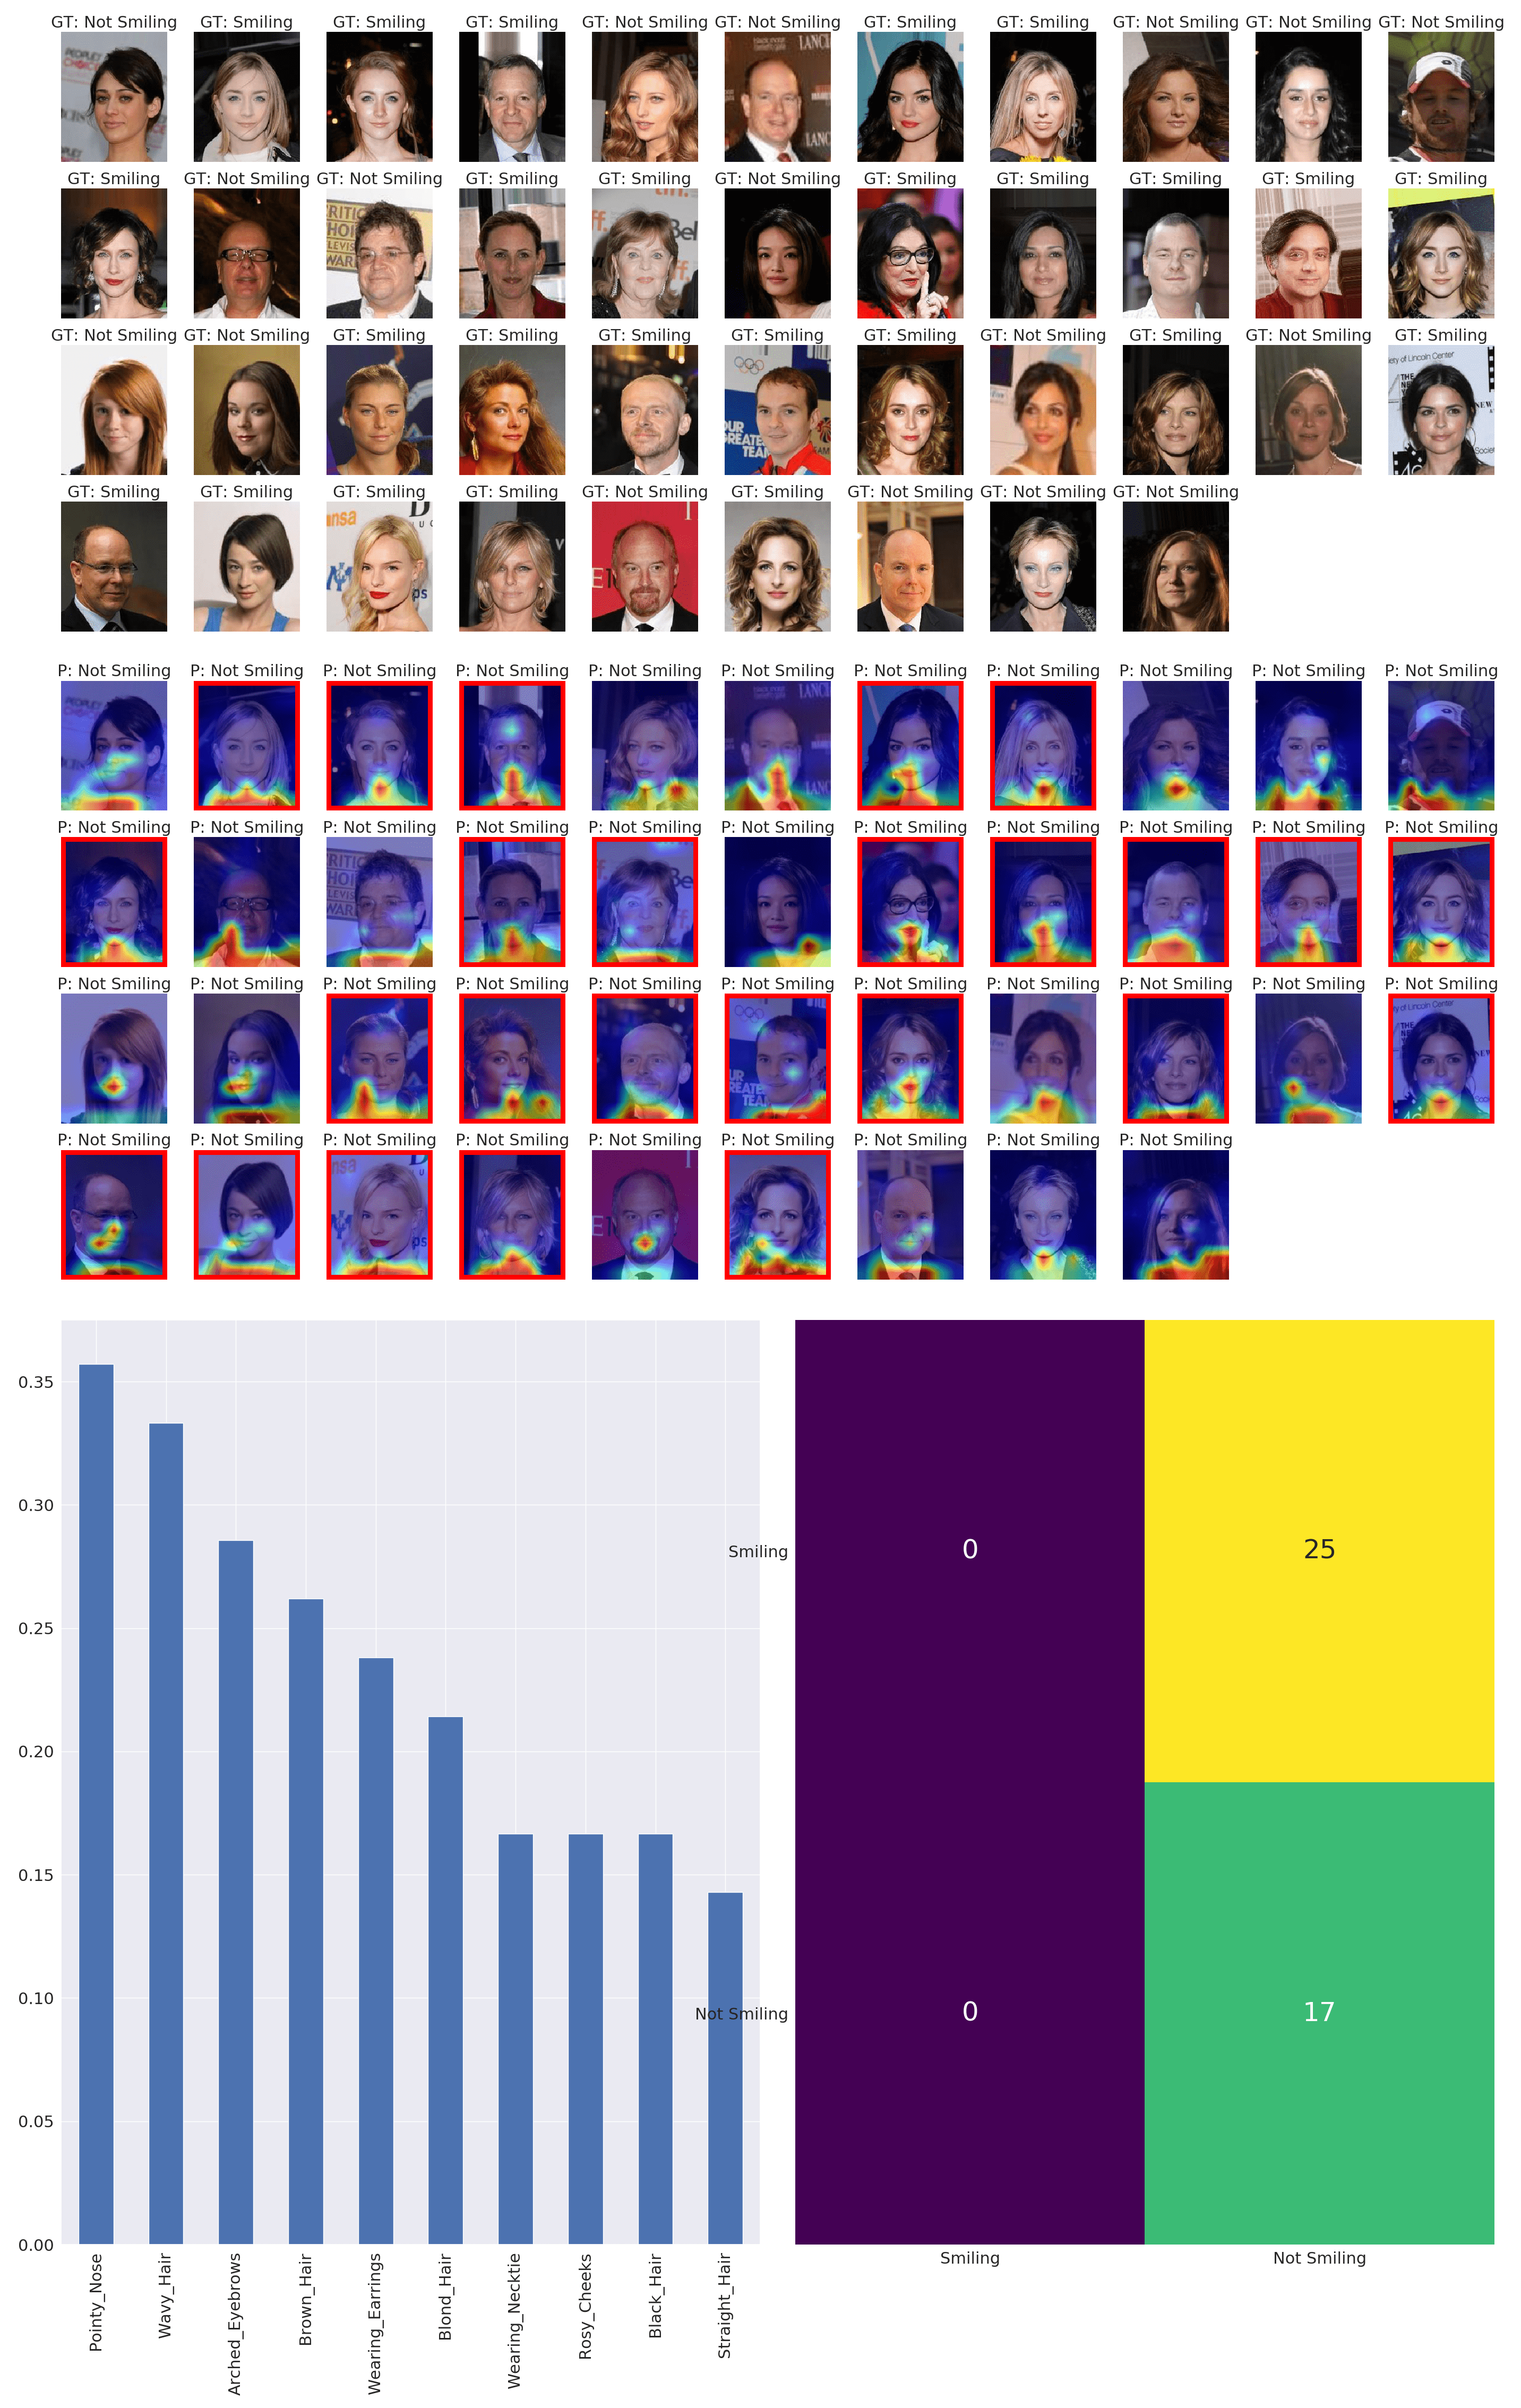
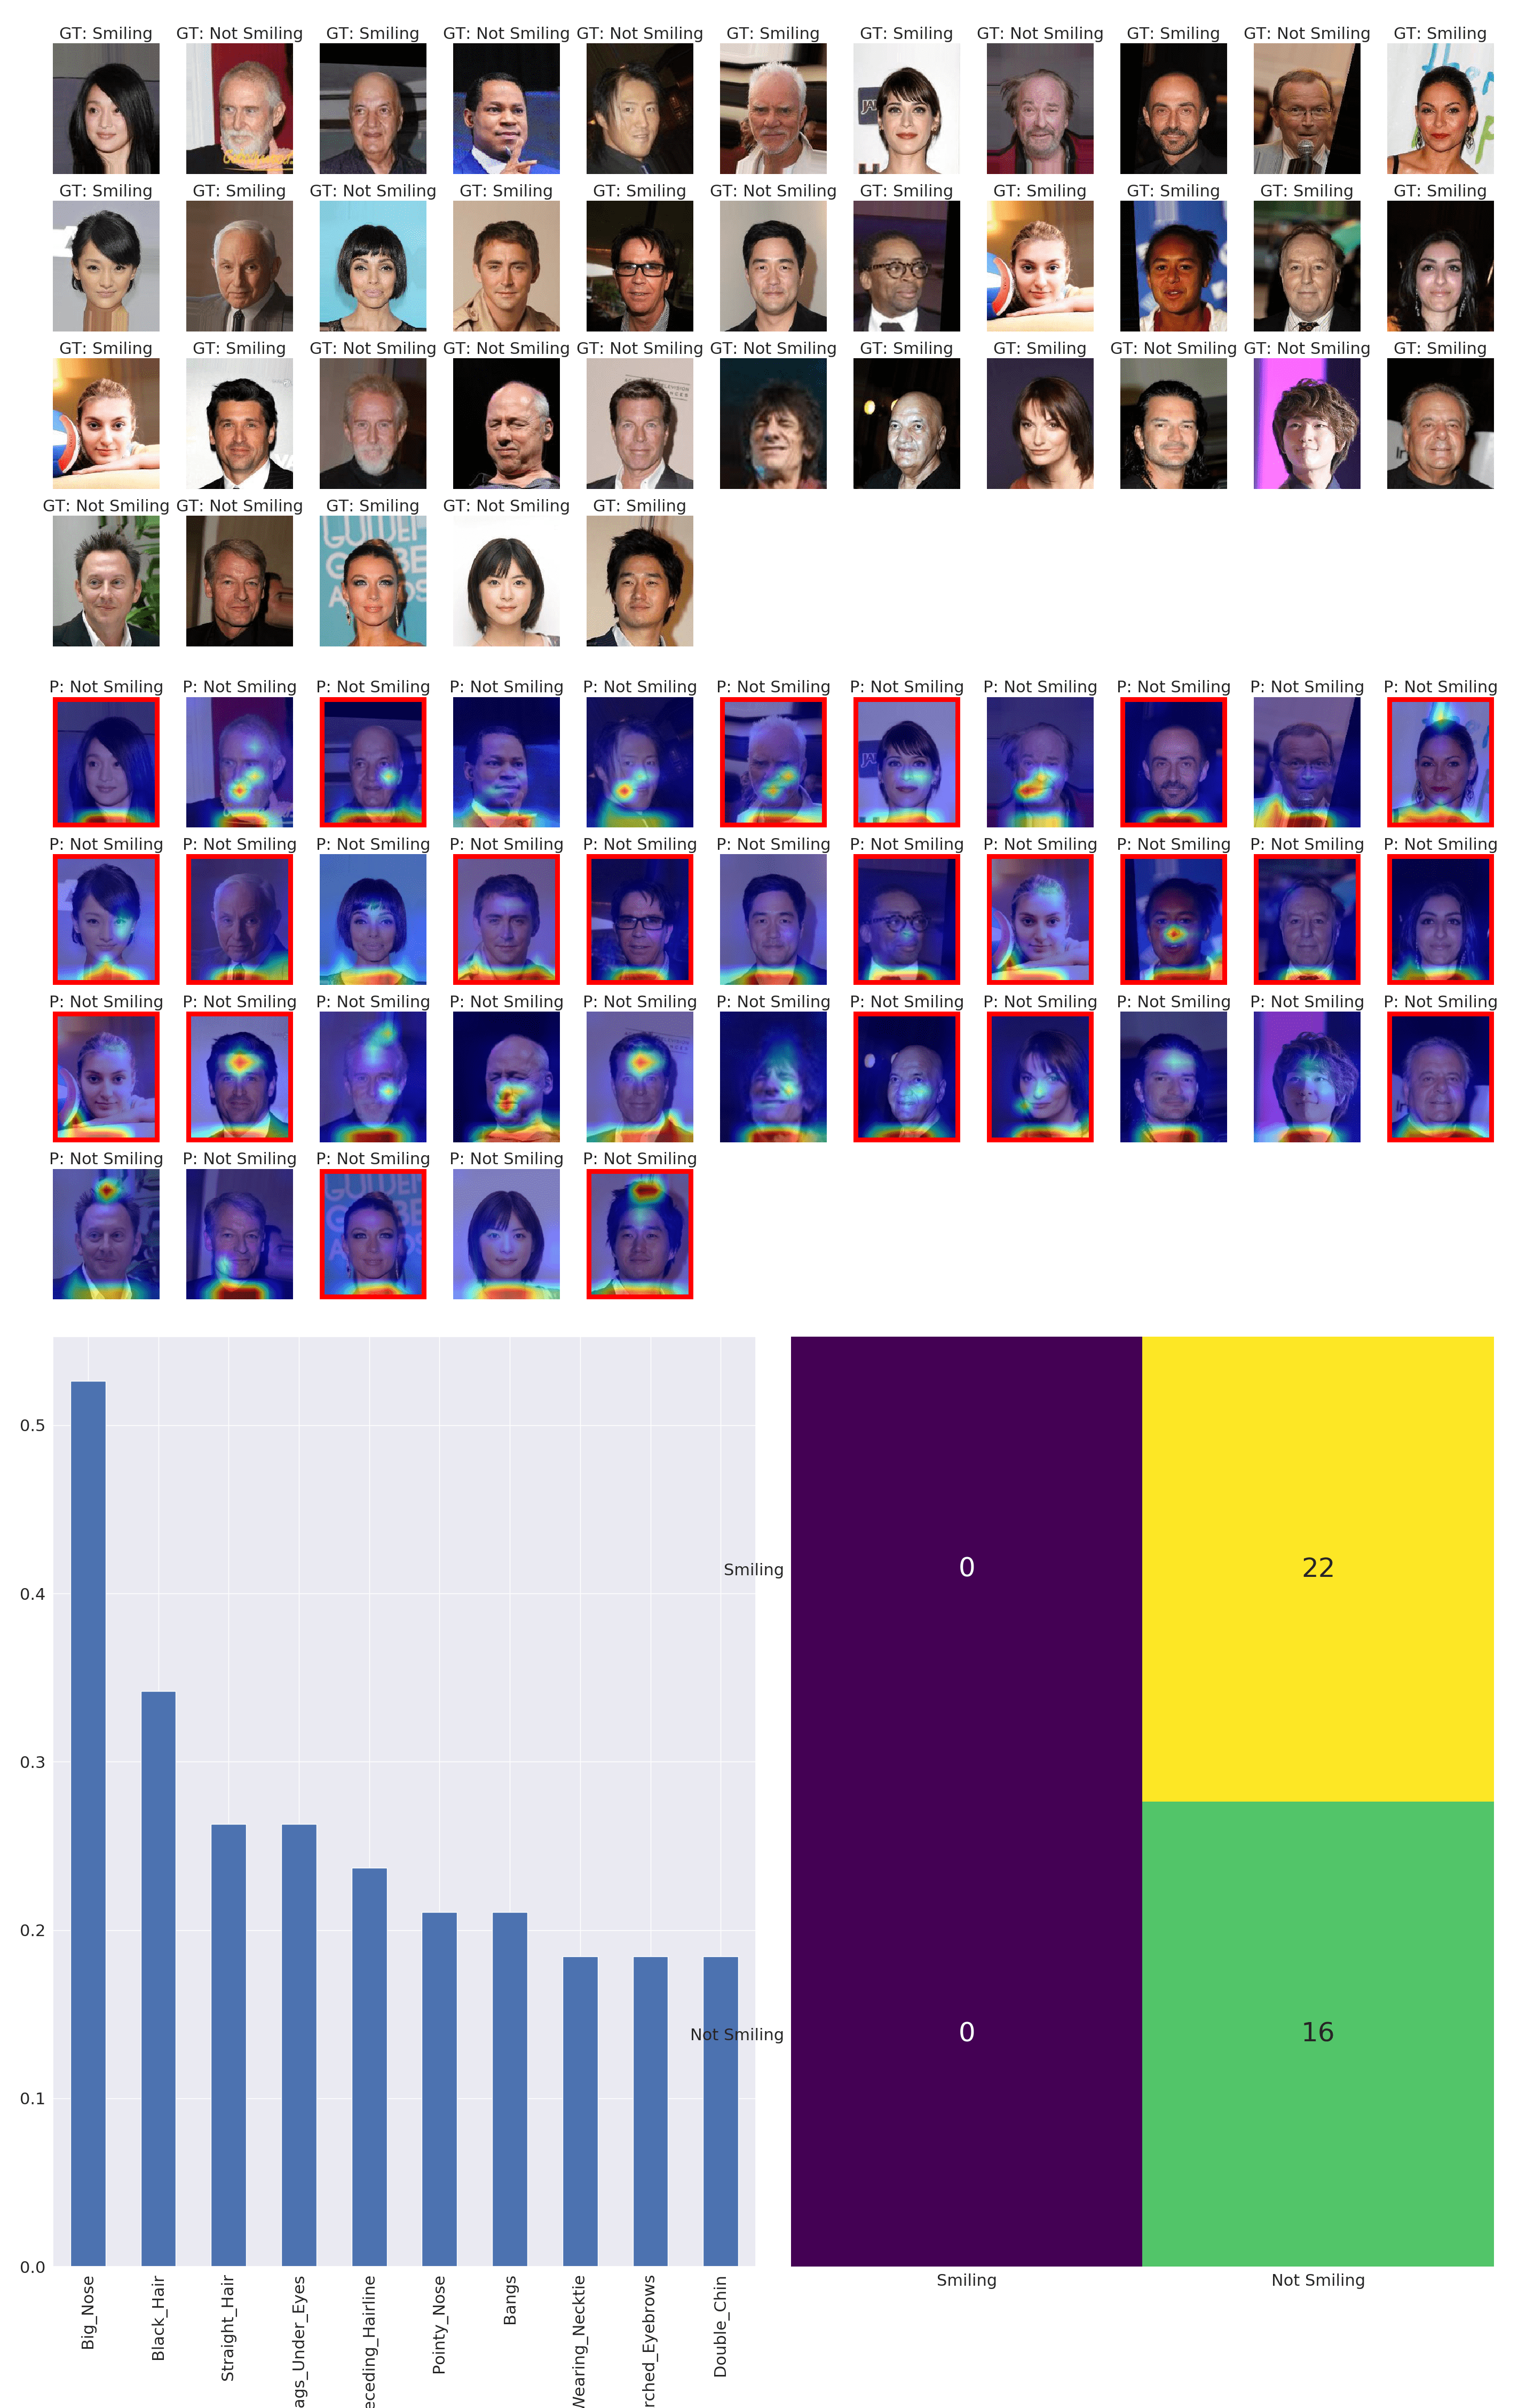
In Figures 2- 4, we present some of the biases discovered by UDIS across settings. In Figures 2 and 3, the top half shows images from the discovered cluster and their visual explanations for the classification decision using GradCAM[Selvaraju et al.(2017)Selvaraju, Cogswell, Das, Vedantam, Parikh, and Batra]. The bottom half presents the nearest neighbor cluster with high accuracy and their corresponding visual explanations.
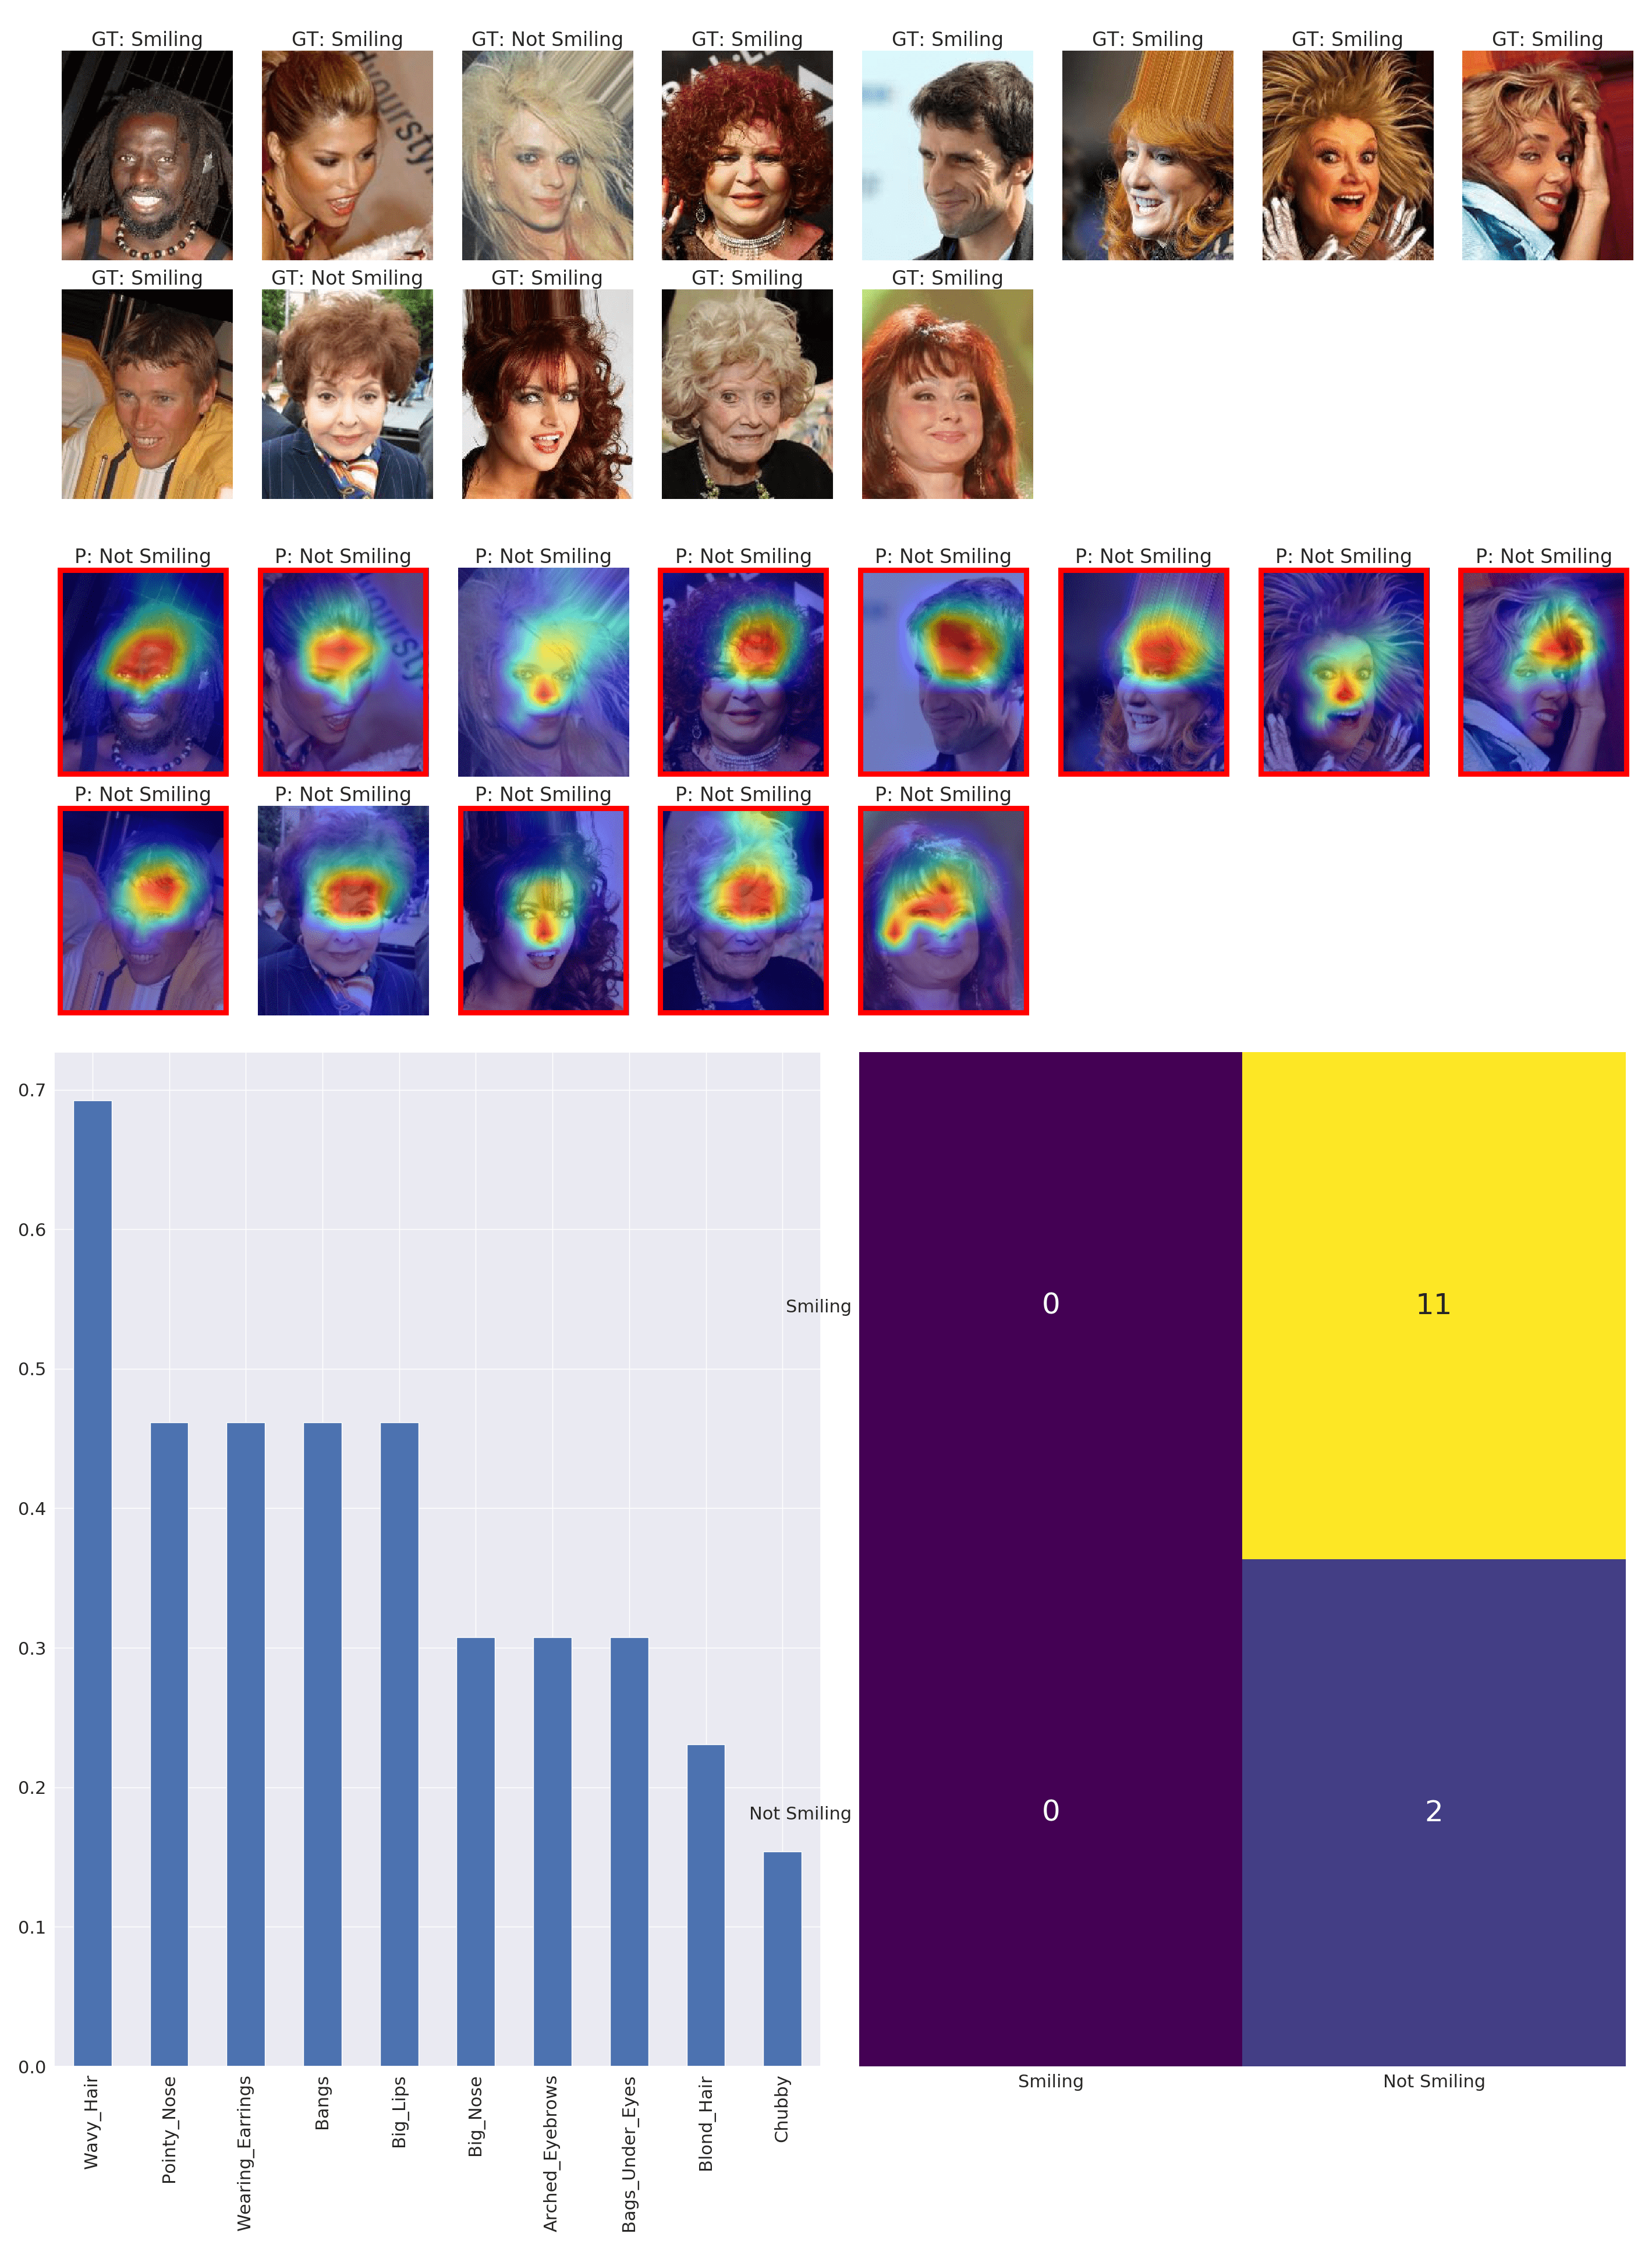
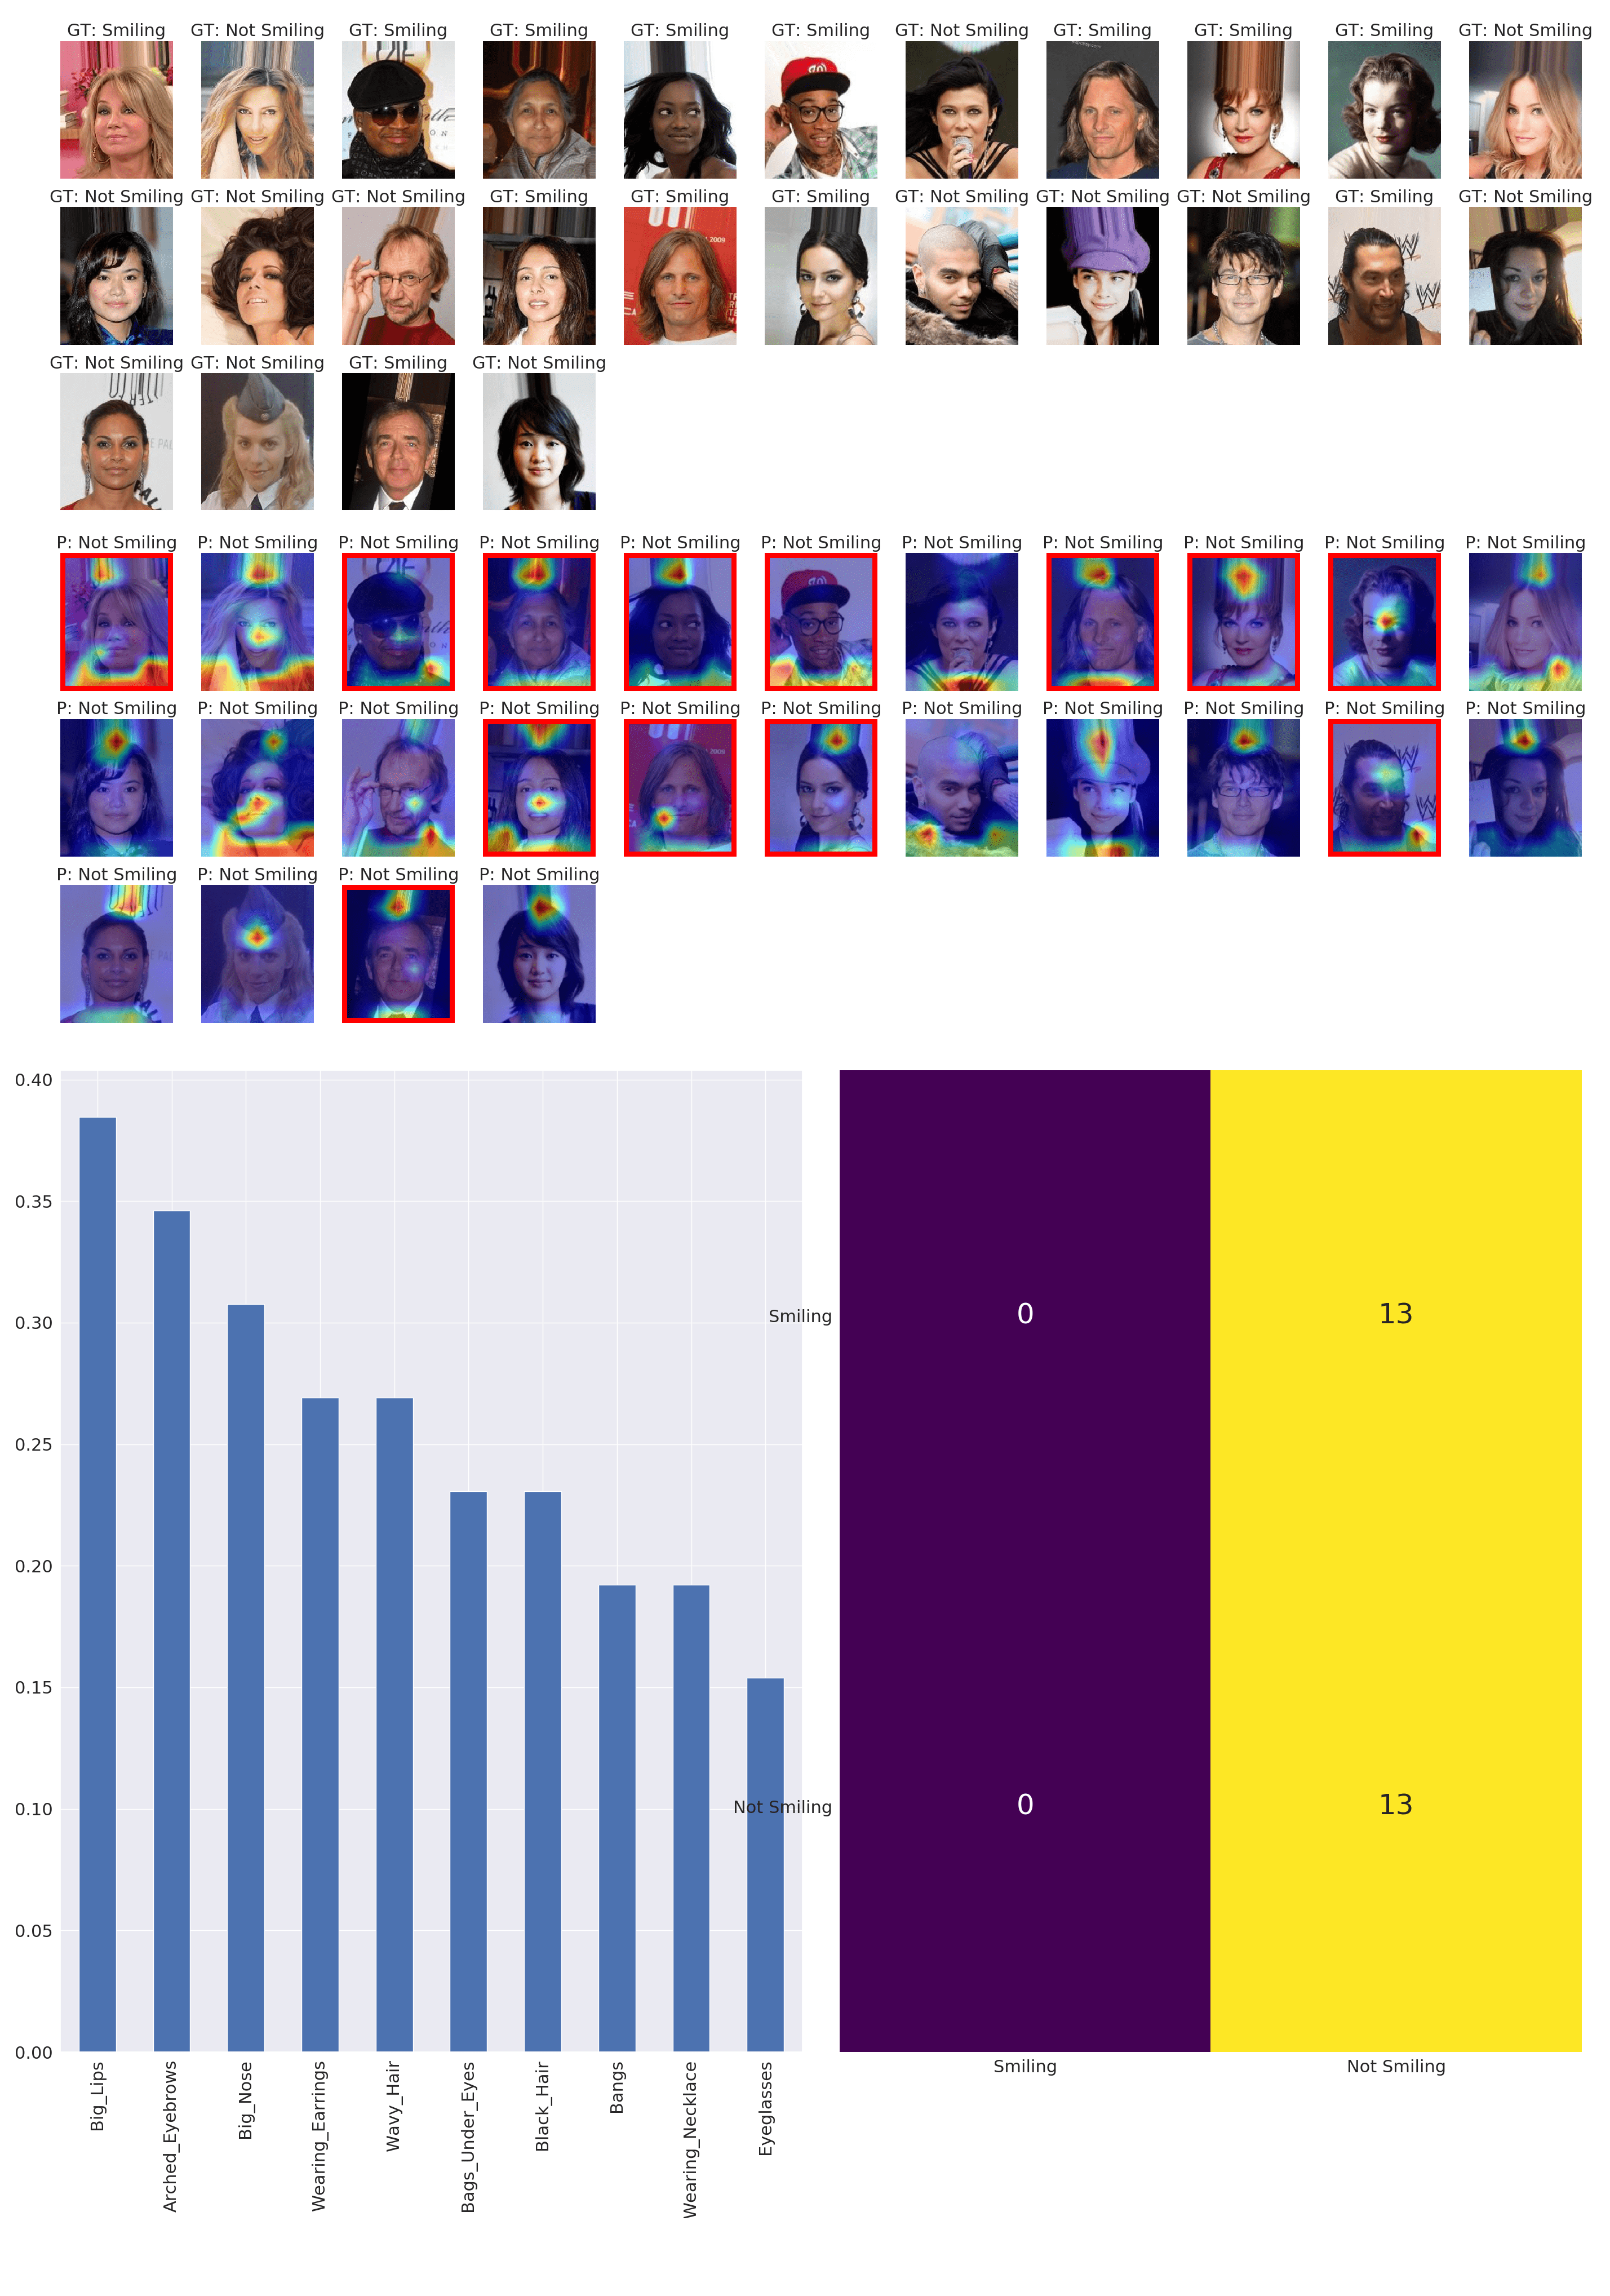
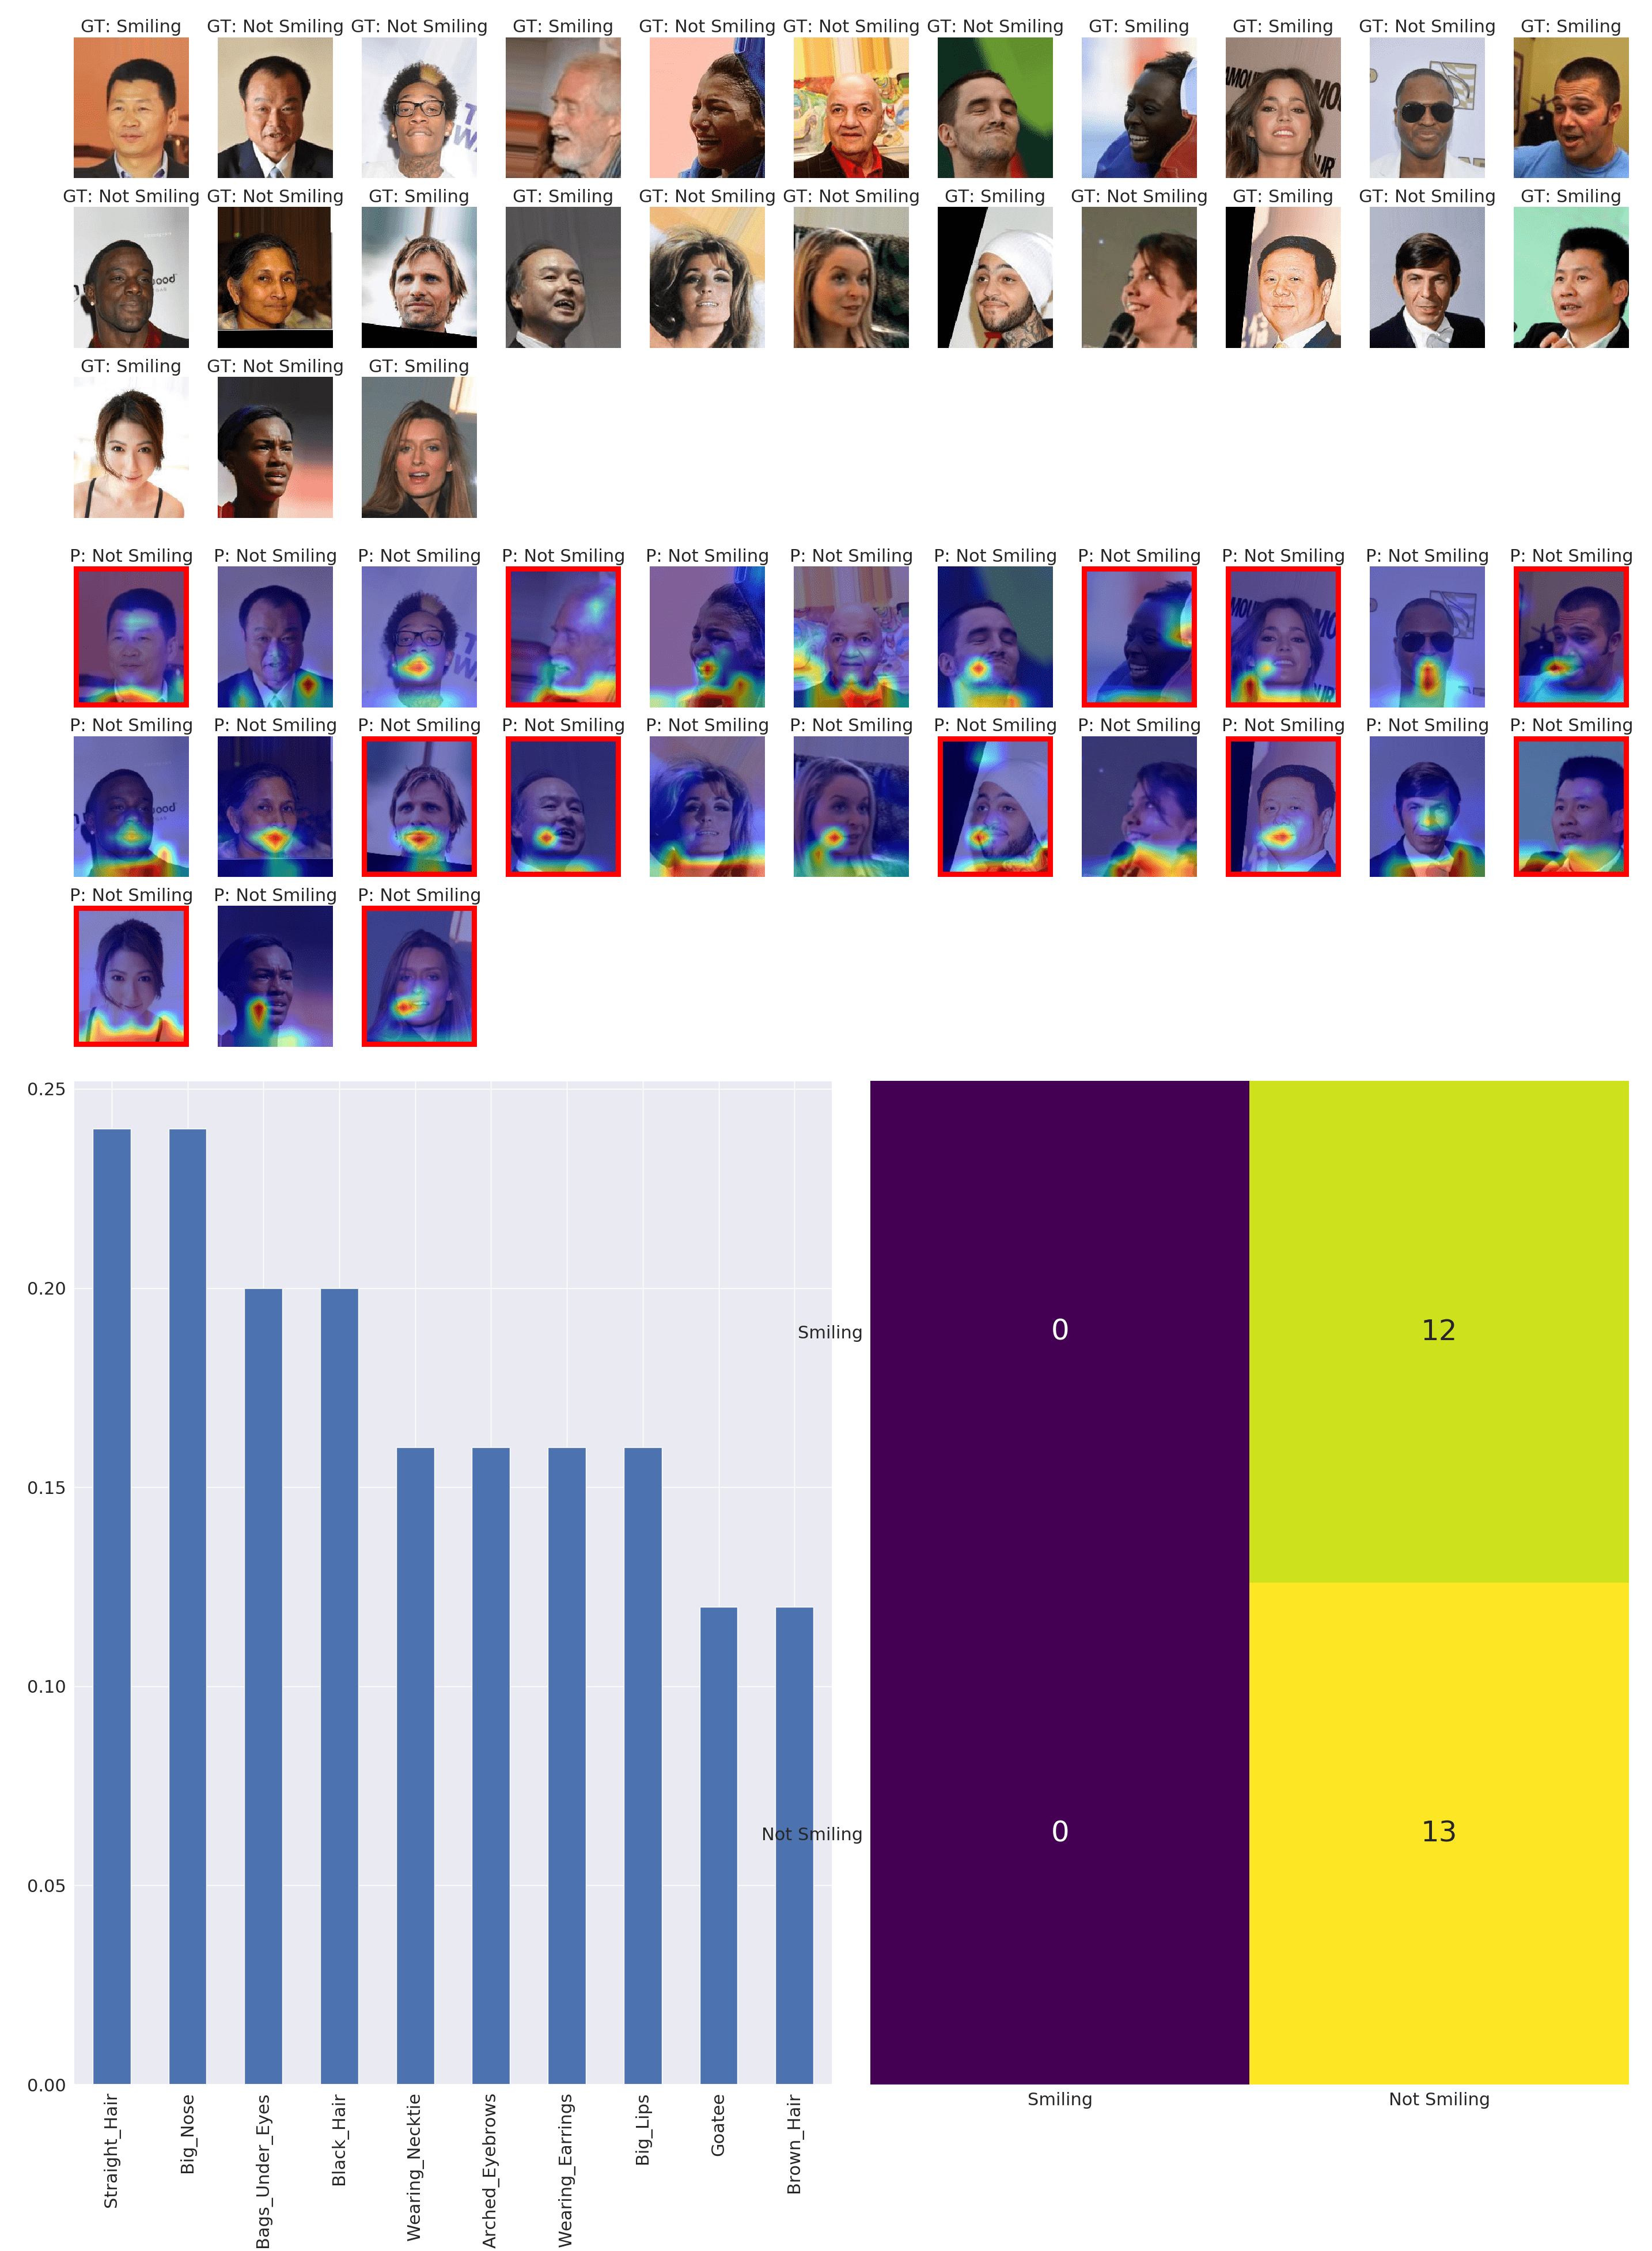
Smiling prediction on CelebA. In Figure 2, we present the discovered clusters using the model trained on the original CelebA dataset. We notice from the top half of Figure 2(a) that the model is basing its decision for predicting if the person in the image is Smiling, on the artifact above the persons head (the complete cluster containing these images is included in the supplement). Clearly, the unsupervised nature of our method allows for the discovery of spurious correlations or artifacts in the image that may not correspond to an human-identifiable visual attribute (see Figure 2(a)).
This pattern is observed in a considerable number of images, and is frequently responsible for incorrect classifications. For instance, the bottom half of Figure 2(a) displays a cluster containing a similar artifact, but the model is able to focus on the right region of the image, i.e. the mouth. Domain experts may be better equipped to infer subtle differences between the images that lead to erroneous classifications. In Figure 2(b), we present sample images from another cluster where the model focuses on the region surrounding the collarbone to make its classification decision. Neither of these regions are relevant to the task of smiling prediction itself, and thus can be considered to be indicative of model bias.
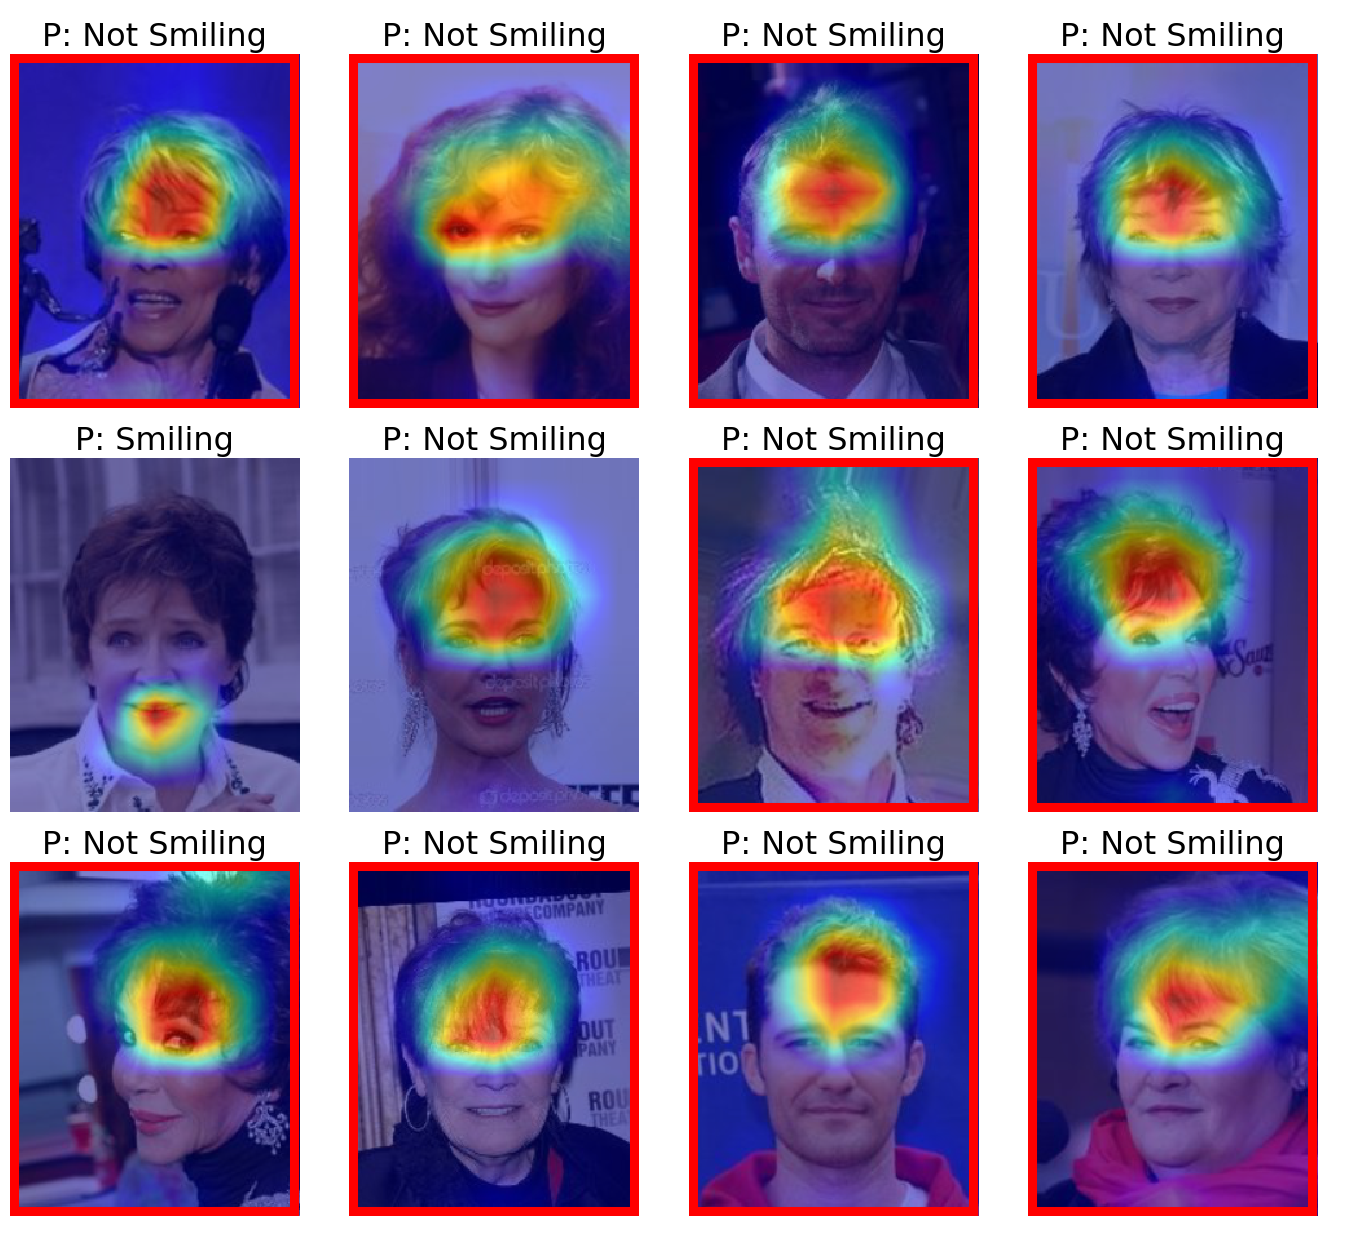
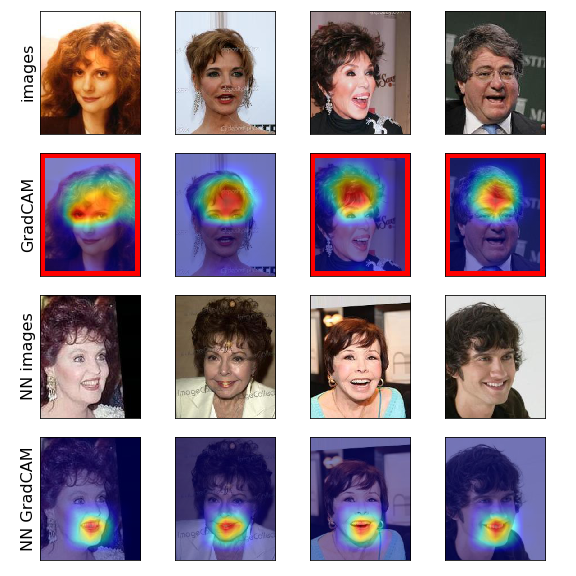
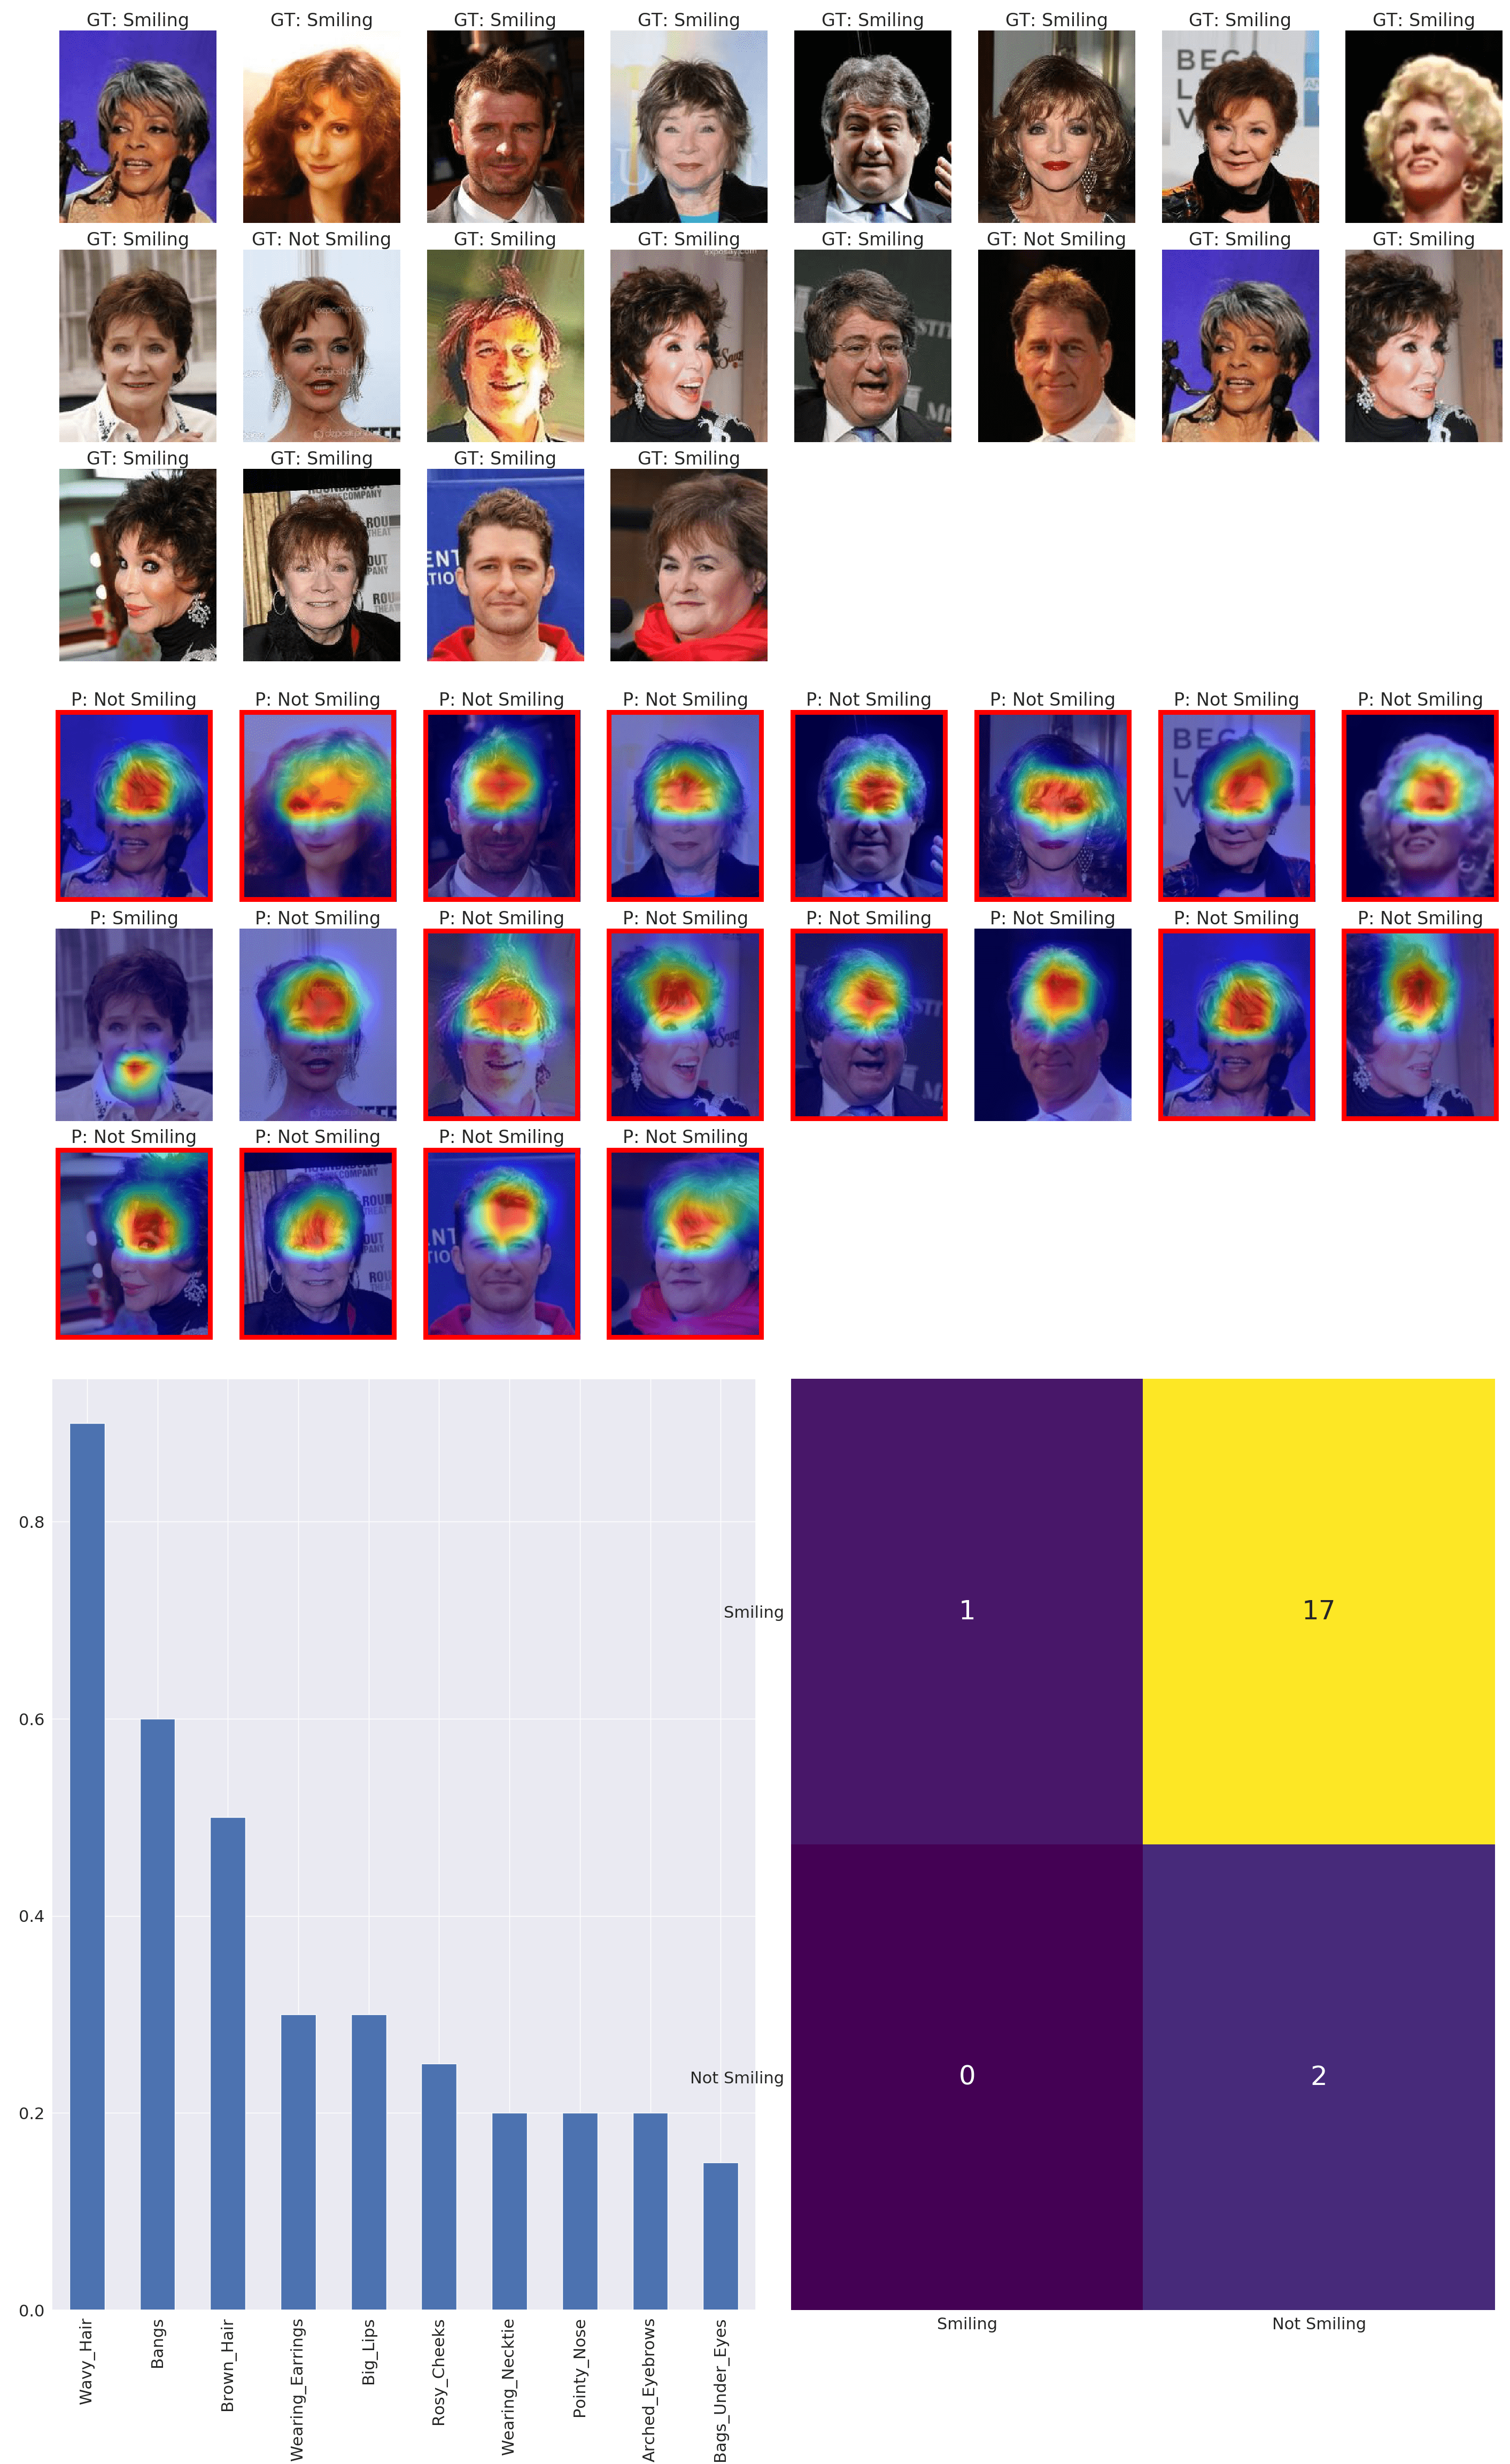
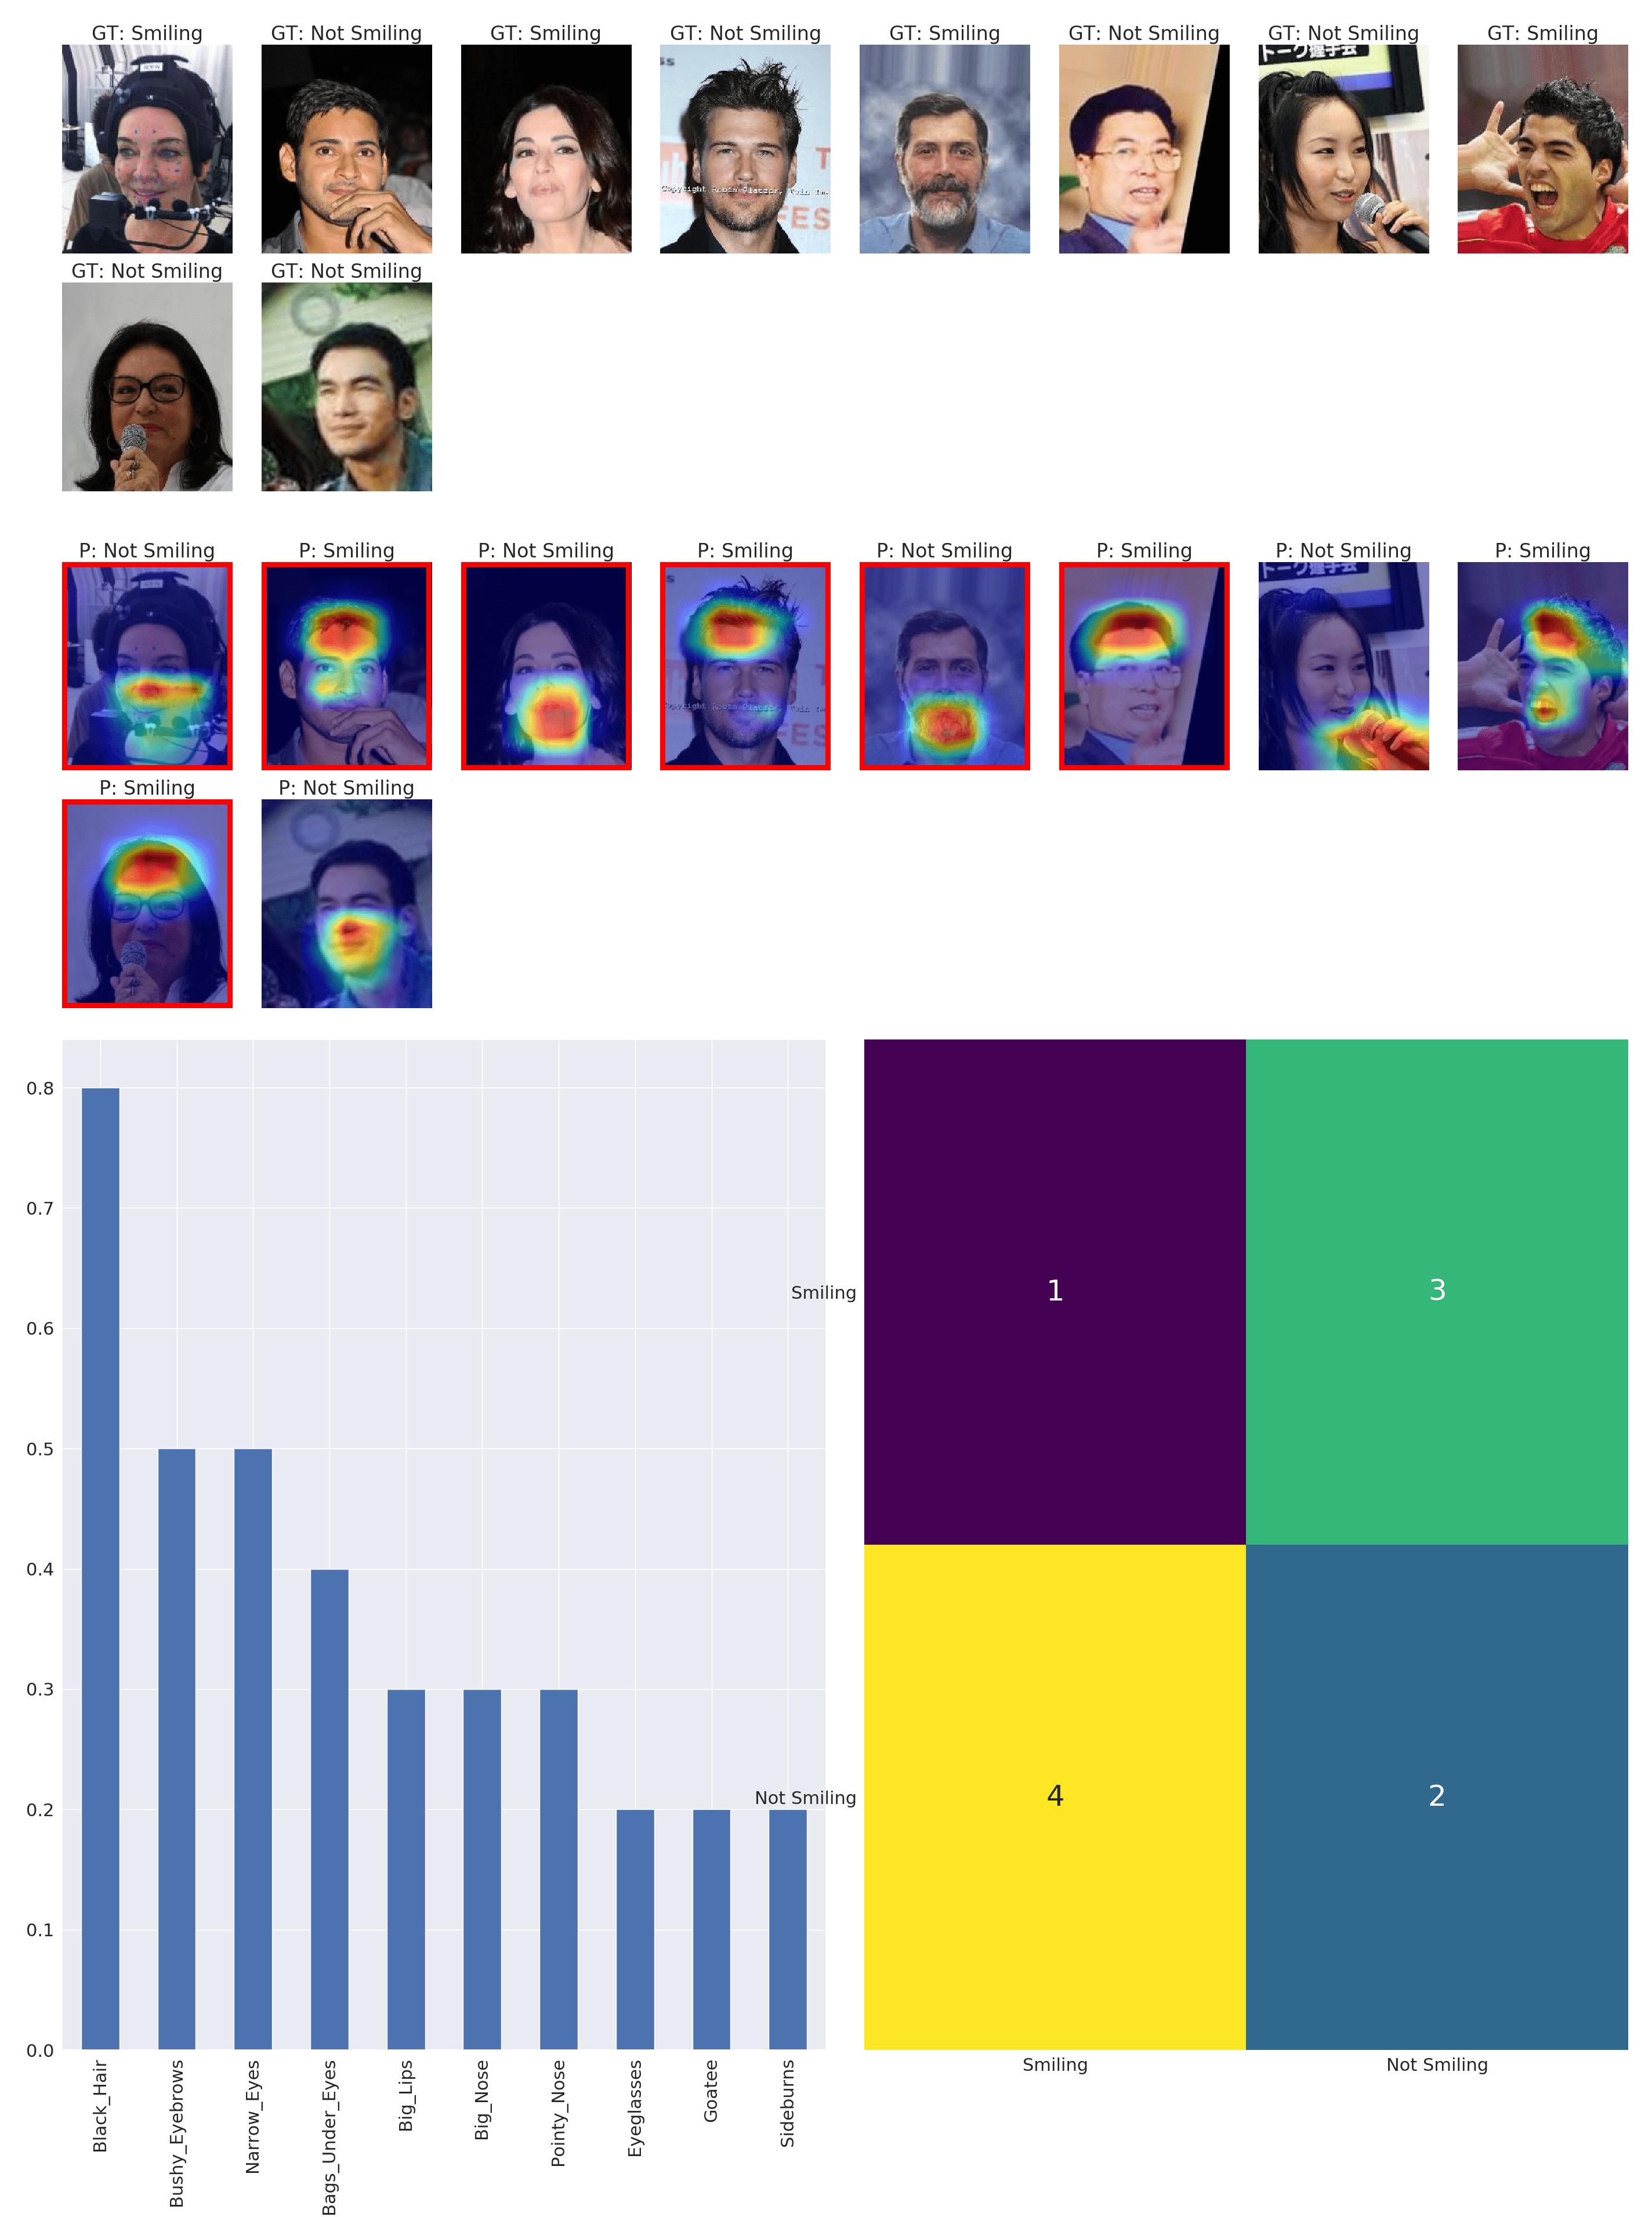
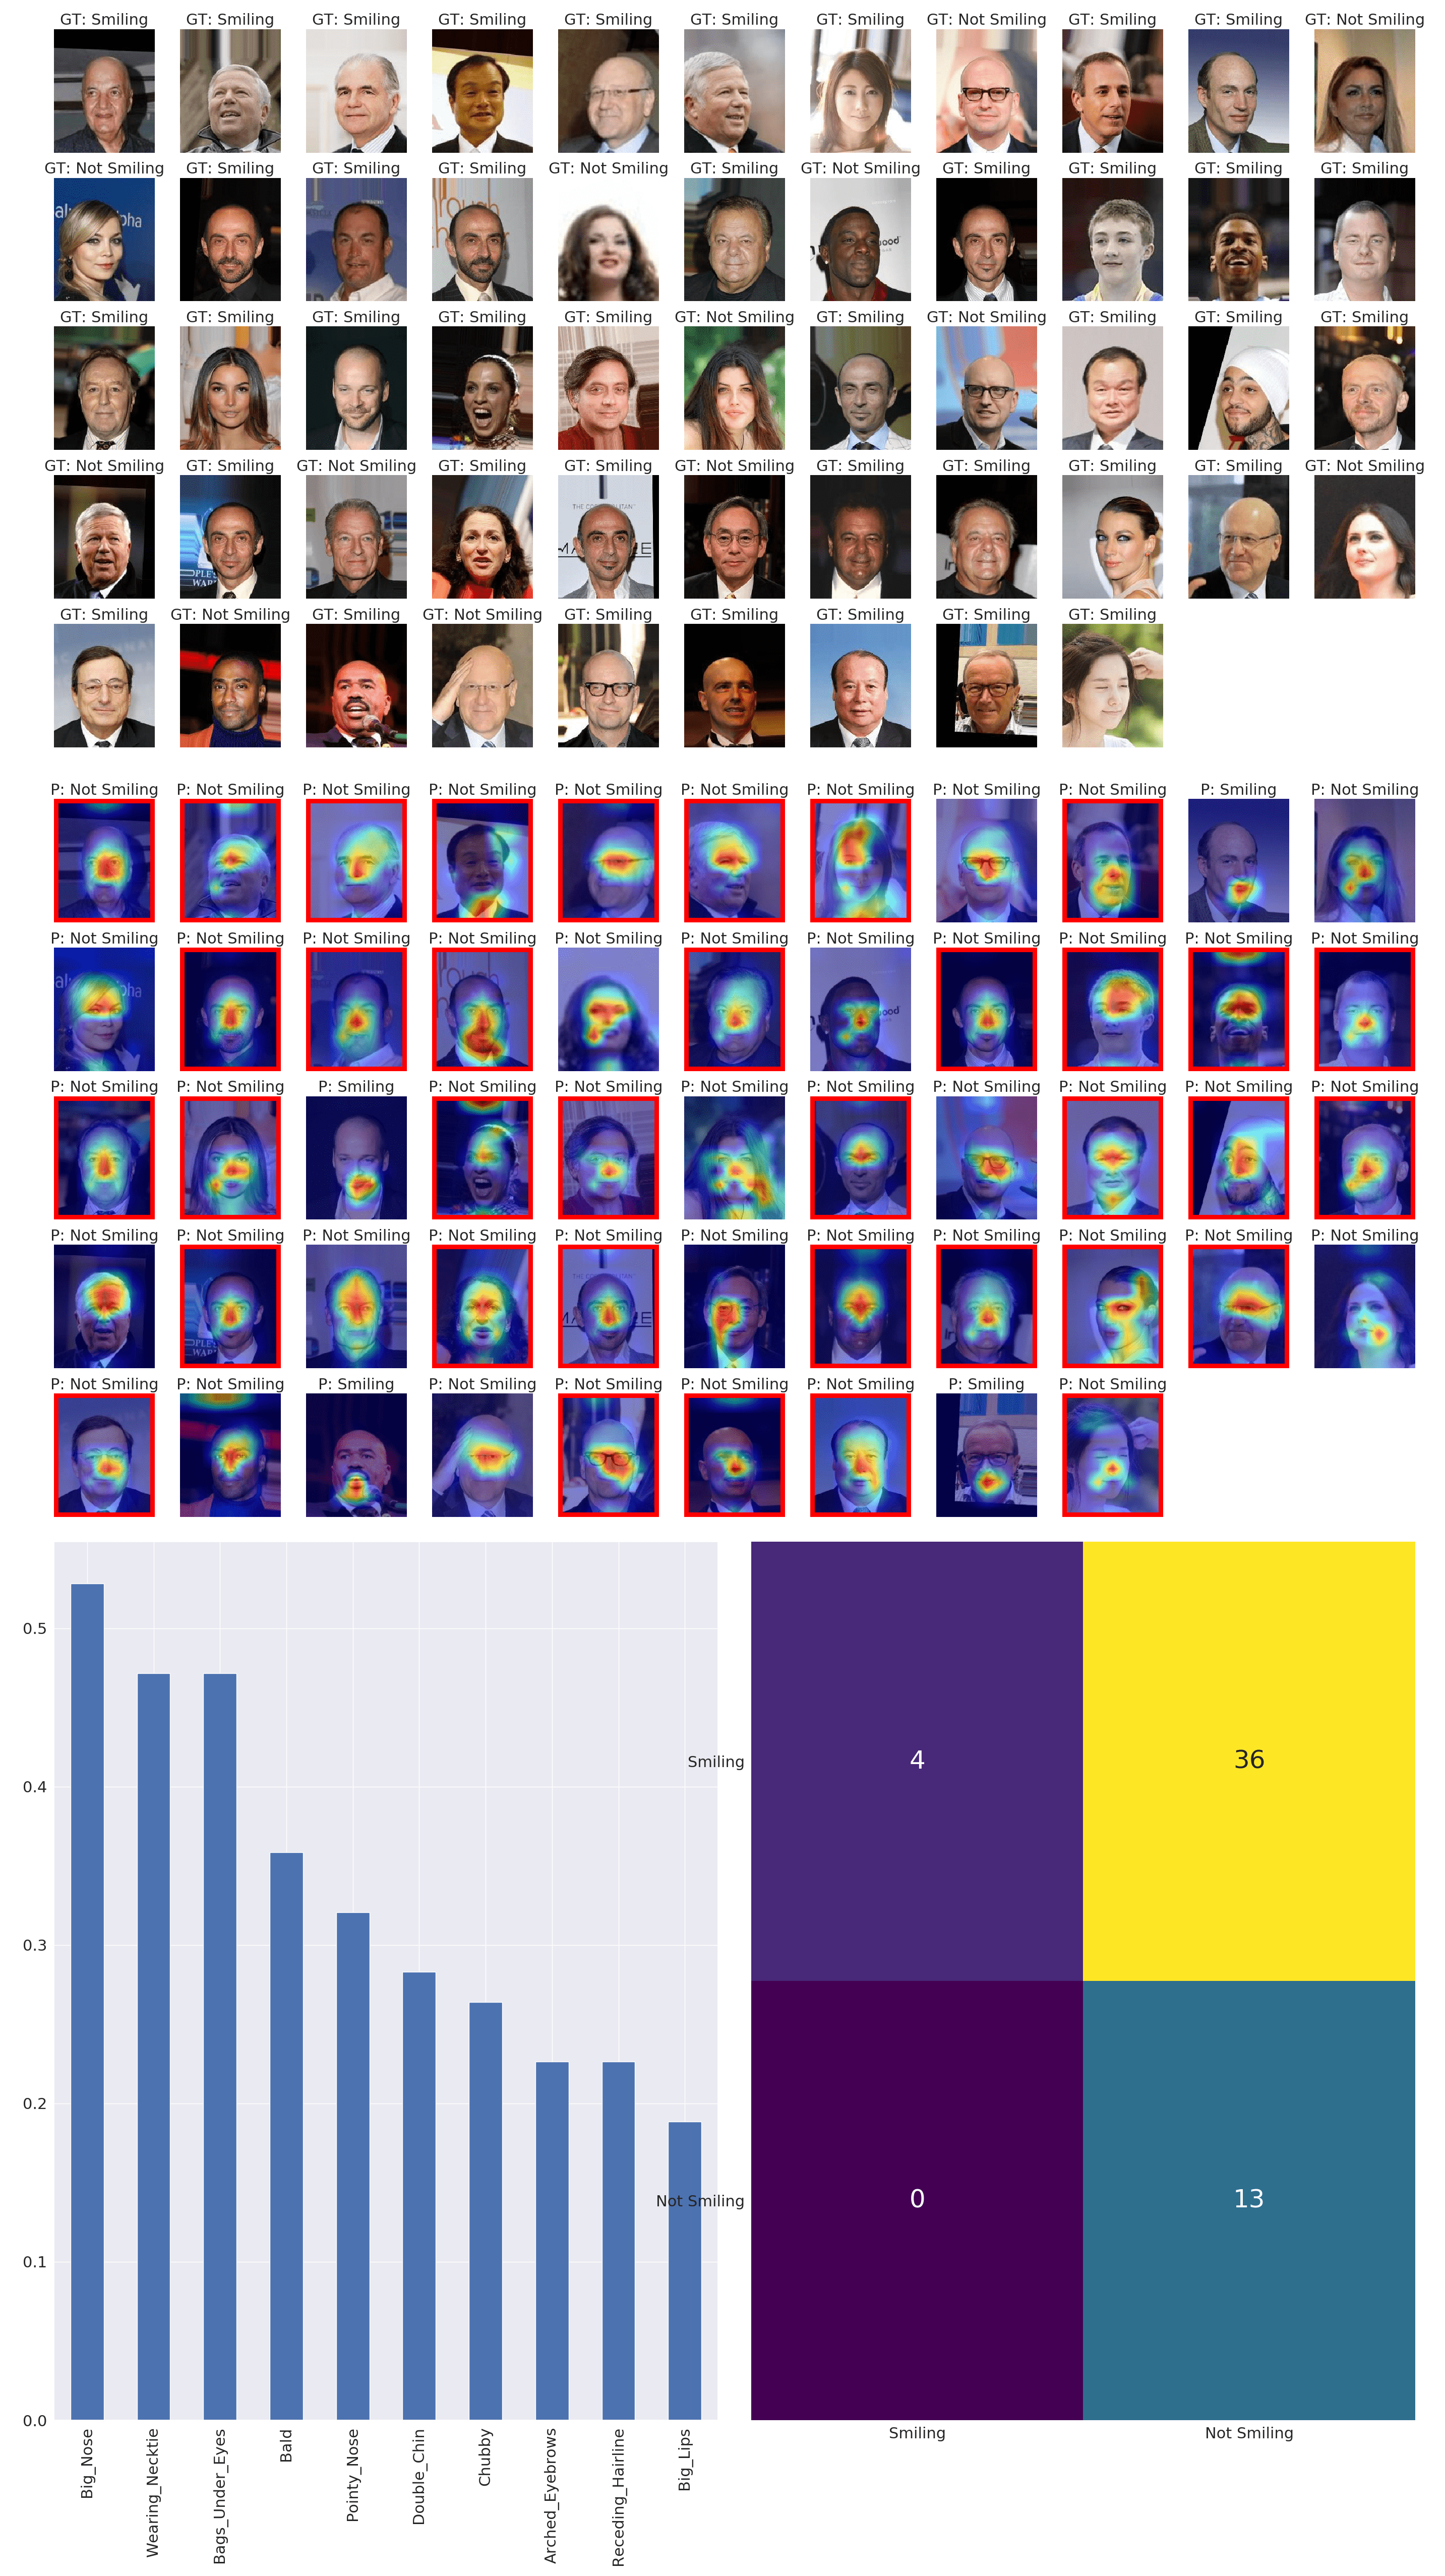
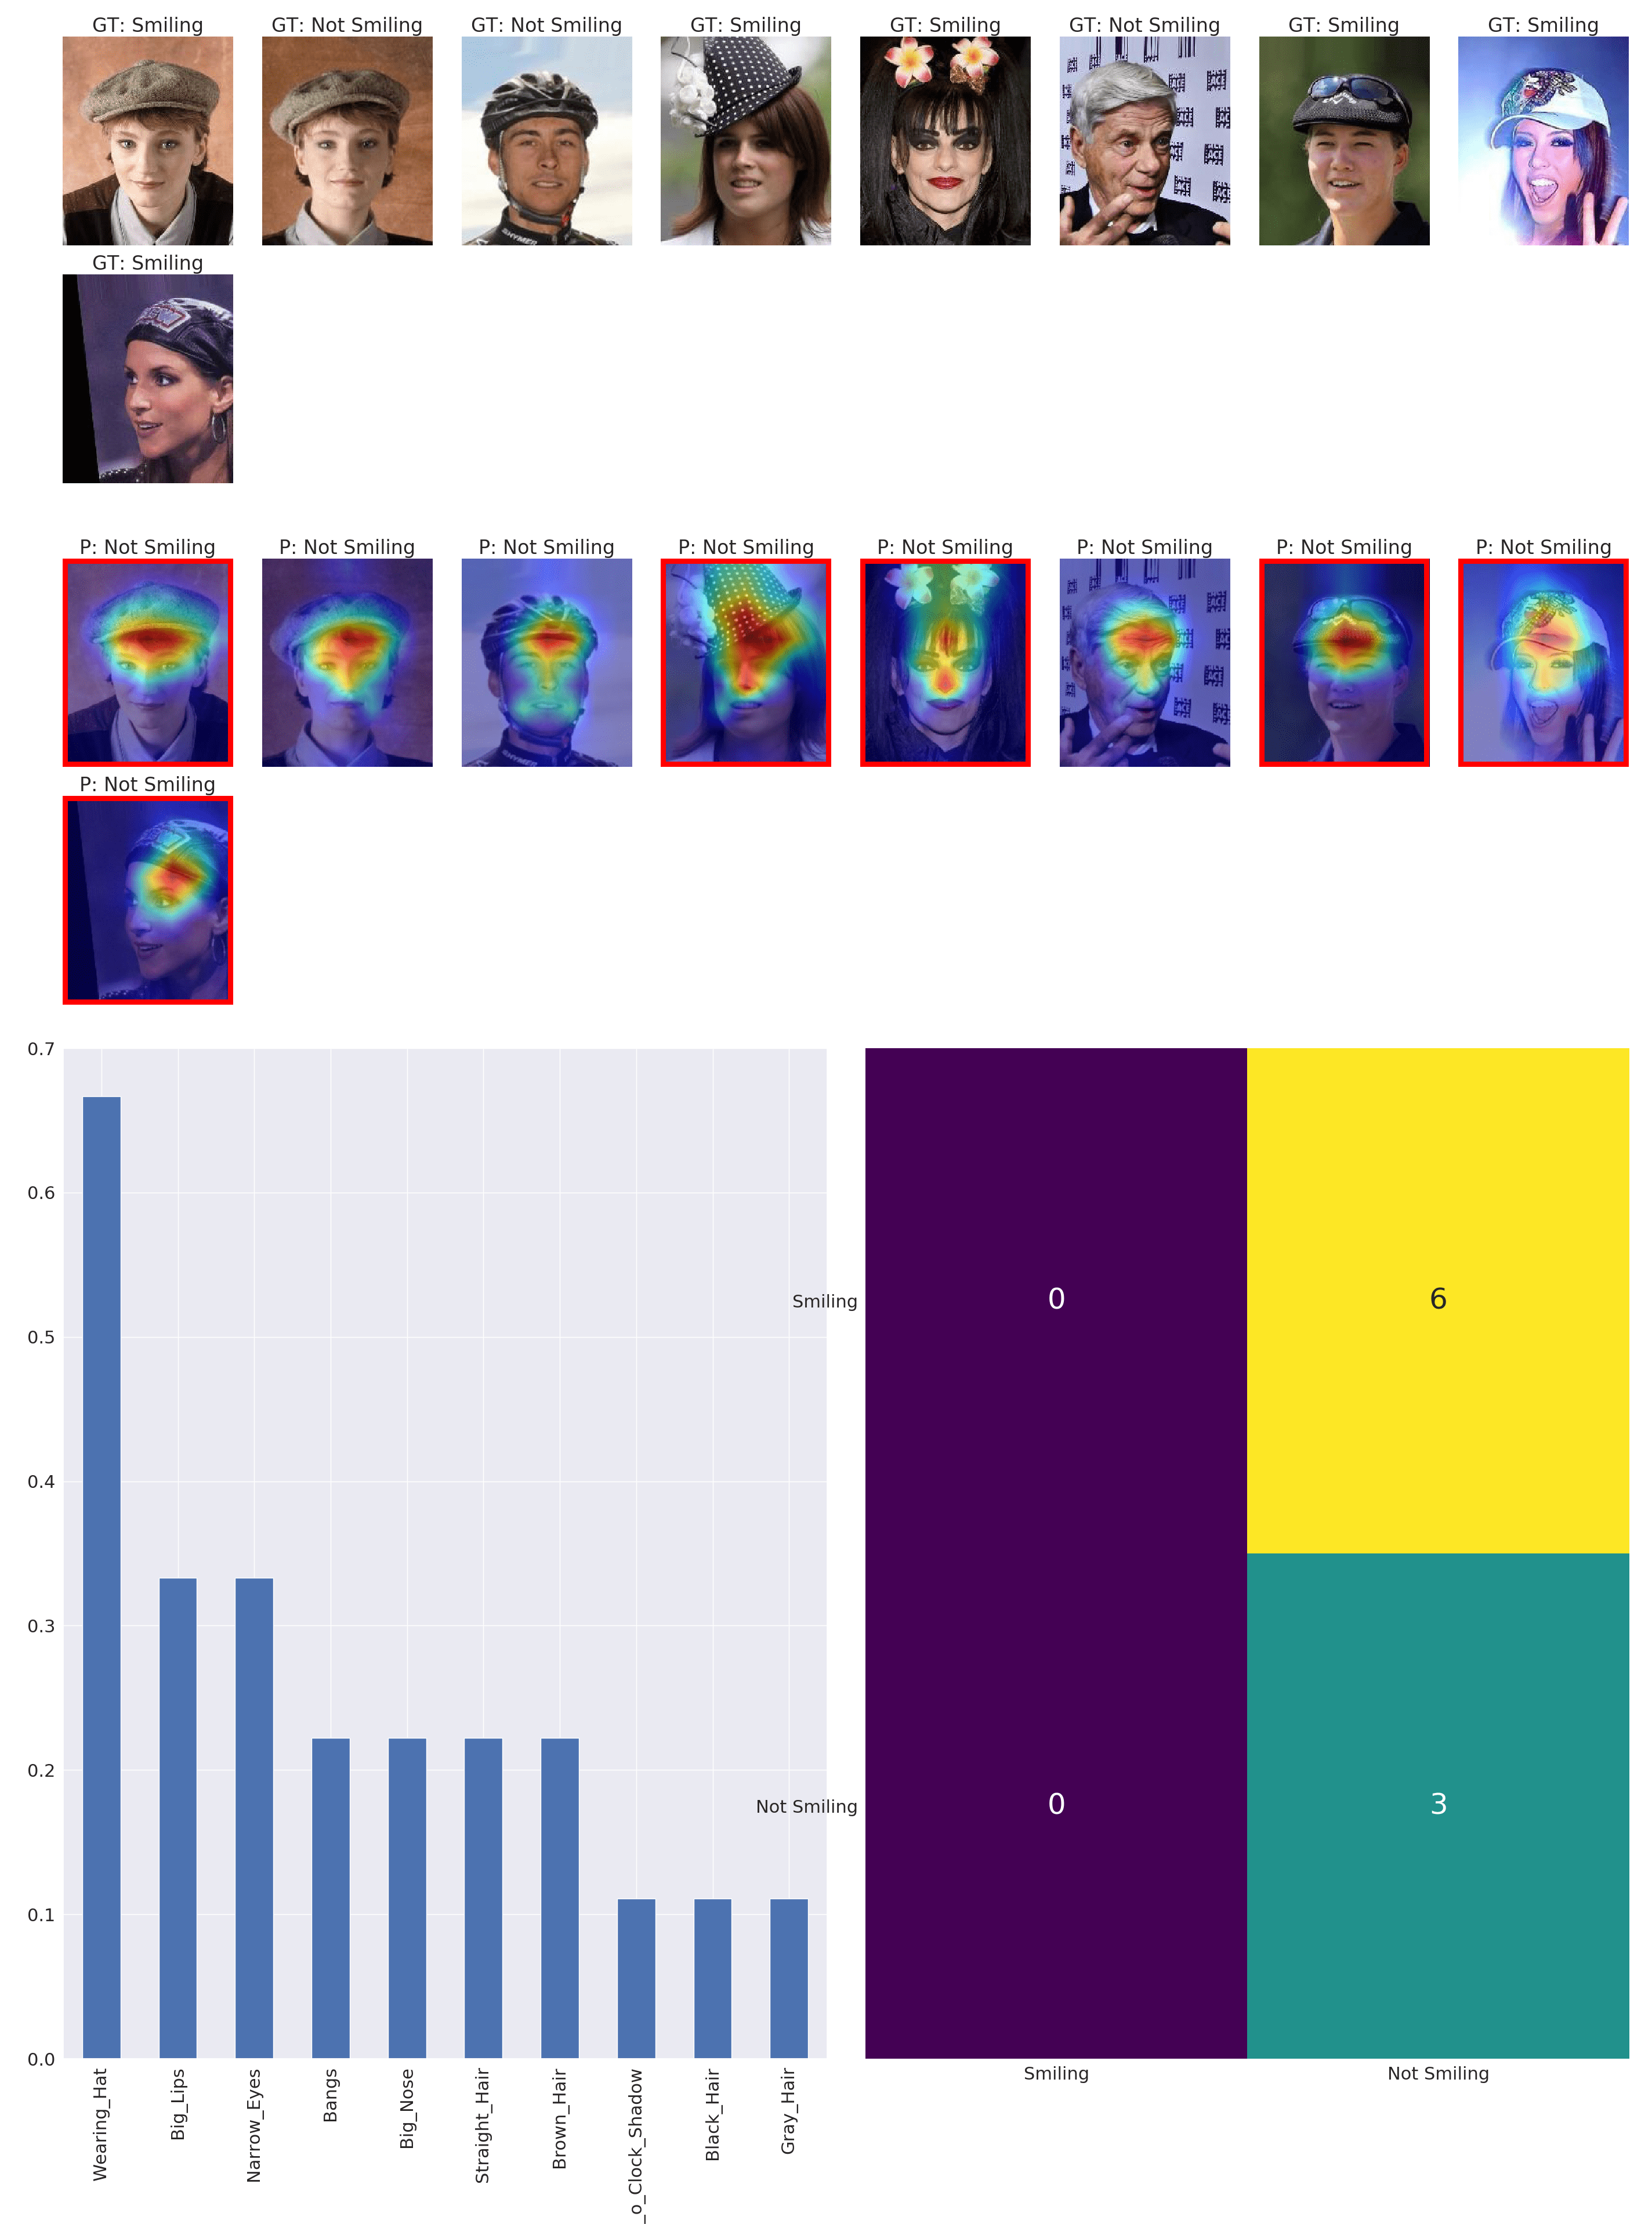
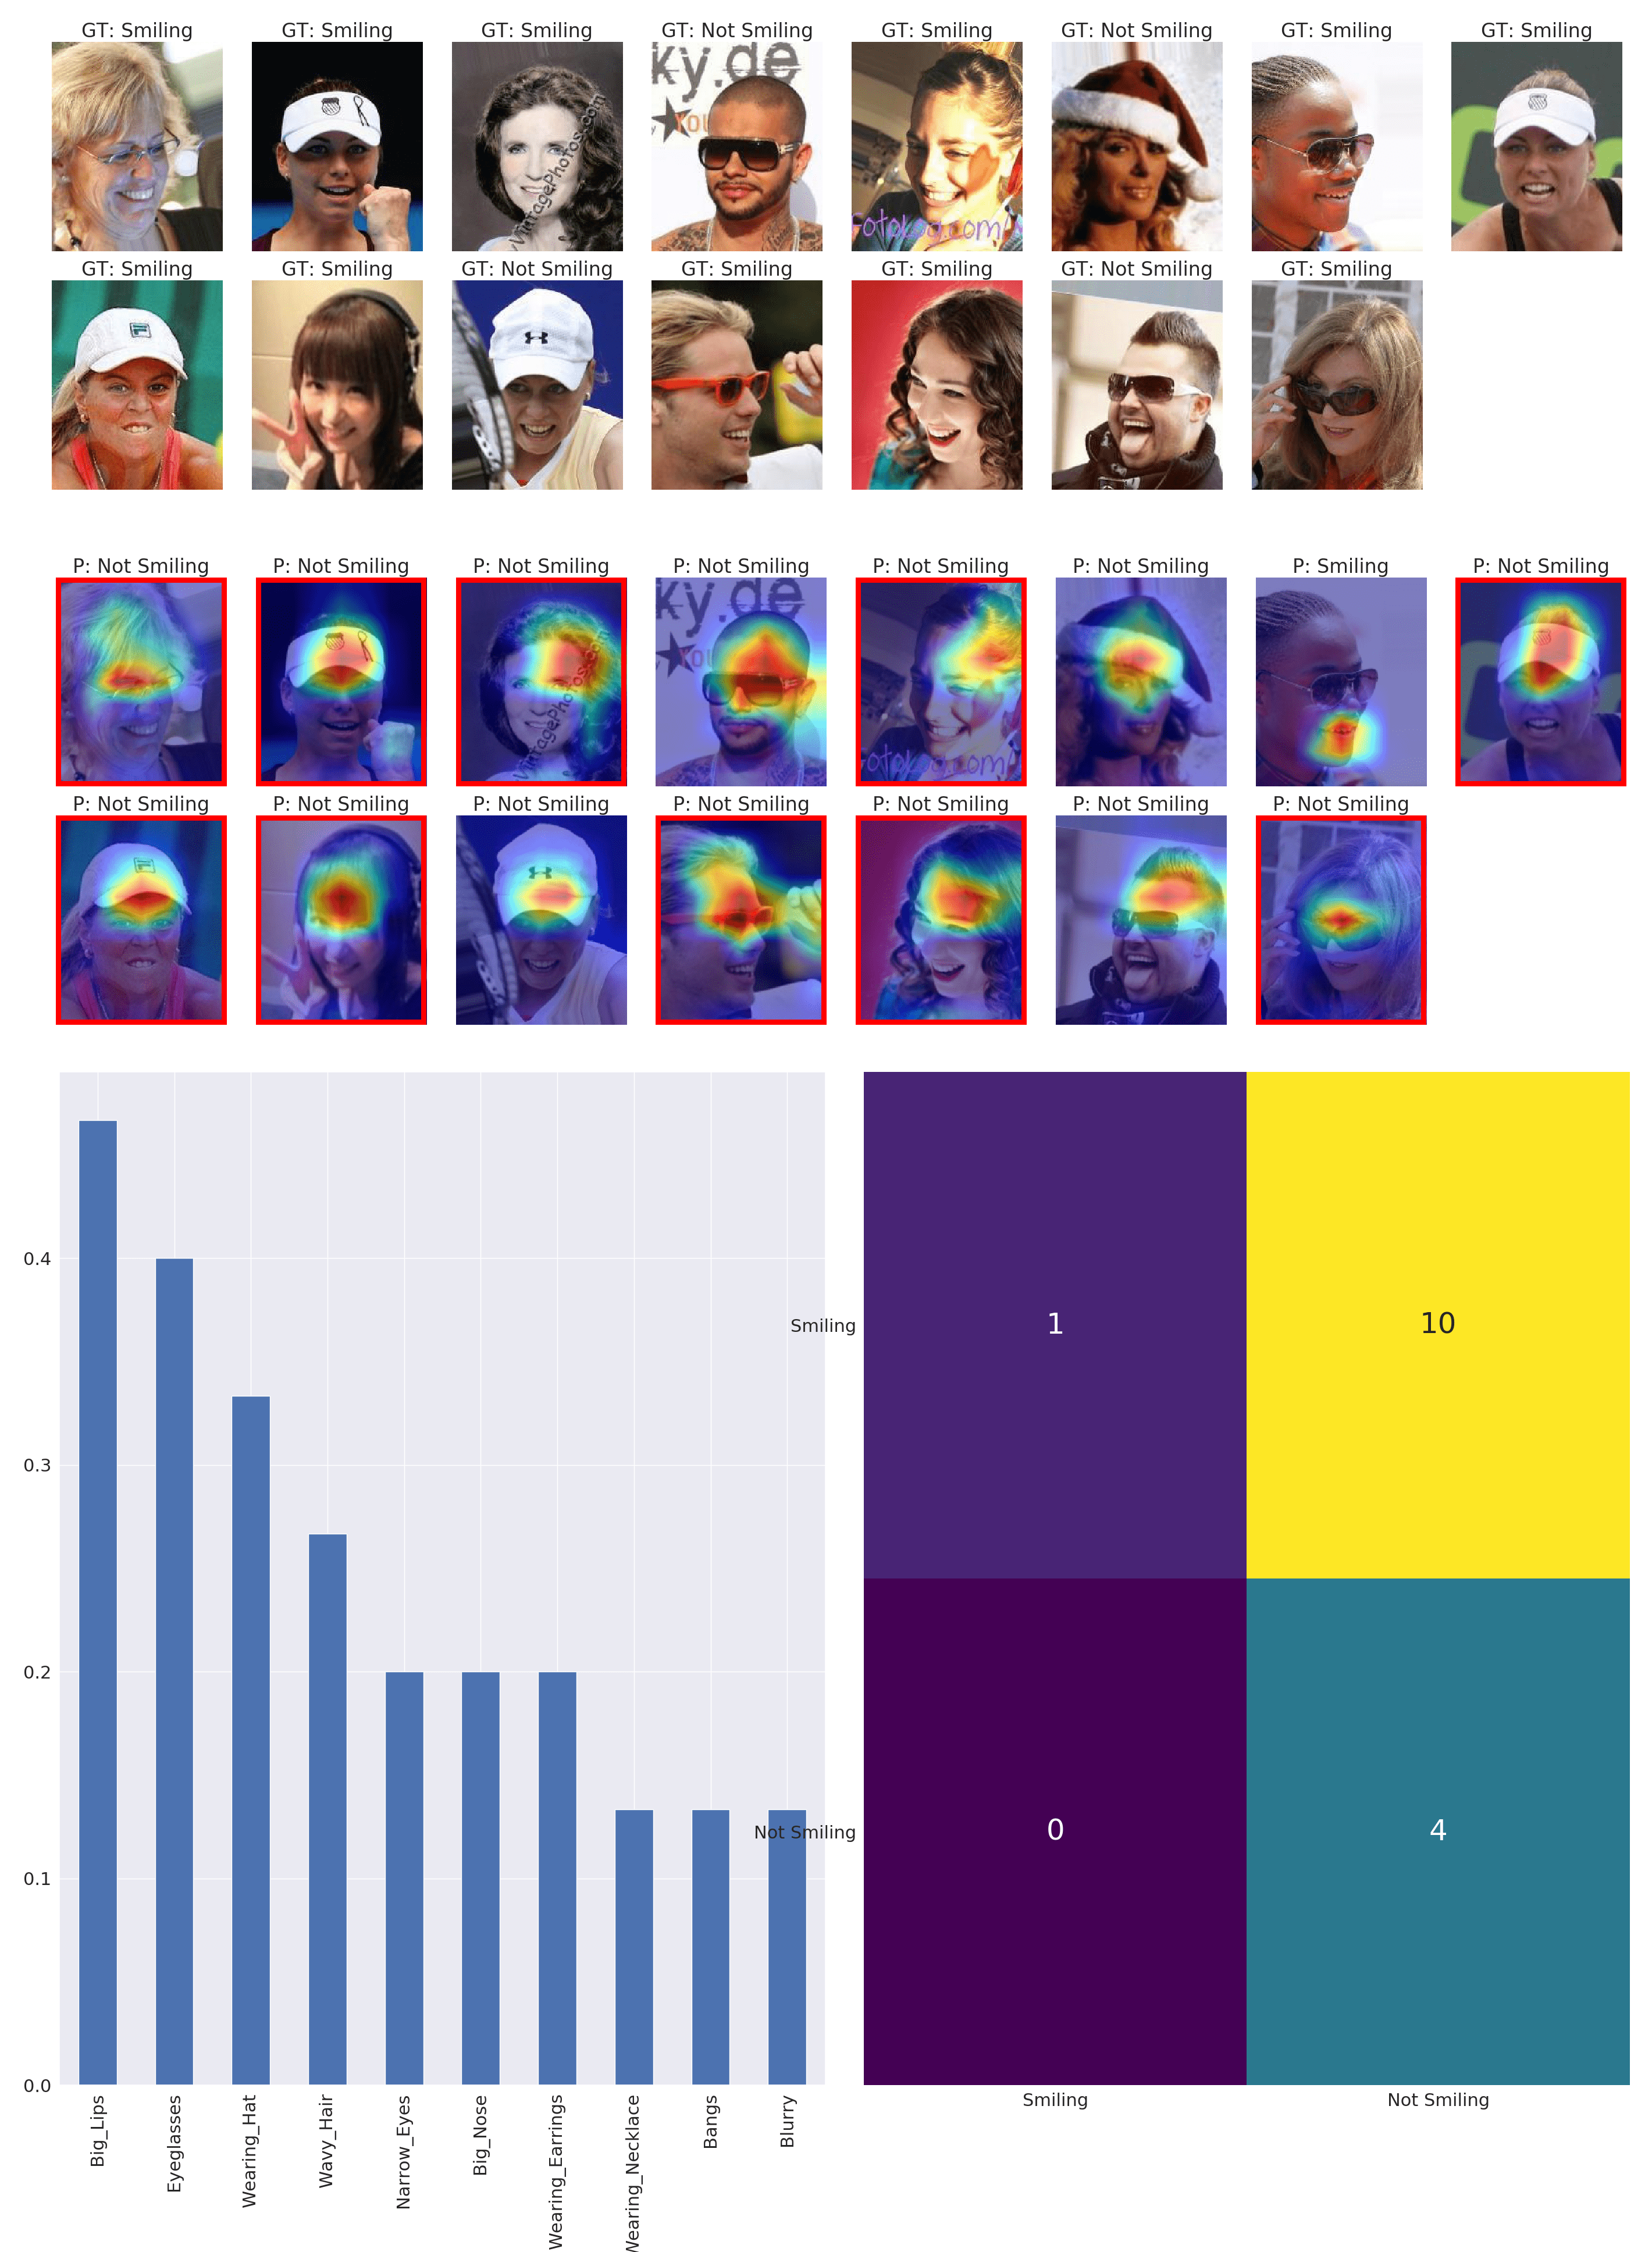
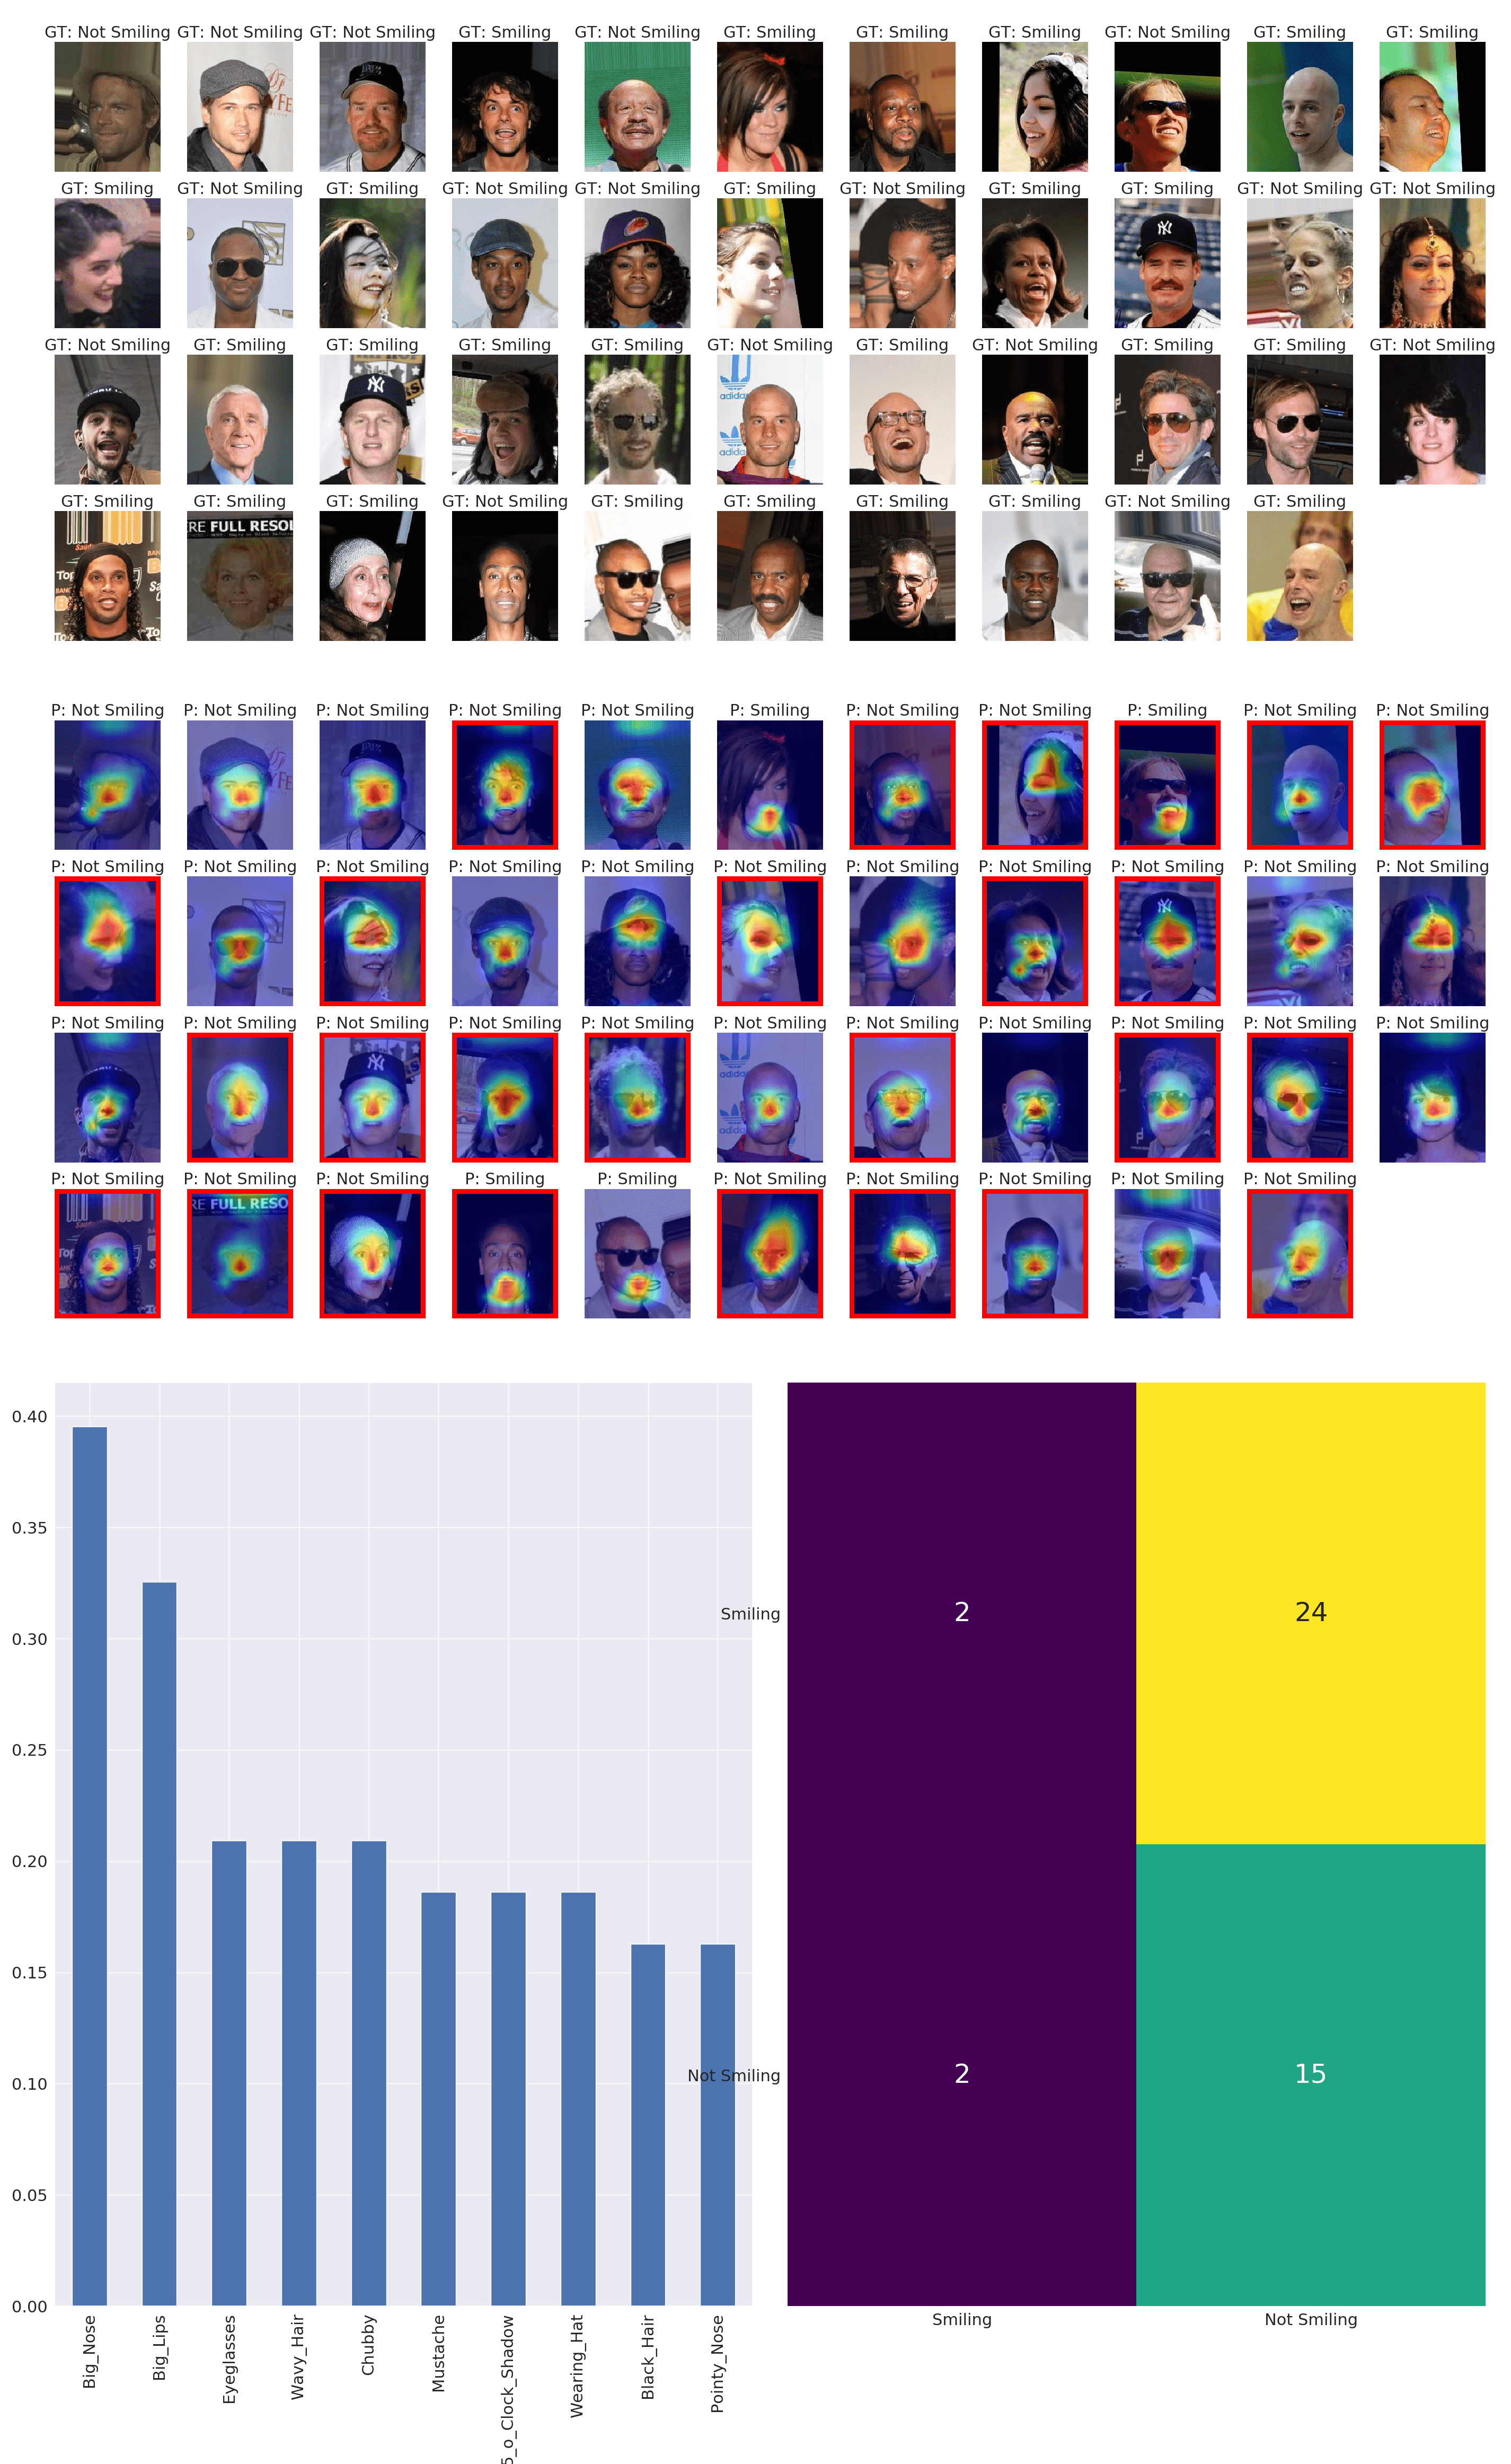
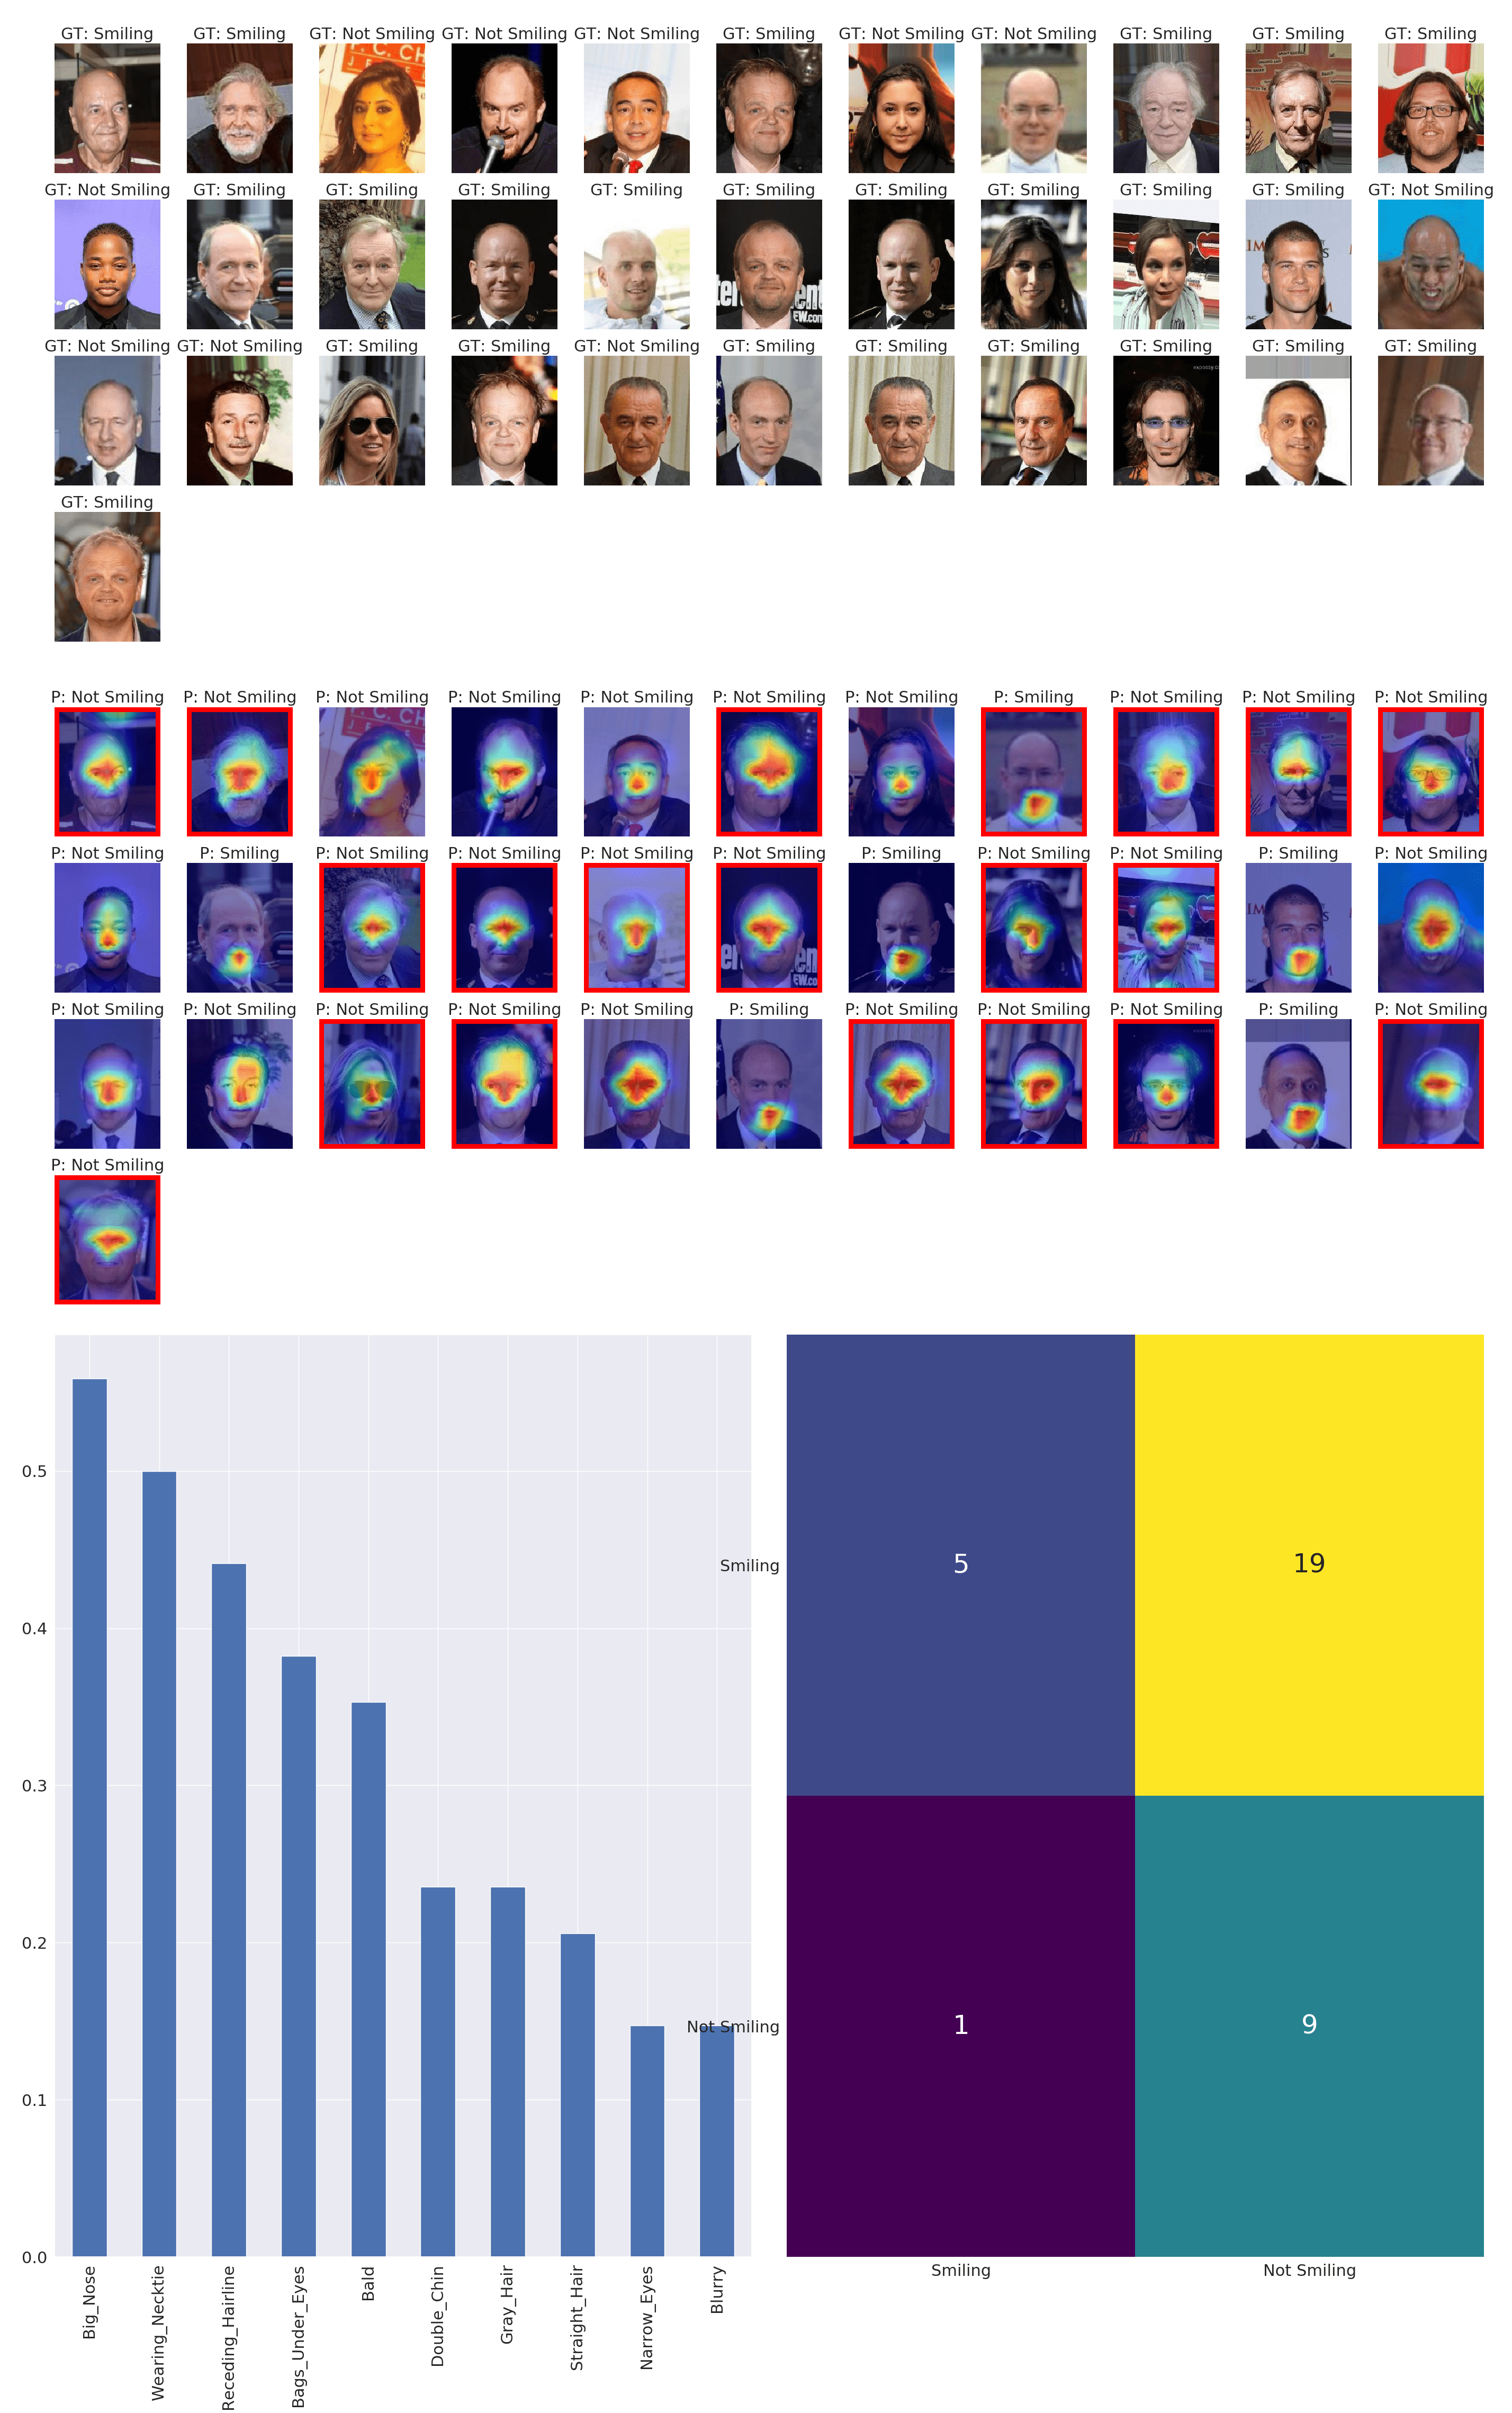
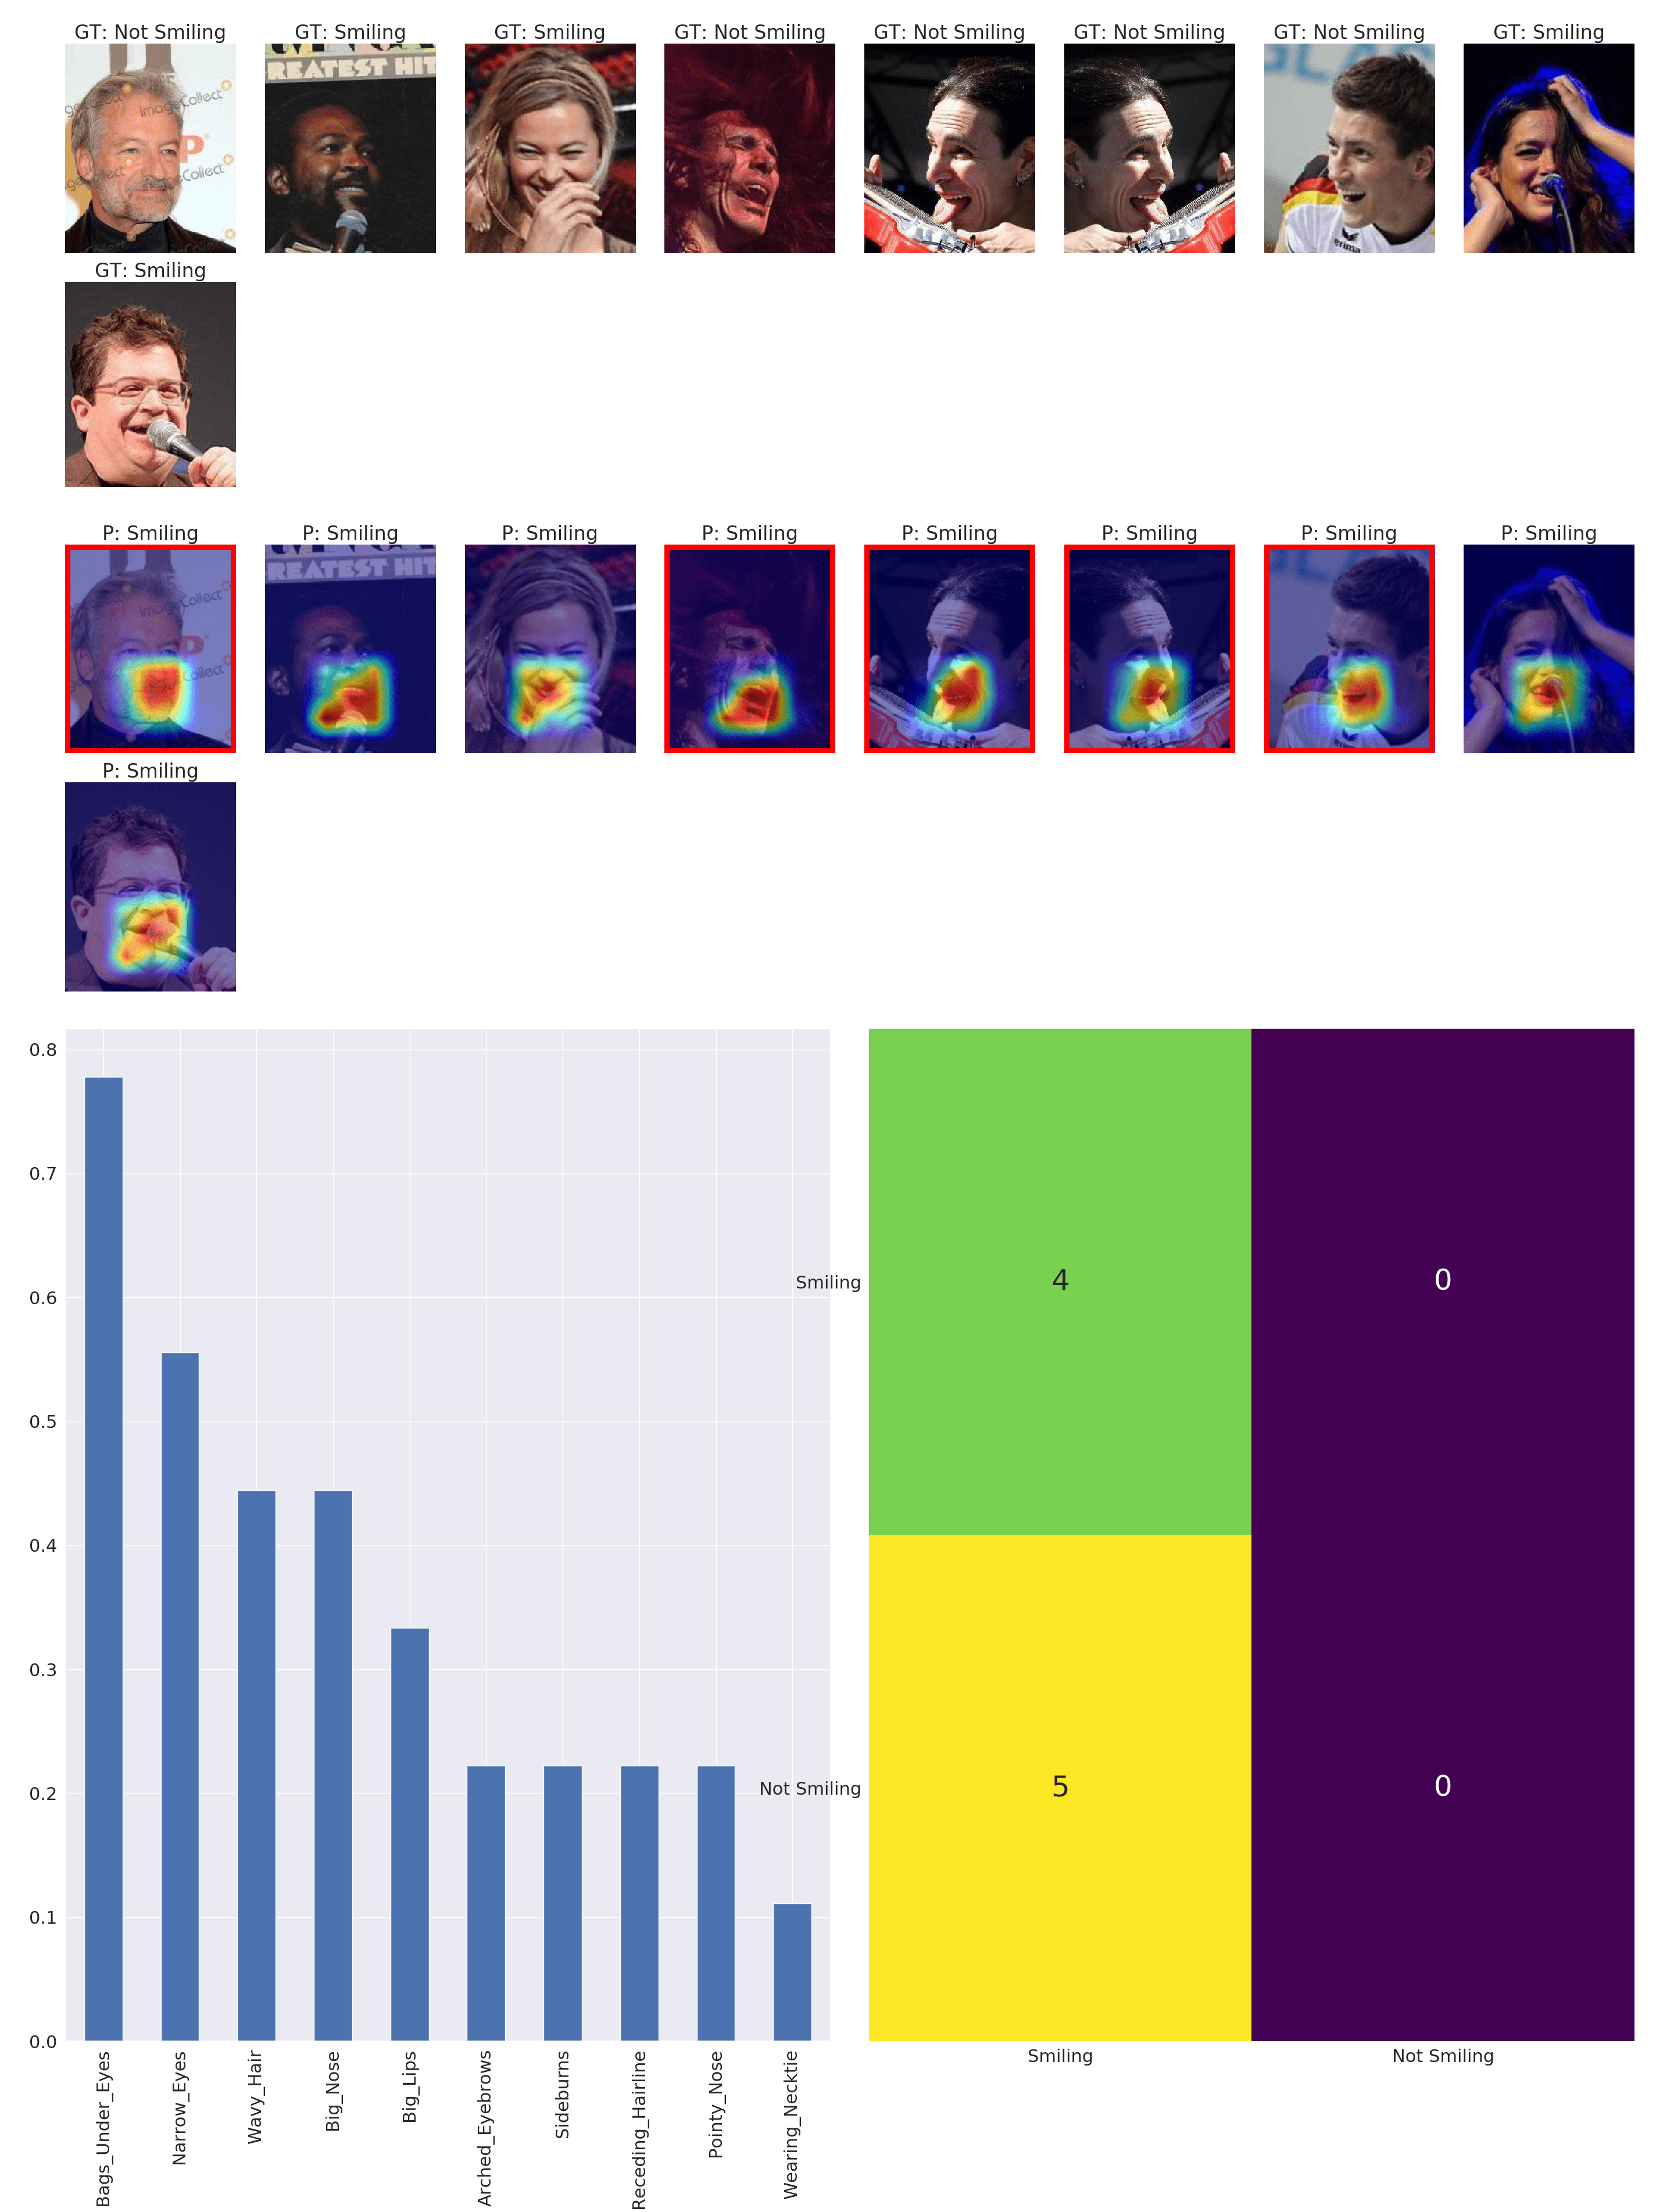
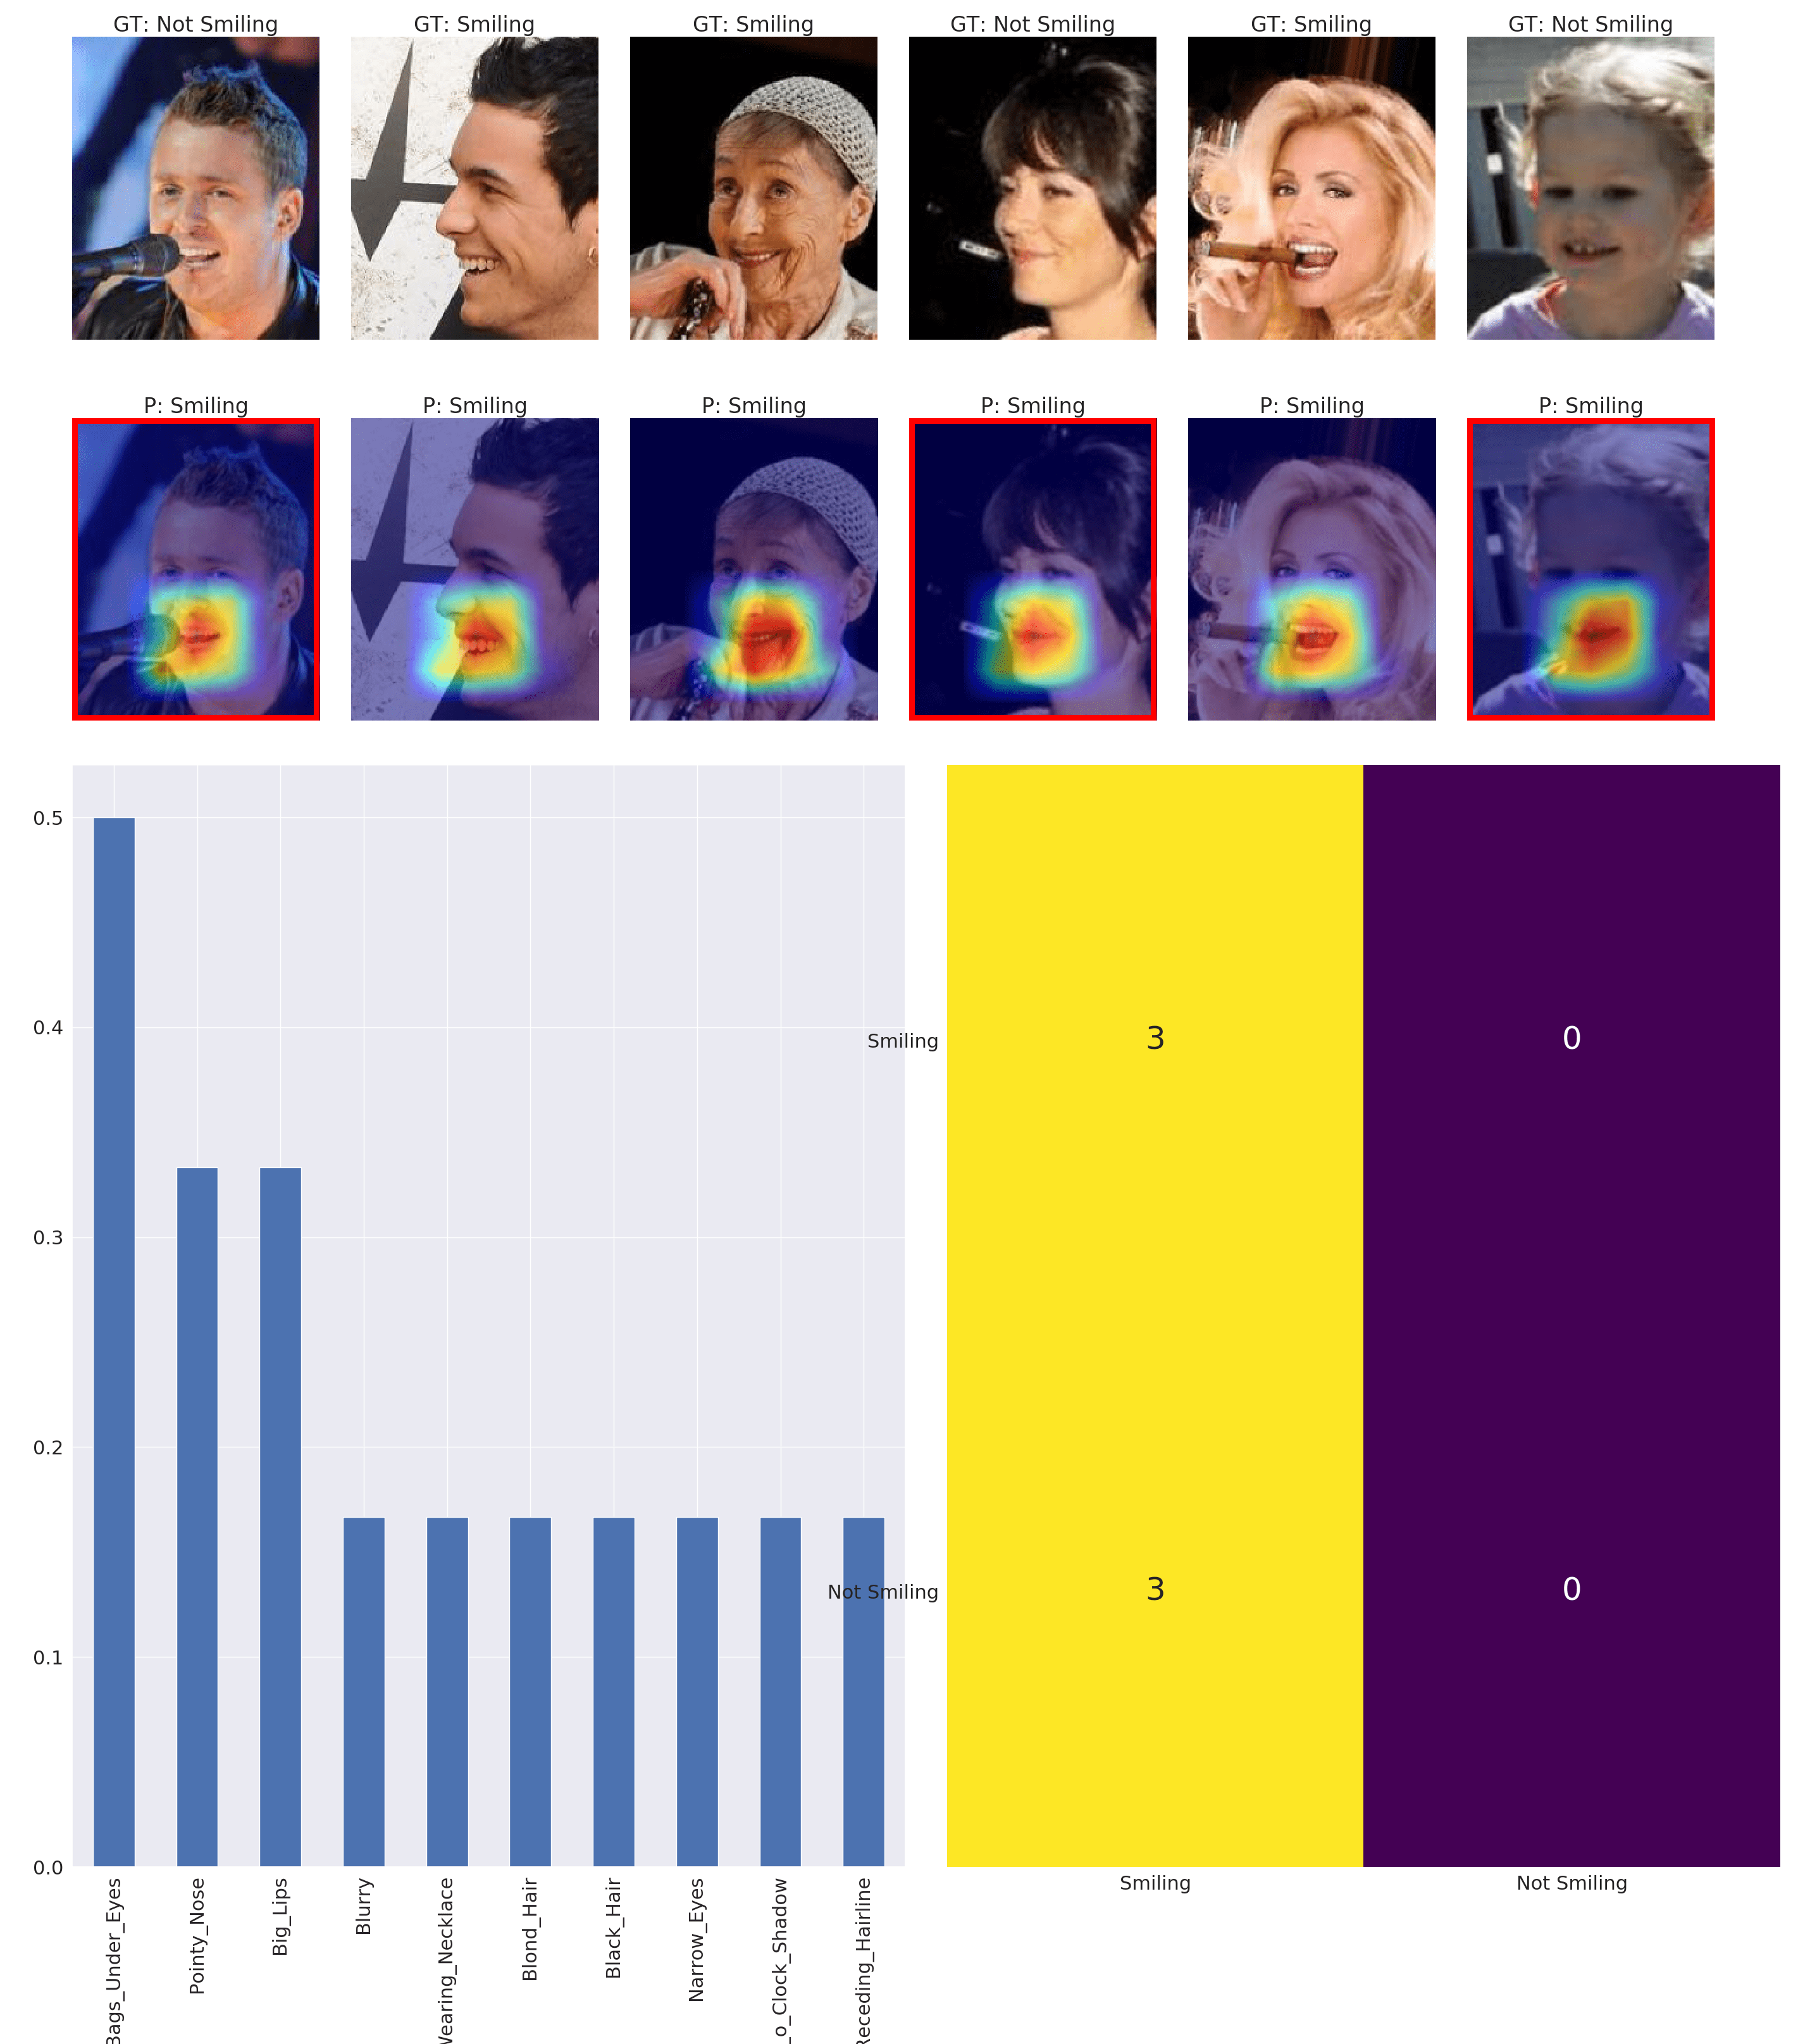
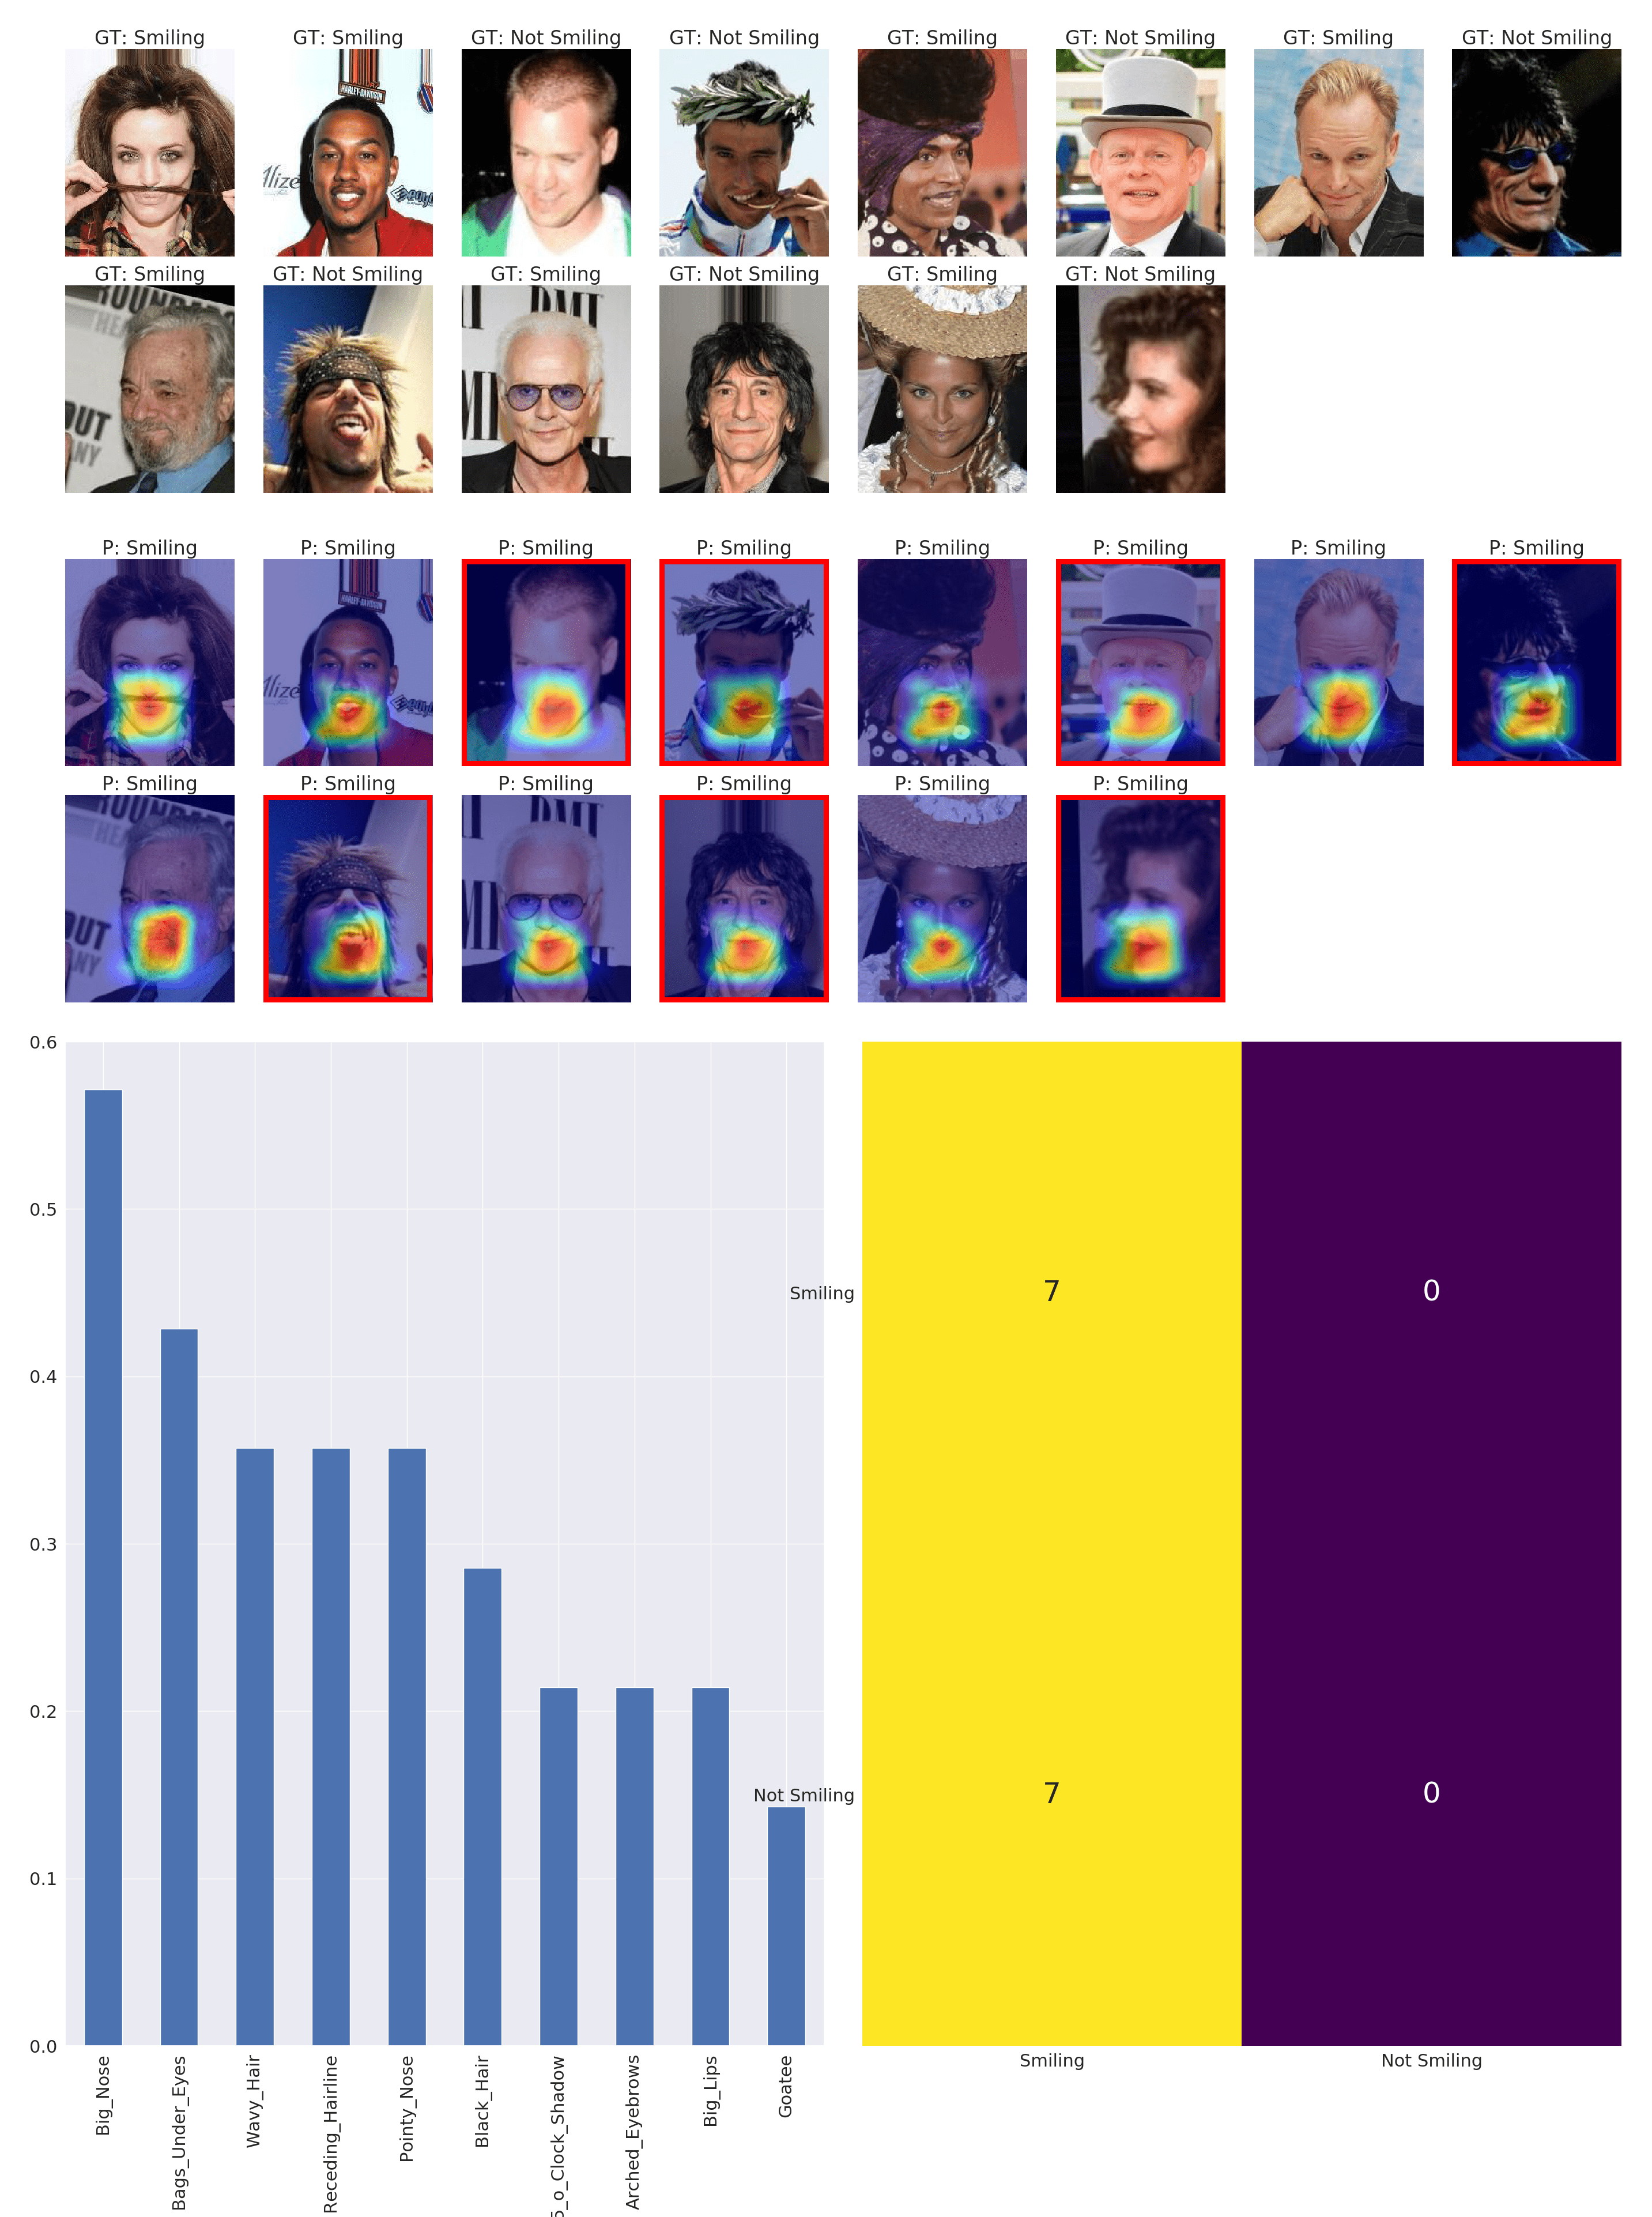
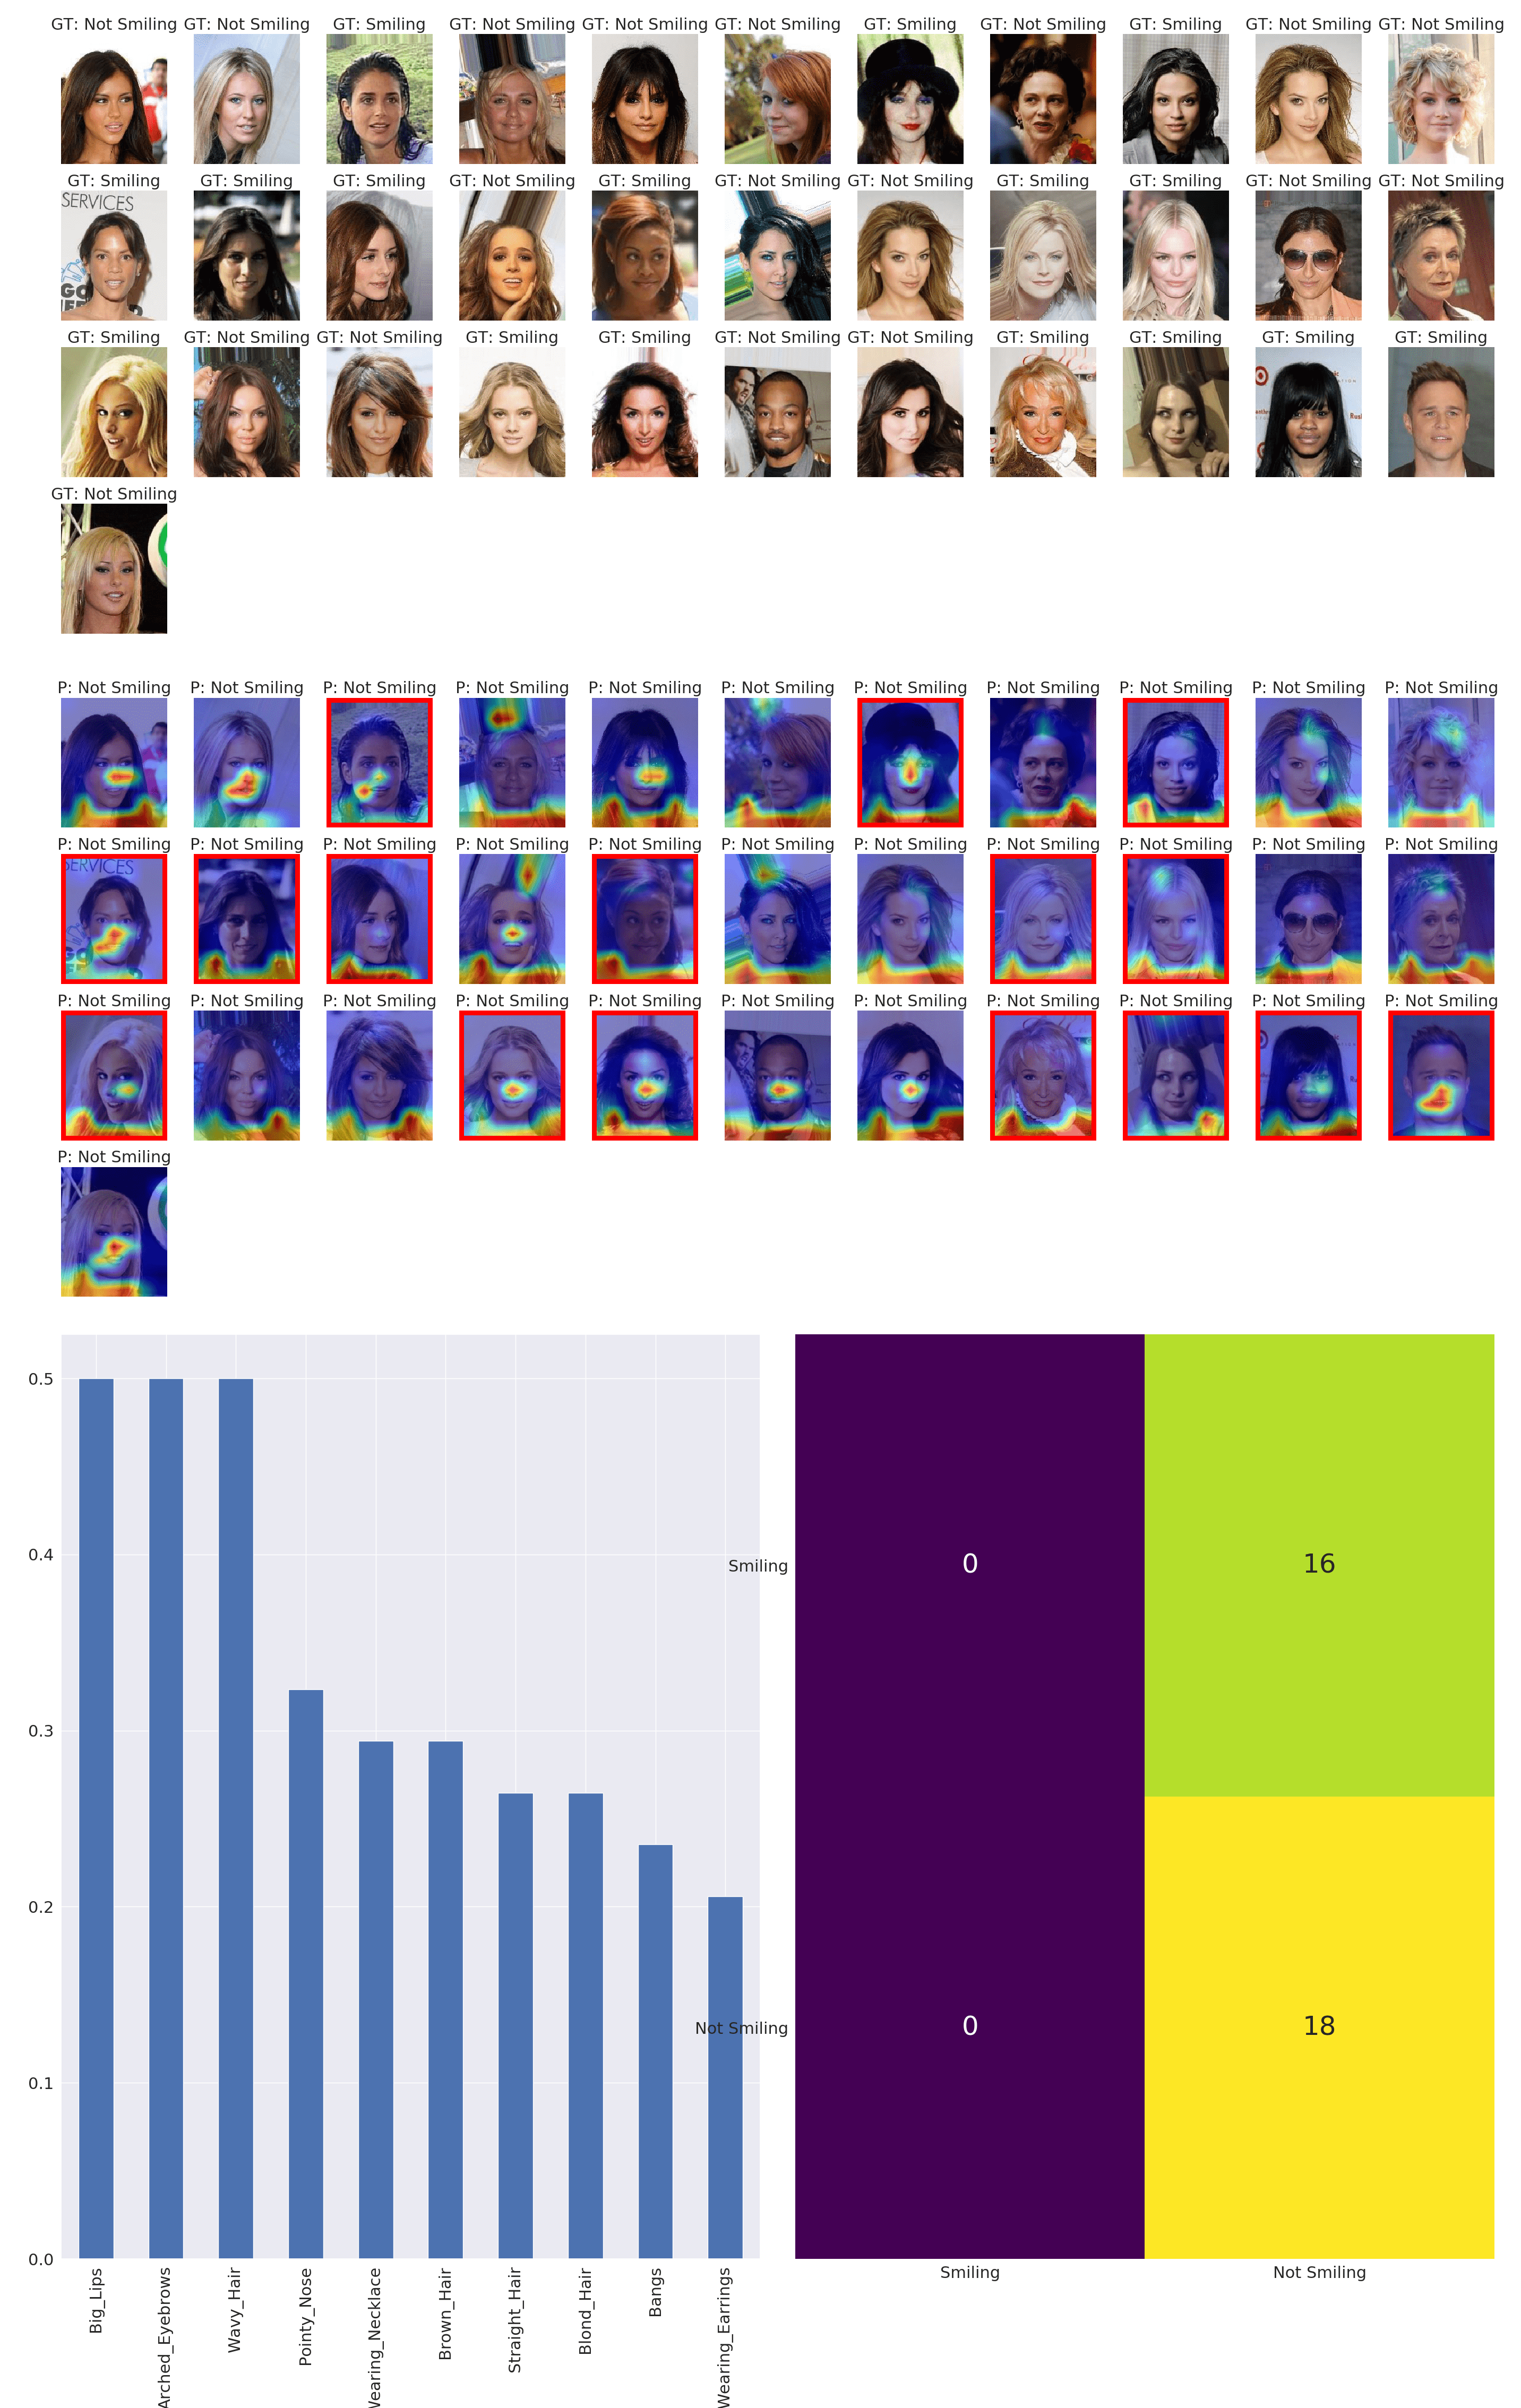
Smiling prediction on Biased CelebA. Since UDIS is able to discover spurious correlations that the model has learned, with our next experiment we hope to uncover a specific bias that we intentionally induce into the dataset. Under the model trained on the CelebA dataset with a bias toward the “Black Hair” attribute, the top clusters discovered correspond to visual explanations in the region of the image surrounding the hair (see Figure 3).
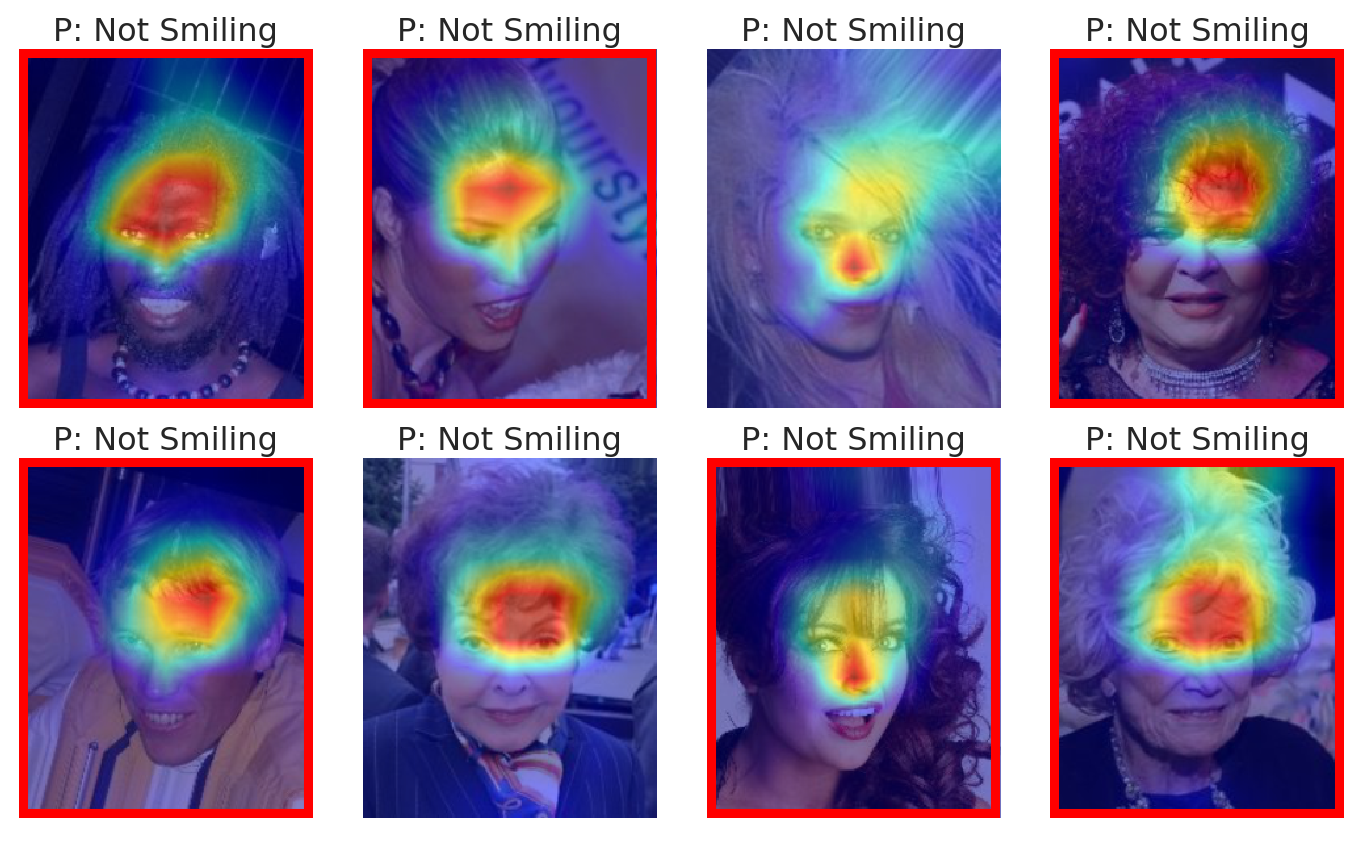
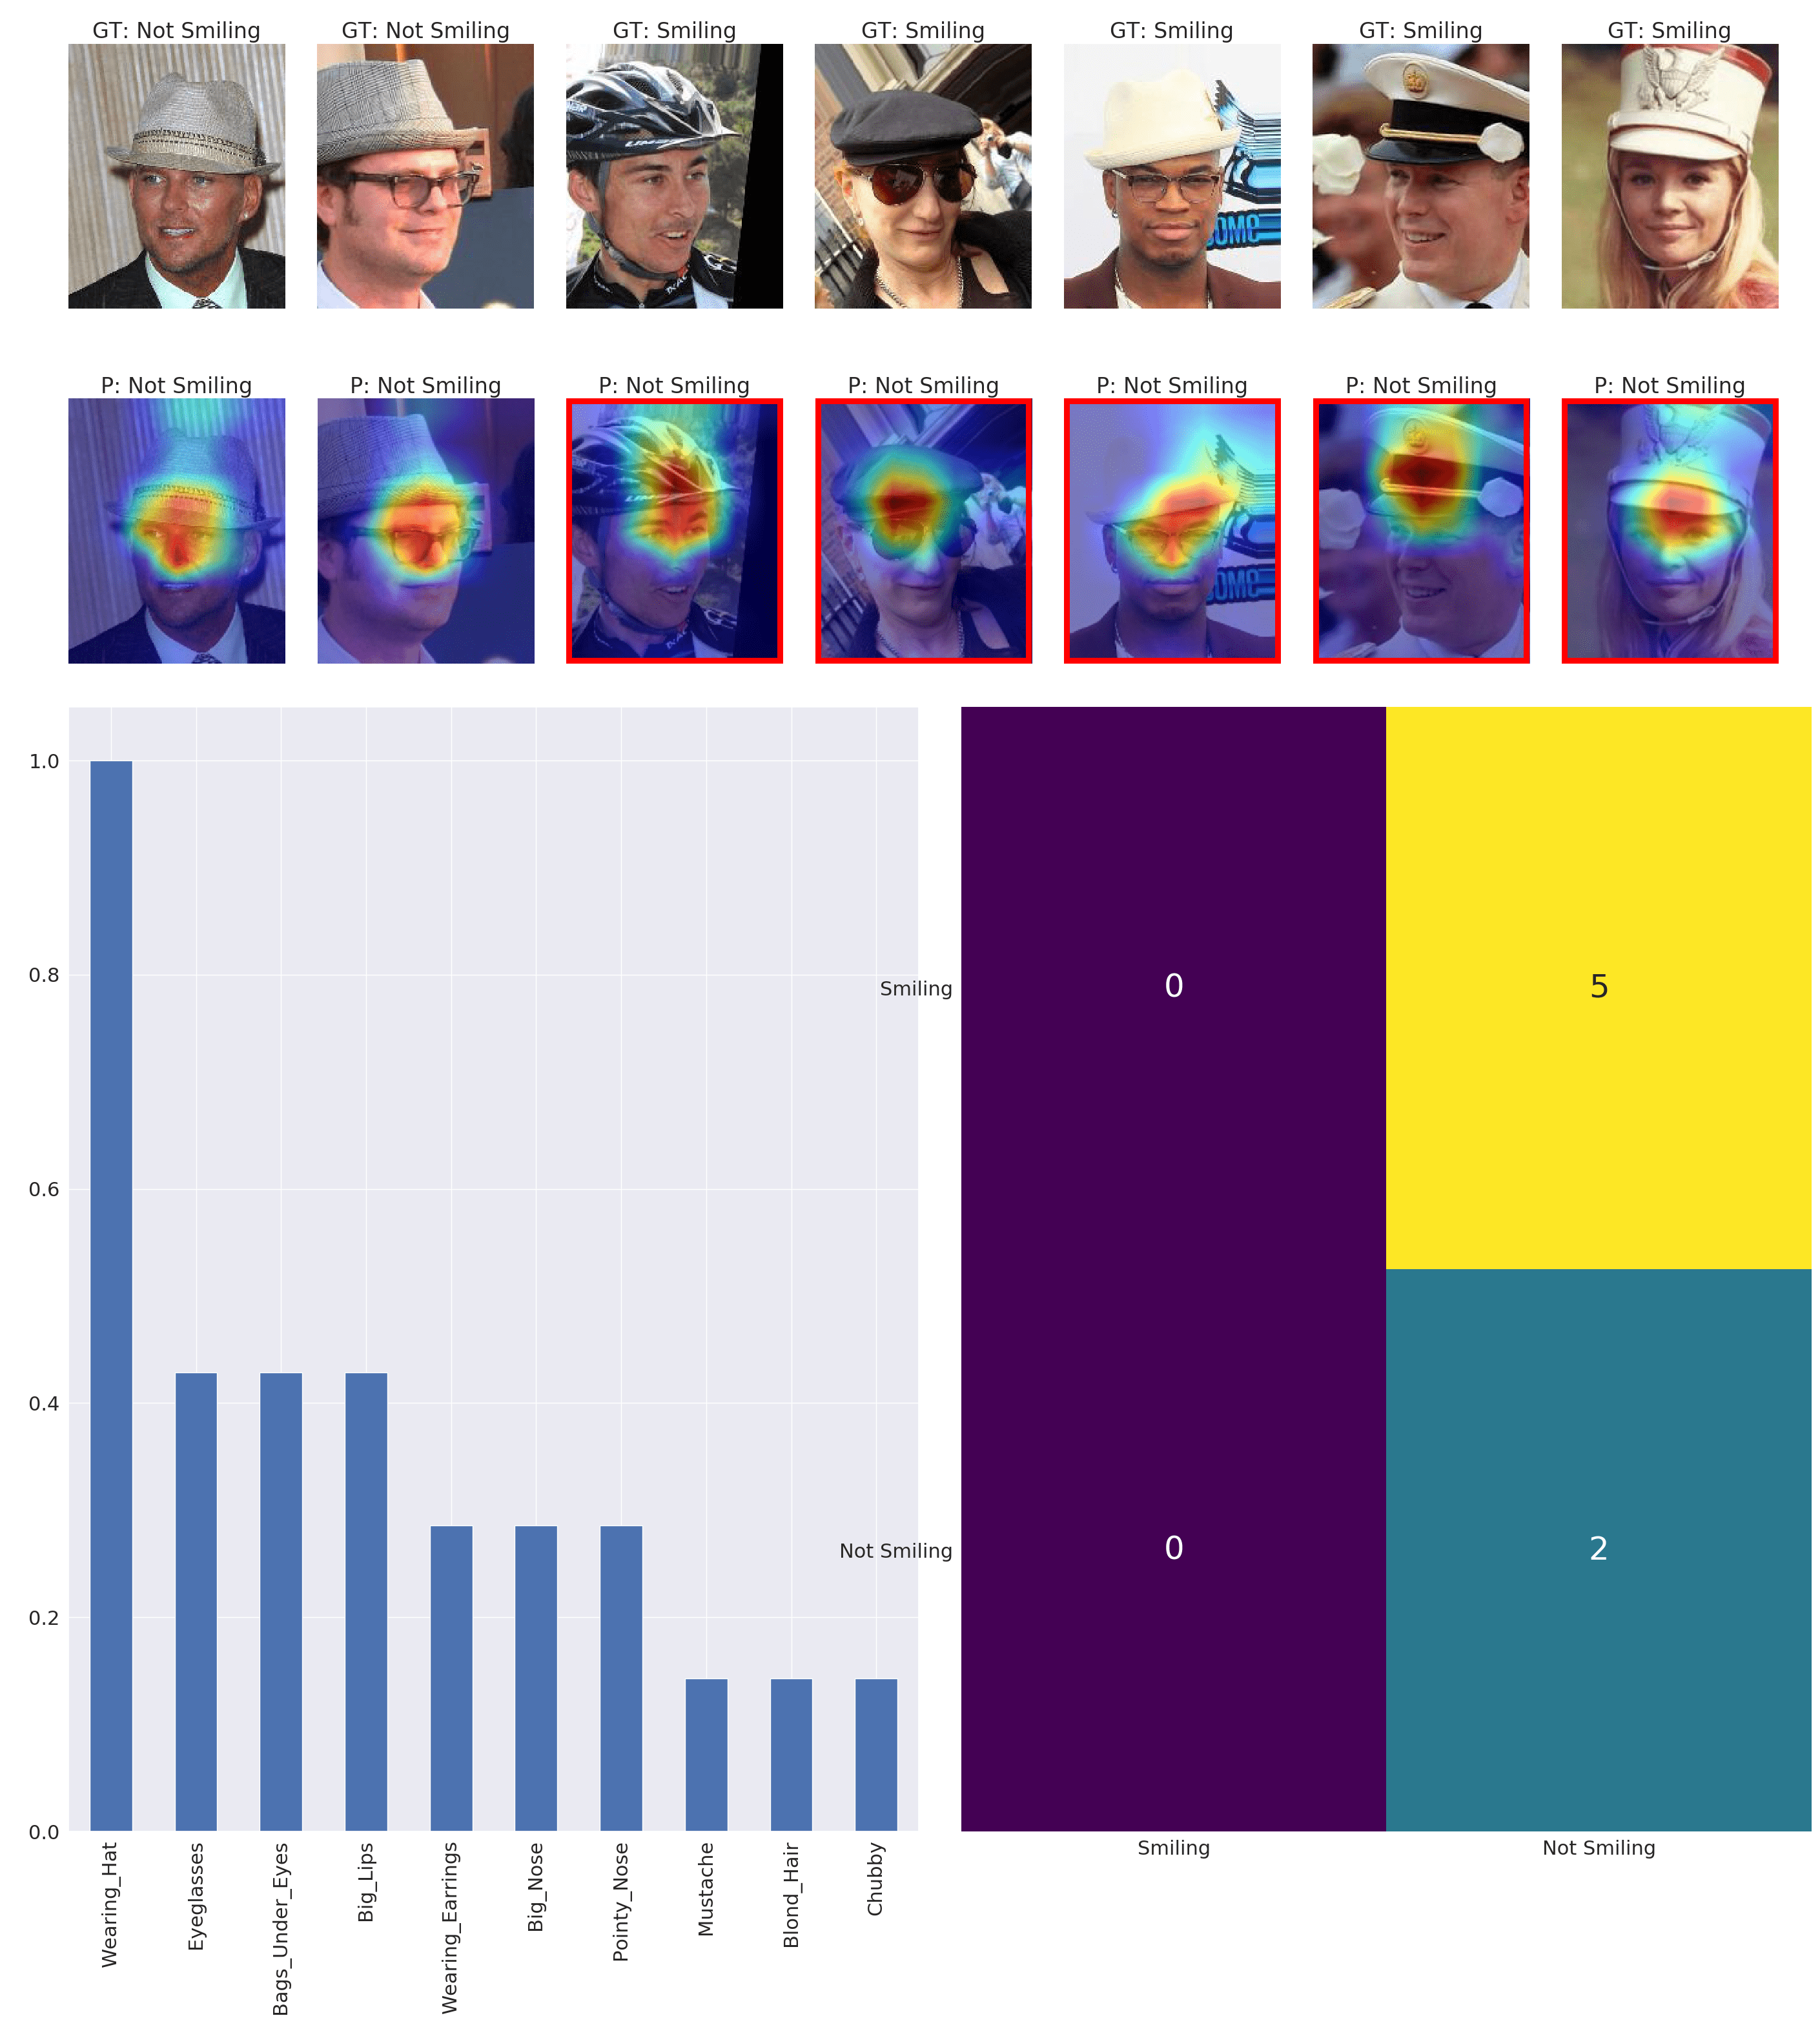
Sample images from the top cluster (full cluster in supplementary material) are shown in Figure 3(a), along with similar images from a higher accuracy cluster and their corresponding visual explanations. The tool also finds clusters (see supplementary material) where it discovers a bias learned against people wearing hats, as shown in Figure 3(b). This is still consistent with our experimental setting, as “Wearing Hat”, is likely accompanied by the “Black Hair” attribute being False. Examples of the subpopulations discovered by UDIS in this experimental setting can be seen in Figure 4.


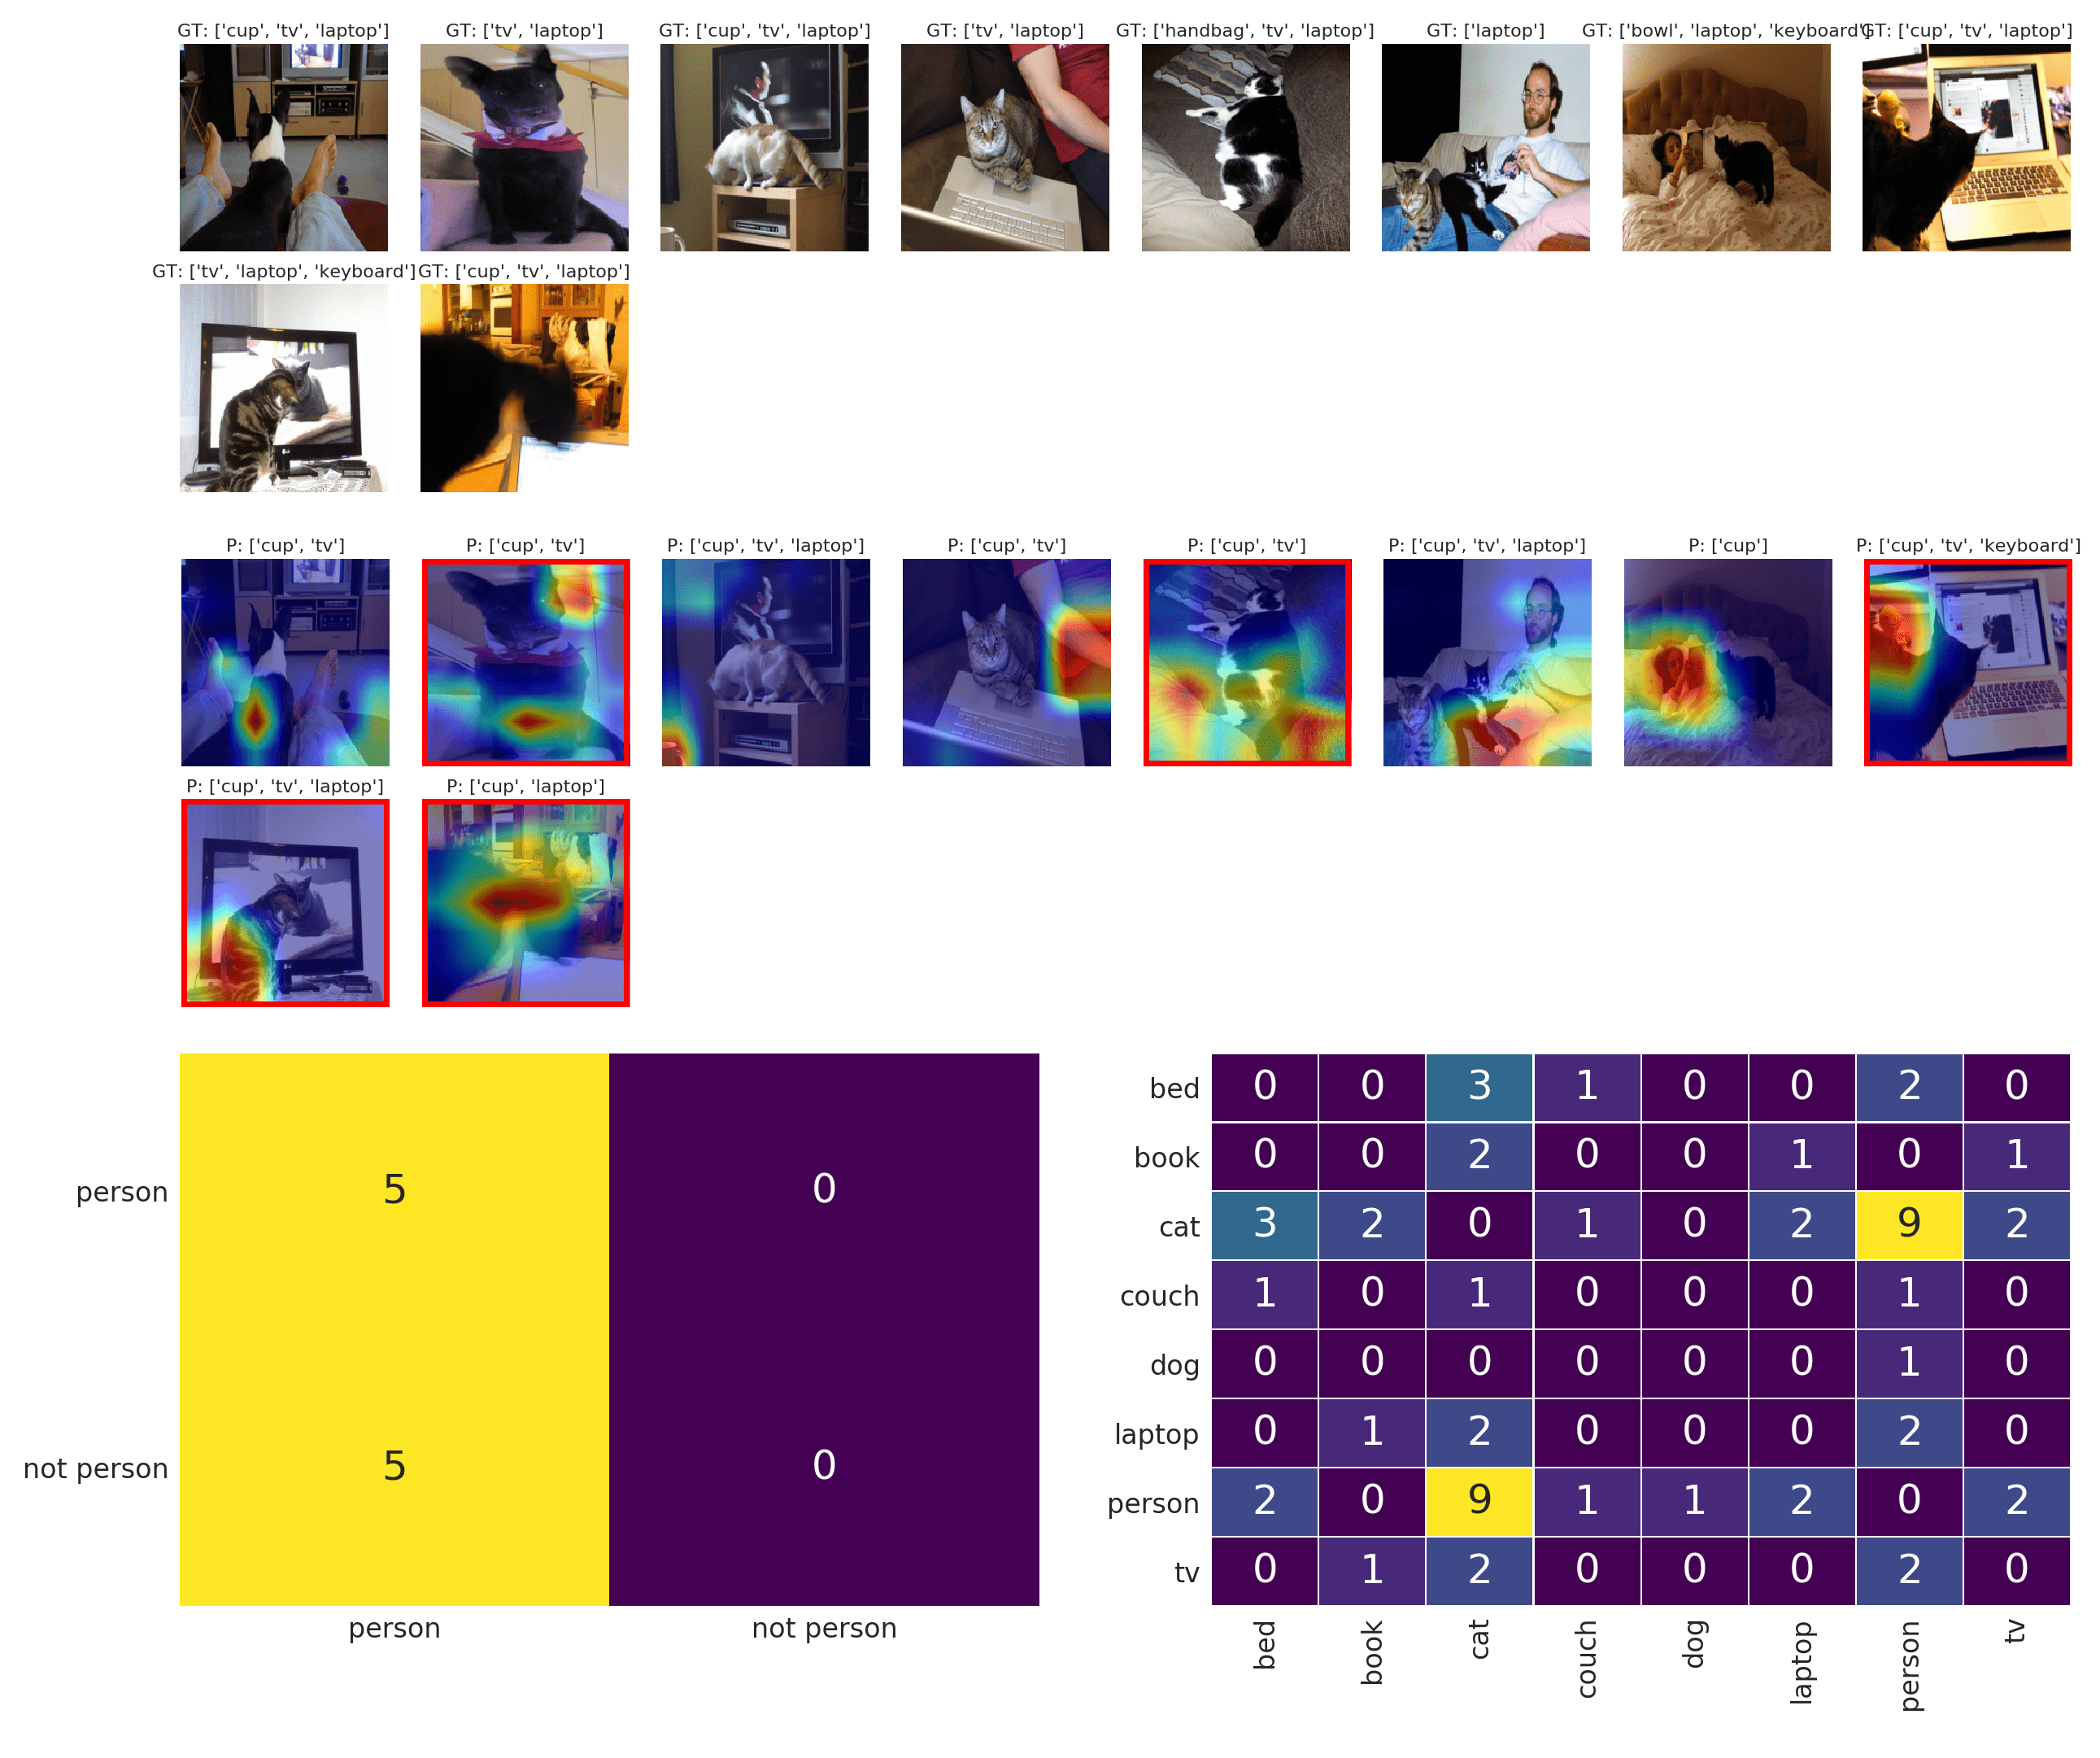
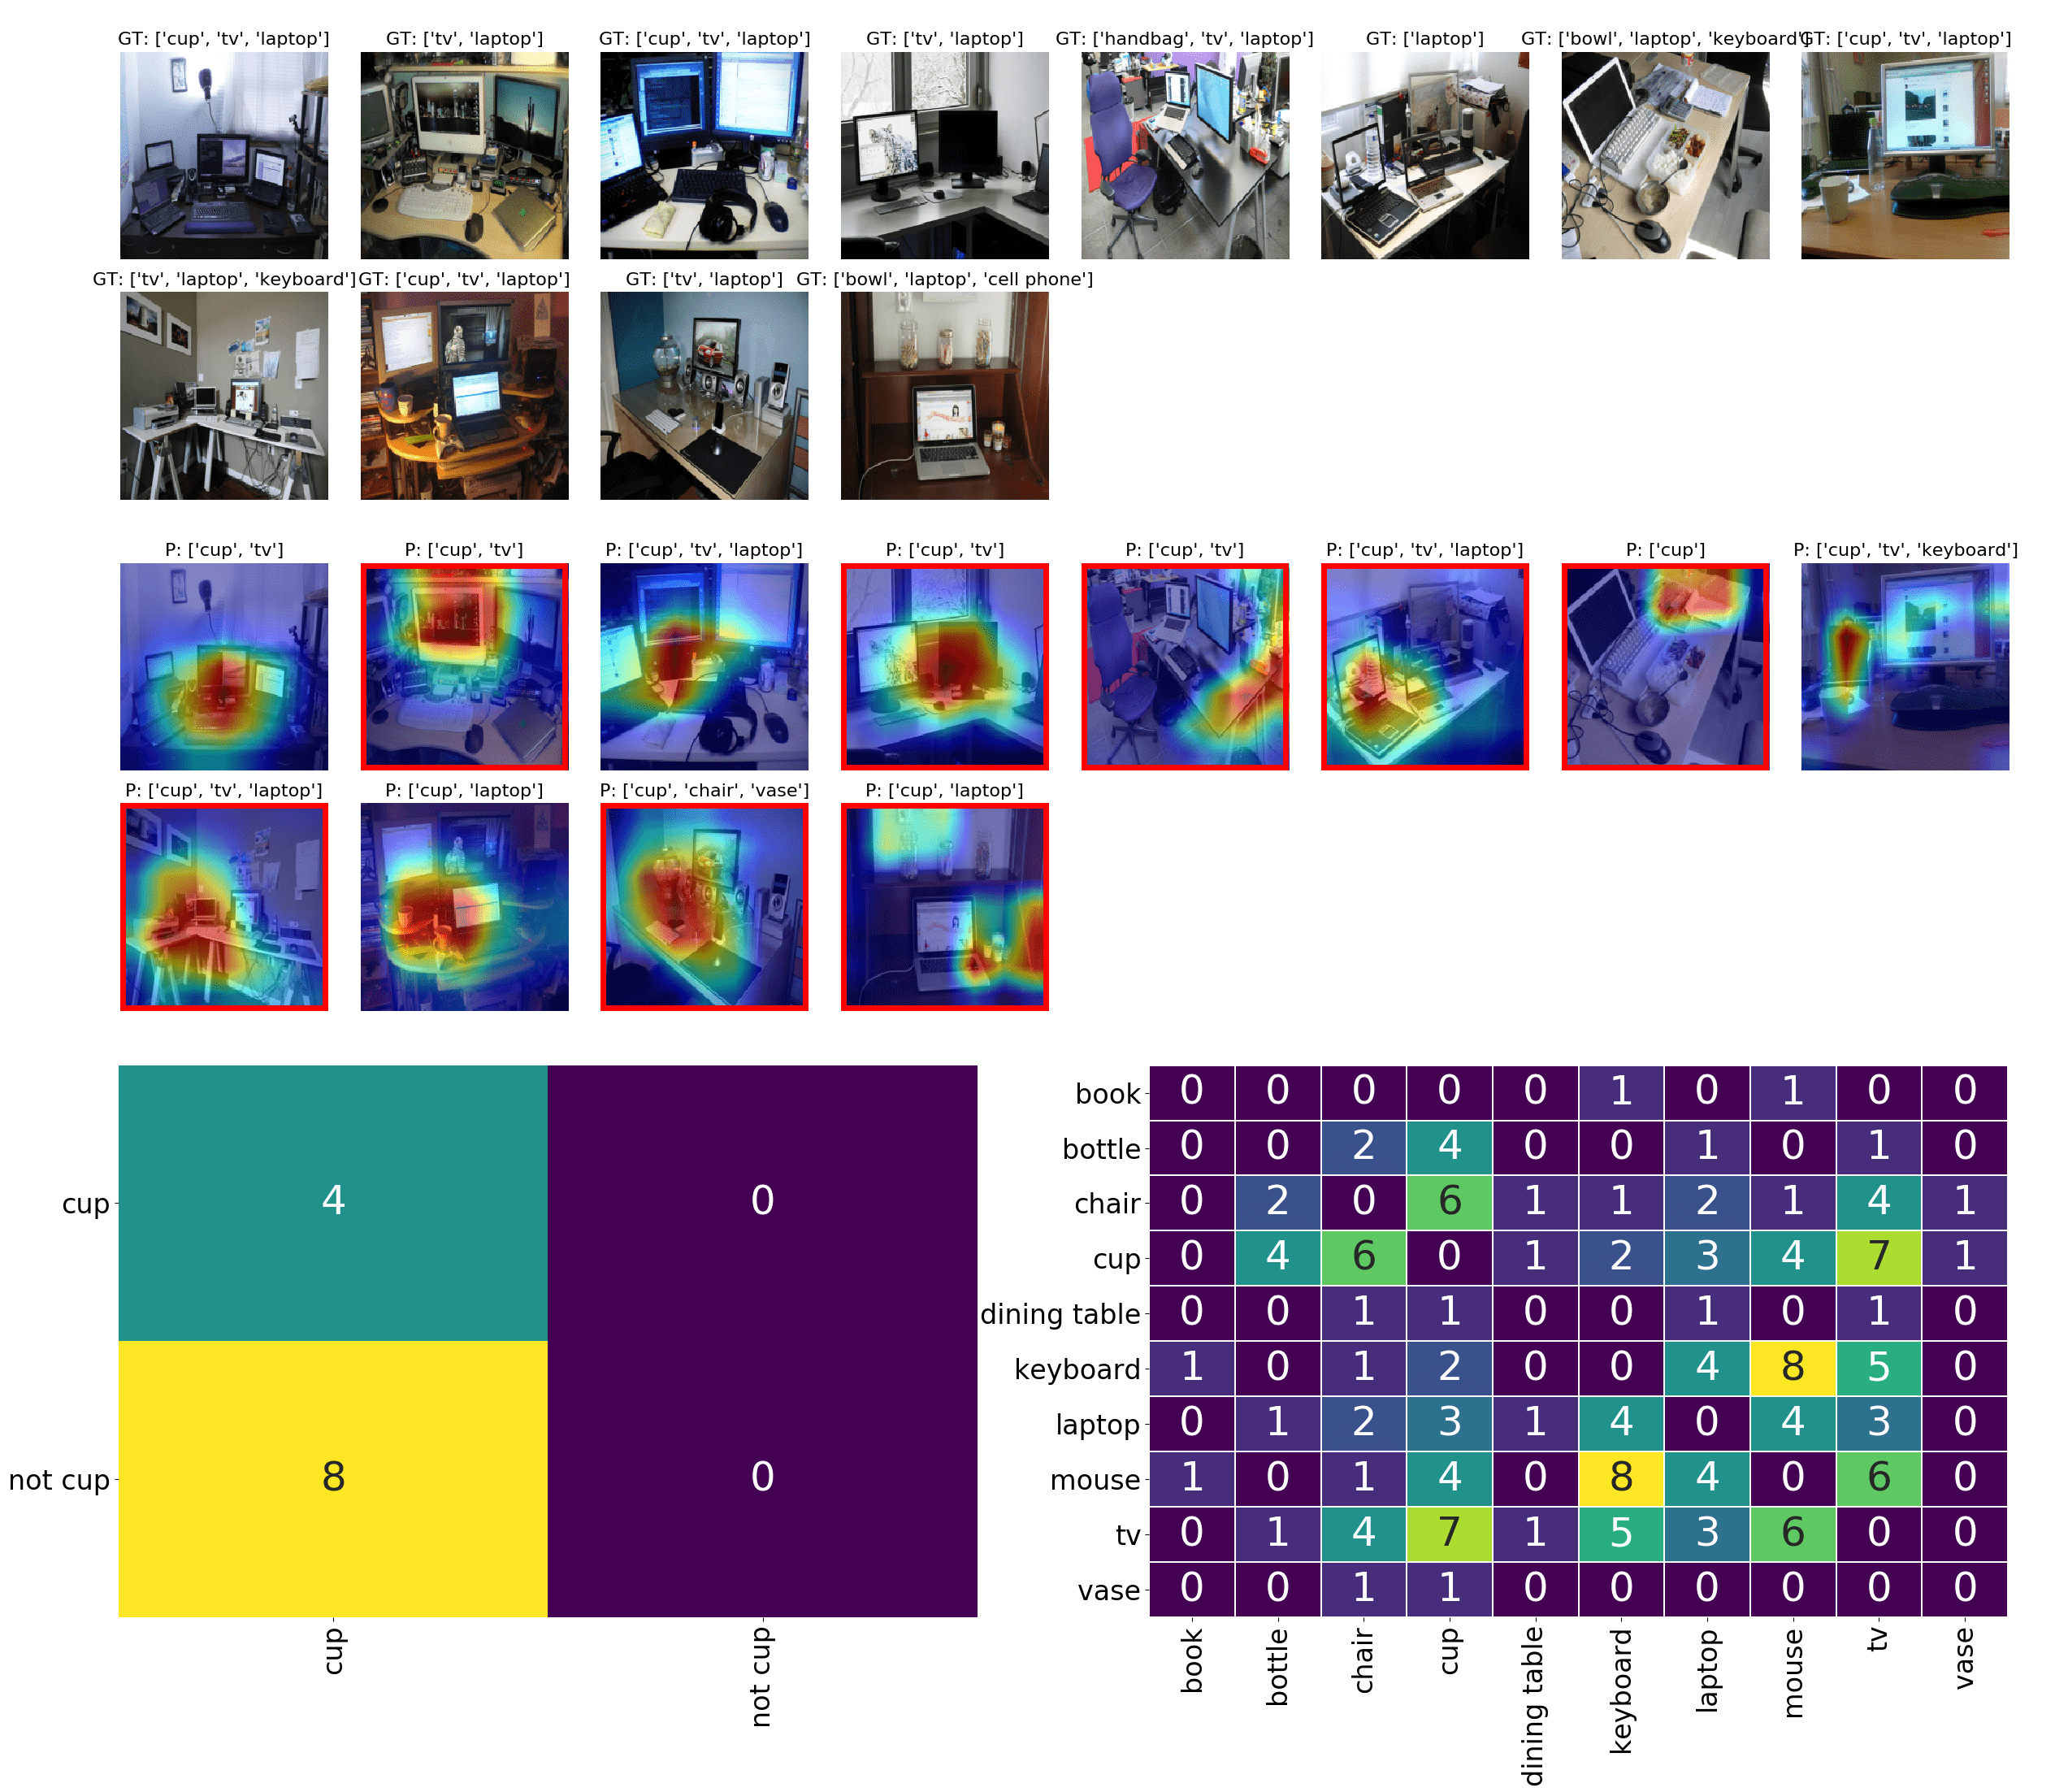
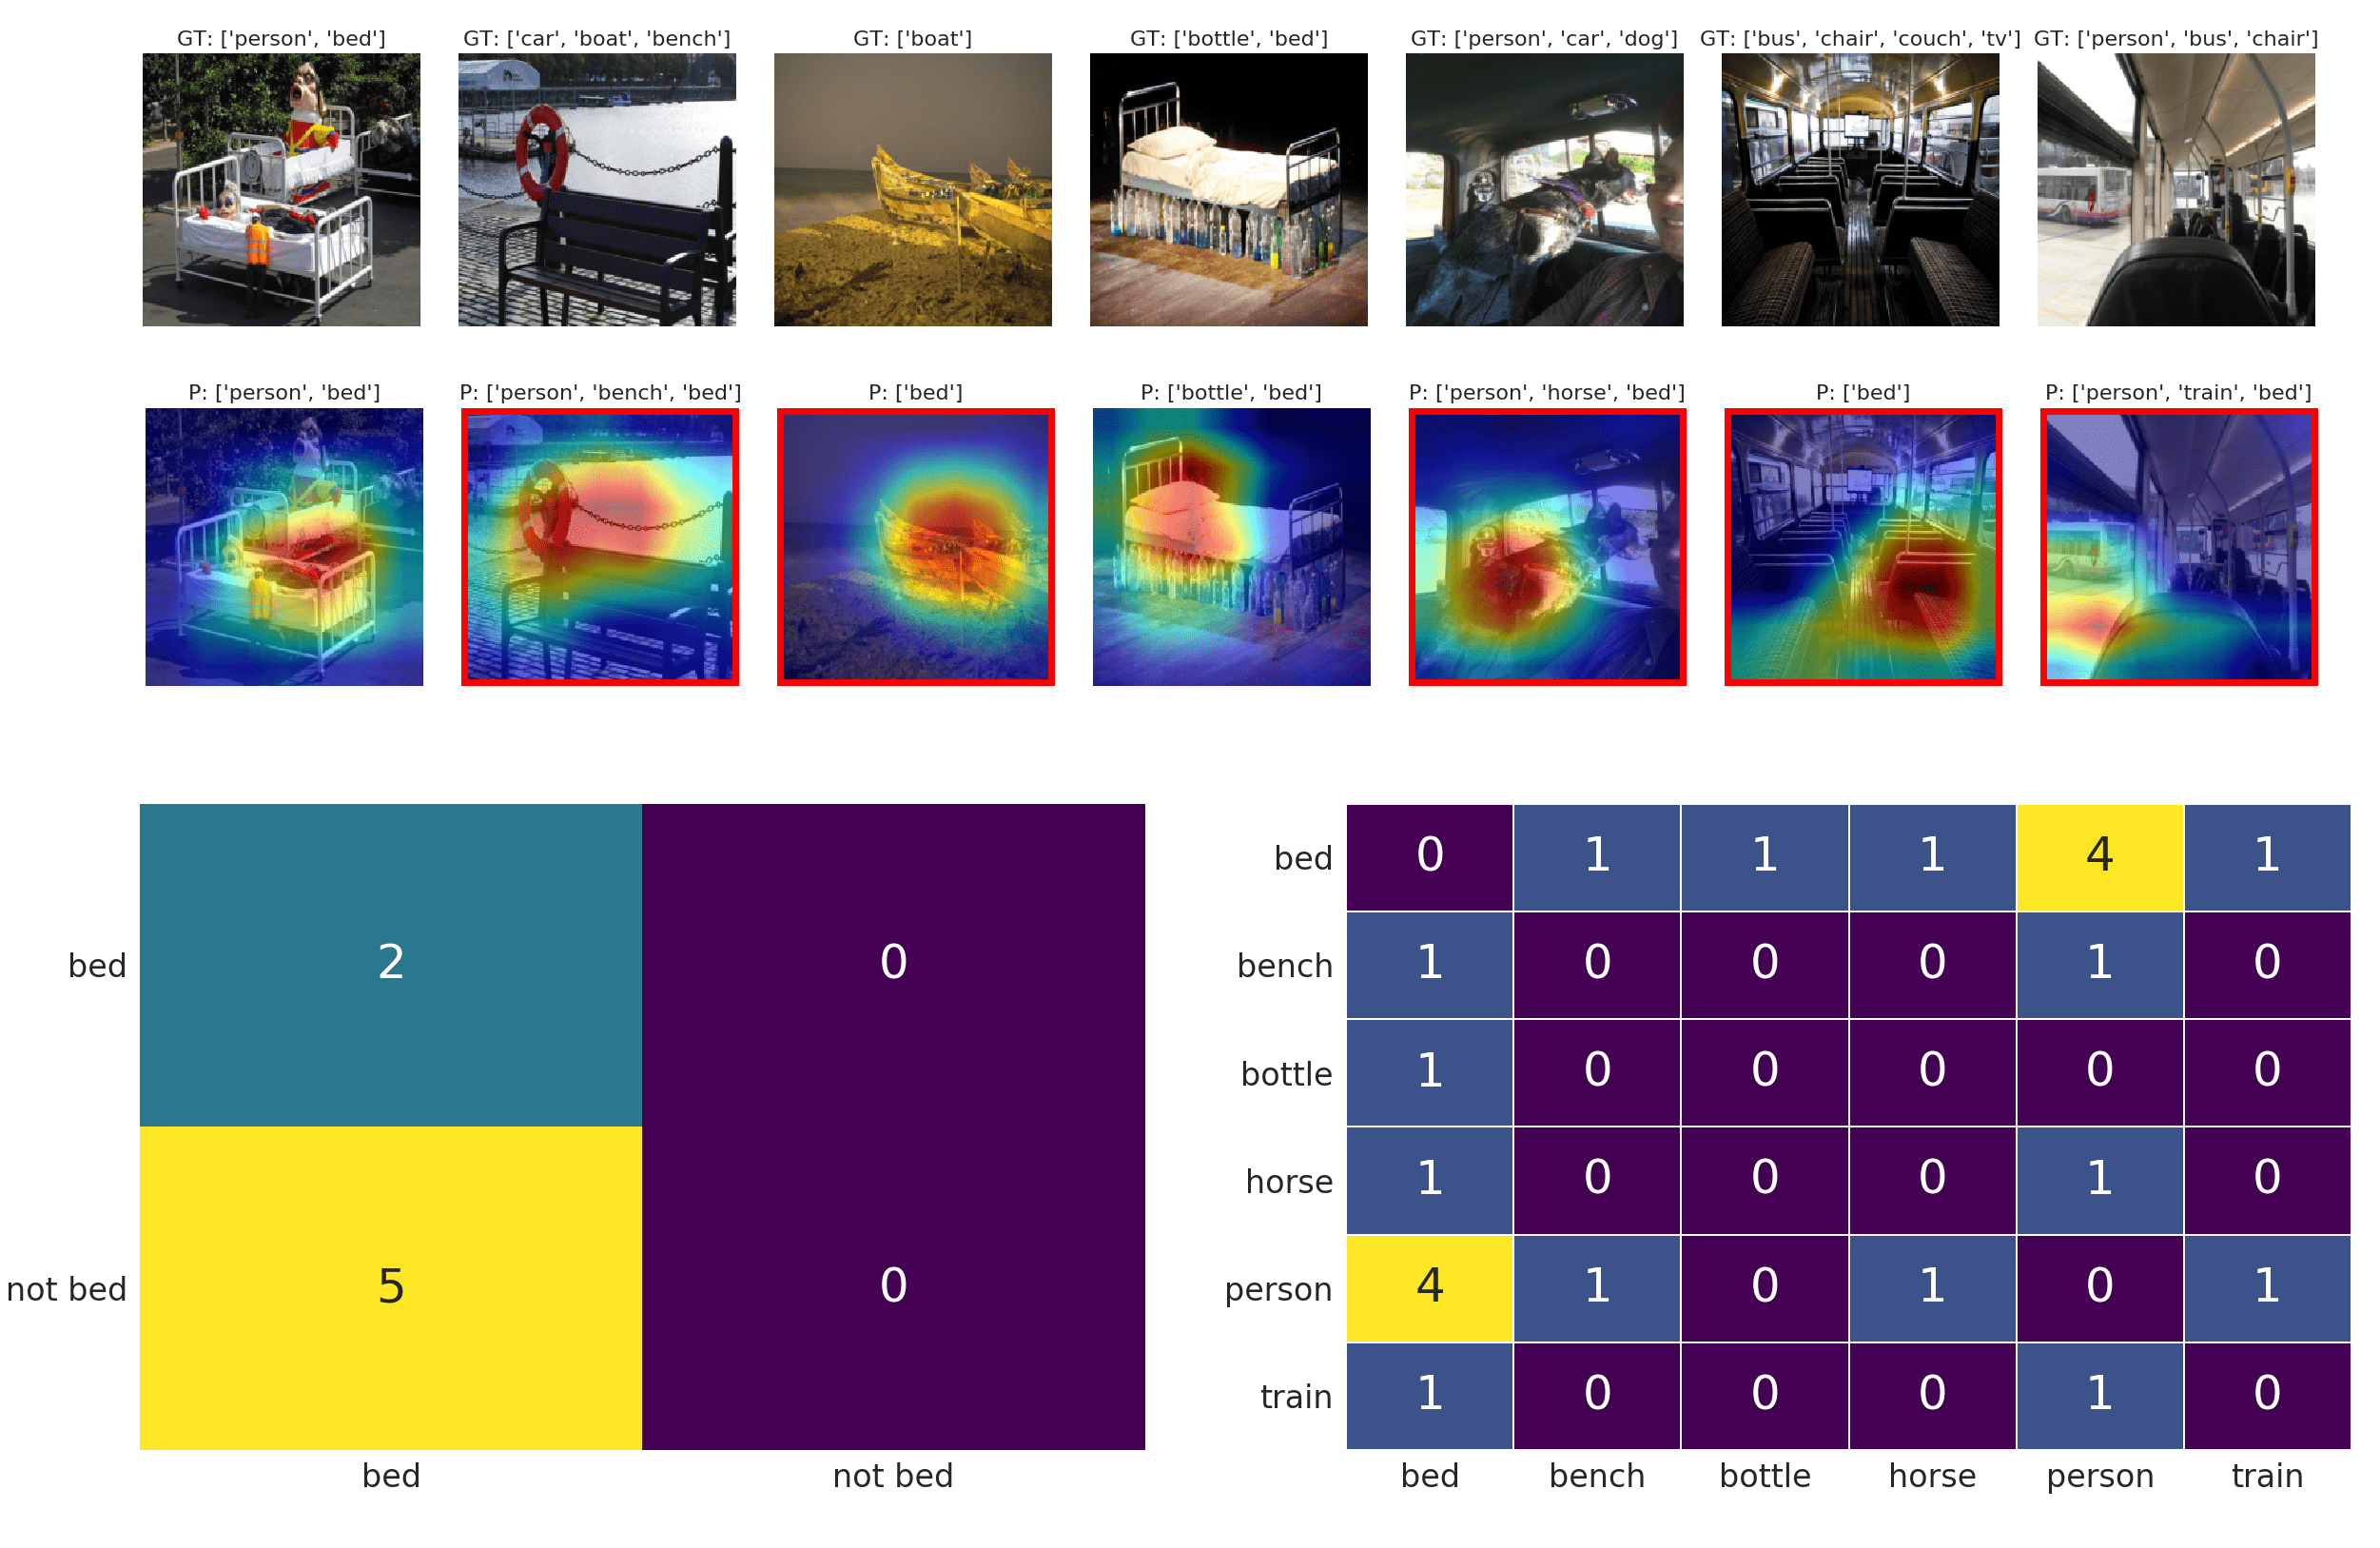
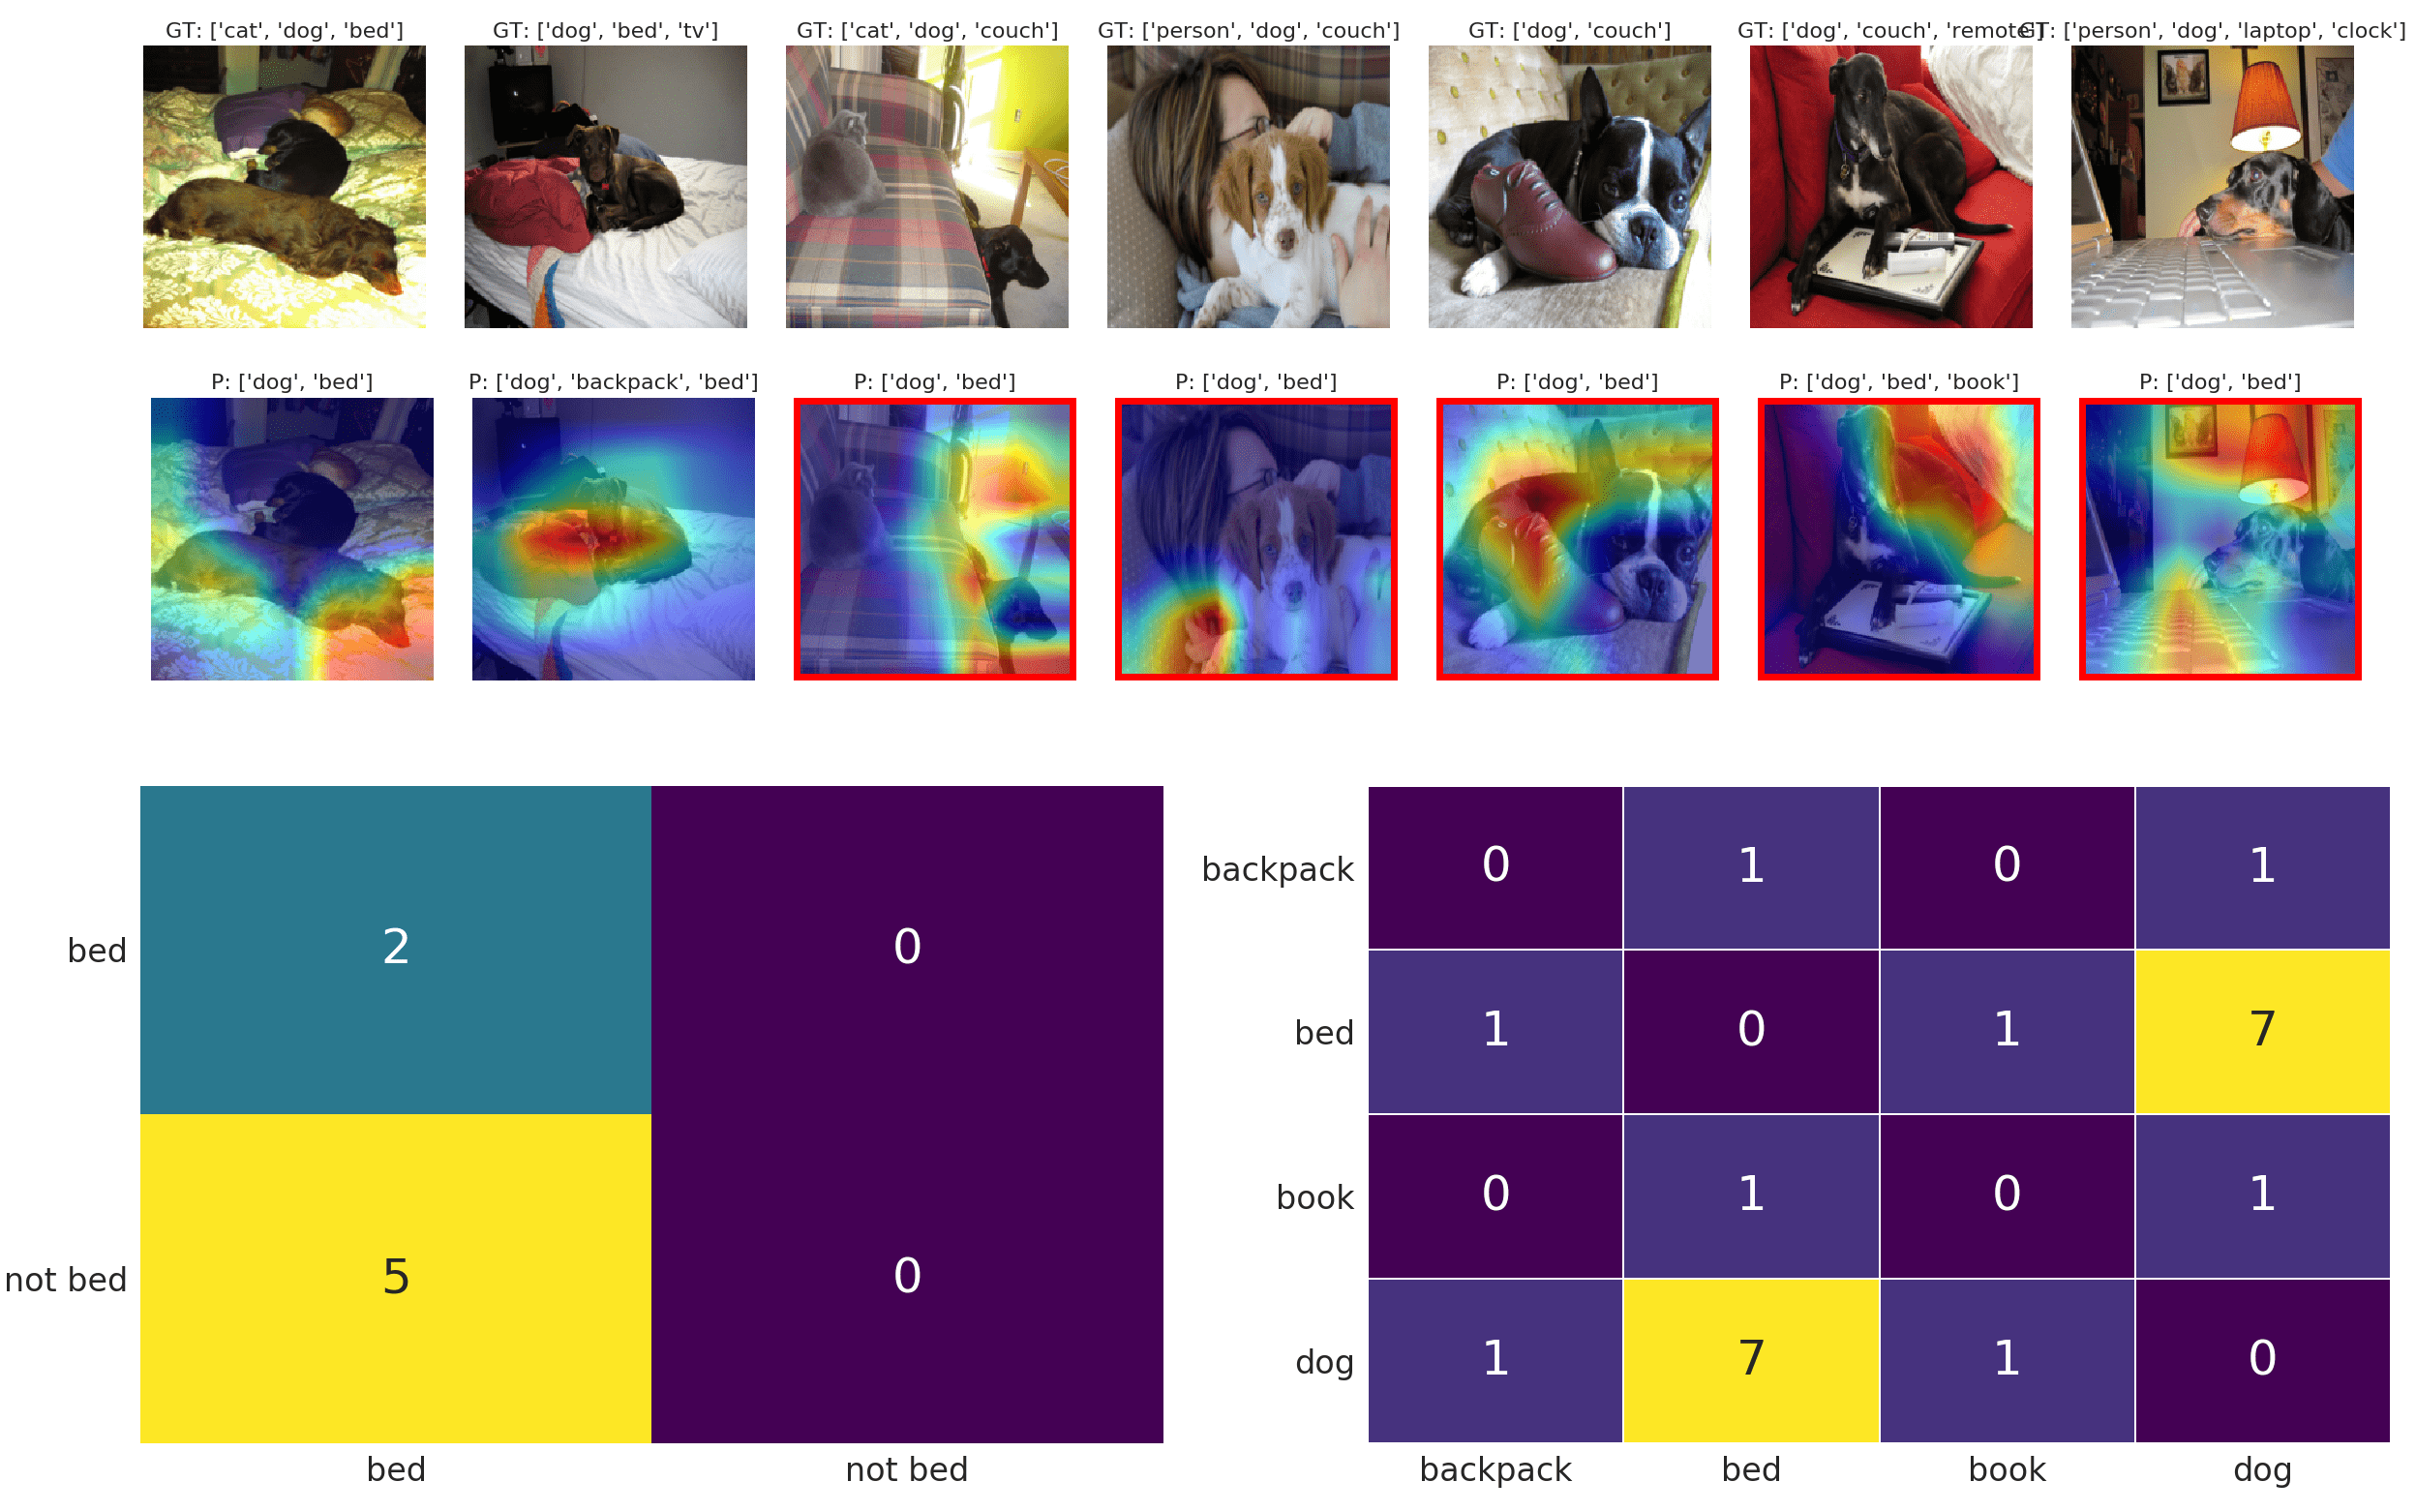
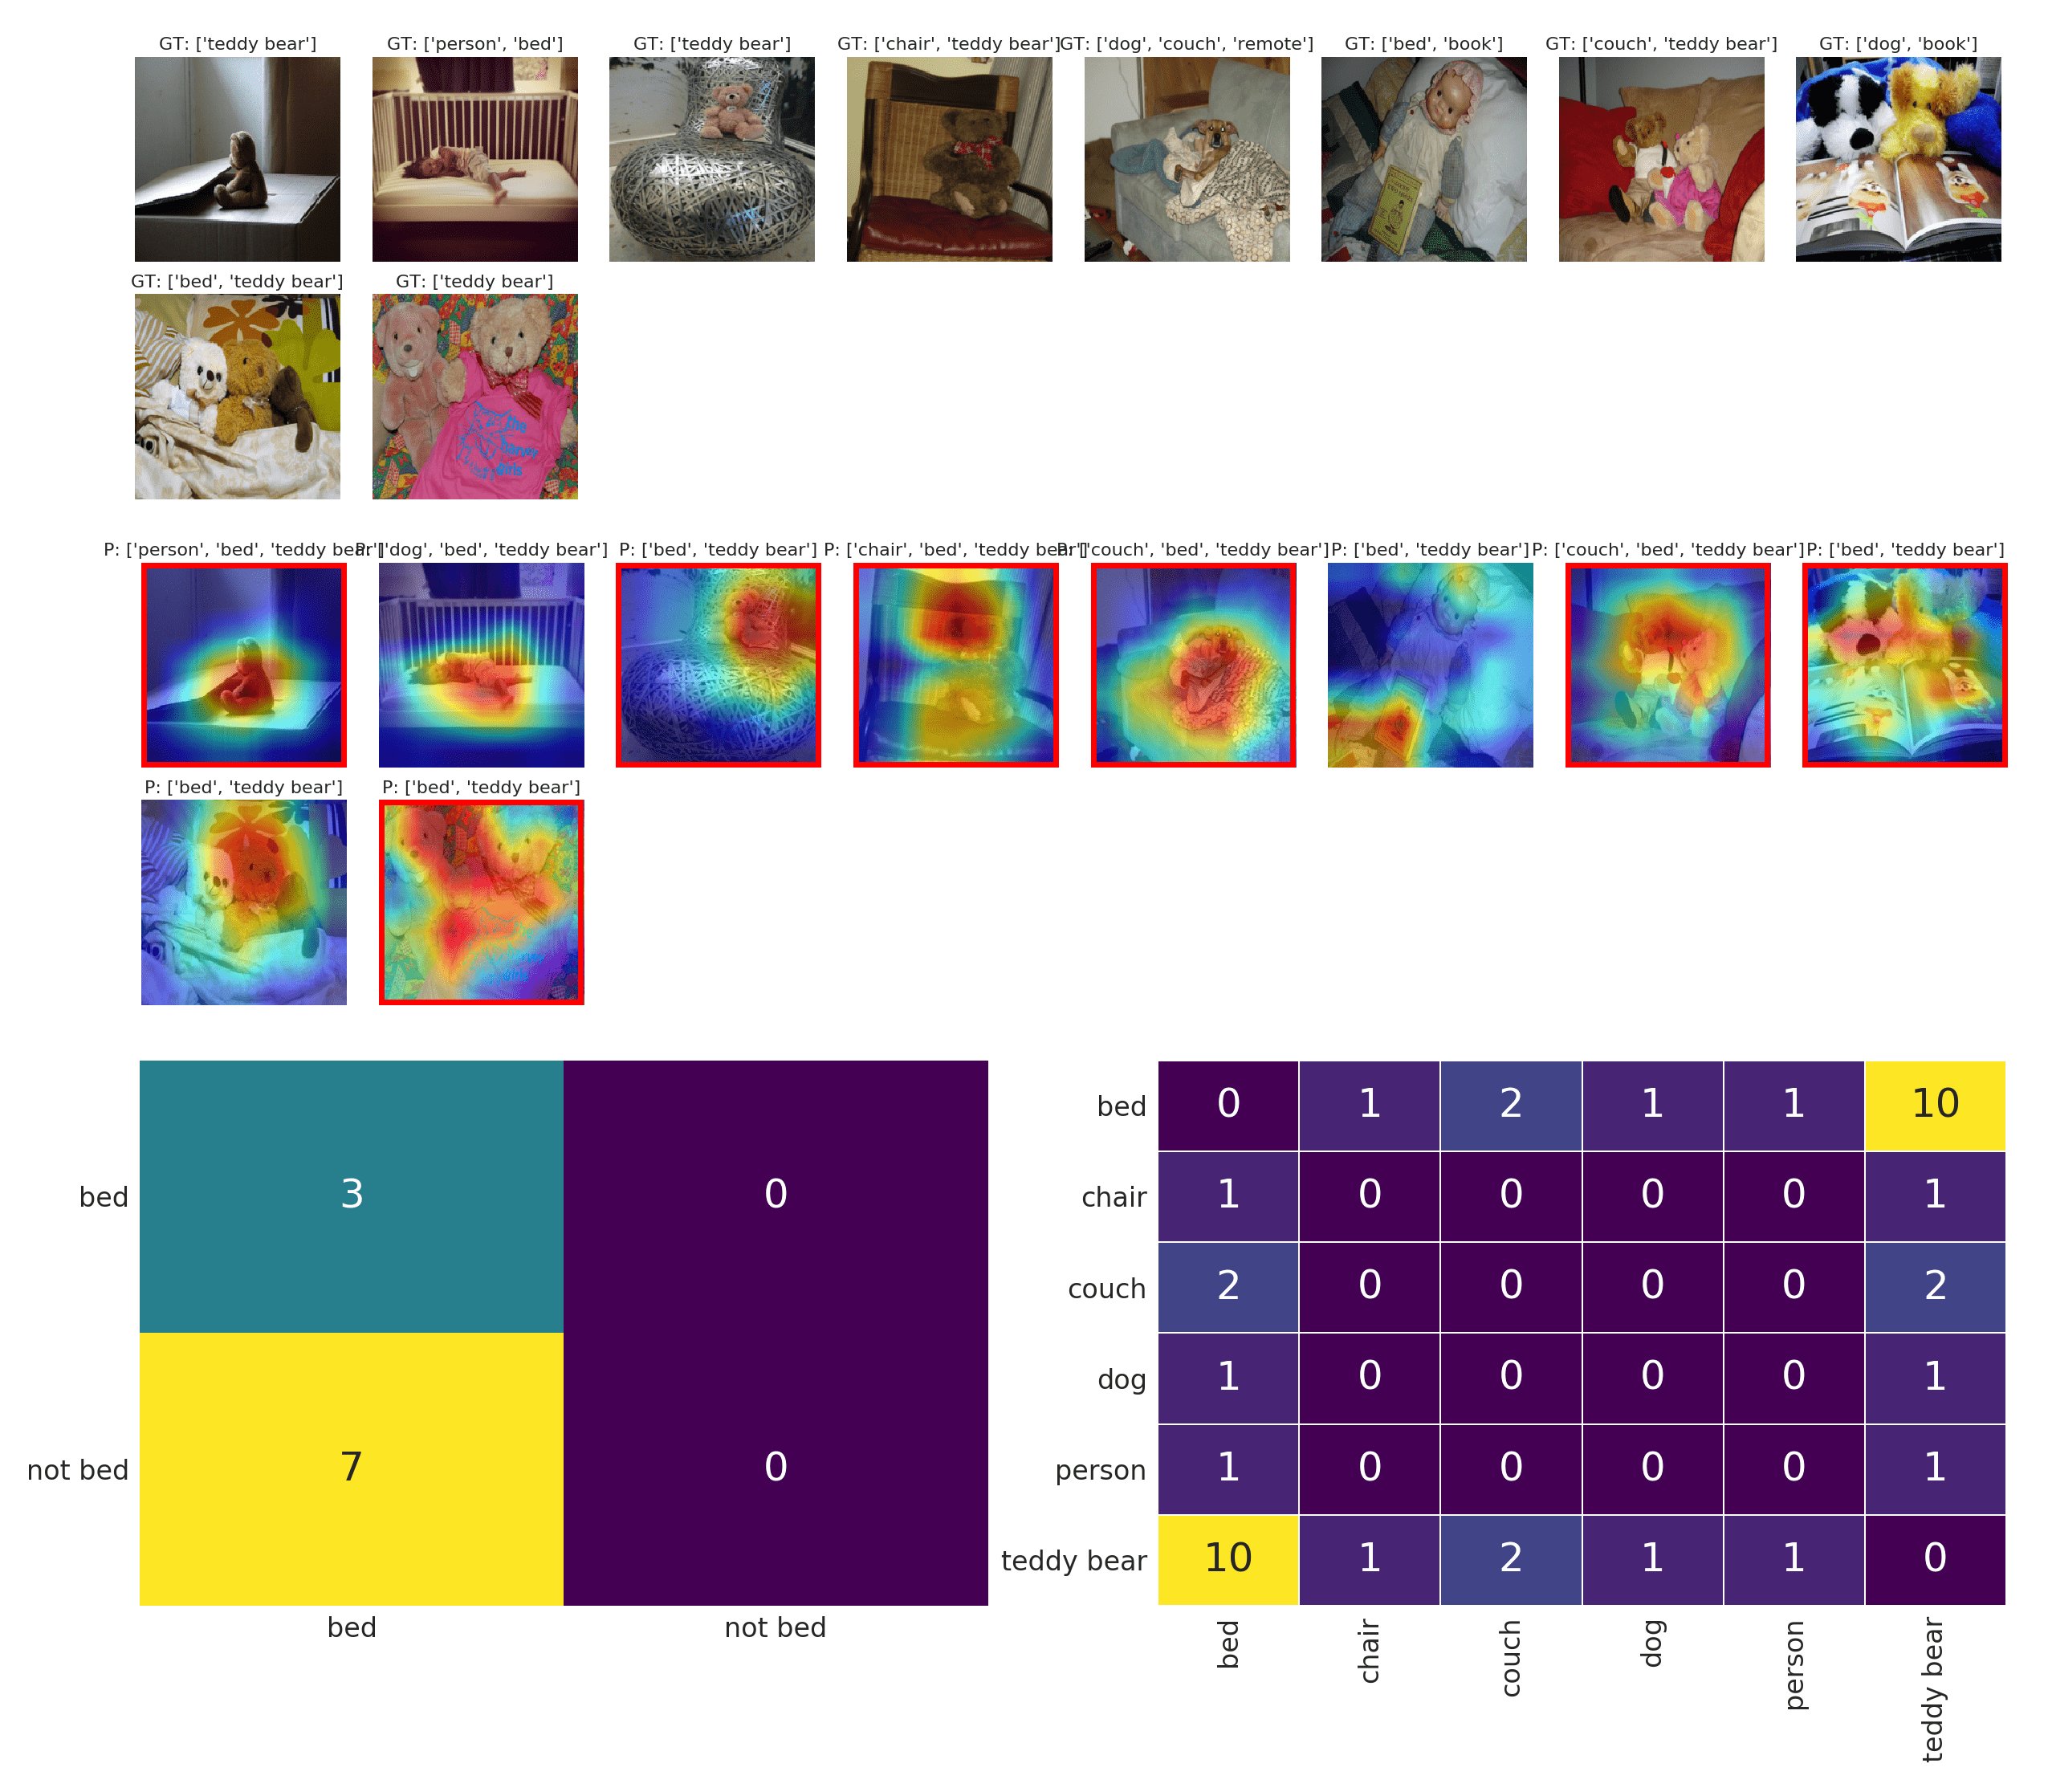
Multilabel classification on MS COCO. We present the results of biases discovered against 2 predicted categories: cup and bed (see Figure 5). When exploring the validation dataset of MSCOCO for biases against the category cup, sample images from the top cluster returned by our method can be seen in Figure 5(a). The model predicts all the images shown as containing the cup class. We notice that all the images in the cluster (see supplementary for full cluster) contain a screen and it is likely that the model associates the frequent occurrence of a cup next to a screen in the training dataset, to overpredict “cup” whenever it sees a screen. In Figure 5(b), we show example images of biases discovered for the category bed. The model seems to have learnt a spurious correlation between bed and teddy bear from the training data, labelling a number of instances where the teddy bear occurs without the bed, as a bed.
5 Conclusion
In conclusion, we present UDIS, an unsupervised method which is able to automatically discover subpopulations of visual datasets where the model systematically underperforms. We demonstrate using visual explanations that these subpopulations contain potential biases, and leave it to model developers to investigate the cause of such biases, evaluate their importance and take further action.
We note some important limitations of our method. UDIS exclusively focuses on discovering bias in the form of failure modes, where bias is defined as any spurious (i.e. irrelevant to the task at hand) correlation learnt by the model that leads to a drop in test accuracy. We acknowledge that this is only a subset of all possible encoded bias, as in some cases spurious correlations may potentially also improve model performance. Further, the model may also have failure modes due to optimization or generalization error that do not represent model bias. Finally, it remains an open question to determine how frequently the bias discovered by UDIS correlates with known cultural biases.
In summary, we emphasize that our method does not detect all possible source of model bias, that each failure mode discovered may not always correspond to a model bias, and further even the ones that do, may not represent an “interpretable” bias against a protected attribute such as race or gender. Extending our method to discover other kinds of bias, including those that lead to improvements in performance is a promising line of future work.
Acknowledgments: This work was funded in part by Cisco Inc.
References
- [Adebayo(2016)] Julius Adebayo. FairML: Toolbox for diagnosing bias in predictive modeling. Master’s thesis, MIT, 2016.
- [Angwin et al.(2016)Angwin, Larson, Mattu, and Kirchner] Julia Angwin, Jeff Larson, Surya Mattu, and Lauren Kirchner. Machine bias. ProPublica, 2016.
- [Balakrishnan et al.(2020)Balakrishnan, Xiong, Xia, and Perona] Guha Balakrishnan, Yuanjun Xiong, Wei Xia, and Pietro Perona. Towards causal benchmarking of bias in face analysis algorithms. In Andrea Vedaldi, Horst Bischof, Thomas Brox, and Jan-Michael Frahm, editors, Computer Vision – ECCV 2020, pages 547–563, Cham, 2020. Springer International Publishing. ISBN 978-3-030-58523-5.
- [Beery et al.(2018)Beery, Horn, and Perona] Sara Beery, Grant Van Horn, and P. Perona. Recognition in terra incognita. In ECCV, 2018.
- [Bellamy et al.(2018)Bellamy, Dey, Hind, Hoffman, Houde, Kannan, Lohia, Martino, Mehta, Mojsilovic, Nagar, Ramamurthy, Richards, Saha, Sattigeri, Singh, Varshney, and Zhang] Rachel K. E. Bellamy, Kuntal Dey, Michael Hind, Samuel C. Hoffman, Stephanie Houde, Kalapriya Kannan, Pranay Lohia, Jacquelyn Martino, Sameep Mehta, Aleksandra Mojsilovic, Seema Nagar, Karthikeyan Natesan Ramamurthy, John T. Richards, Diptikalyan Saha, Prasanna Sattigeri, Moninder Singh, Kush R. Varshney, and Yunfeng Zhang. AI fairness 360: An extensible toolkit for detecting, understanding, and mitigating unwanted algorithmic bias. CoRR, abs/1810.01943, 2018. URL http://arxiv.org/abs/1810.01943.
- [Bolukbasi et al.(2016)Bolukbasi, Chang, Zou, Saligrama, and Kalai] Tolga Bolukbasi, Kai-Wei Chang, James Zou, Venkatesh Saligrama, and Adam Kalai. Man is to computer programmer as woman is to homemaker? debiasing word embeddings. In Proceedings of the 30th International Conference on Neural Information Processing Systems, NIPS’16, page 4356–4364, Red Hook, NY, USA, 2016. Curran Associates Inc. ISBN 9781510838819.
- [Brandao(2019)] Martim Brandao. Age and gender bias in pedestrian detection algorithms. Workshop on Fairness Accountability Transparency and Ethics in Computer Vision, CVPR, 2019.
- [Buolamwini and Gebru(2018)] Joy Buolamwini and Timnit Gebru. Gender shades: Intersectional accuracy disparities in commercial gender classification. In FAT, 2018.
- [Cabrera et al.(2019)Cabrera, Epperson, Hohman, Kahng, Morgenstern, and Chau] Ángel Alexander Cabrera, Will Epperson, Fred Hohman, Minsuk Kahng, Jamie H. Morgenstern, and Duen Horng Chau. Fairvis: Visual analytics for discovering intersectional bias in machine learning. 2019 IEEE Conference on Visual Analytics Science and Technology (VAST), pages 46–56, 2019.
- [Chang et al.(2019)Chang, Creager, Goldenberg, and Duvenaud] Chun-Hao Chang, Elliot Creager, Anna Goldenberg, and David Duvenaud. Explaining image classifiers by counterfactual generation. In International Conference on Learning Representations, 2019. URL https://openreview.net/forum?id=B1MXz20cYQ.
- [Dabkowski and Gal(2017)] Piotr Dabkowski and Yarin Gal. Real time image saliency for black box classifiers. In Proceedings of the 31st International Conference on Neural Information Processing Systems, NIPS’17, page 6970–6979, Red Hook, NY, USA, 2017. Curran Associates Inc. ISBN 9781510860964.
- [Dash et al.(2022)Dash, Balasubramanian, and Sharma] S. Dash, V. N. Balasubramanian, and A. Sharma. Evaluating and mitigating bias in image classifiers: A causal perspective using counterfactuals. IEEE Winter Conference on Applications of Computer Vision (WACV), 2022.
- [de Vries et al.(2019)de Vries, Misra, Wang, and van der Maaten] Terrance de Vries, Ishan Misra, Changhan Wang, and Laurens van der Maaten. Does object recognition work for everyone? In Proceedings of the IEEE/CVF Conference on Computer Vision and Pattern Recognition (CVPR) Workshops, June 2019.
- [Dwork et al.(2012)Dwork, Hardt, Pitassi, Reingold, and Zemel] Cynthia Dwork, Moritz Hardt, Toniann Pitassi, Omer Reingold, and Richard Zemel. Fairness through awareness. In Proceedings of the 3rd Innovations in Theoretical Computer Science Conference, ITCS ’12, page 214–226, New York, NY, USA, 2012. Association for Computing Machinery. ISBN 9781450311151. 10.1145/2090236.2090255. URL https://doi.org/10.1145/2090236.2090255.
- [Eykholt et al.(2018)Eykholt, Evtimov, Fernandes, Li, Rahmati, Xiao, Prakash, Kohno, and Song] Kevin Eykholt, Ivan Evtimov, Earlence Fernandes, Bo Li, Amir Rahmati, Chaowei Xiao, Atul Prakash, Tadayoshi Kohno, and Dawn Song. Robust physical-world attacks on deep learning visual classification. In Proceedings of the IEEE Conference on Computer Vision and Pattern Recognition (CVPR), June 2018.
- [Fong and Vedaldi(2017)] Ruth C. Fong and Andrea Vedaldi. Interpretable explanations of black boxes by meaningful perturbation. In Proceedings of the IEEE International Conference on Computer Vision (ICCV), Oct 2017.
- [Gajane(2017)] Pratik Gajane. On formalizing fairness in prediction with machine learning. CoRR, abs/1710.03184, 2017. URL http://arxiv.org/abs/1710.03184.
- [Goyal et al.(2019)Goyal, Wu, Ernst, Batra, Parikh, and Lee] Yash Goyal, Ziyan Wu, Jan Ernst, Dhruv Batra, Devi Parikh, and Stefan Lee. Counterfactual visual explanations. In Kamalika Chaudhuri and Ruslan Salakhutdinov, editors, Proceedings of the 36th International Conference on Machine Learning, volume 97 of Proceedings of Machine Learning Research, pages 2376–2384. PMLR, 09–15 Jun 2019. URL https://proceedings.mlr.press/v97/goyal19a.html.
- [He et al.(2016)He, Zhang, Ren, and Sun] Kaiming He, Xiangyu Zhang, Shaoqing Ren, and Jian Sun. Deep residual learning for image recognition. In 2016 IEEE Conference on Computer Vision and Pattern Recognition (CVPR), pages 770–778, 2016. 10.1109/CVPR.2016.90.
- [Hendricks et al.(2018)Hendricks, Burns, Saenko, Darrell, and Rohrbach] Lisa Anne Hendricks, Kaylee Burns, Kate Saenko, Trevor Darrell, and Anna Rohrbach. Women also snowboard: Overcoming bias in captioning models. In Vittorio Ferrari, Martial Hebert, Cristian Sminchisescu, and Yair Weiss, editors, Computer Vision - ECCV 2018 - 15th European Conference, Munich, Germany, September 8-14, 2018, Proceedings, Part III, volume 11207 of Lecture Notes in Computer Science, pages 793–811. Springer, 2018. 10.1007/978-3-030-01219-9_47. URL https://doi.org/10.1007/978-3-030-01219-9_47.
- [Huang et al.(2017)Huang, Liu, van der Maaten, and Weinberger] Gao Huang, Zhuang Liu, Laurens van der Maaten, and Kilian Q. Weinberger. Densely connected convolutional networks. In Proceedings of the IEEE Conference on Computer Vision and Pattern Recognition (CVPR), July 2017.
- [Huang et al.(2019)Huang, Liu, Pleiss, van der Maaten, and Weinberger] Gao Huang, Zhuang Liu, Geoff Pleiss, Laurens van der Maaten, and Kilian Weinberger. Convolutional networks with dense connectivity. IEEE Transactions on Pattern Analysis and Machine Intelligence, PP:1–1, 05 2019. 10.1109/TPAMI.2019.2918284.
- [Hutchinson et al.(2019)Hutchinson, Denton, Mitchell, and Gebru] Ben Hutchinson, Emily Denton, Margaret Mitchell, and Timnit Gebru. Detecting Bias with Generative Counterfactual Face Attribute Augmentation. Workshop on Fairness Accountability Transparency and Ethics in Computer Vision, CVPR, 2019. URL http://arxiv.org/abs/1906.06439.
- [Joo and Kärkkäinen(2020)] Jungseock Joo and Kimmo Kärkkäinen. Gender slopes: Counterfactual fairness for computer vision models by attribute manipulation. Proceedings of the 2nd International Workshop on Fairness, Accountability, Transparency and Ethics in Multimedia, 2020.
- [Khosla et al.(2012)Khosla, Zhou, Malisiewicz, Efros, and Torralba] Aditya Khosla, Tinghui Zhou, Tomasz Malisiewicz, Alexei A. Efros, and Antonio Torralba. Undoing the damage of dataset bias. In Andrew Fitzgibbon, Svetlana Lazebnik, Pietro Perona, Yoichi Sato, and Cordelia Schmid, editors, Computer Vision – ECCV 2012, pages 158–171, Berlin, Heidelberg, 2012. Springer Berlin Heidelberg. ISBN 978-3-642-33718-5.
- [Kilbertus et al.(2017)Kilbertus, Rojas-Carulla, Parascandolo, Hardt, Janzing, and Schölkopf] Niki Kilbertus, Mateo Rojas-Carulla, Giambattista Parascandolo, Moritz Hardt, Dominik Janzing, and Bernhard Schölkopf. Avoiding discrimination through causal reasoning. In Proceedings of the 31st International Conference on Neural Information Processing Systems, NIPS’17, page 656–666, Red Hook, NY, USA, 2017. Curran Associates Inc. ISBN 9781510860964.
- [Klare et al.(2012)Klare, Burge, Klontz, Vorder Bruegge, and Jain] Brendan F. Klare, Mark J. Burge, Joshua C. Klontz, Richard W. Vorder Bruegge, and Anil K. Jain. Face recognition performance: Role of demographic information. IEEE Transactions on Information Forensics and Security, 7(6):1789–1801, 2012. 10.1109/TIFS.2012.2214212.
- [KrishnapriyaK. et al.(2019)KrishnapriyaK., Vangara, King, Albiero, and Bowyer] S. KrishnapriyaK., K. Vangara, Michael C. King, Vítor Albiero, and K. Bowyer. Characterizing the variability in face recognition accuracy relative to race. 2019 IEEE/CVF Conference on Computer Vision and Pattern Recognition Workshops (CVPRW), pages 2278–2285, 2019.
- [Lin et al.(2014)Lin, Maire, Belongie, Hays, Perona, Ramanan, Dollár, and Zitnick] Tsung-Yi Lin, Michael Maire, Serge Belongie, James Hays, Pietro Perona, Deva Ramanan, Piotr Dollár, and C. Lawrence Zitnick. Microsoft coco: Common objects in context. In David Fleet, Tomas Pajdla, Bernt Schiele, and Tinne Tuytelaars, editors, Computer Vision – ECCV 2014, pages 740–755, Cham, 2014. Springer International Publishing. ISBN 978-3-319-10602-1.
- [Liu et al.(2015)Liu, Luo, Wang, and Tang] Ziwei Liu, Ping Luo, Xiaogang Wang, and Xiaoou Tang. Deep learning face attributes in the wild. In Proceedings of International Conference on Computer Vision (ICCV), December 2015.
- [Paszke et al.(2019)Paszke, Gross, Massa, Lerer, Bradbury, Chanan, Killeen, Lin, Gimelshein, Antiga, Desmaison, Kopf, Yang, DeVito, Raison, Tejani, Chilamkurthy, Steiner, Fang, Bai, and Chintala] Adam Paszke, Sam Gross, Francisco Massa, Adam Lerer, James Bradbury, Gregory Chanan, Trevor Killeen, Zeming Lin, Natalia Gimelshein, Luca Antiga, Alban Desmaison, Andreas Kopf, Edward Yang, Zachary DeVito, Martin Raison, Alykhan Tejani, Sasank Chilamkurthy, Benoit Steiner, Lu Fang, Junjie Bai, and Soumith Chintala. Pytorch: An imperative style, high-performance deep learning library. In H. Wallach, H. Larochelle, A. Beygelzimer, F. d'Alché-Buc, E. Fox, and R. Garnett, editors, Advances in Neural Information Processing Systems, volume 32. Curran Associates, Inc., 2019. URL https://proceedings.neurips.cc/paper/2019/file/bdbca288fee7f92f2bfa9f7012727740-Paper.pdf.
- [Peebles et al.(2020)Peebles, Peebles, Zhu, Efros, and Torralba] William Peebles, John Peebles, Jun-Yan Zhu, Alexei A. Efros, and Antonio Torralba. The hessian penalty: A weak prior for unsupervised disentanglement. In Proceedings of European Conference on Computer Vision (ECCV), 2020.
- [Pleiss et al.(2017)Pleiss, Raghavan, Wu, Kleinberg, and Weinberger] Geoff Pleiss, Manish Raghavan, Felix Wu, Jon Kleinberg, and Kilian Q Weinberger. On fairness and calibration. In I. Guyon, U. V. Luxburg, S. Bengio, H. Wallach, R. Fergus, S. Vishwanathan, and R. Garnett, editors, Advances in Neural Information Processing Systems, volume 30. Curran Associates, Inc., 2017. URL https://proceedings.neurips.cc/paper/2017/file/b8b9c74ac526fffbeb2d39ab038d1cd7-Paper.pdf.
- [Ponce et al.(2006)Ponce, Berg, Everingham, Forsyth, Hebert, Lazebnik, Marszalek, Schmid, Russell, Torralba, Williams, Zhang, and Zisserman] Jean Ponce, Tamara Berg, Mark Everingham, David Forsyth, Martial Hebert, Svetlana Lazebnik, Marcin Marszalek, Cordelia Schmid, Bryan Russell, Antonio Torralba, Chris Williams, Jianguo Zhang, and Andrew Zisserman. Dataset issues in object recognition. In Jean Ponce, Martial Hebert, Cordelia Schmid, and Andrew Zisserman, editors, Towards Category-Level Object Recognition, volume 4170 of Lecture Notes in Computer Science (LNCS), pages 29–48. Springer, 2006. URL https://hal.inria.fr/inria-00548595.
- [Rosenfeld et al.(2018)Rosenfeld, Zemel, and Tsotsos] Amir Rosenfeld, Richard S. Zemel, and John K. Tsotsos. The elephant in the room. CoRR, abs/1808.03305, 2018. URL http://arxiv.org/abs/1808.03305.
- [Rousseeuw(1987)] Peter J. Rousseeuw. Silhouettes: A graphical aid to the interpretation and validation of cluster analysis. Journal of Computational and Applied Mathematics, 20:53–65, 1987. ISSN 0377-0427. https://doi.org/10.1016/0377-0427(87)90125-7.
- [Russakovsky et al.(2015)Russakovsky, Deng, Su, Krause, Satheesh, Ma, Huang, Karpathy, Khosla, Bernstein, Berg, and Fei-Fei] Olga Russakovsky, Jia Deng, Hao Su, Jonathan Krause, Sanjeev Satheesh, Sean Ma, Zhiheng Huang, Andrej Karpathy, Aditya Khosla, Michael Bernstein, Alexander C. Berg, and Li Fei-Fei. ImageNet Large Scale Visual Recognition Challenge. International Journal of Computer Vision (IJCV), 115(3):211–252, 2015. 10.1007/s11263-015-0816-y.
- [Selvaraju et al.(2017)Selvaraju, Cogswell, Das, Vedantam, Parikh, and Batra] Ramprasaath R. Selvaraju, Michael Cogswell, Abhishek Das, Ramakrishna Vedantam, Devi Parikh, and Dhruv Batra. Grad-cam: Visual explanations from deep networks via gradient-based localization. In Proceedings of the IEEE International Conference on Computer Vision (ICCV), Oct 2017.
- [Shankar et al.(2017)Shankar, Halpern, Breck, Atwood, Wilson, and Sculley] S. Shankar, Yoni Halpern, Eric Breck, J. Atwood, Jimbo Wilson, and D. Sculley. No classification without representation: Assessing geodiversity issues in open data sets for the developing world. arXiv: Machine Learning, 2017.
- [Singh et al.(2020)Singh, Mahajan, Grauman, Lee, Feiszli, and Ghadiyaram] Krishna Kumar Singh, Dhruv Mahajan, Kristen Grauman, Yong Jae Lee, Matt Feiszli, and Deepti Ghadiyaram. Don’t judge an object by its context: Learning to overcome contextual bias. In Proceedings of the IEEE/CVF Conference on Computer Vision and Pattern Recognition (CVPR), June 2020.
- [Tan et al.(2018)Tan, Sun, Kong, Zhang, Yang, and Liu] Chuanqi Tan, Fuchun Sun, Tao Kong, Wenchang Zhang, Chao Yang, and Chunfang Liu. A survey on deep transfer learning. In Věra Kůrková, Yannis Manolopoulos, Barbara Hammer, Lazaros Iliadis, and Ilias Maglogiannis, editors, Artificial Neural Networks and Machine Learning – ICANN 2018, pages 270–279, Cham, 2018. Springer International Publishing. ISBN 978-3-030-01424-7.
- [Torralba and Efros(2011)] A. Torralba and A. A. Efros. Unbiased look at dataset bias. In Proceedings of the 2011 IEEE Conference on Computer Vision and Pattern Recognition, CVPR ’11, page 1521–1528, USA, 2011. IEEE Computer Society. ISBN 9781457703942. 10.1109/CVPR.2011.5995347. URL https://doi.org/10.1109/CVPR.2011.5995347.
- [Wang et al.(2020a)Wang, Narayanan, and Russakovsky] Angelina Wang, Arvind Narayanan, and Olga Russakovsky. Revise: A tool for measuring and mitigating bias in visual datasets. In Andrea Vedaldi, Horst Bischof, Thomas Brox, and Jan-Michael Frahm, editors, Computer Vision – ECCV 2020, pages 733–751, Cham, 2020a. Springer International Publishing. ISBN 978-3-030-58580-8.
- [Wang et al.(2019)Wang, Kembhavi, Farhadi, Yuille, and Rastegari] Huiyu Wang, Aniruddha Kembhavi, Ali Farhadi, Alan L. Yuille, and Mohammad Rastegari. Elastic: Improving cnns with dynamic scaling policies. In Proceedings of the IEEE/CVF Conference on Computer Vision and Pattern Recognition (CVPR), June 2019.
- [Wang et al.(2020b)Wang, Qinami, Karakozis, Genova, Nair, Hata, and Russakovsky] Zeyu Wang, Klint Qinami, Yannis Karakozis, Kyle Genova, P. Nair, K. Hata, and Olga Russakovsky. Towards fairness in visual recognition: Effective strategies for bias mitigation. 2020 IEEE/CVF Conference on Computer Vision and Pattern Recognition (CVPR), pages 8916–8925, 2020b.
- [Ward(1963)] Joe H. Ward. Hierarchical grouping to optimize an objective function. Journal of the American Statistical Association, 58(301):236–244, 1963. URL http://www.jstor.org/stable/2282967.
- [Wilson et al.(2019)Wilson, Hoffman, and Morgenstern] Benjamin Wilson, Judy Hoffman, and Jamie Morgenstern. Predictive inequity in object detection. Workshop on Fairness Accountability Transparency and Ethics in Computer Vision, CVPR, 2019. URL http://arxiv.org/abs/1902.11097.
- [Zhang et al.(2018)Zhang, Lemoine, and Mitchell] Brian Hu Zhang, Blake Lemoine, and Margaret Mitchell. Mitigating unwanted biases with adversarial learning. In Proceedings of the 2018 AAAI/ACM Conference on AI, Ethics, and Society, AIES ’18, page 335–340, New York, NY, USA, 2018. Association for Computing Machinery. ISBN 9781450360128. 10.1145/3278721.3278779. URL https://doi.org/10.1145/3278721.3278779.
- [Zhao et al.(2017)Zhao, Wang, Yatskar, Ordonez, and Chang] Jieyu Zhao, Tianlu Wang, Mark Yatskar, Vicente Ordonez, and Kai-Wei Chang. Men also like shopping: Reducing gender bias amplification using corpus-level constraints. In EMNLP, 2017.
Appendix A Appendix
In this section, we showcase the results of our method and present several failure modes discovered by UDIS. We use our method to discover potential biases under different settings described in Section 4.1.
A.1 Results on CelebA - Biased Black Hair Setting

A.2 Results on CelebA
A.3 Results on COCO
A.3.1 Predicted category : cup
A.3.2 Predicted category : bed
A.3.3 Predicted category : person
