Optimizing the third generation of gravitational-wave observatories for Galactic astrophysics
Abstract
Gravitational-wave (GW) astrophysics is a rapidly expanding field, with plans to enhance the global ground-based observatory network through the addition of larger, more sensitive observatories: the Einstein Telescope and Cosmic Explorer. These observatories will allow us to peer deeper into the sky, collecting GW events from farther away and earlier in the universe. Within our own Galaxy, there is a plethora of interesting GW sources, including core-collapse supernovae, phenomena in isolated neutron stars and pulsars, and potentially novel sources. As GW observatories are directionally sensitive, their placement on the globe will affect the observation of Galactic sources. We analyze the performance of one-, two-, and three-observatory networks, both for sources at the Galactic center, as well as for a source population distributed over the Galactic disk. We find that, for a single Cosmic Explorer or Einstein Telescope observatory, placement at near-equatorial latitudes provides the most reliable observation of the Galactic center. When a source population distributed over the Galactic disk is considered, the observatory location is less impactful, although equatorial observatories still confer an advantage over observatories at more extreme latitudes. For two- and three-node networks, the longitudes of the observatories additionally become important for consistent observation of the Galaxy.
1 Motivation
The era of gravitational-wave (GW) astronomy has well and truly begun, with more than 67 compact object binaries observed since Advanced LIGO (Laser Interferometric Gravitational-Wave Observatory) saw “first light” in September 2015 (Abbott et al., 2019, 2021a). While the coalescence of compact objects has long been the most promising source for ground-based GW observatories due to their (comparatively high) expected rates, there exists a plethora of prospective sources in the tens-of-hertz to kilohertz regime right in our very own cosmic backyard – the Milky Way galaxy. These diverse sources range from core-collapse supernovae (see, e.g., Gossan et al. (2016); Abdikamalov et al. (2020); Abbott et al. (2020a), and references therein), accreting neutron stars in binaries (Holgado et al., 2018), fallback accretion onto neutron stars to form black holes (Piro & Thrane, 2012; Melatos & Priymak, 2014), spin-down of isolated neutron stars (Andersson et al., 2011; Alford & Schwenzer, 2014), Thorne–Żytkow Objects (TŻOs; DeMarchi et al. (2021)), accretion-induced collapse of white dwarfs (Abdikamalov et al., 2010), pulsar glitches (van Eysden & Melatos, 2008), and magnetar flares (Andersson et al., 2011). These sources are complementary to the thousands of Galactic detached and accreting white dwarf binaries, and neutron star and black hole binaries observable in the millihertz regime by the space-based LISA mission (see, e.g., Korol et al. (2021a, b) and references therein). In the first three science runs of the LIGO, Virgo, and KAGRA observatories, there have been a number of targeted searches for GWs from the Galactic Center (see, e.g., Aasi et al. (2013); Piccinni et al. (2020)) as well as for continuous waves from young supernova remnants (e.g. Millhouse et al. (2020); Abbott et al. (2021b)), accreting millisecond pulsars (Abbott et al., 2021c, 2020b), known pulsars (e.g. Abbott et al. (2017)), and X-ray binaries (e.g., Zhang et al. (2021)), to name but a few.
To date, no GW emission from a Galactic source has been detected, namely because of their comparatively weaker emission to that from inspiralling and merging compact binaries. However, the significant increase of sensitivity in the next generation of laser-interferometeric detectors offers an unprecedented opportunity to discover, observe, and measure GW emission from the entire zoo of Galactic GW sources. This paper focuses whether the prospects for detecting Galactic source populations can be improved through the combination of different placements and orientations of the proposed ground-based third-generation GW observatories.
Previous studies (see, e.g., Nissanke et al. (2011); Raffai et al. (2013); Hu et al. (2015); Szölgyén et al. (2017); Mills et al. (2018); Zhao & Wen (2018); Hall & Evans (2019); Ackley et al. (2020); Borhanian (2021)) have considered how the placement and orientation of future generations of ground-based GW observatory networks might be optimized with respect to a number of figures of merit. Explicitly, these were: (1) the network’s ability to reconstruct the source polarization, (2) the extent to which the network can localize the sky position of the source, and (3) the accuracy and precision with which the network can reconstruct the parameters for a standard compact binary source. Of the Galactic GW sources detectable by ground-based GW observatories mentioned above, the majority are expected to be accompanied by electromagnetic and/or neutrino counterparts (see, e.g., Andersson et al. (2011); Piro & Thrane (2012); Piro (2013); Piro & Kulkarni (2013); Piro & Thompson (2014); Haskell (2015); Haskell & Melatos (2015); Warren et al. (2020); DeMarchi et al. (2021); Abbott et al. (2021c)), from which one can localize and have temporal information about the event if the source is transient in nature. For such sources, sky localization from GWs alone is not critical, and we can perform a targeted GW search for such sources with increased sensitivity.
In this study, we work to establish the optimum placement and orientation of the network of current and third-generation ground-based GW observatories in the context of observing Galactic sources. We do so by introducing the network antenna power, a figure of merit useful for establishing the detectability of Galactic GW source populations, many of which are unmodeled. We consider different combinations of one-, two-, and three-observatory networks with different possible orientations and locations across the globe. The major ground-based third-generation GW observatory effort in Europe is the Einstein Telescope (Punturo et al., 2010; Maggiore et al., 2020; Einstein Telescope, 2020), while in the United States it is the Cosmic Explorer (Evans et al., 2021). Many science goals involving GWs are best realized if these observatories are operated simultaneously as part of a global network, which would be enhanced by the addition of a third-generation observatory in Australia (Bailes et al., 2019) or potentially elsewhere in the Southern Hemisphere. We note that most of the power from Galactic sources is at very low frequencies (below ) and beyond the reach of current generation ground-based observatories, and hence the placement of new third-generation GW observatories is critical.
The rest of this paper is organized as follows. In Section 2.1, we outline the observatory networks considered, and introduce the figures of merit used in this study. In Section 3, we present results on the performance of a single observatory for Galactic sources, before investigating the same for two- and three-observatory networks in Section 4. We then discuss the implications of these results as well as the limitations of our methods in Section 5, before presenting our conclusions in Section 6.
2 Basic idea
2.1 Observatory Antenna Patterns
Today’s large-scale GW observatories use laser-interferometric detectors to sense passing gravitational waves (Adhikari, 2014). Interferometric detectors are not uniformly sensitive across the celestial sky. The antenna power receivable by a particular detector (given GW emission from a source located in particular region of the sky) is dependent on its location, orientation, and detector geometry.
The placement of detector may be characterized relative to the Earth-fixed frame using four angles: latitude and longitude of the detector’s vertex, opening angle between the detector’s two arms, and orientation angle , measured counterclockwise from due East to the bisector of the detector’s two arms. Similarly, the wave frame (for a given source) can be defined relative to the same Earth-fixed frame with three angles at any given time : the right ascension , the declination , and the polarization angle .
Following Jaranowski et al. (1998), Arnaud et al. (2002), Schutz (2011), and references therein, we compute the antenna sensitivities at any time using
| (1) |
where
| (2) |
and
| (3) |
Here, is the local hour angle, and denotes the dependence of these expressions on the particulars of the detector.
Averaging then over the polarization angle, one may obtain a ‘source-independent’ measure of the antenna sensitivity (Arnaud et al., 2002):
| (4) |
For an observatory such as Cosmic Explorer which comprises a single L-shaped detector, its antenna pattern is given directly by Equation 4 with . For a -shaped observatory such as the Einstein Telescope, comprising three detectors each with and with orientations satisfying , the combined antenna pattern for all detectors is
| (5) |
where indices denote detector number.
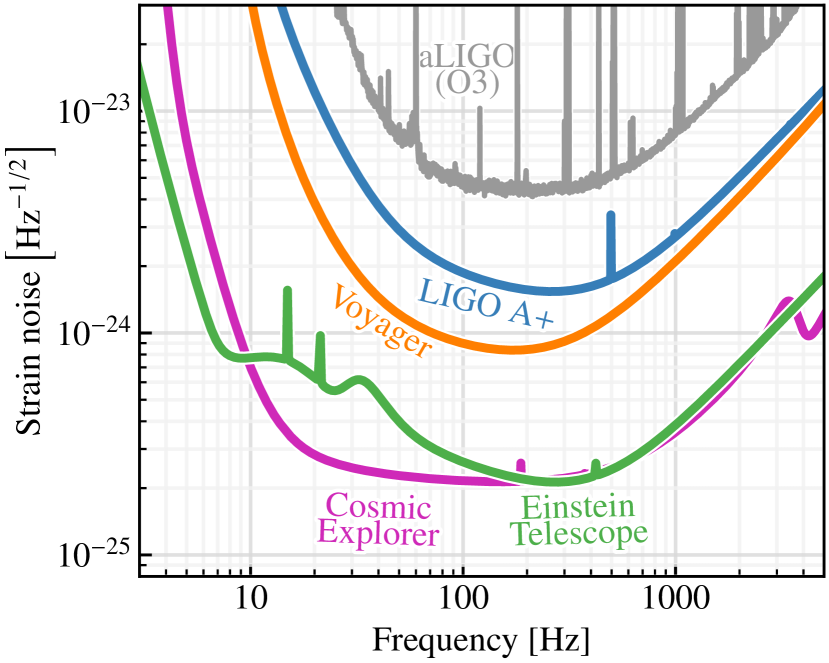
For both L-shaped and -shaped observatories, maxima in the antenna patterns exist at zenith and nadir in the facility’s local coordinate system.111This is true so long as the the travel time of the light along the detector arms is negligible compared to the period of the gravitational wave (Essick et al., 2017). For and , these maxima are and respectively. It is important to note that the sensitivity of a given observatory is set not only by the antenna pattern, but also but the detector arm length and the power spectral density of the displacement noise in each detector. Taking all these factors into account, Cosmic Explorer and Einstein Telescope (summing over all three detectors) have nearly the same sensitivity to GW signals in the frequency range (see Figure 1).
As a consequence, we may directly compare the antenna sensitivities here for both L-shaped and -shaped observatories in the following, defining the normalized antenna power:
| (6) |
The total GW signal power collected at time by a given observatory for a particular source is proportional to this normalized antenna power.
| Facility | Code | (deg) | (deg) | (deg) | (deg) |
|---|---|---|---|---|---|
| LIGO Hanford | H | 46.455 | 119.408 | 170.999 | 90 |
| LIGO Livingston | L | 30.563 | 90.774 | 242.716 | 90 |
| Virgo | V | 43.631 | 10.504 | 115.567 | 90 |
| KAGRA | K | 36.412 | 137.306 | 15.396 | 90 |
| LIGO India | I | 19.613 | 77.031 | 287.384 | 90 |
| *Einstein Telescope, Meuse–Rhine | EM | 50.756 | 5.907 | 0.000 | 60 |
| *Einstein Telescope, Sardinia | ES | 40.443 | 9.457 | 0.000 | 60 |
| *Einstein Telescope, Southwestern Australia | EA | 34.000 | 145.000 | 90.000 | 60 |
| *Einstein Telescope, Northeastern Brazil | EB | 11.000 | 43.000 | 5.000 | 60 |
| *Cosmic Explorer, Northwestern USA | CN | 43.827 | 112.825 | 45.000 | 90 |
| *Cosmic Explorer, Southwestern USA | CS | 33.160 | 106.480 | 195.000 | 90 |
| *Cosmic Explorer, Southeastern Australia | CA | 34.000 | 145.000 | 90.000 | 90 |
| *Cosmic Explorer, Northeastern Brazil | CB | 11.000 | 43.000 | 5.000 | 90 |
The above can be generalized to compute the normalized antenna power for a network of detectors as follows
| (7) |
where is the normalized antenna power for an individual detector, as defined in Equation 6. In general, each term in the sum in Equation 7 should be preceded by a weighting factor that describes each detector’s sensitivity to the signal of interest. In our case, we fix all these weighting factors at unity because Einstein Telescope and Cosmic Explorer have nearly equal peak sensitivities from a few hundred hertz to a few kilohertz, which is the frequency range of interest for many Galactic science targets. In the case when one detector is significantly more sensitive than the others in a network, the overall network antenna pattern will be dominated by the single, most sensitive detector.
Given the importance of Galactic sources to the science case for the third generation of ground-based GW observatories, our goal is to establish how the placement and orientation of future observatories impacts the sensitivity of the global observatory network to the Milky Way. In pursuit of this goal, we seek here to develop figures of merit that can be used to characterize the directional network sensitivity to Galactic sources for both transient and continuous GW emission.
Concerning the expected Galactic source populations, we note that the prospective sources all concern either massive stars or (relatively nascent) compact objects following their explosions. As such, we expect their distribution across the Galaxy to closely trace that of the stellar density profile. Following Adams et al. (2013), we employ the profile
| (8) |
where is the radial distance (within the Galactic plane) from the Galactic center, is the height above or below the Galactic plane, and and are the characteristic scales of the distribution. In this model, the Sun is located at .
From Equation 8, we see that the Galactic source population is expected to be most dense at the Galactic center, falling off as one moves from the Galactic plane (), and beyond the central bar. With this in mind, we consider scenarios concerning two different source populations:
-
1.
One concentrated at the Galactic center, and
-
2.
One distributed across the Galaxy according to Equation 8.
For the first case, we compute the normalized antenna power at the Galactic center , considering this quantity as both (1) a function of sidereal time over the day, and (2) a cumulative quantity as a fraction of the total observing time.
In the second scenario, we numerically integrate the density profile in Equation 8 along the line of sight to arrive at a weighting function that indicates the (relative) number of Galactic sources at that particular sky location. From this, we can compute the cumulative density function of the Galactic observations, which can be written formally as
| (9) |
where is the region of the sky at time for which the antenna power falls below a threshold value . Given we can read off the (time-varying) median and other quantiles of the network’s antenna power pattern for Galactic sources. Note that we can alternatively compute the cumulative density function over all observation times,
| (10) |
with , from which we can read off static quantiles characterizing the network’s overall daily performance.
Given these figures of merit, we now outline how best to connect measures of their temporal behavior with the detectability of either transient or long-duration GW sources.
We consider first science targets that rely on the observation of a rare, short-duration burst like a core-collapse supernova. As such an event cannot be scheduled,222if only! it may well occur at a time when only one observatory in the global network is online. It is, therefore, important to characterize the observatory antenna patterns individually as a function of time, to establish how one’s ability to observe such events varies over the sidereal day. In the context of multiple observatories, a network yielding consistent antenna power is preferred over one with highly variable sensitivity for transient sources. A network that is very sensitive for, say, of the sidereal day, but rather insensitive for the remainder of the observation time, is not optimal for transient observation if the source occurs when the network is least sensitive.
Contrastingly, for a continuous-wave source (such as, for example, a deformed pulsar), signal power can be accrued over a long period of time. As such, it is most instructive for these sources to study the statistical properties of the antenna power over one sidereal day. For this purpose, we look to the mean sensitivity of the network to establish its utility for science targets dependent on long-duration observations of sources with continuous GW emission.
2.2 Third-generation GW observatory networks
With the above considerations in mind, we can compute the antenna power for a variety of L-shaped and -shaped observatories to better understand the impact of observatory placement and detector geometry on detectability of Galactic sources. Although we can (and do) consider observatory locations chosen randomly on the globe, we will pay particular attention to a small selection of sites, some corresponding to proposed observatory locations, and others chosen for illustrative purposes only. In particular, the Einstein Telescope will possibly be located either on Sardinia or in the Meuse–Rhine Euroregion (Amann et al., 2020), and so we consider sites that are close to these locations. The location of Cosmic Explorer is less certain, but is likely to be somewhere in the Western United States; we therefore choose two illustrative sites, one in the Northwest and another in the Southwest, which have been used in previous third-generation studies (see, e.g., Borhanian (2021)). We also consider two illustrative observatory sites located outside Europe and North America: one in Southeastern Australia, and another in Northeastern Brazil.
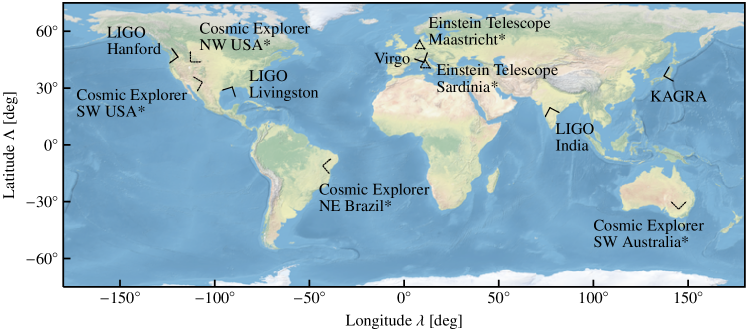
In Figure 2, we show the placement of the observatory sites that we have considered, along with the sites of current observatories. For each featured site, the specific parameter set characterizing the detector geometry (latitude , longitude , opening angle , and arm bisector angle , as previously introduced) is listed in Section 2.1. In the following sections we will consider these observatory sites, in addition to 30,000 sites placed randomly across the globe, in one-, two-, and three-node network configurations. The reason to consider networks of varying size is that third-generation observatories may not begin operating at the same time. Additionally, observatories may go offline for maintenance or upgrades, or because of environmental disturbances; experience from the third observing run of the second-generation GW observatory network shows that, given three observatories participating in the run, all three are simultaneously online just under half the time (Davis et al., 2021).
3 Single Observatory Placement
We now consider how various third-generation GW observatories in isolation observe the Galaxy (i.e., a one-observatory network). We consider sources at the Galactic center in Section 3.1, and a source population distributed across the Milky Way in Section 3.2.
3.1 Galactic center sources
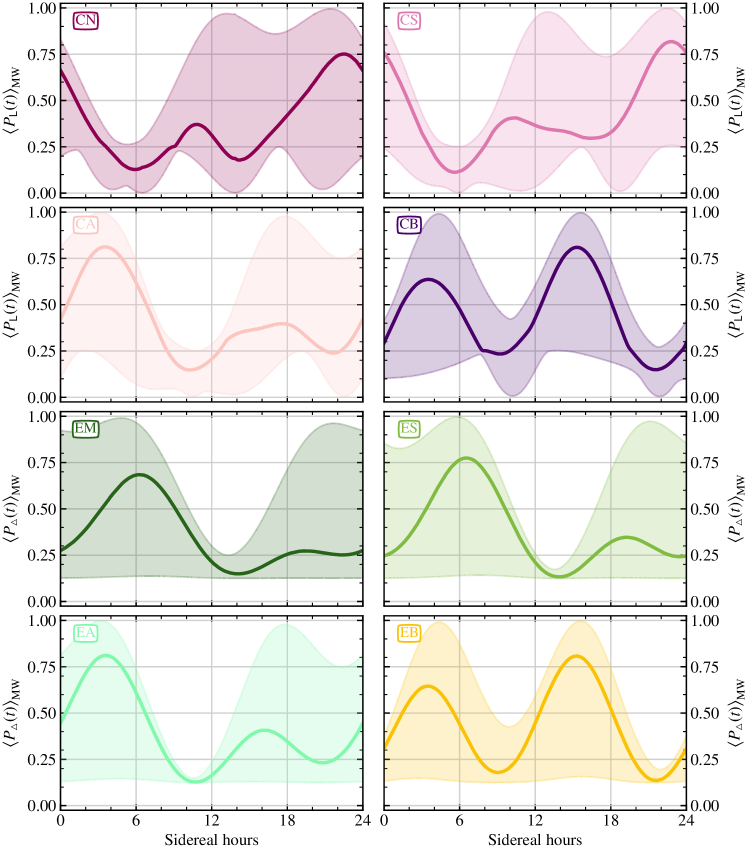
In Figure 3, we show the normalized polarization-averaged antenna power for sources at the Galactic center as a function of both sidereal hours and cumulative fraction of daily observing time, for (1) the current global network of GW observatories, (2) four potential locations for Cosmic Explorer, and (3) four potential locations for the Einstein Telescope.
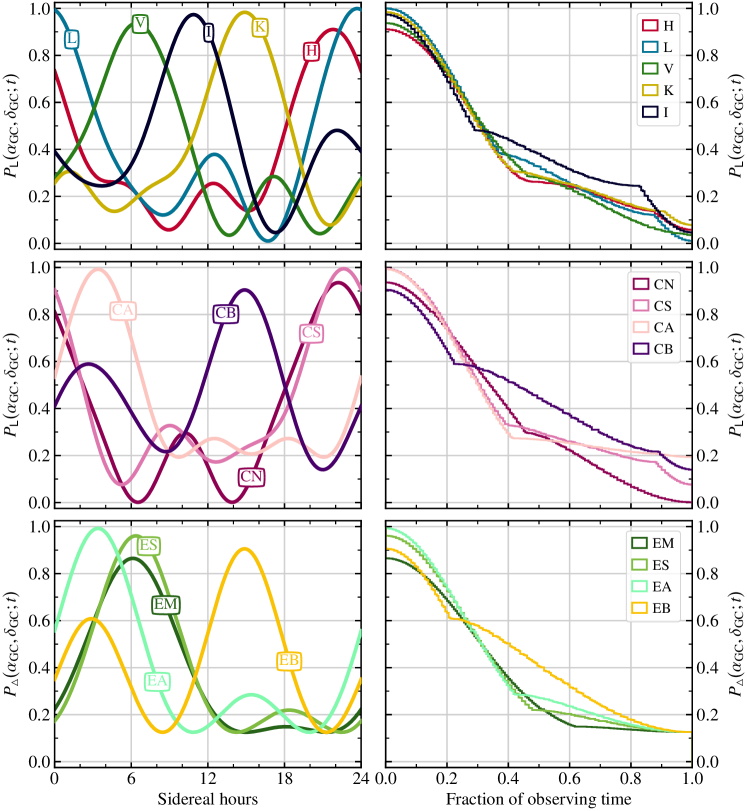
For a single L-shaped Cosmic Explorer type observatory, we find that both the Southeastern Australia (CA) and Southwestern US (CS) locations reach near optimal sensitivity for sources directed toward the Galactic center for around an hour per sidereal day. For proposed locations in Northwestern US (CN) and Northeastern Brazil (CB), the maximal antenna power is around 0.9. Looking instead however at the antenna power as a function of fractional observation time rather than sidereal hour, we see that the CB location yields a higher antenna power for longer, with for over half the observation time, in comparison with for over half the observation time for the proposed CA, CN, and CS locations.
Comparatively, for a single -shaped Einstein Telescope type observatory, the Australian site (EA) reaches near optimal sensitivity similar to the CA site. We note there is far less variation between the two proposed sites in Meuse–Rhine (EM) and Sardinia (ES) than for the four sites considered for Cosmic Explorer type observatories, in both maximal achieved antenna power and temporal coincidence of these peaks. This, in truth, is to be expected given the geographical proximity of the EM and ES sites. While it can be seen that the maximal antenna power achievable is slightly larger at the ES site than at the EM site (roughly a 10% effect), we note that this improvement is only seen for around of the total observation time. For the remaining of the sidereal day, the antenna powers yielded at each site are comparable. As in the L-shaped case, the Brazilian site yields a higher antenna power for a larger fraction of the day in comparison to the other sites.
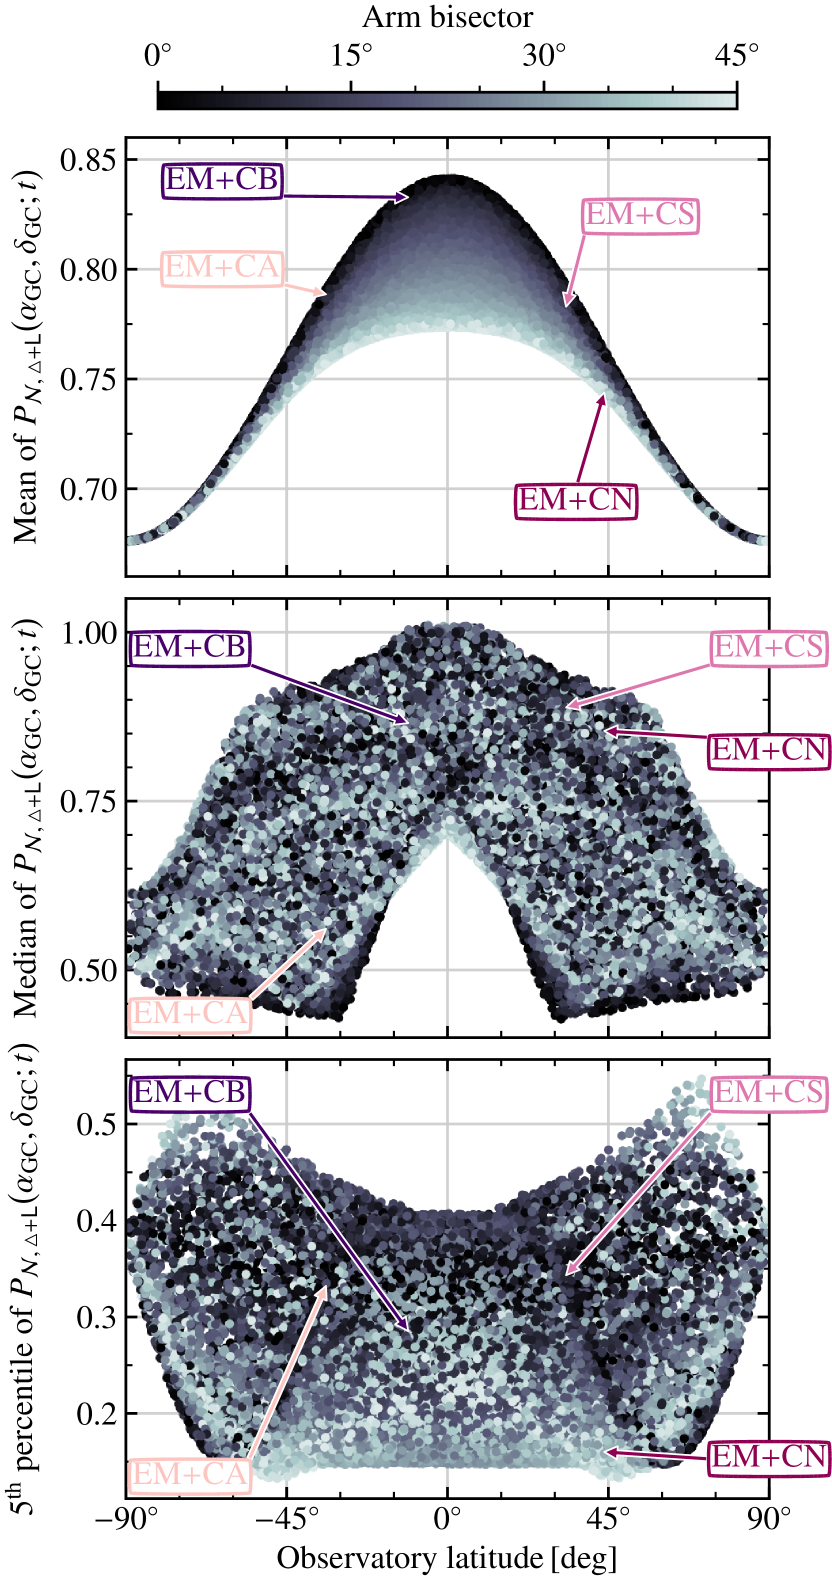
For the purpose of improving detection prospects for long-duration and/or continuous GW sources, it is useful to look at the statistical properties of the daily antenna power for both the observatory sites in Section 2.1 and for hypothetical sites placed randomly in latitude, longitude, and detector orientation. In Figure 4, we show the mean, median, and fifth percentile of the antenna power for 30,000 randomly placed observatories, both for L-shaped (Cosmic Explorer type) and -shaped (Einstein Telescope type) observatories.
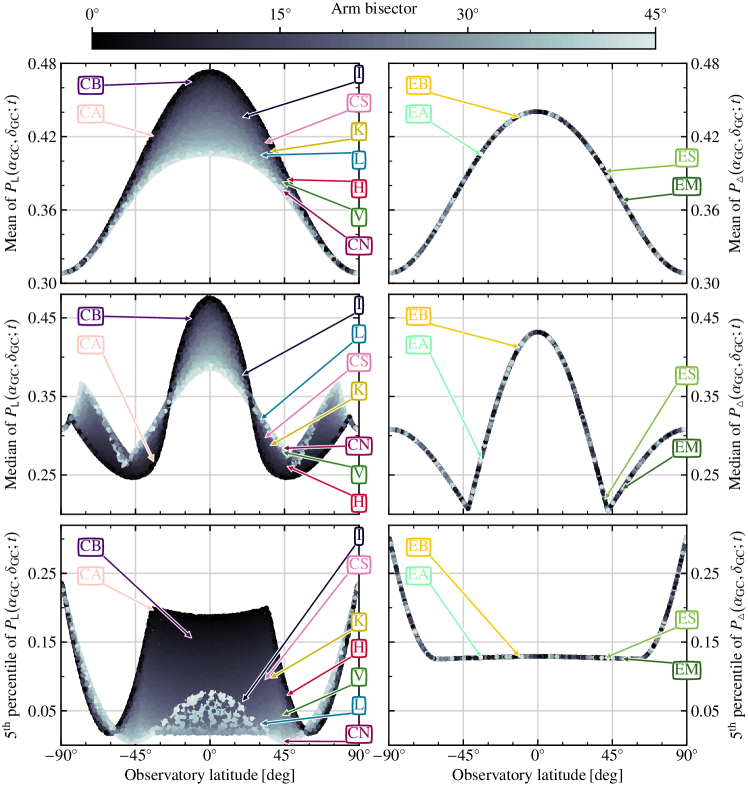
An immediate takeaway is that – for both types of observatory – the mean and median antenna powers over one sidereal day (to sources located at the Galactic center) are maximized with equatorial observatory placement.
For L-shaped detectors, we find the mean is augmented by between and for equatorial versus polar placement, with maximal improvements yielded with the arm bisector oriented along due East (versus configurations for which the detector arms lie along the compass directional axes, ).
For the median , maximal antenna power is once more found through equatorial observatory placement and orientation with detector arm bisector along due East, yielding a factor of two increase over a similar detector placed at latitudes .
Finally for the fifth percentile of , we find maximal values this time for observatories located either directly at the poles (irrespective of orientation), or latitudes satisfying (oriented with ). For the latter scenario, we note that detector orientation is very important: almost an order of magnitude variation is seen between and (due to the quadrupole nature of the antenna power pattern), which has a resounding impact on prospects for transient sources.
Of the Cosmic Explorer sites considered in Section 2.1, we note that the CN location is quite suboptimal for sources located around the Galactic center, particularly when compared to the alternatives. Overall, CB performs best across all antenna power metrics here, followed by CA (which exhibits a poor median, but a fair mean and near maximal fifth percentile), and CS (with a fair median, mean, and fifth percentile).
For -shaped observatories, we find similar trends across the mean and median antenna powers. For equatorial sites, the mean is increased by up to over their polar counterparts, with no impact from observatory orientation, since the overall antenna pattern of the triple detector configuration (Equation 5) is azimuthally symmetric in the observatory’s local basis. The median is maximized through equatorial placement, with up to a factor of two improvement yielded over other sites. As for L-shaped observatories , we find here that the median is minimized for sites at latitudes . For the fifth percentile of , antenna power is maximized for observatories placed directly at the poles (roughly a factor of two increase), while minimized at latitudes satisfying . While this may seem catastrophic in light of the previous optimization for equatorial observatories, we do note that the minimum fifth percentile for , which is comparatively better than for the majority of L-shaped observatories. This is a consequence of the fact that unlike the antenna pattern of a single detector, the antenna pattern of the triple detector configuration has no nulls, attaining a minimum of 1/8 the maximum power.
Of the Einstein Telescope sites considered in Section 2.1, we see that the Brazilian site EB outperforms the others in terms of mean, median, and fifth percentile. Between the two European sites, there is little difference in performance. While the mean antenna power for ES shows a roughly improvement over EM, EM in turn exhibits a median antenna power of around better than for ES, and they both have nearly identical fifth percentiles in antenna power.
3.2 Galactic plane average
While the density of GW sources is expected to be concentrated about the Galactic center, we do indeed expect the source population to be distributed across the Galaxy, following the stellar density. As this has an impact on our results from the previous section, we recompute the antenna power in the context of an astrophysically motivated distribution of Galactic sources.
In Figure 5, we show the normalized polarization-averaged antenna power over the sidereal day for the Cosmic Explorer and Einstein Telescope sites considered in Section 2.1, averaged over the anticipated population of Galactic GW sources as in Equation 9. Unsurprisingly, there is spread in the antenna power over the sidereal day, unlike for the Galactic center case in Figure 3. We note that the median behavior seen here does loosely trace the antenna power for a single source at the Galactic center. This is to be expected as, based on our imposed model for source density, most of the sources are concentrated in the central regions of the Galaxy. Keeping in mind, however, that the Galactic plane traverses most of the celestial sky over one sidereal day, it is natural that averaging antenna power over a distribution of Galactic sources would result in some spread – as observed.

In Figure 6, we show the normalized polarization-averaged antenna power for the same astrophysically motivated distribution of Galactic sources, again for the locations for Cosmic Explorer and the Einstein Telescope considered, but this time as a function of the fractional observing time as in Equation 10. Comparing these results to the Galactic center case (as seen in the middle right and bottom right panels of Figure 3), we see that any discontinuities in the cumulative behavior of the antenna power (caused, ostensibly, by the point nature of the single sky position considered) are – as expected – smoothed out as we average over the Galaxy. We note that any small differences between the two Einstein Telescope sites in Europe have all but vanished for the Galactic average scenario, suggesting that (should equatorial placement not be feasible for the Einstein Telescope) both the EM and ES sites would perform equivalently in the context of Galactic science, particularly when placed in a network with other observatories. A similar, but not identical, statement can be made about the Cosmic Explorer sites considered. We see that the antenna power (as a fraction of the observing time) is indistinguishable between the CN and CS sites, with only a minor improvement seen for the CA site. Finally, the CB site edges out the other three sites for the purpose of observing the Milky Way, though not by a great amount. This suggests that the marked gains in antenna power seen from equatorial observatory placement are muted somewhat when observing across the Galaxy rather than just the Galactic center.
4 Observatory Network Placement
While optimizing the placement of a single observatory is an important consideration, it is of interest to investigate how further gains to the Galactic science case can be achieved through optimal placement of a network, given one or more fixed observatory sites.
4.1 Two-observatory network
Although we showed in Section 3 that equatorial placement of both L-shaped and -shaped observatories maximizes the antenna power for sources at the Galactic center, realistically it is expected that the Einstein Telescope will be built near either the EM or ES locations (leaving open the possibility that additional observatories could be built at EA or EB at some later time). As we have seen that, in the context of a Galactic distribution of GW sources, there is negligible difference in performance between the two sites, we choose one at random to fix the -shaped observatory in our considered networks.
We consider herein the performance of a two-observatory network (EM+Cx), comprising (1) one -shaped observatory located in Meuse–Rhine, and (2) one arbitrarily placed L-shaped observatory, in the context of source populations concentrated in the Galactic center, and distributed across the Milky Way.
4.1.1 Galactic center
In Figure 7, we show the normalized, polarization-averaged antenna power for a two-observatory network (EM+Cx; comprising one -shaped observatory located in Meuse–Rhine, and one L-shaped observatory placed at one of the four Cosmic Explorer sites) observing the Galactic center as a function of both sidereal hours and cumulative fraction of daily observing time.
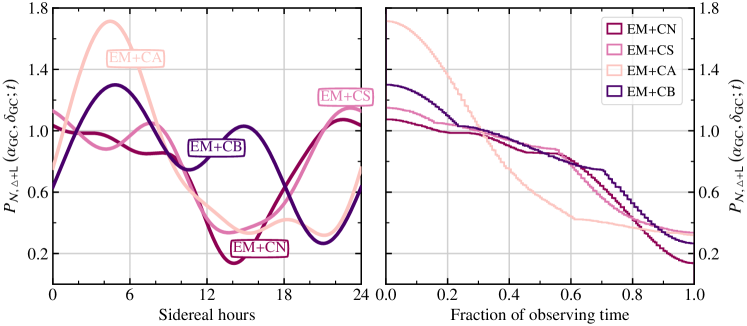
Looking at the antenna power as a function of sidereal time, we note (at first glance) that the network EM+CA (of the four Cosmic Explorer sites) is most sensitive to the Galactic center, while network EM+CN is the least sensitive. Taking into account, however, the cumulative behavior as a fraction of observing time, we see that such a simplistic statement is misleading. While network EM+CA does indeed have a peak antenna power greater than networks with L-shaped detectors at one of the other three Cosmic Explorer sites, the network is only more sensitive than the others for of the observing time. For more than half the observing time, network EM+CA is in fact significantly less sensitive than its counterparts. Comparatively, while network EM+CN is least sensitive for of the day, the antenna power yielded is comparable to that for network EM+CS for the remainder of the observation time. Of the four networks considered here, EM+CB does slightly better over the entire observational period, with slightly improved ( effect) antenna power for the best of the sidereal day, while maintaining a similar sensitivity to networks EM+CN and EM+CS for the remainder of the time.
To better understand the impact of observatory location and orientation on network performance, we show in Figure 8 the statistical behavior of the antenna power over one sidereal day for a two-observatory network EM+Cx, comprising one -shaped observatory in Meuse–Rhine, and one L-shaped observatory arbitrarily placed on the globe.
As for the single-observatory case, we see that the mean antenna power is maximized when the L-shaped observatory is located equatorially with arm bisector angle . We find that equatorial placement alone yields at minimum a improvement over polar placement, while an up to an additional increase in mean antenna power can be gained for equatorial observatories by orienting the L-shaped detector with the arm bisector along due East. Of the four Cosmic Explorer sites considered, we see that placing the second observatory at CB results in an almost maximal mean network antenna power. Comparatively, we note that both EM+CA and EM+CS show similar (and fair) mean antenna power, while network EM+CN site performs worst of all four networks considered, and quite poorly.
For the median and fifth percentile of the antenna power, the trends with observatory location and orientation are less straightforward, but broadly follow similar trends with latitude as seen for the one-observatory case. Again, the median antenna power is maximized with equatorial observatory placement, but there is no clear trend with arm bisector angle. We also see that the peak in median antenna power is spread out in latitude, with as little as a reduction seen for some observatories in latitudes .
Similarly for the fifth percentile of network antenna power, the top-hat shaped distribution seen for the single L-shaped observatory case in Figure 4 is smeared out across latitude and arm bisector angle. There is variation across observatories, with as much as a factor of five difference between the “worse-case” and “best-case” scenarios, but there is a far weaker correlation in this behavior seen with position and orientation.
While this may at first seem counterintuitive, reflection on the results for a single L-shaped observatory as a function of sidereal time yields some clarity. We saw previously that equatorial placement (and, less so, detector orientation with ) maximizes single-observatory antenna power. We see this reflected in the mean behavior of the network antenna power, but not for the median and fifth percentile. The reason for this is that the variation of the network antenna power over one sidereal day is dependent on not only on the peaks in antenna power for the single observatories, but on the relative sensitivities of the observatories at any given point in time. For example, a large mean network antenna power can arise both from a consistently sensitive network, and a network very sensitive at one part of the day but less so for the remainder of the observation time. As we have seen, the location and orientation of a single observatory impact not only the amplitude of the antenna power peaks and troughs, but also control the time of day at which they occur. Optimizing a two-observatory network for Galactic observations, therefore, requires intentional placement of the second observatory relative to the first in the network, to ensure their peaks in antenna sensitivity are complementary over the sidereal day, rather than overlapping in time.
4.1.2 Galactic plane average
Turning our attention once more to a population of sources distributed across the Galaxy, in Figure 9 we show the normalized polarization-averaged antenna power over the sidereal day for a two-observatory network (EM+Cx), comprising one -shaped observatory in Meuse–Rhine, and one L-shaped observatory placed at one of the four Cosmic Explorer sites considered.
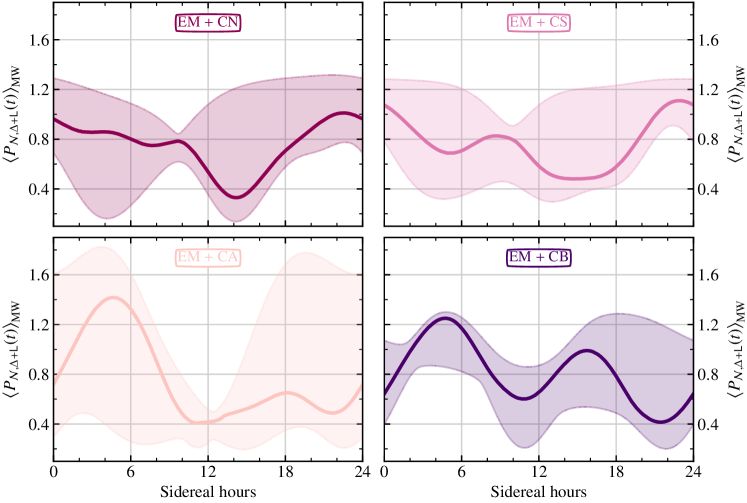
Similarly to the single-observatory scenario (see Figure 5), we note a spread in the network antenna power over the sidereal day, unlike for the Galactic center case in Figure 7. Once more, the median behavior loosely traces the results for the Galactic center. The largest variation occurs for the EM+CA network, particularly around times where the network antenna power peaks. Contrastingly, far less variation is seen for the EM+CN/CS/CB networks which, while experiencing smaller amplitude peaks in network antenna power, appear to exhibit a more consistent network sensitivity across the sidereal day.
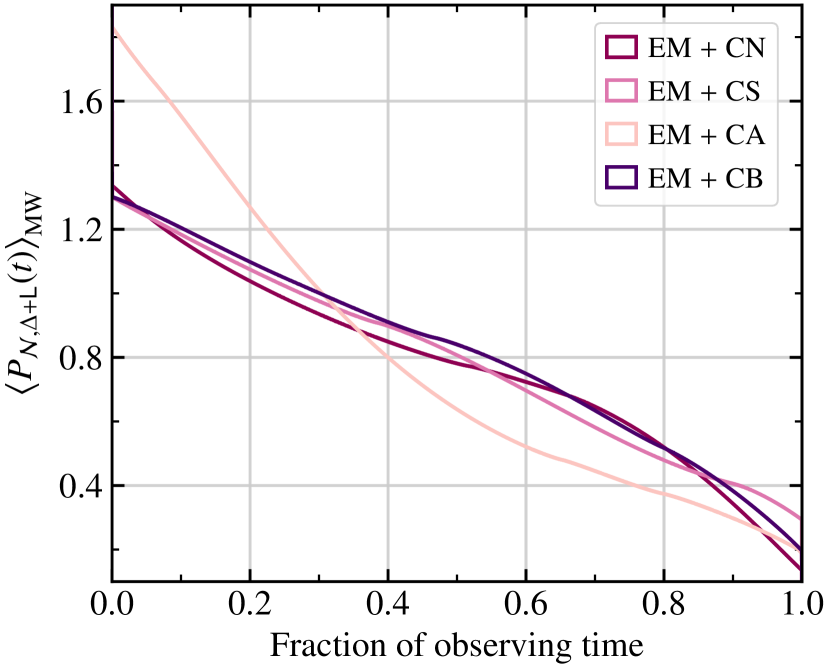
The previous conclusions are confirmed in Figure 10, where we show the cumulative histogram of network antenna power (averaged over the Galactic source population). While the EM+CA network is up to more sensitive than EM+CN/CS/CB for of the observational time, it is also less sensitive (by almost at worst) than the other networks for over of the sidereal day. We note that the relative performance of the EM+CN/CS/CB networks is very similar, with near negligible differences when compared over the total observing time. As such, they are likely more suitable for targeting transient observations than the EM+CA network due to their more consistent network antenna power. In turn, the EM+CA network may be preferable for continuous-wave searches due to the long-duration observation times involved ( sidereal day), which ensure the high network antenna power during that of the sidereal day can consistently be used to the observer’s advantage.
4.2 Three-observatory network
Akin to the aforementioned observatory placement scenario outlined for the Einstein Telescope, it is expected that at least one of the Cosmic Explorer observatories will be built in North America (i.e. either the CN or CS site). As we have seen in the previous Section, the performance of the CN and CS sites are similar in the context of a two-observatory network EM+Cx, meaning that either may be used as a node in the network near-interchangeably. As such, we thus consider a three-observatory network (EM+CS+Cx), comprising (1) one -shaped observatory located in Meuse–Rhine, (2) one L-shaped observatory placed at the CS site, and (3) a second L-shaped observatory placed arbitrarily. As previously, we investigate the performance of the three-observatory network in the context of two source populations: one concentrated at the Galactic center, and one distributed across the Galaxy.
4.2.1 Galactic center
In Figure 11, we show the normalized, polarization-averaged antenna power for the three-observatory network (EM+CS+Cx; comprising (1) one -shaped observatory located in Meuse–Rhine, (2) one North American L-shaped observatory placed at the CS site, and (3) a second L-shaped observatory placed at one of the other three Cosmic Explorer sites) observing the Galactic center as a function of sidereal hour.
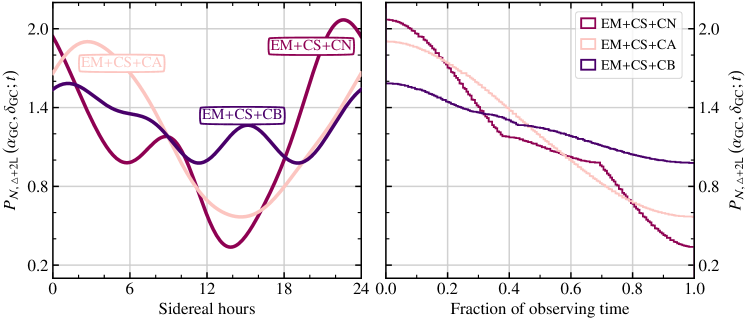
Of the three networks considered, we see that the EM+CS+CN reaches the largest peak antenna power, followed closely by EM+CS+CA. While the peak antenna power for EM+CS+CB is lower than both EM+CS+CN/CA, the network exhibits far less variation over the sidereal day. These initial “first-glance” suppositions are backed up by the cumulative behavior of the network antenna power over the full observing time. While the peak network antenna power for EM+CS+CN (EM+CS+CA) is () greater than that for EM+CS+CB, the network as a whole is only more sensitive for () of the total observing time. EM+CS+CB, however, exhibits remarkable stability in network antenna power over the sidereal day, with the lowest network power well over of the peak. Comparing this to EM+CS+CN, the minimum network power is just of the peak. Similarly, the minimum network power for EM+CS+CA is of its peak. This would suggest that the EM+CS+CB network is preferable for observation of transient events (which cannot be scheduled), while EM+CS+CN/CA may be favorable for continuous observations. Of EM+CS+CN and EM+CS+CA, the latter is more suitable as it confers less variability in sensitivity, while still exhibiting a relatively large peak network power.
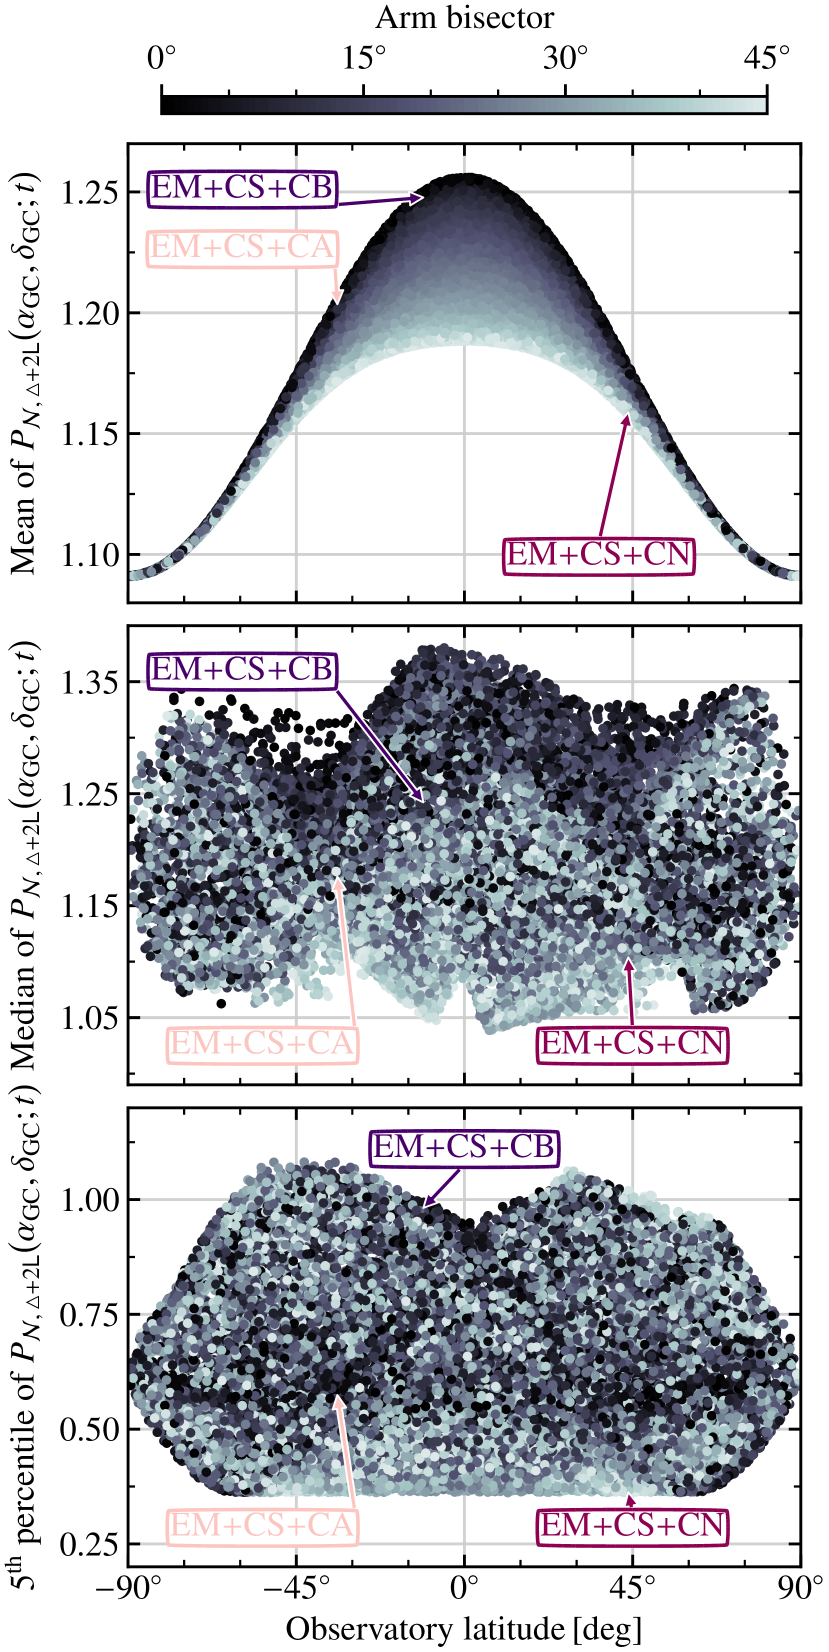
To once more better understand the impact of observatory location and orientation on network performance, we show in Figure 12 the statistical behavior of the antenna power over one sidereal day for a three-observatory network EM+CS+Cx, where the third observatory is randomly placed on the globe. We see that, as for the one- and two-observatory cases, the mean network power is maximized when the third observatory is placed at equatorial latitudes (and with arm bisector for L-shaped observatories with latitudes ), which can yield up to a improvement over polar counterparts. Of the networks considered here, EM+CS+CB performs best for Galactic sources, again followed by EM+CS+CA and then EM+CS+CN.
With that being said, the relationship between placement of the third observatory in the network and the 5th and 50th percentiles of network antenna power is more complex. The distribution of network power with time is dependent not only on the observatory latitude (which determines the single-observatory peak antenna power), but also on the observatory longitude (which determines the time at which the peak antenna power occurs). Regardless, we do note that variation across the 30,000 randomly placed observatories is (somewhat) maximized by equatorial placement, but the longitude must be chosen such that the peak of antenna power does not overlay that of the other observatory nodes. To conclude, we note that (of the networks we considered) EM+CS+CB is preferable for Galactic observations.
4.2.2 Galactic plane average
Considering one final time a population of sources distributed across the Galaxy, we show in Figure 13 the normalized polarization-averaged antenna power over the sidereal day for a three-observatory network EM+CS+Cx, comprising one -shaped observatory in Meuse–Rhine, one North American L-shaped observatory placed at CS, and a second L-shaped observatory placed at one of CN, CA, or CB.
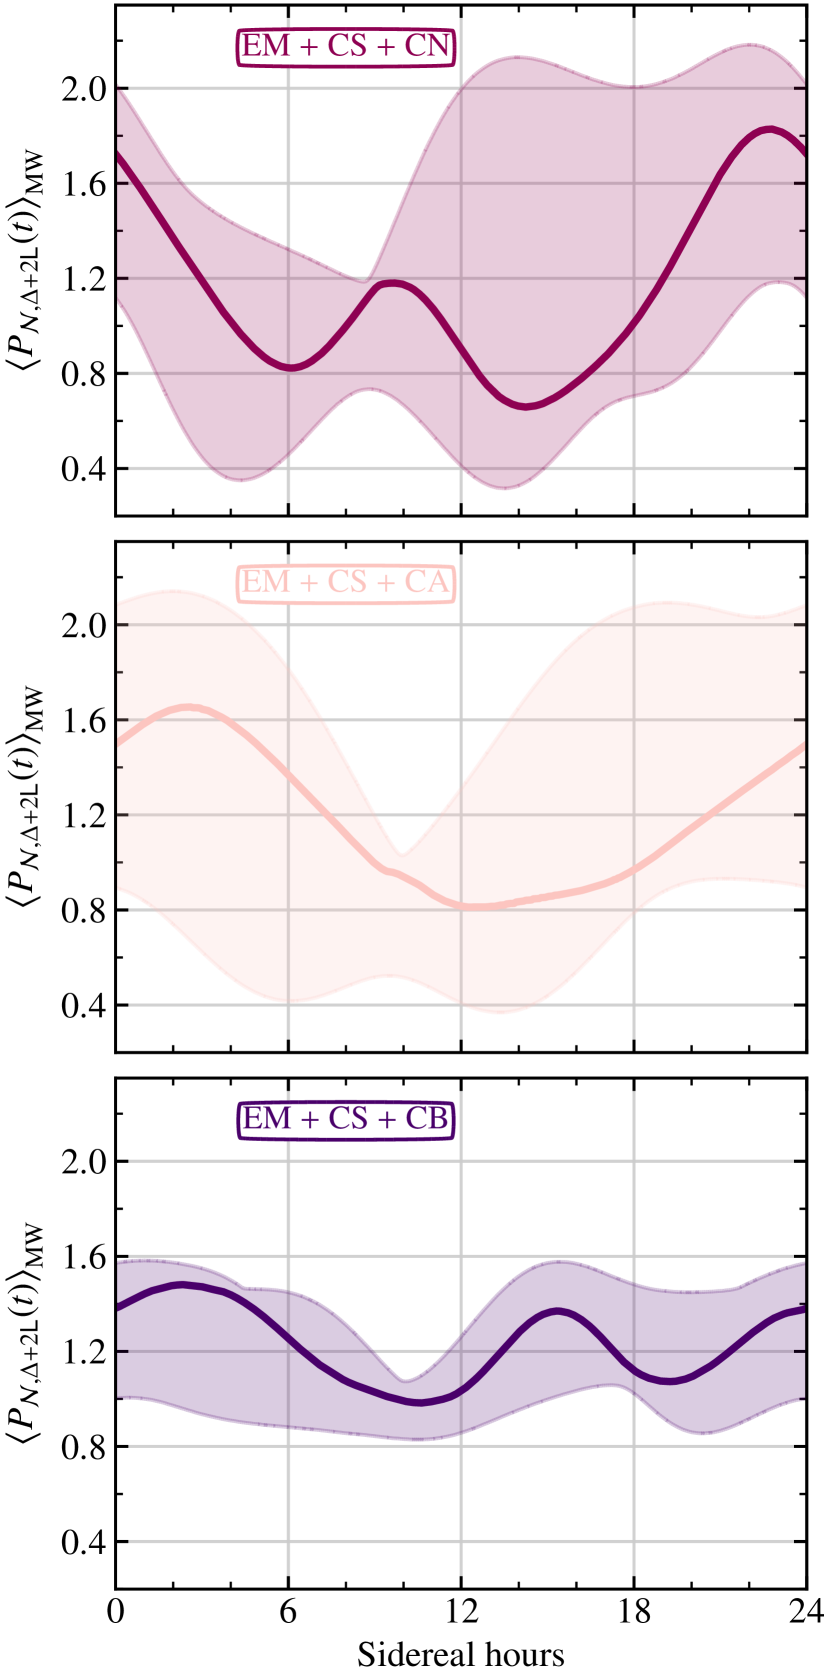
Similarly to the Galactic center case, we see that networks EM+CS+CN/CA have higher peaks in antenna power (albeit with greater variability across the source distribution), while EM+CS+CB exhibits more sensitivity (with less variability across the Galaxy) over the sidereal day. In Figure 14, which shows the cumulative histogram of network antenna power as a fraction of observing time, we see these hunches are confirmed.
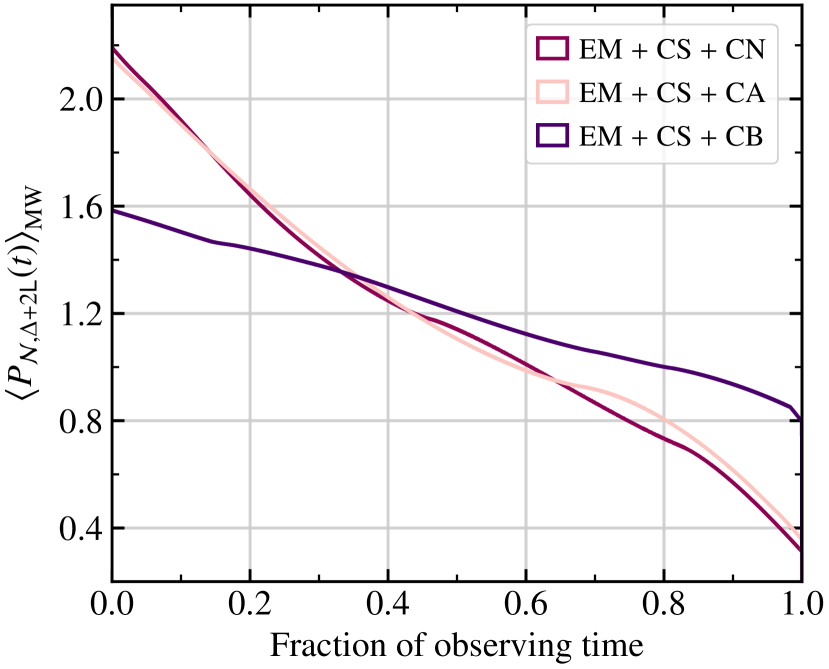
Averaging over the Galactic source population, the differences in performance between EM+CS+CN and EM+CS+CA have all but vanished, with only minute improvements exhibited by EM+CS+CA for the least sensitive of the observation time. Comparatively, EM+CS+CB has a peak antenna power lower than EM+CS+CN/CA, but it is more sensitive than both for of the observation time. Addressing now variation in antenna power over the sidereal day, we see once more that EM+CS+CB exhibits far greater consistency with just a factor of two between its peak and minimum sensitivity. By contrast, for both EM+CS+CN/CA, the minimum antenna power is just of the peak. Reiterating the conclusions of the previous Section, we suggest that EM+CS+CB is the optimal three-observatory network for Galactic observations of those considered here for both the consistent sensitivity and fair peak antenna power.
5 Discussion
While previous studies have focused on source-specific figures of merit such as detection volumes, polarization reconstruction, localization, and inference of compact binary parameters, we focus here solely on a source-independent figure of merit – the network antenna power. Although not specific to any particular source, this choice is indeed purposeful. The Milky Way is abundant with prospective GW sources, yielding signals of widely varying (and often uncertain) morphologies. As such, we aim here to quantify solely the prospective improvement in source detectability owing to augmented antenna power, rather than tuning to source properties that – at this time – are rather ambiguous.
It is important to acknowledge the limitations to this approach. First, we note that while antenna power may well be correlated to the total signal energy collected by the network, the relationship between the total energy and the actual signal-to-noise ratio recovered by a data analysis pipeline – particularly for poorly modeled sources – is not well understood.333This is in contrast to the situation for well-modeled sources, for which all of the signal energy can be recovered via a matched filter in the ideal case (Wainstein & Zubakov, 1962). As such, we do caution against direct one-to-one extrapolation from augmented network antenna power to expected detection volume within the Galaxy. While the two will no doubt be related, we remind the reader that excess-power searches – even those employing coherent network analysis – recover only a fraction of the signal-to-noise ratio that would be extracted by other methods (such as matched filtering) not applicable to the sources considered here. While not the focus of this paper, gains in detectability comparable to those presented here may well be possible through development of targeted analysis methods (see, e.g., Thrane & Coughlin (2014); Millhouse et al. (2018); Cornish et al. (2021); Gossan & Hall (forthcoming 2021)).
Second, it is important to ensure that in optimizing the third-generation of GW observatories for Galactic science, one examines the effect on other science goals. Source localization, which in the current generation of observatories is done primarily through triangulation based on differences in detection times between sites, is dependent on the distances between the observatories along the line of sight to the GW source in question. As a result, accuracy across the sky is improved by maximizing the area of the polygon formed by the network nodes. For the two- and three-observatory networks considered here, the relevant metrics to maximize would be the interobservatory distance and area of the triangle by the observatories, respectively (Schutz, 2011; Raffai et al., 2013).
Relating this back to the study herein, we see that the optimum placement is likely to bolster the accuracy of source localization rather than hinder it. The reason for this is that, given the expectation that at least two of the third-generation observatories will be built in the Northern Hemisphere (with the Einstein Telescope in Europe, and Cosmic Explorer in North America), the directive to place a third observatory at near-equatorial latitudes naturally increases the triangle subtended by the network. Furthermore, placement in the Southern Hemisphere at either the Brazilian or Australian site would maximize the potential for source localization while simultaneously improving prospects for Galactic science.
Third, we also note that the number of observatories online at any given moment can vary. During the most recent observing run for Advanced LIGO and Advanced Virgo (O3), while the single-observatory duty cycles topped , the two-observatory and three-observatory duty cycles were just and , respectively (Buikema et al., 2020; Davis et al., 2021). Given this, we reassert the importance of careful placement of network nodes with respect to each other. As seen in Section 4, colocation of observatories can result in a network that is very sensitive to Galactic sources for some small fraction of the day, while being decidedly suboptimal for the remainder of the observation time. While this was noted previously in the context of network utility for observation of continuous-wave versus transient sources, the issue of duty cycle further complicates matters. Consequently, it is not only relative placement of observatories in the global network that ought to be considered for improving antenna sensitivity to the Galactic plane, but also the local time zone to anticipate detector downtime from both commissioning and increased environmental noise. By taking this into account (in a similar manner to, for example, Szölgyén et al. (2017) in the context of the already built Advanced LIGO, Advanced Virgo, and KAGRA observatories), one can – in principle – place network nodes in anticipation of nonoptimal duty cycles, and plan for an observatory network where the antenna sensitivity does not drop below some predefined threshold. While such considerations are beyond the scope of this study, we emphasize the importance of quantifying this effect, and aim to tackle it in future work.
Considering now the impact on all-sky sensitivity, we note that while placement to improve antenna power for Galactic sources does come at a cost to the overall network isotropy, this effect is not so marked. As stated in Raffai et al. (2013), while the geometry of the network will change the overall shape of the network antenna pattern (i.e., improved sensitivity in one direction results in reduced sensitivity elsewhere), the all-sky integral remains constant for different configurations of the detectors within the network. On the presumption of a homogeneous and isotropic distribution of compact object binaries within the local universe, the overall reach of the observatory network (as characterized by detection volume; Schutz (2011)) is expected to be unchanged by opting for a network geometry that improves sensitivity along the Galactic plane.
Building upon this point, we address the potential impact on prospects for observing electromagnetic counterparts to GW transients. While the Galactic plane is certainly electromagnetically bright, it traces out but a tiny sliver of the celestial sky. Per the discussion above, improving antenna sensitivity for Galactic sources will not reduce the detection volume averaged over the sky. As it is expected that the canonical 1.4–1.4 binary neutron star systems will be observable out to with both the Einstein Telescope and Cosmic Explorer (Bailes et al., 2021), the very slight directional preference for the Galactic plane is likely to have minimal consequences on the observed population of compact object binaries over the course of an observing run.
We further note that a subset of ultracompact object binaries will be observable by space-based GW observatories long before they enter the target frequency band for ground-based detectors. This means that not only will the accuracy of localization will be improved, but additionally the advance warning will permit pointing of telescopes well ahead of merger – enabling longer integration times and, consequently, improved observational prospects. To conclude on this point, extragalactic multimessenger astronomy will not be negatively impacted by placing ground-based GW observatories with Galactic optimization in mind.
Finally, we highlight a crucial consideration: the impact of the observatory on the land, environment, and nearby communities. As stated in the context of Cosmic Explorer (Evans et al., 2021), the proposed third-generation GW observatories should be built and operated with the ongoing consent of the local communities. This tenet must be central to the development, construction, and operation of any and all GW observatories, and prioritized by the collaborative teams leading such efforts from the outset.
6 Conclusion
In this study, we explore whether the prospects for observation of Galactic GW sources can be improved through placement of the potential third-generation GW observatories comprising a future global network. To this end, we employ the antenna power pattern of the network as an appropriate figure of merit, considering an astrophysically motivated distribution of GW sources throughout the Milky Way. As network antenna sensitivity to a particular sky location will vary with time over the day (owing to the Earth’s rotation), we evaluate the average behavior and statistical variations of the antenna power over one sidereal day, for the purpose of commenting on how detection prospects are expected to be impacted for both transient and continuous-wave sources.
For a single observatory, we find that equatorial placement most benefits the observation of Galactic sources, with an up to () improvement in the mean antenna power yielded over hypothetical L-shaped (-shaped) polar observatories. We note that observatory orientation has a marked impact on antenna sensitivity for an L-shaped observatory with latitudes , with maximization occurring when the arm bisector is aligned along any of the local cardinal directions. For polar L-shaped observatories and -shaped observatories at any latitude, orientation has a negligible impact on the mean antenna power at the Galactic center. Of the proposed sites, the Brazilian site (CB/EB) performs optimally for both types of observatory considered, with the Australian site (CA/EA) also being favorable. Considering only the sites in the Northern Hemisphere, we see that CS offers improved sensitivity over CN for an L-shaped observatory in North America, while the performances at either ES or EM for a European -shaped observatory are comparable.
In the context of network placement, we see similar trends in mean antenna power, but note a key difference: while equatorial placement improves peak power for a single observatory, it is important to consider the relative placement of observatories, as well as their expected duty cycle, to thoroughly understand the statistical behavior of the network with time. At all latitudes for two- and three-observatory networks, we see that the longitude of the additional observatory has a significant impact, which is due to its effect on the time of day at which the antenna power peaks. As noted previously, for a consistent network sensitivity over the sidereal day it is important to place the observatories such that the peak antenna power for each network node occurs at different times of day. If the placement of observatories is such that their peak antenna powers temporally overlap, the network will be particularly sensitive at that one time, but will be far less sensitive for the remainder of the day. Further, the local time zones at the different observatories should be considered, such that commissioning and/or downtime due to environmental noise are minimized during the period of day at which the observatory is most sensitive to the Galactic plane (see, e.g., Szölgyén et al. (2017)).
Considering the performance of two- and three-observatory networks, this study primarily focuses on the first two observatory sites being in Europe and North America, and not on the more generic case of optimal placement of network nodes. For instance, in the case of a three-observatory network, there is only a difference in mean antenna power between the best and worst case scenarios. Similarly for the median antenna power, the worst case scenario is just lower than for optimal placement. For the fifth percentile, however, there is more variation, with an improvement of up to a factor of four possible through optimal versus suboptimal placement.
The case for Galactic multimessenger astrophysics is rich and diverse, with much as-yet-untapped potential to probe the Milky Way in GWs. The construction of a network of third-generation ground-based GW observatories offers such an opportunity. The placement and orientation of these observatories can be optimized for sensitivity to Galactic source populations, as shown in this study. Future work will include how multimessenger analysis of Galactic sources can further improve prospects for probing the history and structure of the Milky Way, fundamental physics, and the physics of compact objects.
Acknowledgements
We thank Bryan Gaensler, Juna Kollmeier, Norm Murray, Ziggy Pleunis, and Aaron Tohuvavohu for fruitful discussions that have greatly benefited this work. S.E.G. is supported by the Natural Sciences and Engineering Research Council of Canada (NSERC), funding reference CITA 490888-16. E.D.H. is supported by the MathWorks, Inc. S.M.N. is grateful for financial support from the Nederlandse Organisatie voor Wetenschappelijk Onderzoek (NWO) through the Projectruimte and VIDI grants.
References
- Aasi et al. (2013) Aasi, J., Abadie, J., Abbott, B. P., et al. 2013, Phys. Rev. D, 88, 102002, doi: 10.1103/PhysRevD.88.102002
- Abbott et al. (2017) Abbott, B. P., Abbott, R., Abbott, T. D., et al. 2017, ApJ, 839, 12, doi: 10.3847/1538-4357/aa677f
- Abbott et al. (2019) —. 2019, PhRvX, 9, 031040, doi: 10.1103/PhysRevX.9.031040
- Abbott et al. (2020a) Abbott, B. P., et al. 2020a, Phys. Rev. D, 101, 084002, doi: 10.1103/PhysRevD.101.084002
- Abbott et al. (2020b) Abbott, R., Abbott, T. D., Abraham, S., et al. 2020b, ApJ, 902, L21, doi: 10.3847/2041-8213/abb655
- Abbott et al. (2021a) —. 2021a, PhRvX, 11, 021053, doi: 10.1103/PhysRevX.11.021053
- Abbott et al. (2021b) Abbott, R., et al. 2021b, ApJ, 921, 80, doi: 10.3847/1538-4357/ac17ea
- Abbott et al. (2021c) —. 2021c, arXiv e-prints. https://arxiv.org/abs/2109.09255
- Abdikamalov et al. (2020) Abdikamalov, E., Pagliaroli, G., & Radice, D. 2020, arXiv e-prints. https://arxiv.org/abs/2010.04356
- Abdikamalov et al. (2010) Abdikamalov, E. B., Ott, C. D., Rezzolla, L., et al. 2010, Phys. Rev. D, 81, 044012, doi: 10.1103/PhysRevD.81.044012
- Ackley et al. (2020) Ackley, K., Adya, V. B., Agrawal, P., et al. 2020, PASA, 37, e047, doi: 10.1017/pasa.2020.39
- Adams et al. (2013) Adams, S. M., Kochanek, C. S., Beacom, J. F., Vagins, M. R., & Stanek, K. Z. 2013, ApJ, 778, 164, doi: 10.1088/0004-637X/778/2/164
- Adhikari (2014) Adhikari, R. X. 2014, RvMP, 86, 121, doi: 10.1103/RevModPhys.86.121
- Alford & Schwenzer (2014) Alford, M. G., & Schwenzer, K. 2014, ApJ, 781, 26, doi: 10.1088/0004-637X/781/1/26
- Allocca et al. (2021) Allocca, A., Berbellini, A., Boschi, L., et al. 2021, EPJP, 136, 511, doi: 10.1140/epjp/s13360-021-01450-8
- Amann et al. (2020) Amann, F., Bonsignorio, F., Bulik, T., et al. 2020, RScI, 91, 9, doi: 10.1063/5.0018414
- Andersson et al. (2011) Andersson, N., Ferrari, V., Jones, D. I., et al. 2011, GReGr, 43, 409, doi: 10.1007/s10714-010-1059-4
- Arnaud et al. (2002) Arnaud, N., Barsuglia, Mand Bizouard, M.-A., Canitrot, P., et al. 2002, Phys. Rev. D, 65, 042004, doi: 10.1103/PhysRevD.65.042004
- Ashton et al. (2019) Ashton, G., Hübner, M., Lasky, P., et al. 2019, ApJS, 241, 27, doi: 10.3847/1538-4365/ab06fc
- Bader et al. (2021) Bader, M., Koley, S., van den Brand, J., et al. 2021, CQGra. http://iopscience.iop.org/article/10.1088/1361-6382/ac1be4
- Bailes et al. (2021) Bailes, M., Berger, B. K., Brady, P. R., et al. 2021, NatRP, 3, 344, doi: 10.1038/s42254-021-00303-8
- Bailes et al. (2019) Bailes, M., McClelland, D., Thrane, E., et al. 2019, arXiv e-prints. https://arxiv.org/abs/1912.06305
- Borhanian (2021) Borhanian, S. 2021, CQGra, 38, 175014, doi: 10.1088/1361-6382/ac1618
- Brewer (2013) Brewer, C. A. 2013, ColorBrewer 2.0. http://www.ColorBrewer.org
- Buikema et al. (2020) Buikema, A., Cahillane, C., Mansell, G. L., et al. 2020, Phys. Rev. D, 102, 062003, doi: 10.1103/PhysRevD.102.062003
- Cornish et al. (2021) Cornish, N. J., Littenberg, T. B., Bécsy, B., et al. 2021, Phys. Rev. D, 103, 044006, doi: 10.1103/PhysRevD.103.044006
- Davis et al. (2021) Davis, D., Areeda, J. S., Berger, B. K., et al. 2021, CQGra, 38, 135014, doi: 10.1088/1361-6382/abfd85
- DeMarchi et al. (2021) DeMarchi, L., Sanders, J. R., & Levesque, E. M. 2021, ApJ, 911, 101, doi: 10.3847/1538-4357/abebe1
- Einstein Telescope (2020) Einstein Telescope. 2020, Design Report Update 2020 for the Einstein Telescope, Tech. Rep. ET-0007B-20, Einstein Telescope
- Essick et al. (2017) Essick, R., Vitale, S., & Evans, M. 2017, Phys. Rev. D, 96, 084004, doi: 10.1103/PhysRevD.96.084004
- Evans et al. (2021) Evans, M., et al. 2021, arXiv e-prints. https://arxiv.org/abs/2109.09882
- Gossan & Hall (forthcoming 2021) Gossan, S. E., & Hall, E. D. forthcoming 2021
- Gossan et al. (2016) Gossan, S. E., Sutton, P., Stuver, A., et al. 2016, Phys. Rev. D, 93, 042002, doi: 10.1103/PhysRevD.93.042002
- Hall & Evans (2019) Hall, E. D., & Evans, M. 2019, CQGra, 36, 225002, doi: 10.1088/1361-6382/ab41d6
- Haskell (2015) Haskell, B. 2015, IJMPE, 24, 1541007, doi: 10.1142/S0218301315410074
- Haskell & Melatos (2015) Haskell, B., & Melatos, A. 2015, IJMPD, 24, 1530008, doi: 10.1142/S0218271815300086
- Holgado et al. (2018) Holgado, A. M., Ricker, P. M., & Huerta, E. A. 2018, ApJ, 857, 38, doi: 10.3847/1538-4357/aab6a9
- Hu et al. (2015) Hu, Y.-M., Raffai, P., Gondán, L., et al. 2015, CQGra, 32, 105010, doi: 10.1088/0264-9381/32/10/105010
- Hunter (2007) Hunter, J. D. 2007, CSE, 9, 90, doi: 10.1109/MCSE.2007.55
- Jacomy (2019) Jacomy, M. 2019, iWantHue. https://medialab.github.io/iwanthue/
- Jaranowski et al. (1998) Jaranowski, P., Krolak, A., & Schutz, B. F. 1998, Phys. Rev. D, 58, 063001, doi: 10.1103/PhysRevD.58.063001
- Jenny (2018) Jenny, B. 2018, ColorOracle. https://colororacle.org
- Korol et al. (2021a) Korol, V., Belokurov, V., Moore, C. J., & Toonen, S. 2021a, MNRAS, 502, L55, doi: 10.1093/mnrasl/slab003
- Korol et al. (2021b) Korol, V., Hallakoun, N., Toonen, S., & Karnesis, N. 2021b, arXiv e-prints. https://arxiv.org/abs/2109.10972
- LIGO Scientific Collaboration (2018) LIGO Scientific Collaboration. 2018, LIGO Algorithm Library - LALSuite, free software (GPL), doi: 10.7935/GT1W-FZ16
- Maggiore et al. (2020) Maggiore, M., Van Den Broeck, C., Bartolo, N., et al. 2020, JCAP, 03, 050, doi: 10.1088/1475-7516/2020/03/050
- Melatos & Priymak (2014) Melatos, A., & Priymak, M. 2014, ApJ, 794, 170, doi: 10.1088/0004-637X/794/2/170
- Millhouse et al. (2018) Millhouse, M., Cornish, N. J., & Littenberg, T. 2018, Phys. Rev. D, 97, 104057, doi: 10.1103/PhysRevD.97.104057
- Millhouse et al. (2020) Millhouse, M., Strang, L., & Melatos, A. 2020, Phys. Rev. D, 102, 083025, doi: 10.1103/PhysRevD.102.083025
- Millman & Aivazis (2011) Millman, K. J., & Aivazis, M. 2011, CSE, 13, 9, doi: 10.1109/MCSE.2011.36
- Mills et al. (2018) Mills, C., Tiwari, V., & Fairhurst, S. 2018, Phys. Rev. D, 97, 104064, doi: 10.1103/PhysRevD.97.104064
- Nissanke et al. (2011) Nissanke, S., Sievers, J., Dalal, N., & Holz, D. 2011, ApJ, 739, 99, doi: 10.1088/0004-637X/739/2/99
- Oliphant (2007) Oliphant, T. 2007, CSE, 9, 10, doi: 10.1109/MCSE.2007.58
- Oliphant (2006) Oliphant, T. E. 2006, A guide to NumPy, Trelgol Publishing USA. http://www.numpy.org/
- Piccinni et al. (2020) Piccinni, O. J., Astone, P., D’Antonio, S., et al. 2020, Phys. Rev. D, 101, 082004, doi: 10.1103/PhysRevD.101.082004
- Piro (2013) Piro, A. L. 2013, ApJ, 768, L14, doi: 10.1088/2041-8205/768/1/L14
- Piro & Kulkarni (2013) Piro, A. L., & Kulkarni, S. R. 2013, ApJ, 762, L17, doi: 10.1088/2041-8205/762/2/L17
- Piro & Thompson (2014) Piro, A. L., & Thompson, T. A. 2014, ApJ, 794, 28, doi: 10.1088/0004-637X/794/1/28
- Piro & Thrane (2012) Piro, A. L., & Thrane, E. 2012, ApJ, 761, 63, doi: 10.1088/0004-637X/761/1/63
- Punturo et al. (2010) Punturo, P., Abernathy, M., Acernese, F., et al. 2010, CQGra, 27, 194002, doi: 10.1088/0264-9381/27/19/194002
- Raffai et al. (2013) Raffai, P., Gondán, L., Heng, I. S., et al. 2013, CQGra, 30, 155004, doi: 10.1088/0264-9381/30/15/155004
- Schutz (2011) Schutz, B. F. 2011, CQGra, 28, 125023, doi: 10.1088/0264-9381/28/12/125023
- Szölgyén et al. (2017) Szölgyén, A., Dálya, G., Gondán, L., & Raffai, P. 2017, CQGra, 34, 075011, doi: 10.1088/1361-6382/aa6354
- Thrane & Coughlin (2014) Thrane, E., & Coughlin, M. 2014, Phys. Rev. D, 89, 063012, doi: 10.1103/PhysRevD.89.063012
- van der Walt et al. (2011) van der Walt, S., Colbert, S. C., & Varoquaux, G. 2011, CSE, 13, 22, doi: 10.1109/MCSE.2011
- van Eysden & Melatos (2008) van Eysden, C. A., & Melatos, A. 2008, CQGra, 25, 225020, doi: 10.1088/0264-9381/25/22/225020
- Wainstein & Zubakov (1962) Wainstein, L. A., & Zubakov, V. D. 1962, Extraction of Signals from Noise (Dover Publications)
- Warren et al. (2020) Warren, M. L., Couch, S. M., O’Connor, E. P., & Morozova, V. 2020, ApJ, 898, 139, doi: 10.3847/1538-4357/ab97b7
- Zhang et al. (2021) Zhang, Y., Papa, M. A., Krishnan, B., & Watts, A. L. 2021, ApJ, 906, L14, doi: 10.3847/2041-8213/abd256
- Zhao & Wen (2018) Zhao, W., & Wen, L. 2018, Phys. Rev. D, 97, 064031, doi: 10.1103/PhysRevD.97.064031