Pressure-induced enhancement of the superconducting transition temperature in La2O2Bi3AgS6
Abstract
Charge density wave (CDW) instability is often found in phase diagrams of superconductors such as cuprates and certain transition-metal dichalcogenides. This proximity to superconductivity triggers the question on whether CDW instability is responsible for the pairing of electrons in these superconductors. However, this issue remains unclear and new systems are desired to provide a better picture. Here, we report the temperature-pressure phase diagram of a recently discovered BiS2 superconductor La2O2Bi3AgS6, which shows a possible CDW transition at 155 K and a superconducting transition at 1.0 K at ambient pressure, via electrical resistivity measurements. Upon applying pressure, decreases linearly and extrapolates to 0 K at 3.9 GPa. Meanwhile, is enhanced and reaches maximum value of 4.1 K at 3.1 GPa, forming a superconducting dome in the temperature-pressure phase diagram.
-
August 2021
1 Introduction
The interplay among different electronic states has in many instances promoted the discovery of exotic states of matter. For example, the emergence of high- superconductivity in the proximity of density wave instabilities in cuprates [1, 2, 3, 4, 5, 6] and iron-based superconductors [7, 8, 9, 10, 11] has been widely studied. Through tuning non-thermal parameters such as doping level and physical pressure, a variety of phase diagrams can be investigated, which help to reveal the key mechanisms for the formation of many exotic states including unconventional superconductivity.
An interesting issue in phase diagram studies concerns the role of the charge density wave (CDW) on the appearance of superconductivity. Intricate interaction between CDW and superconductivity can be found in the phase diagrams of several systems, such as cuprate superconductors [6], transition-metal dichalcogenides [12, 13, 14, 15], Kagome metals [16, 17, 18], (Sr,Ca)3(Ir,Rh)4Sn13 [19, 20, 21], Lu(Pt1-xPdx)2In [22], as well as certain BiS2-based superconductors [23, 24, 25, 26, 27, 28]. However, the precise relationship between CDW and superconductivity is controversial. For instance, in the family of BiS2-based superconductors, which are structurally analogous to iron-based superconductors, EuBiS2F and Eu3Bi2S4F4 [24, 25] exhibit the interplay of possible CDW and superconductivity. They are regarded as self-doping systems and superconduct below 0.3 K and 1.5 K for EuBiS2F and Eu3Bi2S4F4, respectively. Both systems show a CDW-like transition at 280 K. Through pressure tuning, the CDW-like transition in EuBiS2F does not change significantly but increases [29]. In Se-doped Eu3Bi2S4-xSexF4, is enhanced with the suppression of the CDW-like transition [30]. This contrasting behaviour makes it difficult to conclude whether the possible CDW phase helps to stabilize the superconducting phase, or compete with superconductivity in BiS2-based systems.
The discovery of La2O2Bi3AgS6 [31] in 2017 opens up a new opportunity to study the interplay between CDW and superconductivity in BiS2-based superconductors. Measurements of resistivity on La2O2Bi3AgS6 revealed a superconducting transition at 1.0 K and a possible CDW transition at 155 K [32]. Through Sn-substitution, the corresponding phase diagram of La2O2Bi3Ag1-xSnxS6 reported by Jha et al. [33] showed that is enhanced up to 2.3 K at 0.4, while is slightly suppressed at 0.2 and quickly becomes untraceable at 0.2 due to the severe broadening of the anomaly in electrical resistivity associated with . In this regard, the relationship between the CDW-like transition and superconductivity in La2O2Bi3AgS6 has not been settled by substitution.
In this study, hydrostatic pressure is used as a tuning parameter to study the evolution of and of La2O2Bi3AgS6. Compared with chemical doping, pressure has a lesser impact on the disorder levels of the system, enabling us to track across a larger energy scale. By measuring the temperature dependence of the resistivity of polycrystalline La2O2Bi3AgS6 under pressure up to 7.43 GPa, we present the temperature-pressure phase diagram showing the existence of a superconducting dome centered around the pressure where extrapolates to 0 K.
2 Samples and experimental setup
Polycrystalline samples of La2O2Bi3AgS6 were synthesized by a solid-state reaction method [31, 32]. The starting materials, La2S3 (99%), AgO (99.9%), S (99.98%), Bi2O3 (99.999%) and Bi (99.999%) powder, were well mixed and then pressed into a pellet. The pellet was then inserted into a quartz tube. These procedures were performed in a pure Ar-filled glovebox. The quartz tube was sealed after being evacuated to mbar using a turbopump. Finally, the reactants inside the sealed quartz tube were annealed at 720 ∘C for 15 hr. The annealing process was repeated once after regrinding the pellet. The crystal structure of the samples was examined by x-ray diffraction via Rigaku Smartlab x-ray diffractometer. High-pressure electrical resistivity was measured by using a four-point technique in a diamond anvil pressure cell with glycerol as the pressure transmitting medium. The pressure achieved was determined using ruby fluorescence. Low temperature and high magnetic field environments were provided by a Bluefors dilution fridge and a Quantum Design Physical Property Measurement System (PPMS).
3 Results and discussion
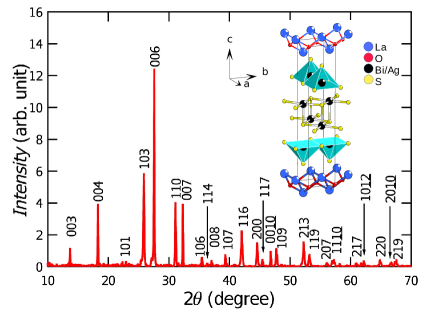
Figure 1 shows the powder x-ray diffraction pattern of polycrystalline La2O2Bi3AgS6 at ambient pressure. The peaks observed in the pattern can be indexed to a tetragonal crystal structure with a space group of , which is consistent with previous reports [31, 32]. No major impurity phases are found in our data, indicating that our samples are of high purity. The inset in Fig. 1 shows the schematic drawing of the crystal structure of La2O2Bi3AgS6. It consists of [La2O2] blocking layers and [M4S6] conducting layers stacking along the -axis, where the ratio of Bi:Ag at the M site is 3:1. Comparing with the most studied BiS2-based superconductor LaO0.5F0.5BiS2 [34, 35], both compounds share the similar blocking layers but the blocking layers in La2O2Bi3AgS6 become thicker.
Figure 2 displays the ambient pressure data of La2O2Bi3AgS6 for Samples E1 and M1, which come from the same batch. At high temperatures (200 K), both samples exhibit a metallic-like behavior. As temperature goes down, the resistivity starts to increase, demonstrating a semiconductor-like behavior, and shows a weak anomalous hump around 155 K for sample E1. At low temperatures, a superconducting transition is observed at 1.0 K (inset of Fig. 2(a)), where is defined as the temperature corresponding to 90% of the normal-state resistance. Our resistivity data are generally consistent with that observed in previous studies [31, 32], in which the anomaly around K has been attributed to a CDW phase transition.
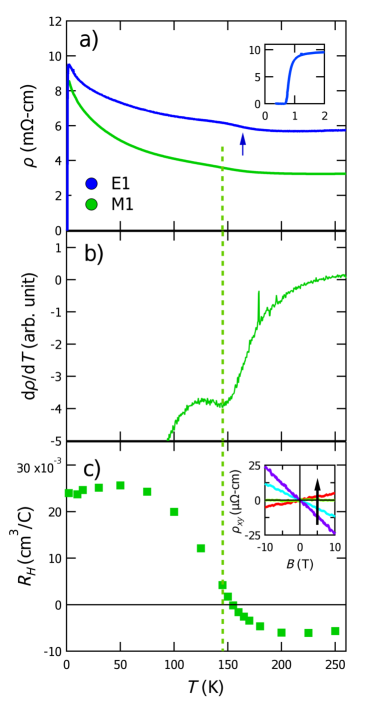
To better visualize this anomaly, we also plot the first derivative of resistivity against temperature in Fig. 2(b), which shows a minimum at the anomaly. In this study, this minimum is used to define the transition temperature of the CDW-like transition . The value of at ambient pressure was observed to be sample dependent in the range 1558 K, which is marked by the dashed line in Fig. 2 for Sample M1 and the vertical arrow in Fig. 2(a) for Sample E1.
In order to understand the origin of the anomaly around , a Hall effect measurement was made on Sample M1. (B) was measured between T and T as shown in the inset of Fig. 2(c). The raw resistivity data in all datasets were antisymmetrized to remove the component. Hall coefficient at various temperatures can be extracted by calculating the slopes of these curves, as shown in Fig. 2(c). Around room temperature, is negative and nearly temperature independent. Near , undergoes a transition from negative to positive upon cooling, and the magnitude of eventually reaches a larger value than the room temperature value. Such a sign-changing is interesting, and bear striking resemblance to the case of EuBiS2F, which is another system exhibiting a possible CDW state [24]. At the level of a single-band approximation, the increase of at low temperatures reveals a decrease in carrier density, which can be understood as the possible opening of a CDW gap on the Fermi surface.
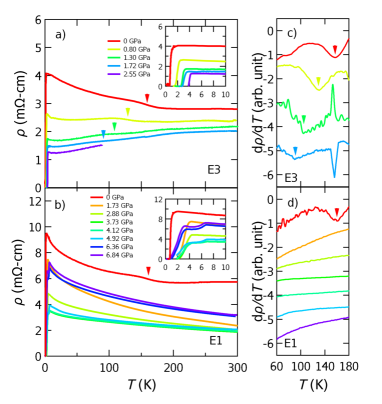
Figure 3 shows the temperature dependence of resistivity measured for Samples E3 and E1 at different pressures. The ambient pressure data for Sample E1 is the same as that of Fig. 1(a). With an increasing pressure, the anomaly in resistivity for Sample E3 shifts to lower temperatures, and becomes less prominent. Using the temperature derivative of resistivity, we track the evolution of under pressure, and the corresponding values of at each pressure point are marked by the vertical arrows in Figs. 3 (a) and (c). The anomaly in resistivity for Sample E1 is much less prominent and cannot be determined accurately at high pressures. All datasets show superconductivity at low temperatures, which can be visualized in the insets of Figs. 3 (a) and (b). An anomalous drop in resistivity near 7 K was observed above 4 GPa, as displayed in the inset of Fig. 3 (b). The origin of the drop is presently unknown.
The pressure dependencies of and for samples E1, E2 ( not shown) and E3 are summarized in a temperature-pressure phase diagram in Fig. 4. As pressure increases, of Sample E3 decreases linearly at a rate of 40.8 K/GPa up to 1.7 GPa. Using only the data of Sample E2 up to 2.1 GPa, d/d is 41.9 K/GPa, close to the value obtained for Sample E3. At higher pressures, the anomaly becomes too broad and can no longer be distinguished in the derivative data. In Sample E3, the anomaly can only be detected at ambient pressure. With all the data available, the overall d/d is calculated to be 41.0 K/GPa. Linearly extrapolating to zero temperature with this rate, we find that reaches zero at 3.9 GPa. On the other hand, first increases with pressure and reaches a maximum of 4.1 K at 3.1 GPa. We point out that despite the usage of three samples from the same batch, and hence three sets of high pressure experimental data, from these different samples shows a good agreement. Finally, we note an interesting anticorrelation between the pressure evolution of and the normal state resistivity, as benchmarked by . Such a behaviour, accompanied by an analogous superconducting dome, and a change in sign of have also been observed in recently discovered nickelate based superconductor, where the electronic and superconducting properties can be tuned by varying the Sr content of Nd1-xSrxNiO2 [36, 37].
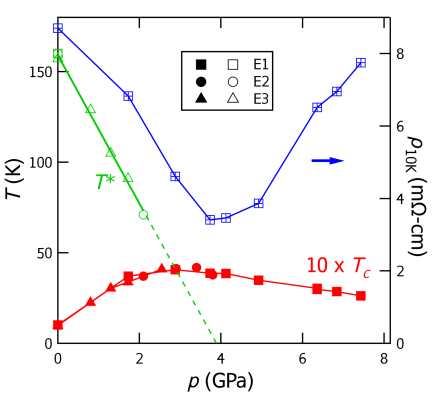
It is instructive to compare our temperature-pressure phase diagram with the phase diagram obtained via Sn substitution reported by Jha et al. [32]. In terms of , our phase diagram is qualitatively similar to the phase diagram constructed by Jha et al. However, appears to be much more sensitive to pressure than to the Sn concentration. According to our phase diagram, a dome-like where peaks near the pressure where hints at the importance of fluctuations related to the transition on superconductivity in La2O2Bi3AgS6. Thus, our phase diagram resembles the phase diagrams of other superconductors, including heavy fermions [38], (Sr,Ca)3(Ir,Rh)4Sn13 [19, 20, 21], and iron-based superconductors [7, 8, 9, 10, 11] where superconductivity is optimized in the vicinity of a putative quantum phase transition. If can be firmly established to be a transition temperature of a CDW state, La2O2Bi3AgS6 will become another good platform to study the interplay between CDW and superconductivity. Further investigations are desirable to uncover the nature of the phase below in La2O2Bi3AgS6, and to understand how the ordered state below interacts with superconductivity.
4 Summary
In summary, we have measured the electrical resistivity of La2O2Bi3AgS6 and constructed the pressure-temperature phase diagram up to 7.43 GPa. A resistivity anomaly at , which is possibly related to a CDW phase transition, decreases linearly with pressure and can be extrapolated to 0 K at 3.9 GPa. forms a broad dome, reaching a maximum of 4.1 K at 3.1 GPa, which demonstrates a strong interplay of between the CDW-like transition and superconductivity.
References
References
- [1] Tranquada J M, Sternlieb B J, Axe J D, Nakamura Y and Uchida S 1995 Nature 375 561–563
- [2] Fradkin E, Kivelson S A and Tranquada J M 2015 Rev. Mod. Phys. 87 457–482
- [3] Sachdev S 2010 Phys. Status Solidi B 247 537–543
- [4] Doiron-Leyraud N and Taillefer L 2012 Physica C Supercond. 481 161–167
- [5] Sebastian S E and Proust C 2015 Annu. Rev. Condens. Matter Phys. 6 411–430
- [6] Caprara S, Castro C D, Seibold G and Grilli M 2017 Phys. Rev. B 95 224511
- [7] Chen H, Ren Y, Qiu Y, Bao W, Liu R H, Wu G, Wu T, Xie Y L, Wang X F, Huang Q and Chen X H 2009 EPL 85 17006
- [8] Pratt D K, Tian W, Kreyssig A, Zarestky J L, Nandi S, Ni N, Bud’ko S L, Canfield P C, Goldman A I and McQueeney R J 2009 Phys. Rev. Lett. 103 087001
- [9] Parker D R, Smith M J P, Lancaster T, Steele A J, Franke I, Baker P J, Pratt F L, Pitcher M J, Blundell S J and Clarke S J 2010 Phys. Rev. Lett. 104 057007
- [10] Pratt D K, Kim M G, Kreyssig A, Lee Y B, Tucker G S, Thaler A, Tian W, Zarestky J L, Bud’ko S L, Canfield P C, Harmon B N, Goldman A I and McQueeney R J 2011 Phys. Rev. Lett. 106 257001
- [11] Luo H, Zhang R, Laver M, Yamani Z, Wang M, Lu X, Wang M, Chen Y, Li S, Chang S, Lynn J W and Dai P 2012 Phys. Rev. Lett. 108 247002
- [12] Neto A H C 2001 Phys. Rev. Lett. 86 4382–4385
- [13] Morosan E, Zandbergen H W, Dennis B S, Bos J W G, Onose Y, Klimczuk T, Ramirez A P, Ong N P and Cava R J 2006 Nat. Phys. 2 544–550
- [14] Feng Y, Wang J, Jaramillo R, van Wezel J, Haravifard S, Srajer G, Liu Y, Xu Z A, Littlewood P B and Rosenbaum T F 2012 Proc. Natl. Acad. Sci. U.S.A 109 7224–7229
- [15] Niu Q, Zhang W, Chan Y T, O'Farrell E C T, Doganov R, Yip K Y, Lai K T, Yu W C, Özyilmaz B, Stewart G R, Kim J S and Goh S K 2020 Phys. Rev. Research 2 023297
- [16] Ortiz B R, Teicher S M, Hu Y, Zuo J L, Sarte P M, Schueller E C, Abeykoon A M, Krogstad M J, Rosenkranz S, Osborn R, Seshadri R, Balents L, He J and Wilson S D 2020 Phys. Rev. Lett. 125 247002
- [17] Du F, Luo S, Ortiz B R, Chen Y, Duan W, Zhang D, Lu X, Wilson S D, Song Y and Yuan H 2021 Phys. Rev. B 103(22) L220504
- [18] Chen K Y, Wang N N, Yin Q W, Gu Y H, Jiang K, Tu Z J, Gong C S, Uwatoko Y, Sun J P, Lei H C, Hu J P and Cheng J G 2021 Phys. Rev. Lett. 126(24) 247001
- [19] Klintberg L E, Goh S K, Alireza P L, Saines P J, Tompsett D A, Logg P W, Yang J, Chen B, Yoshimura K and Grosche F M 2012 Phys. Rev. Lett. 109 237008
- [20] Goh S K, Tompsett D, Saines P, Chang H, Matsumoto T, Imai M, Yoshimura K and Grosche F 2015 Phys. Rev. Lett. 114 097002
- [21] Yu W C, Cheung Y W, Saines P J, Imai M, Matsumoto T, Michioka C, Yoshimura K and Goh S K 2015 Phys. Rev. Lett. 115 207003
- [22] Gruner T, Jang D, Huesges Z, Cardoso-Gil R, Fecher G H, Koza M M, Stockert O, Mackenzie A P, Brando M and Geibel C 2017 Nat. Phys. 13 967–972
- [23] Wan X, Ding H C, Savrasov S Y and Duan C G 2013 Phys. Rev. B 87 115124
- [24] Zhai H F, Tang Z T, Jiang H, Xu K, Zhang K, Zhang P, Bao J K, Sun Y L, Jiao W H, Nowik I, Felner I, Li Y K, Xu X F, Tao Q, Feng C M, Xu Z A and Cao G H 2014 Phys. Rev. B 90 064518
- [25] Zhai H F, Zhang P, Wu S Q, He C Y, Tang Z T, Jiang H, Sun Y L, Bao J K, Nowik I, Felner I, Zeng Y W, Li Y K, Xu X F, Tao Q, Xu Z A and Cao G H 2014 J. Am. Chem. Soc. 136 15386–15393
- [26] Chan Y C, Yip K Y, Cheung Y W, Chan Y T, Niu Q, Kajitani J, Higashinaka R, Matsuda T D, Yanase Y, Aoki Y, Lai K T and Goh S K 2018 Phys. Rev. B 97 104509
- [27] Iwasaki S, Kawai Y, Takahashi S, Suda T, Wang Y, Koshino Y, Ogura F, Shibayama Y, Kurosawa T, Oda M, Ido M and Momono N 2019 J. Phys. Soc. Jpn. 88 041005
- [28] Mizuguchi Y 2015 J. Phys. Chem. Solids 84 34–48
- [29] Guo C Y, Chen Y, Smidman M, Chen S A, Jiang W B, Zhai H F, Wang Y F, Cao G H, Chen J M, Lu X and Yuan H Q 2015 Phys. Rev. B 91 214512
- [30] Zhang P, Zhai H F, Tang Z J, Li L, Li Y K, Chen Q, Chen J, Wang Z, Feng C M, Cao G H and Xu Z A 2015 EPL 111 27002
- [31] Hijikata Y, Abe T, Moriyoshi C, Kuroiwa Y, Goto Y, Miura A, Tadanaga K, Wang Y, Miura O and Mizuguchi Y 2017 J. Phys. Soc. Jpn. 86 124802
- [32] Jha R, Goto Y, Higashinaka R, Matsuda T D, Aoki Y and Mizuguchi Y 2018 J. Phys. Soc. Jpn. 87 083704
- [33] Jha R, Goto Y, Matsuda T D, Aoki Y, Nagao M, Tanaka I and Mizuguchi Y 2019 Sci. Rep. 9
- [34] Mizuguchi Y, Demura S, Deguchi K, Takano Y, Fujihisa H, Gotoh Y, Izawa H and Miura O 2012 J. Phys. Soc. Jpn. 81 114725
- [35] Mizuguchi Y, Hiroi T, Kajitani J, Takatsu H, Kadowaki H and Miura O 2014 J. Phys. Soc. Jpn. 83 053704
- [36] Li D, Wang B Y, Lee K, Harvey S P, Osada M, Goodge B H, Kourkoutis L and Hwang H 2020 Phys. Rev. Lett. 125 027001
- [37] Zeng S, Tang C S, Yin X, Li C, Li M, Huang Z, Hu J, Liu W, Omar G J, Jani H, Lim Z S, Han K, Wan D, Yang P, Pennycook S J, Wee A T and Ariando A 2020 Phys. Rev. Lett. 125 147003
- [38] Gegenwart P, Si Q and Steglich F 2008 Nat. Phys. 4 186–197