Detection of a dense SiO jet in the evolved protostellar phase
Abstract
Jets and outflows trace the accretion history of protostars. High-velocity molecular jets have been observed from several protostars in the early Class 0 phase of star formation, detected with the high-density tracer SiO. Until now, no clear jet has been detected with SiO emission from isolated evolved Class I protostellar systems. We report a prominent dense SiO jet from a Class I source G205S3 (HOPS 315: Tbol 180 K, spectral index 0.417), with a moderately high mass-loss rate ( 0.59 10-6 M☉ yr-1) estimated from CO emission. Together, these features suggest that G205S3 is still in a high accretion phase, similar to that expected of Class 0 objects. We compare G205S3 to a representative Class 0 system G206W2 (HOPS 399) and literature Class 0/I sources to explore the possible explanations behind the SiO emission seen at the later phase. We estimate a high inclination angle ( 40) for G205S3 from CO emission, which may expose the infrared emission from the central core and mislead the spectral classification. However, the compact 1.3 mm continuum, C18O emission, location in the bolometric luminosity to sub-millimeter fluxes diagram, outflow force ( 3.26 10-5 M☉km s-1/yr) are also analogous to that of Class I systems. We thus consider G205S3 to be at the very early phase of Class I, and in the late phase of “high-accretion”. The episodic ejection could be due to the presence of an unknown binary, a planetary companion, or dense clumps, where the required mass for such high accretion could be supplied by a massive circumbinary disk.
1 Introduction
During the earliest phases of star-formation, jets and outflows play a crucial role in mediating protostellar accretion. Previous observations suggest that jets can efficiently remove the excess angular momentum from the surfaces of circumstellar disks and allow material to fall onto the central sources (see reviews by Bally, 2016; Lee, 2020, and references therein). Therefore, jets may delineate the accretion history of protostars. Despite this important role, the jet launching timescale over protostellar evolution is not yet well constraint.
The protostellar spectral classes, 0 and I, are observationally defined and not clearly distinct in terms of evolution. Protostars with bolometric temperature Tbol 70 K are classified as Class I (Chen et al., 1995), and typically have spectral indexes, 0.3 (Furlan et al., 2016). The Class 0 sources are embedded within dense envelopes and have sufficient surrounding material to exhibit typically very high accretion rates onto the protostar. During this phase, protostars usually show outflows with very high mass-loss rates - M☉ yr-1, which could produce high density jets (5-10 106 cm-3) (Ellerbroek et al., 2013; Lee, 2020). Due to its high critical density, the SiO (5-4) molecular transition is the most commonly observed tracer of such high density material (Gibb et al., 2004; Podio et al., 2015, 2021). With time, the envelope material reduces and the protostar moves from Class 0 through Class I, and on to the Class II phase. Both the accretion and mass-loss rates typically decrease with protostellar evolution. Therefore, SiO emission in jets is usually seen in the Class 0 sources. Faint SiO emission is also detected along the jet axis of a few transition Class 0-to-Class I sources (Podio et al., 2021). A Class I protostellar system, SVS13A was found with SiO knots in previous observations (Bachiller et al., 2000; Lefèvre et al., 2017). However, SVS13A is located in a multiple system HH 7/11 with a few outflow/jets in the region, and is a binary protostellar system composed of VLA4A and VLA4B, where VLA4B is identified as the base of the jet (Lefèvre et al., 2017). The spectral classification of the components of such a binary/multiple based on infrared observations could be largely affected by the multiplicity. No clear jets with SiO emission have been previously observed in an isolated source in the evolved Class I phase.
The gas content of the jets transitions from being predominantly molecular to mostly atomic, during evolution from Class 0 to Class II. The jets in the younger sources, such as those in the Class 0 phase, are predominantly detected via molecular gas tracers, e.g., CO, SiO, and SO in the (sub)millimeter and H2 at infrared wavelengths. Conversely, in the older Class I, and II populations, the jets are mainly traced by the atomic and ionized gas, e.g., O, H, and S II (Bally, 2016; Lee, 2020).
In this paper, we report the surprising detection of a Class I source with a clear protostellar jet seen in SiO by the Atacama Large Millimeter/submillimeter Array (ALMA). The system G205.46-14.56S3 (hereafter, G205S3) has Tbol = 18033 K and Lbol = 6.42.4 L☉ (HOPS 315; Furlan et al., 2016; Dutta et al., 2020). We compare this system with ALMA observations of a representative Class 0 protostar, G206.93-16.61W2 (hereafter, G206W2), with Tbol = 3110 K and Lbol = 6.33.0 L☉ (HOPS 399: Furlan et al., 2016; Dutta et al., 2020). Both sources exhibit very high mass-loss rates; however, the SiO jets present very different inclination angles. We first quantify the outflow characteristics and then discuss the evolutionary state of these two systems in terms of their observed sky orientation.
2 Observations
The ALMA observations of G205S2 and G206W2 were performed as part of the ALMASOP project (Project ID:2018.1.00302.S; PI: Tie Liu) in Band 6 during Cycle 6, from 2018 October to 2019 January, toward 72 fields (see Dutta et al., 2020, for more details on the ALMASOP). This paper utilizes the low/high-velocity outflow tracer CO J=2-1 (230.53800 GHz), the high-velocity jet tracer SiO J=5-4 (217.10498 GHz), the envelope tracer C18O J=2-1 (219.56035 GHz), and 1.3 mm dust continuum emission. The acquired visibility data were calibrated using the standard pipeline in CASA 5.4 (McMullin et al., 2007). The CO J=2-1, SiO J=5-4, and C18O J=2-1 emission maps were created with the TCLEAN task using a robust weighting factor of 0.5 on a combination of three visibility datasets (i.e., TM1+TM2+ACA) providing typical synthesized beam sizes of 037 032, 041 034 and 039 032, respectively. The velocity resolution is 1.4 km s-1. The continuum maps were created using TCLEAN and a 0.5 robust weighting down to a threshold of 3 theoretical sensitivity with the synthesized beam size of 038 034. More details on these observations and analyses are presented in Dutta et al. (2020).
3 RESULTS
3.1 Detection of molecular jet in SiO emission
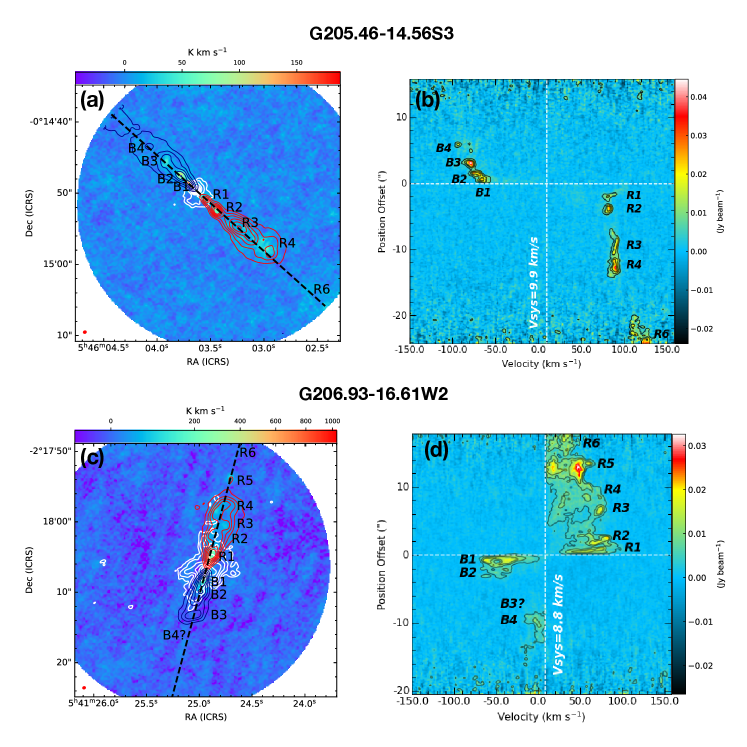
Figures 2a and c display ALMA maps of the two jets in SiO (5-4) at 140 au resolution along with the high-velocity CO outflow contours over plotted in blue and red.
Figures 2b and d show the position-velocity (PV) diagrams of the SiO emission traced along each jet-axis direction. The systemic velocities are obtained from peak C18O emission and are marked in Figures 2b and d (column 3 of Table 1). G205S3 and G206W2 exhibit line-of-sight projected maximum velocities of Vmax,SiO 120 and 106 km s-1, respectively (column 5 of Table 1).
The jet from G205S3 is highly collimated, whereas that from G206W2 is relatively extended spatially. Both jets exhibit knots (marked as B1, B2, … in the blue lobe and R1, R2…. in red lobe), which are possibly formed by a chain of internal shocks via a semi-periodic variation in the jet velocity (Moraghan et al., 2016; Wang et al., 2019). We estimate mean line-of-sight jet velocities from the peak positions of the knot structures, yielding Vj,obs 80 and 50 km s-1 for G205S3 and G206W2, respectively. Considering projection effects due to the inclination angle (), the corrected velocities (Vj,corr) are related as Vj,obs = Vj,corr . We evaluate the mean plane-of-sky separations for consecutive knots of robs = 27 and 25 for G205S3 and G206W2, respectively. These measurements can expressed as the corrected distances (rcorr) using the projection angles, robs = rcorr .
| C18O | SiO | CO | ||||||||
|---|---|---|---|---|---|---|---|---|---|---|
| corrected† | ||||||||||
| Object | HOPS | Vsys | Lobe | V | NSiO | Vmax,CO | NCO | (Ṁ) | FCO | |
| Id | (km s-1) | (km s-1) | (1015 cm-2) | (km s-1) | (deg) | (1017 cm-2) | (10-6M☉/yr) | (10-5M☉km s-1/yr) | ||
| G205S3 | 315 | 9.9 | Blue | 106.7 | 0.37 | 109.5 | 408 | 0.95 | 0.29 | 2.16 |
| (Class I) | Red | 120.1 | 0.22 | 96.3 | 408 | 0.96 | 0.30 | 1.10 | ||
| G206W2 | 399 | 8.8 | Blue | 81.8 | 1.30 | 76.4 | 105 | 1.50 | 2.88 | 9.5 |
| (Class 0) | Red | 103.0 | 1.21 | 76.2 | 105 | 1.34 | 2.66 | 28.84 | ||
Note. — ∗ The mean observed jet-velocities for G205S3 & G206W2 are estimated as Vj,obs 80 and 50 km s-1, respectively.
† Corrected for inclination angles ().
3.2 Outflow shell in CO: Inclination angle
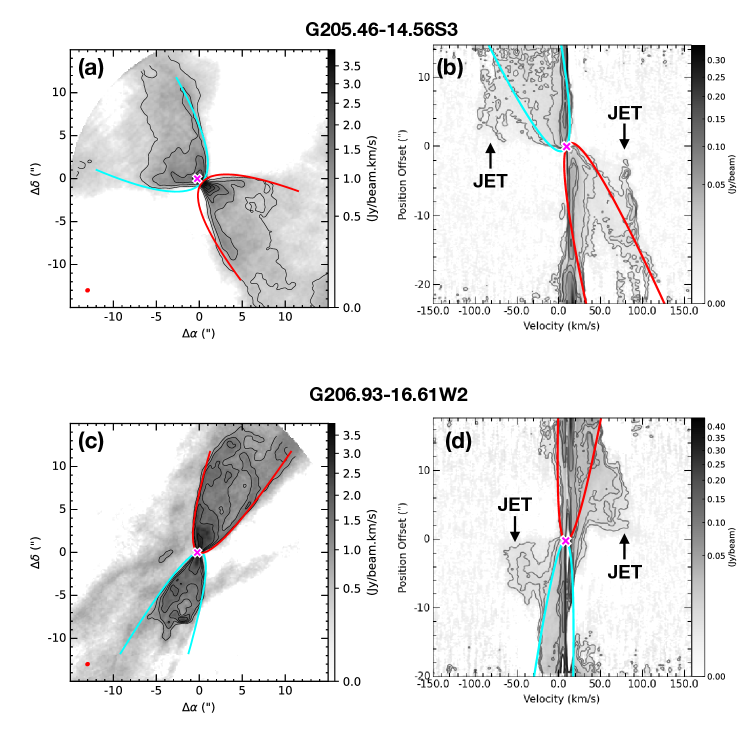
Following the simple analytical model by Lee et al. (2000), we determine the physical structure of the outflow using the CO emission. In this model, the molecular outflow can be represented as a radially expanding parabolic shell driven by the underlying wide-angle wind. In a cylindrical coordinate system, the outflow shell can be described by the equation , where is the outflow axis and is the radial distance from that axis (for a schematic diagram, see Figure 21 by Lee et al., 2000).
Figure 4a displays the CO outflow components of G205S3. We fitted a parabola to the outermost contour closer to the real outflow cavity wall, yielding C = 0.20 and 0.26 for the blue and red lobe, respectively. Using these ‘C’ values, we then fitted parabolas for the low-velocity outflow cavities in the PV diagram (Figure 4b) for the corresponding outflow lobes, which provided best fits of inclination angle, = 40 8 for both the lobes. Notice that the apparent continuum center for this object is shifted in position from the center of the ‘neck’ towards the blue lobe due to the projection effect (Figure 4a). Similarly, we estimated ‘C’ values of 0.90 and 0.80 (Figure 4c) for the blue and red lobes of G206W2, respectively. The best fitted parabolas in the PV diagram for G206W2 provide an inclination of = 10 5 for both lobes (Figure 4d). Here, we note that our fits ignore the likely high-velocity jet-structure (marked as “JET” in Figures 4b, and d) in the PV diagram, since the model of (Lee et al., 2000) mainly describes the low-velocity winds. We did not incorporate with the jet-driven shell model, since no convex spur-like structures were observed in the PV diagram driven by the pulsating jet, as seen in the case of HH 212 (see Figure 13 by Lee et al., 2000).
3.3 Jet mass-loss rate
Assuming optically thin CO emission, beam-averaged CO column densities (NCO) were estimated from the high-velocity channels of each lobe of each source. Here, the high-velocity channels are defined as 65 km s-1 for G205S3 and 45 km s-1 for G206W2 (Figures 2a and c) up to a maximum velocity CO emission (Vmax,CO in Table 1). The lower limits of the high-velocities are adopted from the SiO emission which include most of the jet emission. The mean intensity, integrated over velocity, is then obtained from the whole area encompassed by the jet emission. Assuming a specific excitation temperature of 150 K within the jet, the integrated intensity is converted into NCO.
The beam-averaged H2 column density N is then derived assuming XCO111It might be as small as 10-4. In that case, the mass-loss rates would be increased by a factor of 4 (Hirano et al., 2010). The above estimation can thus be considered as the lower limit for the mass-loss rate.
= NCO/N = 4 10-4 (Glassgold et al., 1991). The jet mass-loss rate (Ṁj) is obtained by assuming the jet as a uniform cylinder of gas flowing at constant density and speed along the jet axis over the transverse beam direction.
Thus, Ṁj within a single jet lobe is determined from
| (1) |
where the mean molecular weight = 2.8 (e.g. Kauffmann et al., 2008), is the mass of the hydrogen atom, and Vj,obs is the observed mean jet velocity (section 3.1). The beam size () transverse to the jet direction is assumed to be the jet width, since the jet is not resolved in the present spatial resolution.
The estimated values of NCO and Ṁj are listed in Table 1, without and with the inclination correction by using Vj,obs and Vj,corr, respectively. With these calculations, the total jet mass-loss rates are 0.59 10-6 and 5.54 10-6 M☉ yr-1 for G205S3 and G206W2, respectively. Such mass-loss rates are quite comparable to other protostars observed in CALYPSO survey (Podio et al., 2021).
3.4 Outflow force
Outflow momentum flux or force (FCO) is a vital ingredient to evaluate the outflow energetics of the protostars. From our limited field-of-view, we first estimated the outflow mass for each channel from the CO emission above 3 using the following equation (Yıldız et al., 2015):
| (2) |
Here, A is the surface area of one pixel and the sum is over all outflow pixels on the k-th channel. We assume a lower mean specific excitation temperature of Tex = 50 K and a less CO abundance ratio of XCO 10-4 for the outflow than that of the jet. The momentum () is calculated by multiplying each channel by the central velocity (Vk) of the associated channel. The momentum is then integrated over all the channels from starting velocity (VCO,min) to maximum velocity (VCO,max) of CO emission over all pixels above 3 emission. Therefore, the FCO can be expressed as (Yıldız et al., 2015):
| (3) |
where is the inclination correction factor and is the length of the red and blueshifted outflow lobes. The measured values of FCO for different lobes are listed in Table 1. The difference in red and blue lobe outflow occurs due to low signal-to-noise ratio, surrounding environment, and smaller field-of-view, which could not trace the whole outflow lobe in either direction and results in the apparently unequal extent of blue and red-shifted lobes. Here, we note that changing Tex by 25 K will change the estimated column densities by 10–20%.
4 Discussion
4.1 SiO emission in Jet
At early protostellar phases, the outflow usually exhibits a higher mass-loss rate and produces higher density material than for later phases. Hence, SiO should be a better tracer of jets from earlier phase protostars, versus later phases (Glassgold et al., 1991; Shang et al., 2006; Cabrit et al., 2007; Shang et al., 2020). Therefore, the detection of SiO emission in jets is most likely indicating a younger phase of the protostars and a higher mass-loss rate. Such SiO emission is observed in several Class 0 protostars e.g., B 335 (Imai et al., 2019; Bjerkeli et al., 2019), HH 212 (Lee et al., 2017a, b), L1157 (Tafalla et al., 2015; Podio et al., 2016), HH 211 (Jhan & Lee, 2016; Lee et al., 2018), and IRAS 04166+2706 (Santiago-García et al., 2009; Tafalla et al., 2017).
We observe SiO emission in the jet of a Class I source, G205S3. We estimated SiO column densities (NSiO) for G205S3 and G206W2 following the method described in section 3.3, and the values are tabulated in Table 1. The SiO abundances (XSiO = XCO NSiO/NCO) turn out to be 1.25 10-6 and 3.5 10-6 for G205S3 and G206W2, respectively. Similar types of SiO abundances were also observed in other protostellar jets in the literature (e.g. Podio et al., 2021). The denser jet of Class 0 source G206W2 is possibly indicating a higher accretion phase than G205S3.
If we compare the integrated brightness temperatures of the SiO maps (Figure 2a and c), G205S3 exhibits a fainter jet ( 200 K.km s-1) than G206W2 ( 1000 K.km s-1). For context, the Class 0 system, HH 212 exhibits an SiO integrated brightness temperature similar to that of G206W2 ( 1000 K.km s-1) (Lee et al., 2017a) and has a high mass-loss rate of 1.1 10-6 M☉ yr-1 (Lee et al., 2015). The fainter SiO jet indicates that G205S3 is arguably at the tail end of its “high-accretion” phase.
Previous high-resolution ALMA observations ( 8 au) of SiO jet near the base of HH 212 unveiled that the protostellar jets removed the residual angular momenta from the innermost part ( 0.05 AU) region (Lee et al., 2017a). The bolometric luminosity (Lbol 9 L☉) of HH 212 suggests that SiO-jet is possibly originating from the dust sublimated zone. From our SiO and CO emission, we estimated SiO-to-CO abundances (X[SiO/CO]) are 410-3 and 910-3 for G205S3 and G206W2, respectively, which suggest that the jet is possibly launched from the dust poor zones within the dust sublimation radius. Moreover, as Class 0 sources evolved to Class I, the X[SiO/CO]) also declined with decreasing mass-loss rate (Tabone et al., 2020). Lower SiO abundance in G205S3 than G208W2 could be related to evolutionary phases, although, a statistically more number of observations of Class 0 and Class I samples are required to constrain a systematic change in X[SiO/CO] with protostellar evolution. Here we note that the SiO line could be optically thick even in the high-velocity jet (e.g., Podio et al., 2021). Since CO is likely optically thin in the jet, the SiO-to-CO abundance ratio derived here could constitute a lower limit to the true SiO-to-CO abundance ratio.
More specifically, comparing the mass-loss rate and X[SiO/CO]) with the astrochemical models of Tabone et al. (2020) (see their Figure 12), the SiO-rich jet of G206W2 is expected to be launched from the dust sublimation zones. The jet of G205S3 could have been launched even from the dust poor zones (dust mass fraction 10-3), which could be the outer boundary of dust sublimation zones. The bolometric luminosities of both G205S3 and G206W2 suggest that their dust sublimation radii are less than 0.1 au (Millan-Gabet et al., 2007). Silicon is possibly released into the gas phase near the base of the jet and can synthesize SiO molecules. (Glassgold et al., 1991). For low-luminosity objects, Si+ recombination and SiO formation occur faster than the photodissociation by the relatively weak ultraviolet radiation from the central protostar, yielding abundant SiO.
To summarize, we surprisingly detected SiO emission in the jet of evolved Class I source G205S3, as usually observed in Class 0 sources (e.g., G206W2, HH 212) in this study as well as in the literature. To validate the true evolutionary phase of G205S3, we investigate the aspects of possible misclassification of G205S3.
4.2 Evolutionary status
4.2.1 Inclination Effect
The spectral classifications through Tbol and of protostars are based on the observed fluxes of the component central source, disk, and envelope, obtained by telescopes with different spatial resolutions. The system’s inclination angle to the line-of-sight, however, constitutes a major uncertainty to the interpretation of the observed fluxes, given the asymmetries inherent in the circumstellar environment (Evans et al., 2009; Furlan et al., 2016). For example, the face-on view of a flattened envelope-disk (or pole-on outflow) yields relatively high infrared fluxes due to less extinction along the line of sight compared with an edge-on view (pole-off outflow) of the same system. Thus, as a result, a Class 0 source may appear to be Class I. Disentangling observed fluxes and inclination angles can be difficult. Fortunately, however, Furlan et al. (2016) modelled the spectral energy distributions (SEDs) of protostars at different inclination angles. Indeed, their models suggest an inclination angle of 50 for both sources. Although the SED-derived inclination angle of G205S3 is close to that measured from the outflow morphology ( 40; Table 1), that of G206W2 is more dissimilar to the inclination angle suggested by its outflow ( 10).
We applied the inclination effect when determining mass-loss rates in Table 1. Nevertheless, the mass-loss rate of G205S3 remains at the lower end of what is expected for Class 0 systems. At present, it is not clear how much the inclination affects the spectral classification of G205S3. It is also difficult to predict how significantly the inclination of 40-60 might expose the central source to the observer, given that the object is still not close to face-on. Therefore, we probe other evidence to validate the evolutionary status of the sources, such as (i) Outflow energetics, (ii) C18O emission and surrounding material, (iii) luminosity vs mm-flux, in the next sections.
4.2.2 Outflow Energetics
Previous observations revealed that a Class I source usually exhibits smaller FCO than Class 0 with similar Lbol (Bontemps et al., 1996; Hatchell et al., 2007; Curtis et al., 2010; Yıldız et al., 2015), which suggest that the Class 0 sources are more energetic than the Class I counterpart. Assuming a CO abundance ratio of 1.2 10-4, Yıldız et al. (2015) obtained the typical values of FCO 2.8 10-5 M☉km s-1/yr for Class I sources, and 6.9 10-4 M☉km s-1/yr for Class 0 sources. We estimated a total of FCO 3.26 10-5 M☉km s-1/yr for G205S3 and 3.834 10-4 M☉km s-1/yr for G206W2 (Table 1). The smaller FCO of G205S3 make its more similar to a Class I source whereas the relatively high value FCO indicate that G206W2 is probably a Class 0 source.
4.2.3 C18O emission and surrounding material
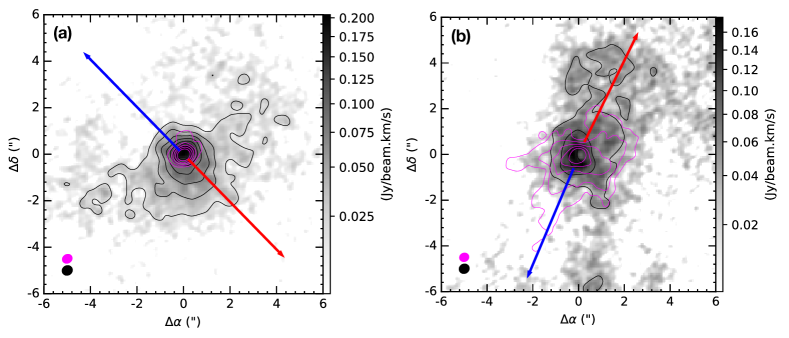
The bolometric temperature ( 180 K) and near-infrared spectral index ( 0.417) suggest that G205S3 is a Class I source (Furlan et al., 2016; Dutta et al., 2020). In addition, if we compare Figure 6a & b, G205S3 displays relatively compact C18O and 1.33 mm continuum emission compared with G206W2. The disk-envelope mass of G205S3, 0.1670.072 M☉, is a few times smaller than G206W2, 0.7710.333 M☉, at the same beam resolution, 140 au (Dutta et al., 2020). Such compact emission in G205S3 is consistent with a smaller envelope surrounding the protostar, with the emission most likely emanating from an evolved disk, consistent with a Class I object. For G206W2, the envelope dominates the observed emission, consistent with a very early, Class 0, stage of protostellar evolution. It is to be noted that the compactness of a source based on continuum or line images (e.g., C18O) largely depends on the sensitivity of the maps.
To extract the size of compact components, we explore the continuum visibility amplitudes (Jy) as a function of distance (k). Following Lee et al. (2008), the visibilities were fitted with two Gaussian components. The compact component of G205S3 has a deconvolved size of 020 and flux 30 mJy. The extended component has a deconvolved size of 228 and flux 47 mJy. Similarly, G206W2 has a compact component of size 060 (flux 100 mJy) and extended component 255 (flux 320 mJy). These sizes of compact component are consistent with 1.3 mm continuum, as estimated by Dutta et al. (2020). From the domain, These results also suggest that G205S3 possesses a relatively compact core, surrounded by a relatively smaller envelope.
Larger scale JCMT observations (beam size 5600 au) also reveal a relatively compact core surrounding the G205S3 (size 0.04 pc; mass 0.860.16 M☉) compared with G206W2 (size 0.06 pc; mass 3.380.15 M☉) (Yi et al., 2018). Here, we remark that the significant amount of gas in the core should be resolved out by the interferometric ALMA observations. Thus, the interpretation of the compact emission distribution may depend somewhat on the spatial resolution of the envelope observations.
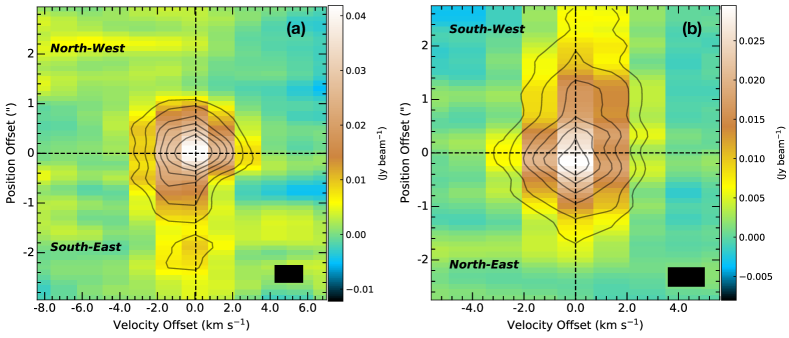
The C18O PV diagram is shown in Figure 8. Similar to Figure 6, G205S3 appears more compact than G206W2 in position-velocity space. The C18O emission is most likely originating from the envelope part of both the sources. No Keplerian rotation profiles are observed clearly on both sources. Higher spatial and velocity resolution data could efficiently determine the Keplerian rotation from the inner part and possibly allow to measure protostellar masses (e.g., Lee et al., 2014), hence could constrain the evolutionary phases of the stellar cores.
4.2.4 Luminosity and Flux correlation
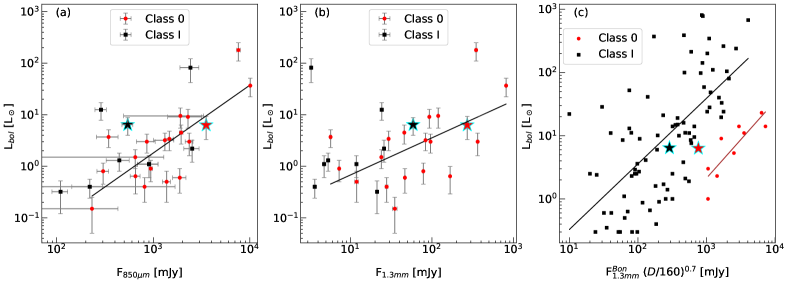
The (sub)millimeter and far-IR fluxes contribute more to Lbol for the Class 0 than that of Class I sources since these fluxes are mostly originating from the envelope and Class 0 should have larger surrounding material. In Figure 10, luminosities of the Class 0 and Class I sources are shown as a function of JCMT 870 m (panel a) and ALMA 1.3 mm (panel b) fluxes for the non-multiple222Luminosity of multiple systems is contributed from the different protostellar components within the common envelope. To reduce the uncertainty in the correlation, we removed the known multiple sources from this analysis. ALMASOP sources (see Dutta et al., 2020). A linear fit only for the Class 0 sources are also shown in both panels. No obvious correlation was found between the Class 0 and Class I sources. One interesting fact is that most of the Class I sources, 75% for 850m (panel a) and 90% for 1.3 mm (panel b), are located above the locus of Class 0 sources (black fitted line). Our studied targets, G205S3 (Class I: Lbol = 6.42.4 L☉) and G206W2 (Class 0: Lbol = 6.33.0 L☉), have similar type of luminosities. However, if we see their location in Figure 10, G205S3 (black star mark) exhibit lower fluxes than G206W2 (red star mark) in both 870 m (panel a) and 1.3 mm emission (panel b). Here, we note that the use of single-dish data (JCMT) would reduce the contamination by a possible massive disk in Class I sources than interferometer (ALMA), and the low-resolution JCMT data could include significant emission from the larger scale cloud emission beyond the envelope and presence of possible multiple sources. Both could potentially affect the interpretation of flux-luminosity correlation.
A similar type of correlations were also studied for 1.3 mm fluxes of Class 0 and Class I sources in Reipurth et al. (1993) and Saraceno et al. (1996). We adopted the single-dish observations of Class 0 and Class I sample from Saraceno et al. (1996) in Figure 10c. We scale down 870m JCMT single-dish observations of G205S3 (black star mark) and G206W2 (red star mark) from Dutta et al. (2020) to 1.3 mm fluxes with spectral index 3.0 and 160 pc distance with a distance correlation from Saraceno et al. (1996). With their limited number of Class 0 sample, G205S3 is quite convincingly located in Class I cluster and G206W2 is located near the Class 0 cluster. Such correlations are quite obvious and could be utilized to distinguish between different spectral classes. More robust single-dish observations at 1.3 mm of a larger sample of Class I and Class 0 sources are needed to constrain the correlation.
4.3 Jets Knots and Accretion Variability
Variable accretion may be due to a circumbinary disk around a close binary, potentially affecting the final mass-budget of the binary and planet formation (Günther & Kley, 2002; Shi et al., 2012). Periodic variations due to pulsed accretion have been observed in T-Tauri binary systems (Mathieu et al., 1997, e.g. DQ Tau:; Jensen et al., 2007, UZ Tau E:). Another Class I, possibly binary, system LRLL 54361 has pulsed accretion with a high-accretion rate of 310-6 M☉/yr (Muzerolle et al., 2013).
The JCMT Transient Survey (Herczeg et al., 2017) has been monitoring Class 0 and I protostars in submillimeter continuum for over four years, with monthly cadence (Johnstone et al., 2018; Lee et al., 2021). G205S3 is a JCMT-monitored variable, with an extrapolated episode timescale yrs, and an implied 10% mass accretion rate variability (Lee et al., 2021). Similar variability properties are found in the mid-Infrared (mid-IR) (Park et al., 2021). G206W2 is not included in the JCMT sample and it is too bright for inclusion in the mid-IR analysis by Park et al. (2021). Extracting the light curve from the NEOWISE catalogue (Wooseok Park, private communication) reveals a long-timescale secular change in brightness.
The G205S3 SiO jet knots imply ejection episodes 54 years apart (rcorr/Vj,corr; section 3.1), longer than the extrapolated accretion event uncovered by the JCMT. A statistical ensemble analysis of the JCMT protostars suggests that these burst events typically occur every 50 years, consistent with the G205S3 knot separation. Repetitive ejection may be related to episodic accretion of dense clumps created by instabilities within a massive disk or magnetorotational instabilities (Machida et al., 2011; Bae et al., 2014; Vorobyov & Basu, 2015). Alternatively, embedded planetesimals or a circumbinary disk due to an unresolved binary might create periodic accretion signatures (Bonnell & Bastien, 1992; Muñoz & Lai, 2016). However, observationally no binary has been detected in the G205S3 system so far. G206W2 exhibits ejections with a 17 year timescale, more closely matching the extrapolated mid-IR light curve. Further high spatial resolution outflow studies and continued mid-IR through submillimeter monitoring are required to better diagnose the underlying accretion-ejection scenarios.
5 Conclusions
We detect SiO jet emission and a moderately high mass-loss rate of 0.59 10-6 M☉ yr-1 for the isolated Class I source, G205S3. These outflow features are more typically seen in younger, Class 0 sources like the representative source G206W2 (Ṁj 5.54 10-6 M☉ yr-1). We estimated a high inclination ( 40) of G205S3. Perhaps G205S3 has been misidentified as Class I from the SED of observed fluxes due to its high inclination. However, the compact 1.3 mm continuum, C18O emission, location in the bolometric luminosity and sub-millimeter fluxes diagram, lower SiO-to-CO abundances ( 410-3) in the jet are consistent with a Class I system. The SiO-to-CO abundances, mass-loss rate, and bolometric luminosity indicate that the jets from both the sources, G205S3 and G206W2, are possibly launched from the innermost dust poor zones. The measured values of outflow forces, FCO 3.26 10-5 M☉km s-1/yr for G205S3 and 3.834 10-4 M☉km s-1/yr for G206W2 infer that G205S3 could be a Class I whereas G206W2 is possibly a Class 0 source. The episodic ejection could be due to the presence of an unknown binary, a planetary companion, or dense clumps in a circumbinary disk, which also could trigger such high accretion. Alternatively, some special environmental conditions or rare orbital parameters may be in play that favors the high accretion rate. Further high-resolution Near-Infrared and ALMA observations are needed.
ALMA
References
- Astropy Collaboration et al. (2013) Astropy Collaboration, Robitaille, T. P., Tollerud, E. J., et al. 2013, A&A, 558, A33, doi: 10.1051/0004-6361/201322068
- Bachiller et al. (2000) Bachiller, R., Gueth, F., Guilloteau, S., Tafalla, M., & Dutrey, A. 2000, A&A, 362, L33. https://arxiv.org/abs/astro-ph/0009439
- Bae et al. (2014) Bae, J., Hartmann, L., Zhu, Z., & Nelson, R. P. 2014, ApJ, 795, 61, doi: 10.1088/0004-637X/795/1/61
- Bally (2016) Bally, J. 2016, ARA&A, 54, 491, doi: 10.1146/annurev-astro-081915-023341
- Bjerkeli et al. (2019) Bjerkeli, P., Ramsey, J. P., Harsono, D., et al. 2019, A&A, 631, A64, doi: 10.1051/0004-6361/201935948
- Bonnell & Bastien (1992) Bonnell, I., & Bastien, P. 1992, ApJ, 401, L31, doi: 10.1086/186663
- Bontemps et al. (1996) Bontemps, S., Andre, P., Terebey, S., & Cabrit, S. 1996, A&A, 311, 858
- Cabrit et al. (2007) Cabrit, S., Codella, C., Gueth, F., et al. 2007, A&A, 468, L29, doi: 10.1051/0004-6361:20077387
- Chen et al. (1995) Chen, H., Myers, P. C., Ladd, E. F., & Wood, D. O. S. 1995, ApJ, 445, 377, doi: 10.1086/175703
- Curtis et al. (2010) Curtis, E. I., Richer, J. S., Swift, J. J., & Williams, J. P. 2010, MNRAS, 408, 1516, doi: 10.1111/j.1365-2966.2010.17214.x
- Dutta et al. (2020) Dutta, S., Lee, C.-F., Liu, T., et al. 2020, ApJS, 251, 20, doi: 10.3847/1538-4365/abba26
- Ellerbroek et al. (2013) Ellerbroek, L. E., Podio, L., Kaper, L., et al. 2013, A&A, 551, A5, doi: 10.1051/0004-6361/201220635
- Evans et al. (2009) Evans, Neal J., I., Dunham, M. M., Jørgensen, J. K., et al. 2009, ApJS, 181, 321, doi: 10.1088/0067-0049/181/2/321
- Furlan et al. (2016) Furlan, E., Fischer, W. J., Ali, B., et al. 2016, ApJS, 224, 5, doi: 10.3847/0067-0049/224/1/5
- Gibb et al. (2004) Gibb, A. G., Richer, J. S., Chandler, C. J., & Davis, C. J. 2004, ApJ, 603, 198, doi: 10.1086/381309
- Glassgold et al. (1991) Glassgold, A. E., Mamon, G. A., & Huggins, P. J. 1991, ApJ, 373, 254, doi: 10.1086/170045
- Günther & Kley (2002) Günther, R., & Kley, W. 2002, A&A, 387, 550, doi: 10.1051/0004-6361:20020407
- Hatchell et al. (2007) Hatchell, J., Fuller, G. A., & Richer, J. S. 2007, A&A, 472, 187, doi: 10.1051/0004-6361:20066467
- Herczeg et al. (2017) Herczeg, G. J., Johnstone, D., Mairs, S., et al. 2017, ApJ, 849, 43, doi: 10.3847/1538-4357/aa8b62
- Hirano et al. (2010) Hirano, N., Ho, P. P. T., Liu, S.-Y., et al. 2010, ApJ, 717, 58, doi: 10.1088/0004-637X/717/1/58
- Hunter (2007) Hunter, J. D. 2007, Computing in Science & Engineering, 9, 90, doi: 10.1109/MCSE.2007.55
- Imai et al. (2019) Imai, M., Oya, Y., Sakai, N., et al. 2019, ApJ, 873, L21, doi: 10.3847/2041-8213/ab0c20
- Jensen et al. (2007) Jensen, E. L. N., Dhital, S., Stassun, K. G., et al. 2007, AJ, 134, 241, doi: 10.1086/518408
- Jhan & Lee (2016) Jhan, K.-S., & Lee, C.-F. 2016, ApJ, 816, 32, doi: 10.3847/0004-637X/816/1/32
- Johnstone et al. (2018) Johnstone, D., Herczeg, G. J., Mairs, S., et al. 2018, ApJ, 854, 31, doi: 10.3847/1538-4357/aaa764
- Kauffmann et al. (2008) Kauffmann, J., Bertoldi, F., Bourke, T. L., Evans, N. J., I., & Lee, C. W. 2008, A&A, 487, 993, doi: 10.1051/0004-6361:200809481
- Lee (2020) Lee, C.-F. 2020, A&A Rev., 28, 1, doi: 10.1007/s00159-020-0123-7
- Lee et al. (2014) Lee, C.-F., Hirano, N., Zhang, Q., et al. 2014, ApJ, 786, 114, doi: 10.1088/0004-637X/786/2/114
- Lee et al. (2015) —. 2015, ApJ, 805, 186, doi: 10.1088/0004-637X/805/2/186
- Lee et al. (2008) Lee, C.-F., Ho, P. T. P., Bourke, T. L., et al. 2008, ApJ, 685, 1026, doi: 10.1086/591177
- Lee et al. (2017a) Lee, C.-F., Ho, P. T. P., Li, Z.-Y., et al. 2017a, Nature Astronomy, 1, 0152, doi: 10.1038/s41550-017-0152
- Lee et al. (2018) Lee, C.-F., Li, Z.-Y., Hirano, N., et al. 2018, ApJ, 863, 94, doi: 10.3847/1538-4357/aad2da
- Lee et al. (2017b) Lee, C.-F., Li, Z.-Y., Ho, P. T. P., et al. 2017b, Science Advances, 3, e1602935, doi: 10.1126/sciadv.1602935
- Lee et al. (2000) Lee, C.-F., Mundy, L. G., Reipurth, B., Ostriker, E. C., & Stone, J. M. 2000, ApJ, 542, 925, doi: 10.1086/317056
- Lee et al. (2021) Lee, Y.-H., Johnstone, D., Lee, J.-E., et al. 2021, arXiv e-prints, arXiv:2107.10750. https://arxiv.org/abs/2107.10750
- Lefèvre et al. (2017) Lefèvre, C., Cabrit, S., Maury, A. J., et al. 2017, A&A, 604, L1, doi: 10.1051/0004-6361/201730766
- Machida et al. (2011) Machida, M. N., Inutsuka, S.-i., & Matsumoto, T. 2011, ApJ, 729, 42, doi: 10.1088/0004-637X/729/1/42
- Mathieu et al. (1997) Mathieu, R. D., Stassun, K., Basri, G., et al. 1997, AJ, 113, 1841, doi: 10.1086/118395
- McMullin et al. (2007) McMullin, J. P., Waters, B., Schiebel, D., Young, W., & Golap, K. 2007, Astronomical Society of the Pacific Conference Series, Vol. 376, CASA Architecture and Applications, ed. R. A. Shaw, F. Hill, & D. J. Bell, 127
- Millan-Gabet et al. (2007) Millan-Gabet, R., Malbet, F., Akeson, R., et al. 2007, in Protostars and Planets V, ed. B. Reipurth, D. Jewitt, & K. Keil, 539. https://arxiv.org/abs/astro-ph/0603554
- Moraghan et al. (2016) Moraghan, A., Lee, C.-F., Huang, P.-S., & Vaidya, B. 2016, MNRAS, 460, 1829, doi: 10.1093/mnras/stw1089
- Muñoz & Lai (2016) Muñoz, D. J., & Lai, D. 2016, ApJ, 827, 43, doi: 10.3847/0004-637X/827/1/43
- Muzerolle et al. (2013) Muzerolle, J., Furlan, E., Flaherty, K., Balog, Z., & Gutermuth, R. 2013, Nature, 493, 378, doi: 10.1038/nature11746
- Park et al. (2021) Park, W., Lee, J.-E., Contreras Peña, C., et al. 2021, arXiv e-prints, arXiv:2107.10751. https://arxiv.org/abs/2107.10751
- Podio et al. (2015) Podio, L., Codella, C., Gueth, F., et al. 2015, A&A, 581, A85, doi: 10.1051/0004-6361/201525778
- Podio et al. (2016) —. 2016, A&A, 593, L4, doi: 10.1051/0004-6361/201628876
- Podio et al. (2021) Podio, L., Tabone, B., Codella, C., et al. 2021, A&A, 648, A45, doi: 10.1051/0004-6361/202038429
- Reipurth et al. (1993) Reipurth, B., Chini, R., Krugel, E., Kreysa, E., & Sievers, A. 1993, A&A, 273, 221
- Robitaille & Bressert (2012) Robitaille, T., & Bressert, E. 2012, APLpy: Astronomical Plotting Library in Python. http://ascl.net/1208.017
- Santiago-García et al. (2009) Santiago-García, J., Tafalla, M., Johnstone, D., & Bachiller, R. 2009, A&A, 495, 169, doi: 10.1051/0004-6361:200810739
- Saraceno et al. (1996) Saraceno, P., Andre, P., Ceccarelli, C., Griffin, M., & Molinari, S. 1996, A&A, 309, 827
- Shang et al. (2006) Shang, H., Allen, A., Li, Z.-Y., et al. 2006, ApJ, 649, 845, doi: 10.1086/506513
- Shang et al. (2020) Shang, H., Krasnopolsky, R., Liu, C.-F., & Wang, L.-Y. 2020, ApJ, 905, 116, doi: 10.3847/1538-4357/abbdb0
- Shi et al. (2012) Shi, J.-M., Krolik, J. H., Lubow, S. H., & Hawley, J. F. 2012, ApJ, 749, 118, doi: 10.1088/0004-637X/749/2/118
- Tabone et al. (2020) Tabone, B., Godard, B., Pineau des Forêts, G., Cabrit, S., & van Dishoeck, E. F. 2020, A&A, 636, A60, doi: 10.1051/0004-6361/201937383
- Tafalla et al. (2015) Tafalla, M., Bachiller, R., Lefloch, B., et al. 2015, A&A, 573, L2, doi: 10.1051/0004-6361/201425255
- Tafalla et al. (2017) Tafalla, M., Su, Y. N., Shang, H., et al. 2017, A&A, 597, A119, doi: 10.1051/0004-6361/201629493
- Vorobyov & Basu (2015) Vorobyov, E. I., & Basu, S. 2015, ApJ, 805, 115, doi: 10.1088/0004-637X/805/2/115
- Wang et al. (2019) Wang, L.-Y., Shang, H., & Chiang, T.-Y. 2019, ApJ, 874, 31, doi: 10.3847/1538-4357/ab07b5
- Yi et al. (2018) Yi, H.-W., Lee, J.-E., Liu, T., et al. 2018, ApJS, 236, 51, doi: 10.3847/1538-4365/aac2e0
- Yıldız et al. (2015) Yıldız, U. A., Kristensen, L. E., van Dishoeck, E. F., et al. 2015, A&A, 576, A109, doi: 10.1051/0004-6361/201424538