Day-ahead Forecasts of Air Temperature
Abstract
Air temperature is an essential factor that directly impacts the weather. Temperature can be counted as an important sign of climatic change, that profoundly impacts our health, development, and urban planning. Therefore, it is vital to design a framework that can accurately predict the temperature values for considerable lead times. In this paper, we propose a technique based on exponential smoothing method to accurately predict temperature using historical values. Our proposed method shows good performance in capturing the seasonal variability of temperature. We report a root mean square error of K for a lead time of days, using daily averages of air temperature data. Our case study is based on weather stations located in the city of Alpena, Michigan, United States.
I Introduction
The weather is a climatic state of the atmosphere that includes wind speed, temperature, and humidity. One of the factors that influences the weather the most is air temperature. The air temperature is an important meteorological parameter that has a direct relationship with other meteorological parameters viz. solar radiation, air humidity, and atmospheric pressure [1]. Due to the increased green house emissions in the past few decades, the air temperature has continued to increase, which is a telltale sign of abnormal climatic change [2]. Climate change is a phenomenon that can affect many departments including health, development, and planning [3]. Therefore, it is of paramount importance to accurately predict the air temperature values. This in turn would assist in understanding its impact on other meteorological parameters. Also, an accurate prediction of temperature will lead to better heating and cooling management of buildings. In this paper, we propose the use of triple exponential smoothing for an accurate prediction of air temperature.
The main contributions of this paper include:
-
•
We present a robust framework to forecast ground-based air temperature values using historical data;
-
•
In the spirit of reproducible research, we share the source-code of our approach to the community for further benchmarking111The code related to this paper is available here: https://github.com/Soumyabrata/temperature-forecasting..
II Prediction of Air Temperature
II-A Related works
In [4], the authors used SARIMA (Seasonal Autoregressive Integrated Moving Average) techniques to predict the monthly mean air temperature in Nanjing city of china from 1951–2017. The forecasting accuracy of the SARIMA model was acceptable for most practical purposes. In [5], the daily temperature between 1980–2010 for four different European cities was forecasted. Murat et al. used Box-Jenkins and Holt Winters seasonal auto regressive integrated moving-average to forecast the future temperature values. In addition to ground-based weather station data, satellite data were also explored to estimate temperature[6] and analyze other atmospheric events [7]. Astsatryan et al. in [6] implemented several neural network architectures to predict the hourly air temperature for up to hours in the Ararat valley of Armenia. Therefore, statistical time series techniques and neural networks offer stable frameworks in forecasting ground-based air temperature.
II-B Our proposed approach
We represent the air temperature values upto time as , , …, . We use triple exponential smoothing technique [8] to model the seasonality of the temperature values. We model the future air temperature values as:
| (1) |
Here, is the season length, is the smooth version, is the linear trend estimate, and is seasonal corrections. In this paper, we benchmark our proposed method with persistence model and average model. The persistence model assumes that the forecasted temperature value is same as latest value, indicated by . The average model forecasts the future temperature value as the average of the historical values, indicated by .
III Results & Discussions
In this section, we provide a detailed analysis of the prediction of temperature using triple exponential smoothing.
III-A Dataset
We obtain the air temperature data from National Oceanic and Atmospheric Administration (NOAA) Climate Data Online service (CDO222https://www.ncdc.noaa.gov/cdo-web/). We choose the weather station that is situated at Alpena Regional Airport, based in Michigan, United States. This data is the daily averaged value of the air temperature measured from the ground-based weather station. We use years worth of data for the period -.
III-B Qualitative evaluation
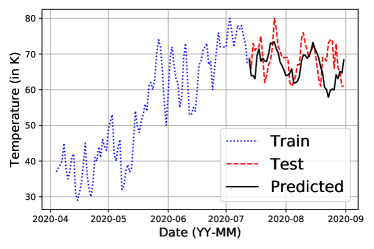
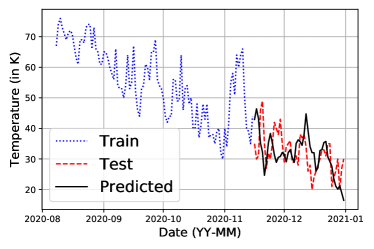
Our proposed method can effectively capture the temperature values and provide a basis for short-term and long-term prediction. Figure 1 provides a subjective evaluation of our proposed method. We observe that our proposed method can capture the peaks and troughs of the variation of the ground-based air temperature. We use historical data of years to forecast the future temperature values. We observe that our proposed technique can accurately capture both the rising and falling trends of temperature values in the two subplots of Fig. 1.
III-C Quantitative evaluation
We compute the root mean square error (RMSE) value between the measured data and the forecasted temperature value in order to provide an objective evaluation of our proposed method. The performance of the temperature prediction is determined by two primary factors – the amount of historical data for training and the length of the lead time. We use historical data of years in our benchmarking experiments to forecast the future temperature values. We perform distinct experiments in order to remove any sampling bias. We benchmark our proposed method with two popular baseline models – persistence model and average model. Table I shows the RMSE value (measured in K) averaged across experiments for the benchmarking methods. We observed that the average model performs the worst. Our proposed method shows a consistent improvement over the persistence model for the varying lead times. The reason for this is due to the fact that temperature values remain fairly constant for shorter lead times. We also observe that the RMSE value gradually increases for larger lead times for all the methods, owing to the gradual propagation of the prediction error.
| Lead Time | Proposed | Persistence | Average |
|---|---|---|---|
| 1 day | 3.141 | 5.320 | 15.979 |
| 2 days | 4.098 | 5.669 | 14.721 |
| 3 days | 4.618 | 6.819 | 15.123 |
| 4 days | 5.322 | 7.835 | 16.055 |
IV Conclusion & Future Work
In this paper, we use triple exponential smoothing method for predicting future temperature values using past temperature data. Our proposed method shows better performance as compared to the other models. In the future, we intend to evaluate the impact of the length of historical data on the forecasts estimates. We also plan to further improve the forecasting performance by incorporating other sensor data in addition to temperature data.
References
- [1] S. Manandhar, S. Dev, Y. H. Lee, S. Winkler, and Y. S. Meng, “Systematic study of weather variables for rainfall detection,” in Proc. IEEE International Geoscience and Remote Sensing Symposium. IEEE, 2018, pp. 3027–3030.
- [2] J. Wu, F. Orlandi, D. O’Sullivan, and S. Dev, “An ontology model for climatic data analysis,” in Proc. IEEE International Geoscience and Remote Sensing Symposium, 2021.
- [3] M. Brandão, M. U. Kirschbaum, A. L. Cowie, and S. V. Hjuler, “Quantifying the climate change effects of bioenergy systems: Comparison of 15 impact assessment methods,” GCB Bioenergy, vol. 11, no. 5, pp. 727–743, 2019.
- [4] P. Chen, A. Niu, D. Liu, W. Jiang, and B. Ma, “Time series forecasting of temperatures using SARIMA: An example from Nanjing,” in IOP Conference Series: Materials Science and Engineering, vol. 394, no. 5. IOP Publishing, 2018, p. 052024.
- [5] M. Murat, I. Malinowska, M. Gos, and J. Krzyszczak, “Forecasting daily meteorological time series using ARIMA and regression models,” International agrophysics, vol. 32, no. 2, 2018.
- [6] H. Astsatryan, H. Grigoryan, A. Poghosyan, R. Abrahamyan, S. Asmaryan, V. Muradyan, G. Tepanosyan, Y. Guigoz, and G. Giuliani, “Air temperature forecasting using artificial neural network for Ararat valley,” Earth Science Informatics, pp. 1–12, 2021.
- [7] S. Manandhar, S. Dev, Y. H. Lee, and Y. S. Meng, “Correlating satellite cloud cover with sky cameras,” in Proc. Progress in Electromagnetics Research Symposium-Fall (PIERS-FALL). IEEE, 2017, pp. 2166–2168.
- [8] S. Manandhar, S. Dev, Y. H. Lee, and S. Winkler, “Predicting GPS-based PWV measurements using exponential smoothing,” in Proc. USNC-URSI Radio Science Meeting (Joint with AP-S Symposium). IEEE, 2019, pp. 111–112.