SDSS-IV MaNGA: an observational evidence of density bounded region in a Lyman- emitter
Abstract
Using Integral Field Unit (IFU) spectroscopy, we present here the spatially resolved morphologies of [SII]6717,6731/H and [SII]6717,6731/[OIII]5007 emission line ratios for the first time in a Blueberry Lyman- emitter (BBLAE) at z 0.047. Our derived morphologies show that the extreme starburst region of the BBLAE, populated by young ( 10 Myr), massive Wolf-Rayet stars, is [SII]-deficient, while the rest of the galaxy is [SII]-enhanced. We infer that the extreme starburst region is density-bounded (i.e., optically thin to ionizing photons), and the rest of the galaxy is ionization-bounded indicating a Blister-type morphology. We find that the previously reported small escape fraction (10%) of Ly photons is from our identified density-bounded Hii region of the BBLAE. This escape fraction is likely constrained by a porous dust distribution.
We further report a moderate correlation between [SII]-deficiency and inferred Lyman Continuum (LyC) escape fraction using a sample of confirmed LyC leakers studied in the literature, including the BBLAE studied here. The observed correlation also reveals its dependency on the stellar mass and gas-phase metallicity of the leaky galaxies. Finally, the future scope and implications of our work are discussed in detail.
1 Introduction
In recent years, a lot of efforts have been made to identify the sources responsible for the re-ionization of the early Universe (z 6). Although active galactic nuclei (AGN) are one of the sources of re-ionization, their contribution remains debated (Madau & Haardt, 2015; Hassan et al., 2018). High redshift, low-mass compact starburst galaxies are now thought to be one of the significant contributors to re-ionization (Ouchi et al., 2009; Mitra et al., 2013; Naidu et al., 2018; Kimm et al., 2019). Besides the identification of ionizing sources, the specific physical processes that allow the escape of ionizing photons from these sources are also poorly understood. Several observational studies in the literature have confirmed that galaxies exhibiting leakage of ionizing photons often show a high value of O32 [OIII]5007/[OII]3727 5 (Nakajima & Ouchi, 2014; Izotov et al., 2018a; Faisst, 2016; de Barros et al., 2016). Hence O32 is broadly used as an important diagnostic for identifying ionizing photon leakers. However, there are several other galaxies that exhibit high O32 value, showing little or no escape of ionizing photons (e.g., Stasińska et al., 2015; Bassett et al., 2019; Nakajima et al., 2020; Izotov et al., 2020a). A similar fact has also been noticed by Katz et al. (2020) in a population of simulated high-redshift galaxies. Such an apparent inconsistency could be explained by introducing the effects of neutral Hi gas porosity in the galaxy’s interstellar medium (ISM) (Gazagnes et al., 2020) and viewing angle (Cen & Kimm, 2015; Nakajima et al., 2020). These effects allow the ionizing photons to escape the galaxy only from a certain region, along a particular line-of-sight, and thereby constraining the escape fraction.
It is thought that an extremely high value of O32 in star-forming galaxies indicates the presence of either an ionization-bounded Hii region with intense ionizing radiation produced in a massive young star formation or a completely ionized density-bounded Hii region or a mixture of both (e.g., Nakajima & Ouchi, 2014; Stasińska et al., 2015; Izotov et al., 2017). A substantial fraction of ionizing photons is expected to escape from the density-bounded regions, as these regions are optically thin to these photons (Pellegrini et al., 2012; Gazagnes et al., 2020). The correlation between Lyman Continuum (LyC) escape fraction () and (Verhamme et al., 2015, 2017), where denotes the peak velocity difference between the blue and the red profiles of Ly emission line, has indirectly provided such evidence. According to this correlation, systems with a high have a low and vice versa. Because the high is caused by resonant scattering of Ly photons in a outflowing neutral gas, the high and low indicate a very low neutral gas column density or the presence of density-bounded regions in a leaky system. Furthermore, a similar interpretation has also been provided using nebular Mgii-doublet emission line, analogous to the resonant Ly (Henry et al., 2018). Recently, a weak positive correlation has been found between [SII]-deficiency and (Wang et al., 2021); where a high [SII]-deficiency can be interpreted as a consequence of the presence of a large optically thin region to ionizing photons (Pellegrini et al., 2012).
It is important to note that the correlations discussed above are derived from spatially integrated observations. These observations cannot exactly discriminate between the spatial extent of a ionization and density-bounded Hii region, or distinguish whether a galaxy hosts a mixture of both. Therefore, the spatially resolved spectroscopy for the identification of a ionization or density-bounded Hii region is a key to better characterize the true nature of leaky, compact star-forming galaxies and route to resolve why some galaxies show high high O32 value and low or no escape of ionizing photons (Bassett et al., 2019; Nakajima et al., 2020; Izotov et al., 2020a). Pellegrini et al. (2011) have demonstrated such an approach by showing the spatially resolved morphologies of optical [SII]6717,6731/H [SII]/H and [SII]6717,6731/[OIII]5007 [SII]/[OIII] emission line ratios for a large number of Hii regions in the Large Magellanic Cloud (LMC) and Small Magellanic Cloud (SMC). In their study, they have shown that [SII]-enhanced ionization fronts in ionization-bounded regions surround both the ionizing massive star cluster as well as the ionized gas. In comparison, the density-bounded regions are characterized by highly ionized gas without surrounding [SII]-enhanced ionization front, indicating the sightlines for the escape of ionizing photons. In a Blister-type morphology (i.e., presence of both the ionization and density-bounded Hii regions), [SII]-enhanced ionization front partially covers both the ionizing massive star clusters and ionized gas, allowing the ionizing radiation to escape only in certain direction. However, such a morphological study in high-redshift compact leaky galaxies is challenging due to various technical/instrumental limitations.
Alternatively, one could study their local counterparts known as Green Pea (GP; at ) and Blueberry (at ) galaxies using spatially resolved spectroscopy. Using data in the Sloan Digital Sky Survey (SDSS; York et al., 2000), GPs and Blueberries were first discovered by Cardamone et al. (2009) and Yang et al. (2017a) respectively. GPs are defined by the color space by 2.5 and -0.2, while for Blueberries, they are 2.5 and -0.2. Both systems are compact ( kpc) and characterized by high EWs of [OIII]5007 emission line ( Å), high ionization parameter (O32 ), low dust extinction (E() ) and low gas-phase metallicity (12 + log(O/H) ). Although, they share common properties, Blueberries are found to have low stellar-mass (M M⊙) and low star formation rate (SFR; M⊙ yr-1) compared to the GPs. Nevertheless, both of these systems show a similar specificSFR (sSFR) lying in the range of yr-1. In the literature, several of these GPs and Bluebrries have now been confirmed as Lyman Continuum (LyC) and Ly leakers showing an escape fraction of ionizing photons in the range of % (Borthakur et al., 2014; Jaskot et al., 2019; Leitherer et al., 2016; Izotov et al., 2016a, b, 2018a, 2018b), like the high-redshift leaky star-forming galaxies (e.g., Shapley et al., 2016; Bian et al., 2017; Vanzella et al., 2018; Fletcher et al., 2019; Meštrić et al., 2020; Marques-Chaves et al., 2021).
Despite the fact that spatially resolved Integral Field Unit (IFU) observations are critical for understanding the mechanisms involved in the leakage of LyC or Ly photons from GPs and Blueberries, there are a very few studies in the literature. According to several of these studies, kinematical feedback and galactic outflows caused by recent starburst events are found as one of the important factors for the leakage of LyC photons in GPs (e.g., Herenz et al., 2017; Micheva et al., 2019; Bosch et al., 2019). Other study has shown that Hii regions with low optical depth are favorable sites for ionizing photons to escape from GPs and Blueberries (e.g., Chisholm et al., 2020; Della Bruna et al., 2021). These limited investigations of GPs and Blueberries using spatially-resolved IFU observations clearly show the necessity for their extension to a large number of confirmed LyC and Ly leakers.
In this paper, we investigate the spatially resolved distribution of ionization and density-bounded Hii regions in a confirmed nearby (z 0.0472) Ly leaker (viz. SHOC 579) using the IFU Mapping Nearby Galaxies at Apache Point Observatory (MaNGA; Bundy et al., 2015) survey. Previously, a detailed study, based on MaNGA IFU observation of SHOC579 by Paswan et al. (2021; under review), reveals that it is a blueberry galaxy and associated with a fain low brightness disk. SHOC 579 was also observed by the Cosmic Origins Spectrograph (COS) on and found to be emitting, % (Jaskot et al., 2019) and it is the only confirmed Ly leaker observed in the MaNGA survey. Our current work, focuses on understanding the physical processes that allow the escape of ionizing photons from GP and Blueberry-like sources. Throughout this work, we assume a set of flat cosmological parameters such as Ho = 70 km s-1 Mpc-1, = 0.3 and = 0.7.
2 Data
The data used in the present work mainly come from the MaNGA survey. This survey is an ongoing optical IFU observing program under the fourth generation of SDSS (SDSS-IV) (Bundy et al., 2015) survey that uses BOSS spectrograph (Smee et al., 2013) mounted on 2.5-m Sloan Foundation Telescope (Gunn et al., 2006) at Apache Point Observatory. The survey targets to observe a total of 10,000 galaxies at redshifts 0.01 0.15 having stellar-mass of 109 M☉ (Wake et al., 2017). The current study is performed based on the galaxy sample released in the MaNGA DR16. It contains a sample of total 4600 galaxies out of which one galaxy (SHOC 579) is found as confirmed Ly leaking Blueberry galaxy, and hence presented here. The details of its selection are presented in Paswan et al. (2021; under review).
The observed raw datacube are first reduced and calibrated using the Data Reduction Pipeline (DRP; Law et al., 2016). In this process, the calibrated spectra have a wavelength coverage of Å with a spectral resolution of 2000. These calibrated datacube are then made as science-ready products using Data Analysis Pipeline (DAP; Westfall et al., 2019). In this study, we use the DAP output products. The DAP uses pPXF code (Cappellari & Emsellem, 2004) with MILES stellar library, having the best set of observed stellar spectra available to date, and models both the stellar continuum and line (emission and absorption) features identified in the spectra from each spaxel of datacube. In this fitting, all the line fluxes are derived with Gaussian model fit after stellar continuum subtraction, and then provided in the form of 2D maps. The above mentioned pipelines (i.e., DRP111For more detail about the DRP, see the link https://svn.sdss.org/public/repo/manga/mangadrp/tags/v1_5_4/ and DAP222For more detail about the DAP, see the link https://sdss-mangadap.readthedocs.io/en/latest/) are SDSS software, and they are mainly designed for reducing and analysing the IFUs data observed in the MaNGA survey.
All the emission line fluxes and their ratios used in the present work are corrected for both the Galactic and internal reddening using their corresponding values. The Galactic reddening is first applied assuming reddening law provided by O’Donnell (1994). The internal reddening correction to the galaxy is applied using line flux ratio of fHα/fHβ assuming the expected theoretical value as 2.86 and the Case-B recombination (Osterbrock & Bochkarev, 1989) with an electron temperature of 104 K and electron density of 100 cm-3. For some spaxels, the line flux ratios of fHα/fHβ are found to be below the expected theoretical value of 2.86. A low value of fHα/fHβ is often associated with intrinsically low reddening, and hence we assumed an internal values as zero for such cases (e.g., Paswan et al., 2018, 2019). Throughout this work, we have used only those emission lines whose signal-to-noise ratio (SNR) is 3.
3 Results and analysis
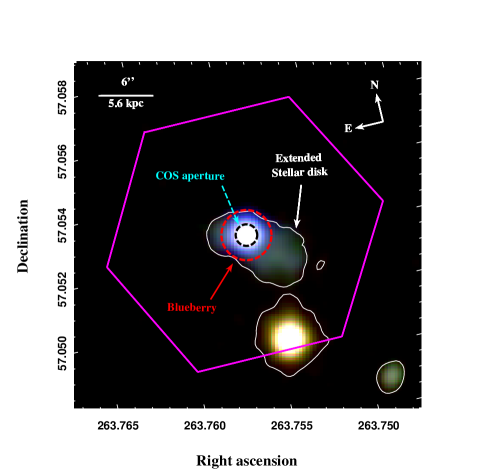
The SDSS -band color composite image of SHOC 579 overlaid with the MaNGA footprint is shown in Fig. 1. The basic properties of SHOC 579 obtained from the literature are listed in Table LABEL:Table1.
| Parameter | Value |
|---|---|
| MaNGA ID | |
| RA | 17h 35m 01.25s |
| DEC | +57d 03m 09s |
| Redshift (z) | 0.0472 |
| Angular Size | 14.4 10.2 (arcsec2) |
| Linear size | 13.3 (kpc) |
| Stellar-mass | 3.15 109 (M⊙)aafootnotemark: |
| SFR | 9.74 0.15 (M⊙ yr-1)bbfootnotemark: |
| 12 + log(O/H) | 8.11 0.07bbfootnotemark: |
| EW(H) | 1442 9 (Å)bbfootnotemark: |
| O32 | 6.8 0.3bbfootnotemark: |
| ccfootnotemark: | 0.12 0.01bbfootnotemark: |
| EW(Ly) | 64 4 (Å)ccfootnotemark: |
| 460 47 (km s-1)ccfootnotemark: | |
| 0.09 0.01ccfootnotemark: |
3.1 Probing density-bounded regions
One of the main results of this work is highlighted in Fig. 2. It represents the spatially resolved morphologies of optical [SII]/H (left panel) and [SII]/[OIII] (right panel) emission line ratios used for distinguishing the density and ionization-bounded Hii regions. It works on the following principle: the enhancement or depletion in the intensity of [SII]6717,6731 relative to H and [OIII]5007 emission lines is a consequence of the interplay between different ionization potentials of So, Ho and O+ elements present in the galaxy’s ISM and ionizing photons emitted from young ( 5 Myr) massive ( 10 M) stars. The ionization potential for producing [SII]6717,6731 (i.e., 10.4 eV) is significantly less than a Rydberg (13.6 eV), implying that much of [SII]6717,6731 emission emerges in the warm and partially ionized region just near and beyond the outer edge of the Hii regions. In those Hii regions which are density-bounded (i.e., optically thin to ionizing photons), such partially ionized [SII] zones appear very weak or even absent (e.g., Pellegrini et al., 2011, 2012). As a result, the intensity of [SII]6717,6731 relative to H and [OIII]5007 emission lines declines significantly.
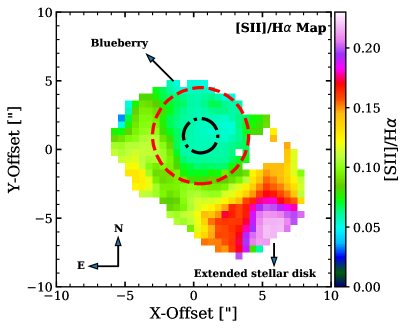
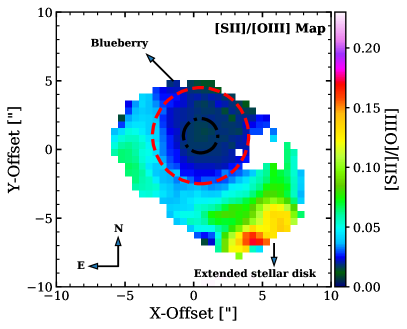
Following the above discussion, we noticed that the intensity of [SII]6717,6731 relative to H and [OIII]5007 emission lines drops to a very low value within the central starburst region (i.e., inside the red circle in Fig. 2), implying this region as density-bounded or optically thin to ionizing photons. In contrast, there is a significant [SII]-enhancement towards South-West of the galaxy and a partial [SII]-enhancement in a arc-like morphology towards the North-East outskirt, implying these regions as as optically thick to ionizing photons (i.e., ionization-bounded regions). The median values of [SII]/H and [SII]/[OIII] ratios in the blueberry region are 0.06 and 0.02, respectively, while they are found as 0.12 and 0.06 (i.e., a factor of enhanced) in the extended disk region. Overall, the morphology of [SII]/H and [SII]/[OIII] emission line ratios suggests that SHOC 579 hosts a Blister-type Hii regions, opened for leakage of ionizing photons only through certain density-bounded/optically-thin region seen towards North and North-West regions.
3.2 Spatially resolved [SII]-deficiency
In this section, we analyse the spatially resolved distribution of [SII]-deficient spaxels in SHOC 579. We follow the definition of [SII]-deficiency as in Wang et al. (2019). In that, [SII]-deficiency is the difference between the observed value of log([SII]/H) and its inferred value obtained using the empirical relation given by:
| (1) | |||
In the above equation, y log([SII]/H) is the reference value for a given observed value of log([OIII]/H). This empirical relation, denoted as a dashed line in Fig. 3, is obtained after fitting a polynomial to the peak density of typical star-forming galaxies falling on the plane defined by log([OIII]/H) and log([SII]/H) line ratios.
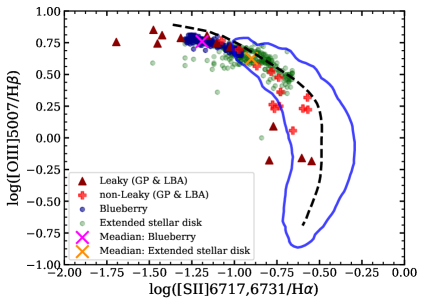
In the left panel of Fig. 3, it can be seen that most of the leaky galaxies are found to be relatively more [SII]-deficient (i.e., located at larger horizontal distance from the reference black dashed line) compared to non-leaky systems which fall inside the solid contour (i.e., closer to reference black dashed line) defined for typical star-forming galaxies. Similarly, we also find spaxels from the density-bounded region in SHOC 579 (blue dots) are consistent with the location of previously known leaky systems, showing a relatively large [SII]-deficiency. In contrast, most of the spaxels belonging to the ionization-bounded regions (green dots; except a few spaxels in the vicinity of blueberry region) fall inside the contour or closer to the reference black dashed line, suggesting that they are relatively less [SII]-deficient compared to spaxels in the blueberry region. Ly photons, unlike LyC photons, can escape through the optically thick or ionization-bounded region because they are involved in a resonant scattering process. However, the density-bounded region allows Ly photons to escape rather easily (Yang et al., 2017b, and references therein). We observe that the COS aperture used in Jaskot et al. (2019) for UV observations only covers the density-bounded region of SHOC 579 (see Fig. 1). This suggests that the observed escape of Ly photons by Jaskot et al. (2019) was from a straightforward route, with little to no impediment to the leakage process.
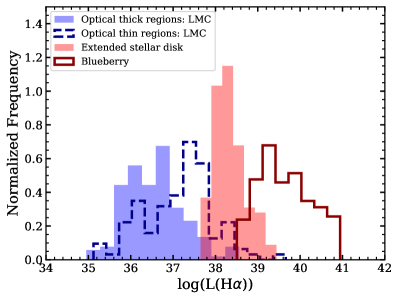
The right panel in Fig. 3 shows the distribution of H luminosity of optically thin (blue dashed line) and thick (blue filled) Hii regions in LMC (Pellegrini et al., 2012). This distribution is bimodel in nature, indicating that the H luminosity distribution for optically thick Hii regions peaks at lower value than those of optically thin Hii regions. A similar bimodal distribution of H luminosity is also observed in SHOC 579, where the luminosity for density-bounded (i.e., optically thin) Hii regions (solid red line) peaks at higher luminosity compared to the optically thick Hii regions (red filled). These results suggest that the H luminosity of density-bounded Hii region in general dominates over the luminosity of ionization-bounded Hii region. This is most likely due to the presence of a relatively stronger starburst event in the density-bounded region.
3.3 Reconciling the observed with the spatial dust extinction
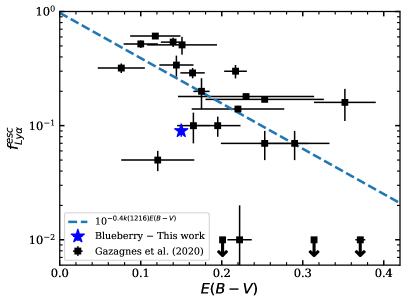
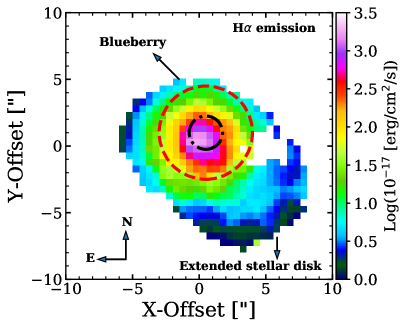
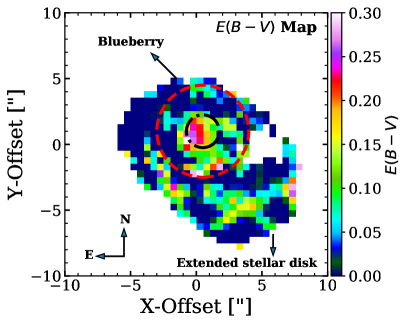
Since SHOC 579 is dominated by a strong starburst (SFR 17 M⊙ yr-1) with a moderate ionization parameter (O32 7; see Sect. 5), the physical conditions are therefore likely to favour a huge production of Ly photons that could easily escape through the density-bounded region. However, the attenuation of Ly photons due to dust extinction plays a crucial role in determining its escape fraction. As can be seen in Fig. 4, decreases as nebular dust extinction increases. Moreover, similar evidence can be found in other studies published in the literature (e.g., Atek et al., 2009; Hayes, 2015; Yang et al., 2017b). We measure an average for SHOC 579 within the COS aperture as shown in Fig. 2. Based on this value of dust extinction and the fitted attenuation relation by Gazagnes et al. (2020), as shown in Fig. 4, we expect 20% for our galaxy. This expected value of is also consistent with the Ly escape fraction obtained using empirical relation that uses measured (Izotov et al., 2020b, see Eq. 5), where for the galaxy in the present study is used as 460 km s-1 (see Table LABEL:Table1). However, the directly measured 10% (Jaskot et al., 2019) falls below these expected values (see Fig. 4). We explain this observed disparity using our spatially resolved H emission line map (corrected for dust extinction) and its related dust extinction map as shown in the left and right panels of Fig. 5, respectively. The density-bounded region covered under the COS-aperture (i.e., the [SII]-deficit region within the black circle depicted in Fig. 2) exhibits a strong H line emission, suggesting the predicted location of massive Ly photon generation. This region, however, is dominated in part by a considerable amount of dust with a colour excess of ( 0.15 on an average). On the spatially resolved scale, it can be seen that the West side of the COS aperture seems to have , whereas the East side have . A large number of Ly photons can be destroyed by such a dust distribution, and only a small proportion of generated Ly photons can escape via the porous dusty region (i.e., probably from the West side of the COS aperture). Thus, previously reported 10% by Jaskot et al. (2019) is likely to be limited by the porous dust distribution in SHOC 579. This implies that the dust porosity can constrain the escape fraction of Ly photons, similar to how the neutral gas porosity constrains the escape fraction of LyC photons (Gazagnes et al., 2020).
3.4 Correlation between LyC escape fraction and [SII]-deficiency
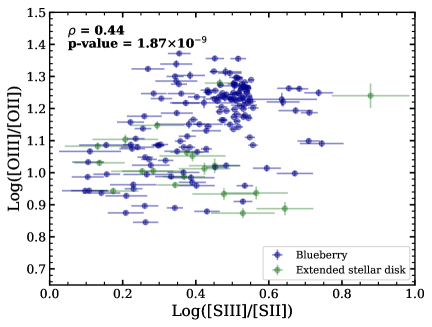
Based on evidence found in the literature (Pellegrini et al., 2011, 2012; Wang et al., 2019), including the current work, it is now clear that [SII]-deficient Hii regions are favourable sites for ionizing photon escape. Therefore, using a sample of 18 confirmed Ly and LyC leaky GPs/Blueberries as shown in Fig 6, we explore the relation between and [SII]-deficiency. The confirmed sample of leaky sources is drawn from the literature (e.g., Izotov et al., 2016a, b, 2018a, 2018b; Wang et al., 2019; Izotov et al., 2020a, 2021). Some galaxies in this sample, including SHOC 579, do not have a direct measurement of but the Ly lines with are observed. The empirical relation between and reported by Izotov et al. (2018b) is used to infer the values of for such sources. The inferred for SHOC 579 is 1.94 0.05 %. Out of 18 sources, a total of 6 sources have both the directly measured and inferred values of . The top two panels in Fig. 6 are shown for galaxies whose is inferred using , whereas the bottom two panels are shown for galaxies with direct measurements.
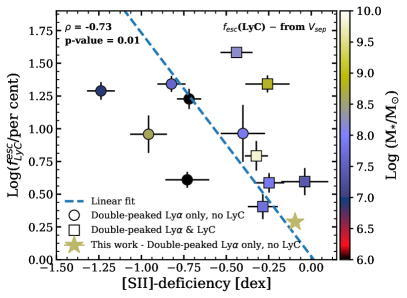
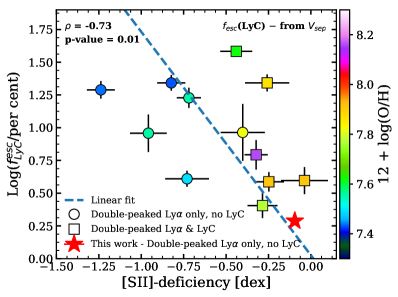
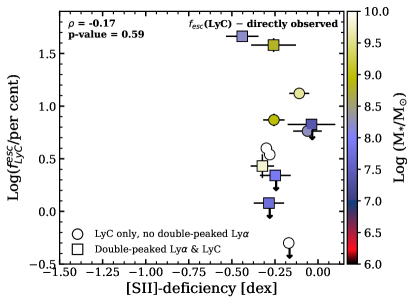
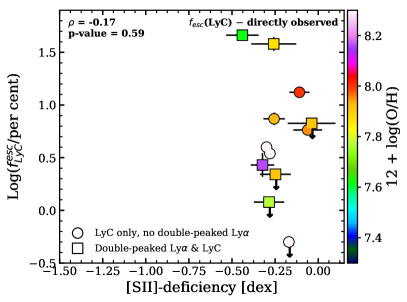
A moderately significant correlation between inferred and [SII]-deficiency can be found in the top panels of Fig. 6, suggesting that galaxies with higher [SII]-deficiency have larger . Interestingly, the inferred 2% for a measured [SII]-deficiency in SHOC 579 is in accordance with this observed correlation. On the other hand, we see significant scatter when directly measured is made to correlate with [SII]-deficiency (see bottom panels of Fig. 6). This is likely due to a very narrow range of [SII]-deficiency measured for leaky galaxies in our sample. It is possible that we might see an improved correlation after increasing the sample size having a broad dynamic range of [SII]-deficiency. In fact, Wang et al. (2021) have recently demonstrated a slightly improved correlation between directly observed and [SII]-deficiency using a sample of 35 low- LyC leakers. In their galaxy sample, although the values of [SII]-deficiency vary between 0.1 and -0.8, with 6 sources lying between -0.6 and -0.8; their derived correlation is still weak. In order to have a better understanding, a large sample of confirmed LyC leakers, in particular, at higher end of [SII]-deficiency is perhaps required. Furthermore, we notice that a substantial scatter in the correlation is seen at lower end of [SII]-deficiency (i.e., between -0.4 and 0) in our sample, consistent with the scatter observed by Wang et al. (2021, see their Fig. 4). Following their argument presented in Wang et al. (2021, see their Fig. 5), it appears that less [SII]-deficient galaxies would have a large covering fraction of neutral Hi gas surrounding the ionized gas. In such a ISM structure, LyC photons are expected to escape via low-column-density channels or hole(s) (e.g., Borthakur et al., 2014; Rivera-Thorsen et al., 2015; Gazagnes et al., 2018). In addition, the escape of LyC photons depends on observer’s line-of-sight. Such a scenario suggests that an amount of observed escape fraction of LyC photons in galaxies with low [SII]-deficiency would be highly uncertain. Therefore, the observed substantial scatter in the correlation, at lower end of [SII]-deficiency, might be attributable to line-of-sight variation caused by porous Hii regions. In the literature, a few observational studies of galaxies showing high O32 but low have already been found to be consistent with the hypothesis of line-of-sight variation (e.g., Steidel et al., 2018; Nakajima et al., 2020). Additionally, the observed scatter might also be attributable to anisotropically escaping LyC photons (e.g., Zastrow et al., 2011; Cen & Kimm, 2015).
In all panels of Fig. 6, we bring the stellar mass and gas-phase metallicity of the leaky systems while discussing these correlations. We find that and [SII]-deficiency correlation is unlikely to depend on the host stellar mass, consistent with earlier findings (Izotov et al., 2021; Saxena et al., 2021). Moreover, this also supports the finding of Wang et al. (2021) that there is no link between [SII]-deficiency and stellar-mass. However, the observed correlation (upper panels of Fig. 6) appears to be dependent on the gas-phase metallicity of leaky systems. Sources with lower gas-phase metallicity have higher and higher [SII]-deficiency. This inference indeed supports the fact that compact metal-poor starburst galaxies are one of the favourable sources contributing to the reionization of the early Universe (e.g. Ouchi et al., 2009; Mitra et al., 2013; Naidu et al., 2018; Kimm et al., 2019).
4 Wolf-Rayet feature and physical conditions of ionized gas
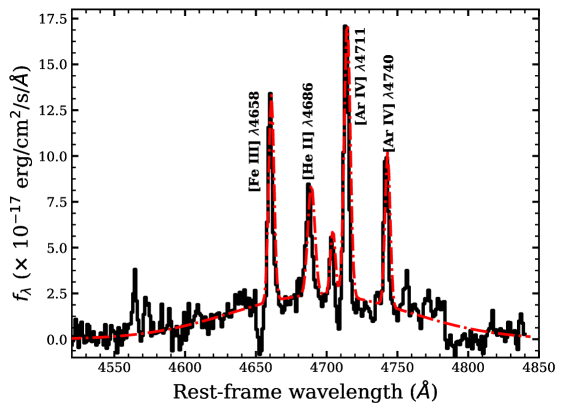
In Fig. 7, we show the detection of a broad Wolf-Rayet (WR) bump feature along with nebular He ii4686, [Fe iii] 4658, and [Ar iv] 4711,4740 emission lines, derived after stacking all the spectra from extreme starburst region (i.e., inside the red circle) of the BBLAE in SHOC 579. The presence of the WR feature indicates a substantial population of WR stars and a fairly recent ( Myr) intense starburst event in this region. No WR feature is detected in the extended stellar disk region. The nebular He ii4686 line, which is sometimes seen in conjunction with WR features, shows the presence of relatively hard ionizing radiation, probably produced by young and hot WR stars or other mechanisms (cf. Shirazi & Brinchmann, 2012). So far, there seems to be no indication for the causal relation between the presence/absence of nebular He ii and escape of LyC photons (e.g. Guseva et al., 2020).
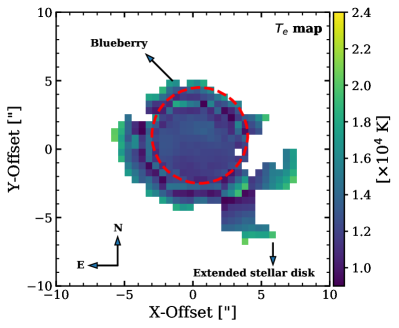
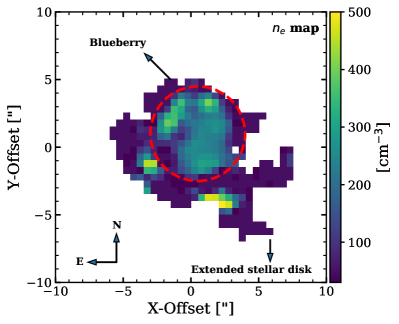
Fig. 8 depicts the spatially resolved maps of electron temperature (; left panel) and density (; right panel) of the ionized gas in SHOC 579. Here was estimated using the temperature diagnostic ratio of [OIII]4959+[OIII]5007/[OIII]4363 by utilising the five-level program in the iraf nebular task (Shaw & Dufour, 1995), because the weak auroral [OIII]4363 emission line is observed from many spaxels of the galaxy. The electron density in each spaxel (for their estimated in this work) is then calculated using the same five-level algorithm and the nebular [SII]6717,6731 doublet emission line. As seen in Fig. 8, in comparison to the rest of the galaxy (i.e., out side the circle), the density-bounded region within the circle has a considerably higher electron density. The higher electron density, particularly in the density-bounded Hii region, is consistent with typical electron density obtained in prior low-redshift LyC/Ly leakers such as GPs (e.g., Izotov et al., 2020a; Guseva et al., 2020). In the ionization-bounded Hii region (i.e., extended disk outside the circle), it is typical ( 100 cm-3), comparable to that observed in normal star-forming galaxies (e.g., Guseva et al., 2011; Izotov & Thuan, 2011; Paswan et al., 2018, 2019).
5 [Siii]/[Sii]: a proxy of ionization parameter
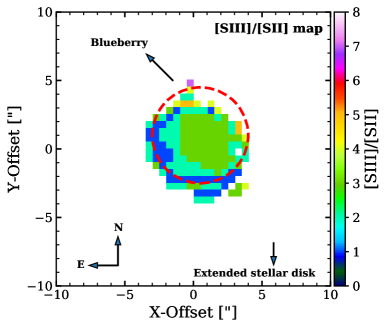
[SIII]9069,9532/[SII]6717,6731 S32 is used as a proxy for the ionization parameter (e.g., Diaz et al., 1985; Sanders et al., 2019), like O32 parameter (e.g., Baldwin et al., 1981; Alloin et al., 1978). While previous studies have used integrated spectra recorded within the slit aperture, we investigate their spatially resolved behaviour in our BBLAE as shown by the 2D map in Fig. 9 (see left panel). The [SIII]9069,9532 emission line fluxes used for this map are estimated using our own fit to the emission line profiles rather than pPXF (see Appendix A for more details). It was not feasible to derive S32 map throughout the extended stellar disc region due to low SNR ( 3) of [SIII]9069,9532 emission lines (except for a few spaxels on the margins of the circle depicted in the left panel of Fig. 9). However, [SIII]9069,9532 emission line can be clearly seen in the density-bounded/starburst region (within dashed circle). We note that the values of S32 parameter are higher in the inner region of the starburst event than the outer region, consistent with O32 map as shown by Paswan et al. (2021; under review).
The spatially resolved connection between S32 and O32 parameters is shown in Fig. 9 (right panel), and it indicates a weak positive correlation (). This finding, on the other hand, suggests a tendency of rising O32 with increasing S32, which is consistent with prior research (e.g., Diaz et al., 1985; Sanders et al., 2019). In Fig. 9 (left panel), most of the spaxels in the Blueberry region of the galaxy have a value of S32 2, equating to an value of O32 10 or so. This inference further implies that starburst region in our BBLAE indeed shows a intense and hard radiation field, consistent with the high O32 parameter and the detection of nebular Heii 4686 emission line.
6 Discussion
In the present work, we investigate the presence of density or ionization-bounded Hii regions, or a mixture of both, in a confirmed LAE, SHOC 579, at 0.047. These regions are potential locations for leakage, non-leakage, or partial leakage of ionizing photons. In our investigation, we construct the spatially resolved morphologies of optical [SII]/H and [SII]/[OIII] emission line ratios using MaNGA IFU data and provide insights into the structural state of galaxy’s ISM that in turn plays a critical role in interpreting the leakage of ionizing and Ly photons from SHOC 579. We found that only the central starburst region in the galaxy (as shown by the red circle in Fig. 2) is [SII]-deficient (see the left panel of Fig. 3), i.e. density-bounded, and thus is likely to leak ionizing photons. The rest of the galaxy is ionization-bounded, i.e. [SII]-enhanced, and unlikely to leak ionizing photons. Our analysis indicates that the previously reported small escape fraction of Ly photons of 10 % is from density-bounded Hii region in SHOC 579, and it is mostly constrained by a significant amount of porous dust. Furthermore, we also find a moderately significant correlation between inferred through and [SII]-deficiency.
It is well-understood that starburst regions, escaping Ly photons, are often associated with dust (Atek et al., 2009; Hayes, 2015; Runnholm et al., 2020). The distribution of these dust around starburst regions may be dense and/or porous, as also seen in the present study (see Fig. 5). In future, it would be interesting to investigate the relationship between dust covering fraction and using IFU-based spectroscopic observations of a larger sample of confirmed Ly emitter, similar to the work published by Gazagnes et al. (2020) who showed the correlation between covering fraction of Hi gas and for leaky system. A similar argument may also be used to limit the escape fraction of ionizing photons, because dust also decreases the (e.g., see Fig. 12 in Gazagnes et al., 2020). Furthermore, it is worth noting that the aperture used in the HST/COS-observation covers only a part of the [SII]-deficient or density-bounded region in SHOC 579. Aperture size limitation and positioning across the expected region of escaping Ly or LyC photons may result in a lower limit to the escape fraction of these photons. Therefore, identifying the spatial location of density and ionization-bounded Hii regions in potential LAEs and leaky systems, before planning the UV-observations, might be a crucial step forward to better constraining the Ly and LyC escape fraction.
In the literature, previously reported correlations between and different observable parameters such as O32 (Yang et al., 2017b; Izotov et al., 2021), of resonant Ly (Verhamme et al., 2015, 2017; Izotov et al., 2021) and nebular Mgii-doublet emission line (Henry et al., 2018), dust extinction (Yang et al., 2017b; Gazagnes et al., 2020) and [SII]-deficiency (Wang et al., 2021) have been performed using spatially unresolved observations of leaky systems with slit-based aperture. Note that all these correlations show significant scatter. Perhaps, a part of the scatter is contributed due to spatially unresolved observations that show some impacts owing to global measurements of aforementioned observable parameters. The spatially resolved studies of these correlations with IFU observations might reduce the scatter.
In the recent past, there has been a significant progress in our understanding of the leaky systems, especially when IFU observations are used. Herenz et al. (2017) found ionised gas filaments in the circumgalactic halo of SBS 0335-52E, an extremely metal-poor starburst galaxy, using VLT/MUSE IFU data. They claim that the filaments discovered are potential pathways for LyC photons to escape. Furthermore, using IFU-like fiber-fed Potsdam Multi-Aperture Spectrophotomete (PMAS) observations, Micheva et al. (2019) investigated the kinematics and physical characteristics of the ionised gas in the nearest LyC emitter galaxy, Mrk 71/NGC 2366. They demonstrated that kinematic feedback from the starburst event causes an optically thin region, implying that the escape fraction of LyC photons along the gas outflows is non-zero. Della Bruna et al. (2021) recently used VLT/MUSE data to depict the ISM state in NGC 7793 at 10 pc scale. Using the S[II]/[OIII] ratio as a proxy for the optical depth of the gas, they constrain the escape fraction of ionizing photons after categorising Hii regions into ionization bounded or featuring channels of optically thin gas, similar to our current work.
In light of the above, Chisholm et al. (2020) published a spatially resolved morphological analysis of the Mgii-doublet emission line ratio ( = ) in a leaky GP galaxy, J1503+3644, at z = 0.36, using data from the Keckii telescope’s image slicer Integral Field Spectrograph (IFS). The optically thin Hii regions responsible for the reported of 6% were mapped using the values. Note that the Mgii-doublet emission line ratio-based morphology is only applicable for sources with redshifts greater than 0.2, as most optical ground-based spectroscopic surveys (e.g., MaNGA, MUSE/VLT, and KCWI Keck, among others) have wavelength coverage ranging from 3300 to 10000 Å. However, for low-redshift sources such as Blueberries (0.02 z 0.05) and GPs at z 0.2, the [SII]-deficiency based morphological method may be a better indirect diagnostic for detecting LyC leakers. It may also be used to study high-redshift starburst galaxies using infrared (IR) spectroscopic data, in addition to low-redshift sources. However, due to the significant contribution of sky background in the IR waveband, IR spectroscopy is difficult and needs either a large aperture ground or spaced-based telescope. In this context, the IR WFC3/G141 slitless grism observations in the 3D- survey (see, Momcheva et al., 2016) might be beneficial for examining the [SII]-deficiency in high redshift compact starburst galaxies. Similarly, data from upcoming mega space and ground-based observing facilities, such as (JWST), TMT and ELT, may be essential for distant starburst galaxies in the early Universe.
7 Conclusions
The main conclusions of this study are as follows.
-
•
SHOC 579 hosts a mixture of density and ionization-bounded Hii regions indicating a Blister-type morphology. Our analysis indicates that the Ly photons (Jaskot et al., 2019) are likely to have escaped from the density-bounded region that we have identified in this galaxy.
-
•
Our analyses show that that dust porosity or dust covering fraction is an important factor in limiting the escape of Ly photons.
-
•
Using a sample of confirmed low-redshift LyC leakers, including SHOC 579, we found a moderate correlation between [SII]-deficiency and inferred . This correlation may become stronger in the future, when a large sample of confirmed LyC leakers is used with [SII]-deficiency having a large dynamic range.
-
•
We also found that the correlation mentioned above has a dependency on the gas-phase metallicity of LyC leakers. This suggests that metal-poor leakers are seen with a relatively high [SII]-deficiency and , regardless of their stellar masses.
Appendix A [SIII] 9069,9532 emission line fitting
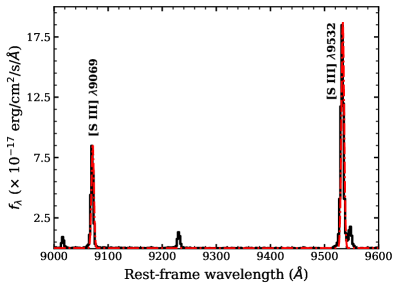
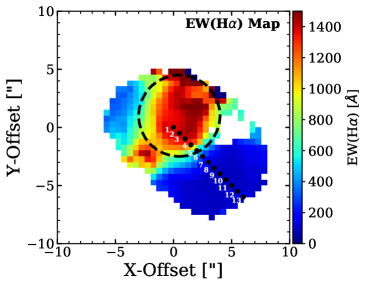
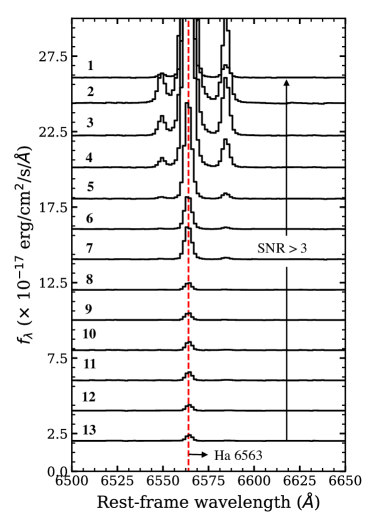
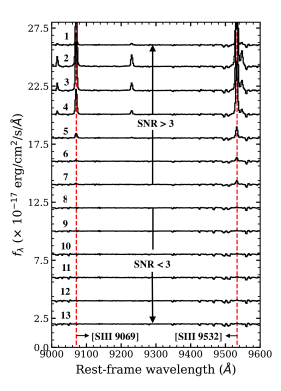
This section explains the estimation of [SIII] 9069,9532 emission line flux used in the present study. Since the MILES stellar library fits only optical spectrum in the wavelength range of Å, we therefore performed our own Gaussian model fit to the [SIII] 9069,9532 emission line after subtracting the local stellar continuum flux estimated from the line-free region (continuum) on both sides of the emission lines. Thereafter, the emission line flux is directly measured using area under the fitted Gaussian models. In our fitting process, we considered only those galaxy spaxels whose [SIII] 9069,9532 emission line has good detection (i.e., SNR 3). For example, Fig. 10 (top left panel) shows our typical fit to the [SIII] 9069,9532 emission line at central (X = 37, Y = 37) spaxel of the galaxy. This figure also indicates that the wavelength region around [SIII] 9069,9532 emission line is free from the sky-lines contamination. We notice that a clear detection of [SIII] 9069,9532 emission line is mainly made around starburst region marked by the circle in H EW-map (see top right panel of Fig. 10), while it is not detected due to low SNR (i.e., SNR 3; except a few spaxels) in the extended disk region i.e., outside the circle. In Fig. 10, this argument is well-explained by displaying a set of spectra of H (bottom left) and [SIII] 9069,9532 (bottom right) emission lines along the radial direction from the center to outer spaxels (marked in the top right panel) of the galaxy. Due to non-detection of [SIII] 9069,9532 emission line, it could not be possible to construct the map of S32 parameter (see Fig. 9) in the extended stellar disk of the galaxy.
References
- Alexandroff et al. (2015) Alexandroff, R. M., Heckman, T. M., Borthakur, S., Overzier, R., & Leitherer, C. 2015, ApJ, 810, 104, doi: 10.1088/0004-637X/810/2/104
- Alloin et al. (1978) Alloin, D., Bergeron, J., & Pelat, D. 1978, A&A, 70, 141
- Atek et al. (2009) Atek, H., Kunth, D., Schaerer, D., et al. 2009, A&A, 506, L1, doi: 10.1051/0004-6361/200912787
- Baldwin et al. (1981) Baldwin, J. A., Phillips, M. M., & Terlevich, R. 1981, PASP, 93, 5, doi: 10.1086/130766
- Bassett et al. (2019) Bassett, R., Ryan-Weber, E. V., Cooke, J., et al. 2019, MNRAS, 483, 5223, doi: 10.1093/mnras/sty3320
- Bian et al. (2017) Bian, F., Fan, X., McGreer, I., Cai, Z., & Jiang, L. 2017, ApJ, 837, L12, doi: 10.3847/2041-8213/aa5ff7
- Borthakur et al. (2014) Borthakur, S., Heckman, T. M., Leitherer, C., & Overzier, R. A. 2014, Science, 346, 216, doi: 10.1126/science.1254214
- Bosch et al. (2019) Bosch, G., Hägele, G. F., Amorín, R., et al. 2019, MNRAS, 489, 1787, doi: 10.1093/mnras/stz2230
- Bundy et al. (2015) Bundy, K., Bershady, M. A., Law, D. R., et al. 2015, ApJ, 798, 7, doi: 10.1088/0004-637X/798/1/7
- Cappellari & Emsellem (2004) Cappellari, M., & Emsellem, E. 2004, PASP, 116, 138, doi: 10.1086/381875
- Cardamone et al. (2009) Cardamone, C., Schawinski, K., Sarzi, M., et al. 2009, MNRAS, 399, 1191, doi: 10.1111/j.1365-2966.2009.15383.x
- Cen & Kimm (2015) Cen, R., & Kimm, T. 2015, ApJ, 801, L25, doi: 10.1088/2041-8205/801/2/L25
- Chisholm et al. (2020) Chisholm, J., Prochaska, J. X., Schaerer, D., Gazagnes, S., & Henry, A. 2020, arXiv e-prints, arXiv:2008.06059. https://arxiv.org/abs/2008.06059
- de Barros et al. (2016) de Barros, S., Vanzella, E., Amorín, R., et al. 2016, A&A, 585, A51, doi: 10.1051/0004-6361/201527046
- Della Bruna et al. (2021) Della Bruna, L., Adamo, A., Lee, J. C., et al. 2021, arXiv e-prints, arXiv:2104.08088. https://arxiv.org/abs/2104.08088
- Diaz et al. (1985) Diaz, A. I., Pagel, B. E. J., & Wilson, I. R. G. 1985, MNRAS, 212, 737, doi: 10.1093/mnras/212.3.737
- Faisst (2016) Faisst, A. L. 2016, ApJ, 829, 99, doi: 10.3847/0004-637X/829/2/99
- Fletcher et al. (2019) Fletcher, T. J., Tang, M., Robertson, B. E., et al. 2019, ApJ, 878, 87, doi: 10.3847/1538-4357/ab2045
- Gazagnes et al. (2020) Gazagnes, S., Chisholm, J., Schaerer, D., Verhamme, A., & Izotov, Y. 2020, A&A, 639, A85, doi: 10.1051/0004-6361/202038096
- Gazagnes et al. (2018) Gazagnes, S., Chisholm, J., Schaerer, D., et al. 2018, A&A, 616, A29, doi: 10.1051/0004-6361/201832759
- Gunn et al. (2006) Gunn, J. E., Siegmund, W. A., Mannery, E. J., et al. 2006, AJ, 131, 2332, doi: 10.1086/500975
- Guseva et al. (2011) Guseva, N. G., Izotov, Y. I., Stasińska, G., et al. 2011, A&A, 529, A149, doi: 10.1051/0004-6361/201016291
- Guseva et al. (2020) Guseva, N. G., Izotov, Y. I., Schaerer, D., et al. 2020, MNRAS, 497, 4293, doi: 10.1093/mnras/staa2197
- Hassan et al. (2018) Hassan, S., Davé, R., Mitra, S., et al. 2018, MNRAS, 473, 227, doi: 10.1093/mnras/stx2194
- Hayes (2015) Hayes, M. 2015, PASA, 32, e027, doi: 10.1017/pasa.2015.25
- Henry et al. (2018) Henry, A., Berg, D. A., Scarlata, C., Verhamme, A., & Erb, D. 2018, ApJ, 855, 96, doi: 10.3847/1538-4357/aab099
- Herenz et al. (2017) Herenz, E. C., Hayes, M., Papaderos, P., et al. 2017, A&A, 606, L11, doi: 10.1051/0004-6361/201731809
- Izotov et al. (2016a) Izotov, Y. I., Orlitová, I., Schaerer, D., et al. 2016a, Nature, 529, 178, doi: 10.1038/nature16456
- Izotov et al. (2016b) Izotov, Y. I., Schaerer, D., Thuan, T. X., et al. 2016b, MNRAS, 461, 3683, doi: 10.1093/mnras/stw1205
- Izotov et al. (2018a) Izotov, Y. I., Schaerer, D., Worseck, G., et al. 2018a, MNRAS, 474, 4514, doi: 10.1093/mnras/stx3115
- Izotov et al. (2020a) —. 2020a, MNRAS, 491, 468, doi: 10.1093/mnras/stz3041
- Izotov et al. (2020b) —. 2020b, MNRAS, 491, 468, doi: 10.1093/mnras/stz3041
- Izotov & Thuan (2011) Izotov, Y. I., & Thuan, T. X. 2011, ApJ, 734, 82, doi: 10.1088/0004-637X/734/2/82
- Izotov et al. (2017) Izotov, Y. I., Thuan, T. X., & Guseva, N. G. 2017, MNRAS, 471, 548, doi: 10.1093/mnras/stx1629
- Izotov et al. (2021) Izotov, Y. I., Worseck, G., Schaerer, D., et al. 2021, MNRAS, 503, 1734, doi: 10.1093/mnras/stab612
- Izotov et al. (2018b) —. 2018b, MNRAS, 478, 4851, doi: 10.1093/mnras/sty1378
- Jaskot et al. (2019) Jaskot, A. E., Dowd, T., Oey, M. S., Scarlata, C., & McKinney, J. 2019, ApJ, 885, 96, doi: 10.3847/1538-4357/ab3d3b
- Katz et al. (2020) Katz, H., Ďurovčíková, D., Kimm, T., et al. 2020, MNRAS, 498, 164, doi: 10.1093/mnras/staa2355
- Kimm et al. (2019) Kimm, T., Blaizot, J., Garel, T., et al. 2019, MNRAS, 486, 2215, doi: 10.1093/mnras/stz989
- Law et al. (2016) Law, D. R., Cherinka, B., Yan, R., et al. 2016, AJ, 152, 83, doi: 10.3847/0004-6256/152/4/83
- Leitherer et al. (2016) Leitherer, C., Hernandez, S., Lee, J. C., & Oey, M. S. 2016, ApJ, 823, 64, doi: 10.3847/0004-637X/823/1/64
- Madau & Haardt (2015) Madau, P., & Haardt, F. 2015, ApJ, 813, L8, doi: 10.1088/2041-8205/813/1/L8
- Marques-Chaves et al. (2021) Marques-Chaves, R., Schaerer, D., Álvarez-Márquez, J., et al. 2021, MNRAS, 507, 524, doi: 10.1093/mnras/stab2187
- Meštrić et al. (2020) Meštrić, U., Ryan-Weber, E. V., Cooke, J., et al. 2020, MNRAS, 494, 4986, doi: 10.1093/mnras/staa920
- Micheva et al. (2019) Micheva, G., Christian Herenz, E., Roth, M. M., Östlin, G., & Girichidis, P. 2019, A&A, 623, A145, doi: 10.1051/0004-6361/201834838
- Mitra et al. (2013) Mitra, S., Ferrara, A., & Choudhury, T. R. 2013, MNRAS, 428, L1, doi: 10.1093/mnrasl/sls001
- Momcheva et al. (2016) Momcheva, I. G., Brammer, G. B., van Dokkum, P. G., et al. 2016, ApJS, 225, 27, doi: 10.3847/0067-0049/225/2/27
- Naidu et al. (2018) Naidu, R. P., Forrest, B., Oesch, P. A., Tran, K.-V. H., & Holden, B. P. 2018, MNRAS, 478, 791, doi: 10.1093/mnras/sty961
- Nakajima et al. (2020) Nakajima, K., Ellis, R. S., Robertson, B. E., Tang, M., & Stark, D. P. 2020, ApJ, 889, 161, doi: 10.3847/1538-4357/ab6604
- Nakajima & Ouchi (2014) Nakajima, K., & Ouchi, M. 2014, MNRAS, 442, 900, doi: 10.1093/mnras/stu902
- O’Donnell (1994) O’Donnell, J. E. 1994, ApJ, 422, 158, doi: 10.1086/173713
- Osterbrock & Bochkarev (1989) Osterbrock, D. E., & Bochkarev, N. G. 1989, Soviet Ast., 33, 694
- Ouchi et al. (2009) Ouchi, M., Mobasher, B., Shimasaku, K., et al. 2009, ApJ, 706, 1136, doi: 10.1088/0004-637X/706/2/1136
- Paswan et al. (2018) Paswan, A., Omar, A., & Jaiswal, S. 2018, MNRAS, 473, 4566, doi: 10.1093/mnras/stx2614
- Paswan et al. (2019) —. 2019, MNRAS, 482, 3803, doi: 10.1093/mnras/sty2933
- Pellegrini et al. (2012) Pellegrini, E. W., Oey, M. S., Winkler, P. F., et al. 2012, ApJ, 755, 40, doi: 10.1088/0004-637X/755/1/40
- Pellegrini et al. (2011) Pellegrini, E. W., Oey, M. S., Winkler, P. F., Smith, R. C., & Points, S. 2011, Bulletin de la Societe Royale des Sciences de Liege, 80, 410
- Rivera-Thorsen et al. (2015) Rivera-Thorsen, T. E., Hayes, M., Östlin, G., et al. 2015, ApJ, 805, 14, doi: 10.1088/0004-637X/805/1/14
- Runnholm et al. (2020) Runnholm, A., Hayes, M., Melinder, J., et al. 2020, ApJ, 892, 48, doi: 10.3847/1538-4357/ab7a91
- Sanders et al. (2019) Sanders, R. L., Jones, T., Shapley, A. E., et al. 2019, arXiv e-prints, arXiv:1910.13594. https://arxiv.org/abs/1910.13594
- Saxena et al. (2021) Saxena, A., Pentericci, L., Ellis, R. S., et al. 2021, arXiv e-prints, arXiv:2109.03662. https://arxiv.org/abs/2109.03662
- Shapley et al. (2016) Shapley, A. E., Steidel, C. C., Strom, A. L., et al. 2016, ApJ, 826, L24, doi: 10.3847/2041-8205/826/2/L24
- Shaw & Dufour (1995) Shaw, R. A., & Dufour, R. J. 1995, PASP, 107, 896, doi: 10.1086/133637
- Shirazi & Brinchmann (2012) Shirazi, M., & Brinchmann, J. 2012, MNRAS, 421, 1043, doi: 10.1111/j.1365-2966.2012.20439.x
- Smee et al. (2013) Smee, S. A., Gunn, J. E., Uomoto, A., et al. 2013, AJ, 146, 32, doi: 10.1088/0004-6256/146/2/32
- Stasińska et al. (2015) Stasińska, G., Izotov, Y., Morisset, C., & Guseva, N. 2015, A&A, 576, A83, doi: 10.1051/0004-6361/201425389
- Steidel et al. (2018) Steidel, C. C., Bogosavljević, M., Shapley, A. E., et al. 2018, ApJ, 869, 123, doi: 10.3847/1538-4357/aaed28
- Vanzella et al. (2018) Vanzella, E., Nonino, M., Cupani, G., et al. 2018, MNRAS, 476, L15, doi: 10.1093/mnrasl/sly023
- Verhamme et al. (2015) Verhamme, A., Orlitová, I., Schaerer, D., & Hayes, M. 2015, A&A, 578, A7, doi: 10.1051/0004-6361/201423978
- Verhamme et al. (2017) Verhamme, A., Orlitová, I., Schaerer, D., et al. 2017, A&A, 597, A13, doi: 10.1051/0004-6361/201629264
- Wake et al. (2017) Wake, D. A., Bundy, K., Diamond-Stanic, A. M., et al. 2017, AJ, 154, 86, doi: 10.3847/1538-3881/aa7ecc
- Wang et al. (2019) Wang, B., Heckman, T. M., Leitherer, C., et al. 2019, ApJ, 885, 57, doi: 10.3847/1538-4357/ab418f
- Wang et al. (2021) Wang, B., Heckman, T. M., Amorín, R., et al. 2021, arXiv e-prints, arXiv:2104.03432. https://arxiv.org/abs/2104.03432
- Westfall et al. (2019) Westfall, K. B., Cappellari, M., Bershady, M. A., et al. 2019, AJ, 158, 231, doi: 10.3847/1538-3881/ab44a2
- Yang et al. (2017a) Yang, H., Malhotra, S., Rhoads, J. E., & Wang, J. 2017a, ApJ, 847, 38, doi: 10.3847/1538-4357/aa8809
- Yang et al. (2017b) Yang, H., Malhotra, S., Gronke, M., et al. 2017b, ApJ, 844, 171, doi: 10.3847/1538-4357/aa7d4d
- York et al. (2000) York, D. G., Adelman, J., Anderson, John E., J., et al. 2000, AJ, 120, 1579, doi: 10.1086/301513
- Zastrow et al. (2011) Zastrow, J., Oey, M. S., Veilleux, S., McDonald, M., & Martin, C. L. 2011, ApJ, 741, L17, doi: 10.1088/2041-8205/741/1/L17