Limits on the Mass and Initial Entropy of 51 Eri b from Gaia EDR3 Astrometry
Abstract
51 Eri b is one of the only planets consistent with a wide range of possible initial entropy states, including the cold-start scenario associated with some models of planet formation by core accretion. The most direct way to constrain the initial entropy of a planet is by measuring its luminosity and mass at a sufficiently young age that the initial conditions still matter. We present the tightest upper limit on 51 Eri b’s mass yet ( at 2) using a cross-calibration of Hipparcos and Gaia EDR3 astrometry and the orbit-fitting code orvara. We also reassess its luminosity using a direct, photometric approach, finding dex. Combining this luminosity with the Myr age of the Pic moving group, of which 51 Eri is a member, we derive mass distributions from a grid of evolutionary models that spans a wide range of initial entropies. We find that 51 Eri b is inconsistent with the coldest-start scenarios, requiring an initial entropy of baryon-1 at 97% confidence. This result represents the first observational constraint on the initial entropy of a potentially cold-start planet, and it continues the trend of dynamical masses for directly imaged planets pointing to warm- or hot-start formation scenarios.
keywords:
planetary systems – planets and satellites: physical evolution – astrometry1 Introduction
Until recently, directly imaged planets have had one key disadvantage compared to their counterparts detected via other methods. Their masses were not directly measurable, unlike planets detected via radial velocities (RVs) or transits. Measuring the mass of a directly imaged planet requires precise astrometric or radial-velocity monitoring of the host star over a large fraction of the planet’s orbit. Very long orbital periods and small planet-to-star mass ratios have made this impracticable.
Absolute astrometry from Hipparcos and Gaia have completely changed this picture. We can now detect long-term astrometric signals with a precision of 100 as or better, corresponding to host-star accelerations of 10 as yr-2. By the direct measurement of the gravitational pull of the planet on the host star, the mass of the orbiting body can be measured without precise determination of its orbital parameters. This has opened the door for direct mass measurements of brown dwarf companions like Gl 229 B that have orbital periods of hundreds of years (Brandt et al., 2020, 2021c), as well as short-period planets like Pic b (Snellen & Brown, 2018; Dupuy et al., 2019), Pic c (Brandt et al., 2021d), and HR 8799 e (Brandt et al., 2021e).
For gas-giant planets young enough to have retained properties related to their formation, mass measurements can potentially provide information about the formation process. In a direct collapse scenario commonly associated with forming via gravitational instability in a gas disk (e.g., Boss, 1998), the planet will inherit most of the specific entropy from its natal gas, resulting in the hottest possible planet at a given mass (“hot start”). All planets with directly measured masses and luminosities to date have been consistent with hot-start models, even those as young as the T Tauri phase (Flagg et al., 2019).
On the other hand, some core-accretion scenarios (e.g., Hubickyj et al., 2005) can involve significant loss of entropy during gas accretion (Marley et al., 2007), resulting in a much fainter planet for a given amount of accreted gas (“cold start”). More modern core accretion models strongly disfavour the coldest scenarios (e.g., Berardo et al., 2017), but there is very little direct observational evidence available.
51 Eri b is one of the coldest planets detected via direct imaging (Macintosh et al., 2015). As such, it is a rare case of a young planet where both hot- and cold-start formation scenarios are consistent with its present-day luminosity, with the next best example being COCONUTS-2 b (Zhang et al., 2021). Indeed, 51 Eri b holds the distinction of having the most disparate luminosity-based mass estimates from these two scenarios. As a member of the Pic moving group (BPMG) its age is known well ( Myr; Bell et al., 2015). If 51 Eri b retained most of the entropy of its birth material, then its present-day low temperature would require that it formed from no more than 2 of gas. If instead its formation allowed it to shed entropy through accretion shocks, then it could harbour as much as 12 of gas.
Here we present an upper limit of the mass of 51 Eri b based on a new analysis incorporating Gaia EDR3 astrometry. In contrast to prior work, we find a good agreement between relative astrometry from direct imaging and the absolute astrometry from Hipparcos and Gaia. We demonstrate that 51 Eri b is highly unlikely to be harbouring the amount of gas that has been suggested under the cold-start scenario. We use our measured mass distribution to constrain the initial entropy of 51 Eri b and, finally, discuss the implications for its formation history.
2 Astrometric analysis
In our astrometric analysis, we used the three proper motions reported for 51 Eri (HIP 21547) in the Hipparcos-Gaia Catalog of Accelerations (HGCA; Brandt, 2018, 2021). The HGCA is a cross-calibration that places the two catalogues in a common inertial frame, and we used the most recent version based on Gaia EDR3 (Brandt, 2021). Briefly, the cross-calibration includes both global (all-sky) and local linear transformations to bring positions and proper motions into agreement, as well as error inflation for both Hipparcos and Gaia astrometry to ensure that proper motion differences across the sky follow appropriate normal distributions centred at zero. The HGCA uses a 60/40-weighted combination of the Hipparcos re-reduction by van Leeuwen (2007) and the original catalogue by ESA (1997), respectively, because it matches the long-term proper motions between Hipparcos and Gaia better.
| Parameter | Hipparcos | Gaia EDR3 |
|---|---|---|
| R.A. epoch (yr) | 1990.9139 | 2015.7606 |
| Dec. epoch (yr) | 1990.7250 | 2015.8610 |
| (mas) | ||
| (mas yr-1) | ||
| (mas yr-1) | ||
| Corr | ||
| H-G (mas yr-1) | ||
| H-G (mas yr-1) | ||
| H-G Corr | ||
| HGCA-EDR3 | 2.997 | |
| Parameter | Median 1 | 95.4% c.i. |
| Mass of the planet () | 0.0, 10.9 | |
| Mass of the host star () | 1.65, 1.85 | |
| Semimajor axis (AU) | 8.8, 14.9 | |
| Eccentricity | 0.35, 0.66 | |
| Inclination (°) | 124, 154 | |
| PA of the ascending node (°) | 0, 130 | |
| Argument of periastron (°) | 49, 120 | |
| Mean longitude at (°) | 100, 290 | |
| Barycentric (mas yr-1) | 44.23, 44.29 | |
| Barycentric (mas yr-1) | 64.22, 64.16 | |
| Period (yr) | 19.7, 43.3 | |
| Time of periastron (Jyr) | 2024.4, 2044.5 | |
| 0.40, 0.94 |
-
Note.
Free parameters in the MCMC are shown in the top section. These were used to compute the parameters at the bottom. All posterior distributions are non-Gaussian, except , while , , and are also multi-modal.
-
*
Reference epoch (55197 MJD).
-
**
The posterior of peaks near zero. This result should be used only as an upper limit. The posterior of is identical to the prior we assumed.
Table 1 presents the absolute astrometry for 51 Eri that we used in our analysis. The key measurements are the three proper motions: the Hipparcos proper motion (measured near epoch 1991), the Gaia EDR3 proper motion (measured near epoch 2016), and the long-baseline proper motion derived from the RA and Dec measurements from the two missions (denoted “H-G”). This final value is by far the most precise because proper motion uncertainties scale inversely with the time baseline, and the time elapsed between the two missions is nearly an order of magnitude longer than either one individually. In addition, 51 Eri is so bright () that Gaia EDR3 cannot achieve the 20 as yr-1 precision it reaches at slightly fainter magnitudes (Lindegren et al., 2021). The low of 51 Eri reported in HGCA-EDR3 (equivalent to 1.2 difference from constant proper motion) indicates that the three proper motions are statistically in good agreement with each other. Therefore, it is only possible to place an upper limit on the mass of 51 Eri b.
In order to infer 51 Eri b’s mass, we performed a two-body, joint Keplerian orbit analysis of the HGCA-EDR3 proper motions and the relative astrometry reported by De Rosa et al. (2020). For orbit fitting we used orvara (v1.0.4; Brandt et al., 2021a), which is designed to be used with the HGCA, employs a highly-efficient eccentric anomaly solver, and forward-models epoch astrometry using the htof package (Brandt et al., 2021b). We inferred posterior distributions via the parallel-tempering fork (Vousden et al., 2016) of the affine-invariant (Goodman & Weare, 2010) Markov-Chain Monte Carlo (MCMC) sampler emcee (Foreman-Mackey et al., 2013). Our results are based on a run with 100 walkers and steps for the MCMC and 5 temperatures for parallel-tempering. We thinned our chains, retaining every 50th step, and discarded the first 50% as burn-in, yielding final samples in our posterior.
The eight parameters we fitted were the masses of the host star and planet , semimajor axis , inclination , eccentricity , argument of periastron , position angle of the ascending node , and mean longitude at the reference epoch of 2010.0 . We adopted the normal convention that in the absence of radial velocity information that is needed to determine whether the ascending node is on the east or west side of the orbit. For all parameters except the two masses, we adopted the default orvara priors: log-flat in , for inclination, and linear-flat in all others. We adopted a Gaussian prior on the primary mass of and a linear-flat prior on the planet mass (), rather than log-flat, because we were deriving an upper limit. orvara marginalises over the parallax and barycentric proper motion rather than stepping along these additional dimensions in the MCMC. We adopted a Gaussian prior on the parallax corresponding to the Gaia EDR3 measurement (Table 1) and an uninformative, uniform prior on the barycentric proper motion.
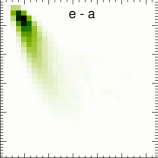
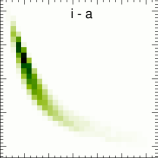
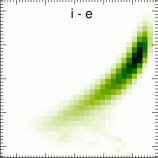
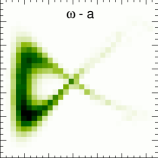
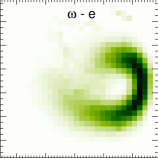
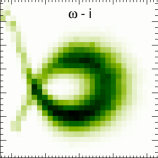
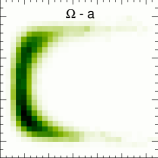
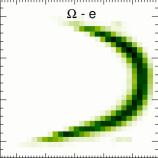
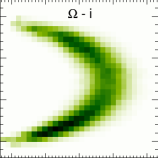
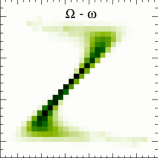
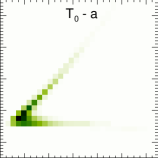
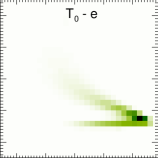
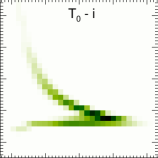
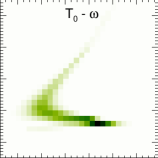
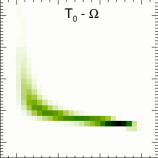
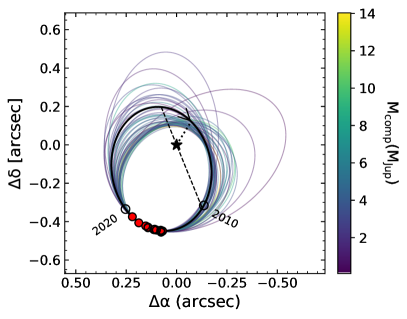
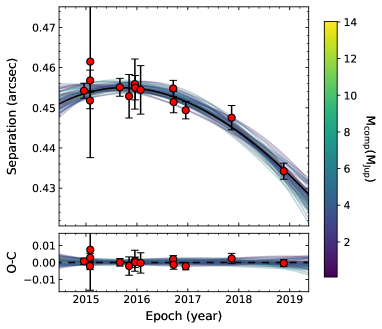
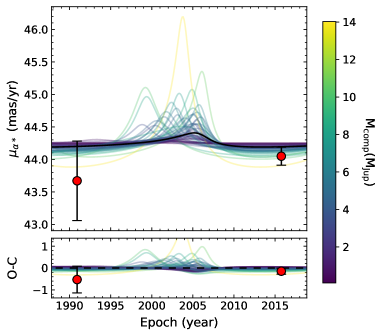
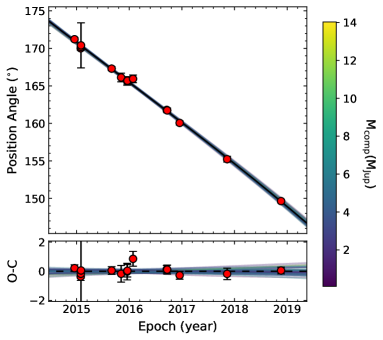
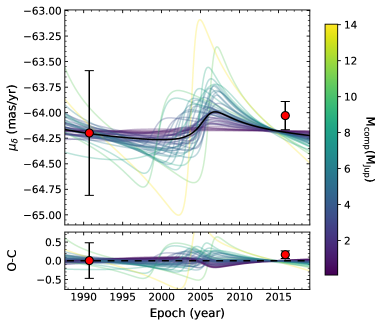
Figure 1 displays the range of astrometric orbits found in our MCMC posterior. We find broadly consistent results as in past work, with two families of orbital solutions that have maximum projected separations toward either the north or to the northwest. These are not the apoastron locations; those are mostly concentrated around PAs of 150–, overlapping almost entirely with the location of 51 Eri b at the epochs of relative astrometry measurements (2014–2018). Figure 2 shows the excellent agreement between the best-fit orbit, the relative astrometry ( for 28 measurements), and the HGCA-EDR3 proper motions ( for the four proper motion difference measurements plotted).
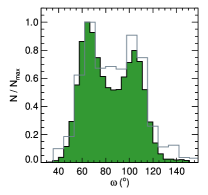
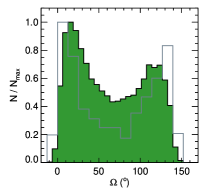
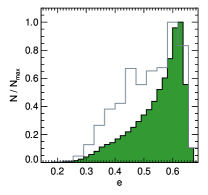
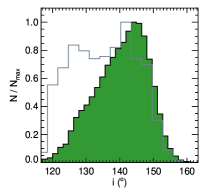
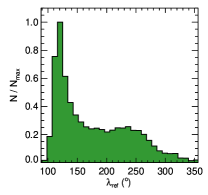
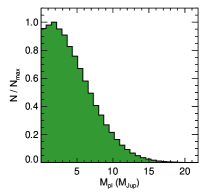
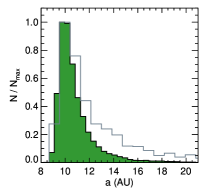
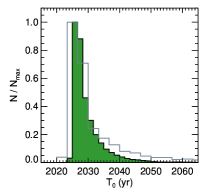
Figure 3 shows the marginalised posteriors of orbital parameters from our fit, as well as the marginalised posteriors of De Rosa et al. (2020), as retrieved from whereistheplanet.com (Wang et al., 2021a). The angles , , and are bimodal, and all parameters except planet mass have non-Gaussian distributions. The planet mass posterior is well-described by a Gaussian distribution truncated at zero on the low end. The best-fit Gaussian parameters did not change significantly (0.1 ) when we tried different bin sizes or high-mass cutoffs (to exclude the less Gaussian tail). Using 0.5- bins up to a maximum mass of 15 , we found that a Gaussian with a mean of 1.0 and standard deviation of 5.0 provided the best fit to the posterior distribution ( for 27 degrees of freedom).
We derived marginalised, 1 and 2 confidence limits on all parameters by computing the minimum credible intervals containing 68.3% and 95.4% of our MCMC posterior. These are reported in Table 2. We caution that these marginalised intervals should only be used to compare to future results of the same type and are not to be used for computing orbits given the significant covariances (Figure 4).
Our orbital analysis results in parameter distributions that agree well with previous work using the same relative astrometry as we do (De Rosa et al., 2020) and with an independent analysis using VLT/SPHERE data (Maire et al., 2019). Our eccentricity posterior extends to slightly higher eccentricities than found by Maire et al. (2019), but our 1 range overlaps with theirs.
3 Discussion
We find that the insignificant proper motion anomaly measured by Hipparcos and Gaia is in excellent agreement with independent relative astrometry measurements, rules out high planet masses, and is fully consistent with zero mass. This means that we can derive an upper mass limit for 51 Eri b without needing to invoke the presence of other bodies in the system sufficiently massive to cause astrometric perturbations. The lack of a strong proper motion anomaly in Gaia EDR3 data requires a planet with a mass 12 with 98% confidence (one-tailed test significance of 2.0). This limit is under the conservative assumption of a linear-flat mass prior, which corresponds to the higher-mass range of 2–12 having 5 the prior weight as the lower-mass range 0–2 .
A mass at or above 12 for 51 Eri b has not previously been ruled out at such high significance. This is thanks to an improvement in the proper motion anomaly accuracy of 2.8 between DR2 and EDR3. De Rosa et al. (2020) reported a 1 upper limit of 7 when using both Hipparcos and Gaia DR2 proper motions, but they were cautious about claiming a strong upper limit. They found 2 disagreement between the absolute astrometry and a planet of even zero mass; their best-fit mass would have been negative without invoking another companion in the system. Our upper mass limit is thus an important milestone in showing that 51 Eri b is most likely not a massive, cold-start, gas-giant planet.
Furthermore, the lack of any significant proper motion anomaly is consistent with no other massive planets in the system interior to 51 Eri b. We cannot rule out another planet on a period short compared to the 3-year Gaia EDR3 baseline. A planet with a 5- to 10-year period could induce a proper motion anomaly opposite to that caused by 51 Eri b thereby reducing our measured dynamical mass. In practice, this requires careful tuning of such a hypothetical interior planet’s orbital phase, and may require an orbital resonance to be stable given 51 Eri b’s maximum likelihood 4 AU periastron distance.
We now consider in detail the implications of cold- and hot-start models for the mass of 51 Eri b given its age and luminosity. We can derive a posterior distribution for the mass of 51 Eri b using substellar evolutionary models. There are several possible choices for hot-start models (e.g., Burrows et al., 1997; Saumon & Marley, 2008; Phillips et al., 2020), but for the sake of self-consistency we use the hot- and cold-start versions of the Spiegel & Burrows (2012) models. As can be seen in their Figure 4, these models represent even more disparate initial entropy states than considered in earlier work by Marley et al. (2007).
3.1 The luminosity of 51 Eri b
Aside from mass and age, the key parameter in our analysis is the luminosity of 51 Eri b. Rajan et al. (2017) derived two luminosities from fitting different model atmospheres to their Gemini/GPI spectrum and Keck/NIRC2 photometry of the planet, finding dex from atmospheres with iron-silicate clouds and dex from sulfide-salt atmospheres. Both sets of models used equilibrium chemistry, which resulted in poor fits to the mid-infrared photometry. In addition to this complication, VLT/SPHERE observations from Samland et al. (2017) are inconsistent with the -band portion of the GPI spectrum and the photometry in the band.
We re-derived the luminosity of 51 Eri b in a direct, photometry-based approach. We used the magnitude tables of the ATMO 2020 atmosphere models that include disequilibrium chemistry (Phillips et al., 2020). From these we computed a bolometric correction () for each of the five standard filters for which 51 Eri b has photometric measurements and for which ATMO 2020 reports magnitudes. These are the , , , , and bands. We note that the filter in NIRC2 has properties 1% different from the bandpass adopted by ATMO 2020.
We used both the “strong” and “weak” disequilibrium chemistry sets of models and restricted our analysis to model masses 15 and –800 K. For each model we computed a for the measured absolute magnitudes versus the model magnitudes, and we kept the best-matching half of the models. The rms scatter of the remaining BC values ranged from 0.1 mag in the band to 0.3 mag in the band and 0.5 mag in the band. This trend follows the expected pattern that some bandpasses will vary more or less depending on underlying assumptions for chemistry and gravity.
Using the photometry from Rajan et al. (2017) we then computed luminosities from our model-derived bolometric corrections, accounting for the uncertainties in both in a Monte Carlo fashion. Adopting an additional uncertainty of 0.2 dex (0.5 mag), to account for systematic errors in models and/or observations, we found good agreement between the luminosities derived from each band ( for five measurements). Taking the weighted average of all five luminosities we found dex for 51 Eri b. This is in good agreement with the value of dex that Macintosh et al. (2015) derived from assuming a low-gravity, partly-cloudy spectrum. Comparing to the 2D posteriors of Rajan et al. (2017) shown in their Figures 11 and 14, our luminosity range overlaps with their 1 contours and agrees best with their larger model radii, as expected for such a young substellar object.
3.2 Masses derived from evolutionary models
Because we measure an upper limit on the mass, we used evolutionary models to derive posterior distributions on mass for comparison. Cold-start evolution presents a challenge for interpolating model grids because luminosity changes very slowly even at young ages, in contrast to hot-start models with rapid initial cooling. Some cold-start models even have crisscrossing luminosity curves of different masses as a function of age that would make interpolations double-valued (e.g., Fortney et al., 2008). We therefore took a Monte Carlo rejection-sampling approach, where we randomly drew ages and masses to compute luminosities from all model tracks. Comparing to the observed luminosity and its uncertainty allowed for a collection of results covering the full range of modelled masses. This approach is the same as we have used previously in our work testing models with dynamical masses (e.g., Dupuy & Liu, 2017; Brandt et al., 2021e).
In our analysis we used the full grid of evolutionary models (hot- and cold-start) from Spiegel & Burrows (2012) that is available online (see Data Availability). These cover the most tabulated masses and ages of any cold-start models, and they also provide solar- and 3 solar-metallicity as well as a wide range of initial specific entropy values ().111Following the previous literature, we discuss in units of Boltzmann’s constant () per baryon. Marleau & Cumming (2014) found good agreement between these models, their own, and others, so our results are not expected to depend strongly on our choice of models.
The online Spiegel & Burrows (2012) model data includes a spectrum spanning 0.8–15 µm at each model grid point, with the grid spanning 8.0–13.0 baryon-1 in (steps of 0.25 baryon-1), 1–15 in mass (steps of 1 ), and 1 Myr to 1 Gyr in age (ten approximately logarithmic steps per decade). We computed bolometric fluxes by numerically integrating these spectra, extrapolating to zero flux at 0 µm and assuming a Rayleigh-Jeans tail beyond 15 µm. We visually inspected the spectra to confirm that in almost all cases the long-wavelength end was already displaying a Rayleigh-Jeans slope. Only for the coldest models, much colder than 51 Eri b, was this not visually apparent. The Rayleigh-Jeans flux contributes about 9% of the bolometric flux at dex and even less at higher luminosities.
Figure 5 shows the evolutionary models we used in our analysis. The 3 solar-metallicity models are negligibly different in the predicted luminosity at a given mass and age, so we used the solar-metallicity models in our analysis.
We first considered the simplest case of hot-start models, with ranging from 10.75 baryon-1 at 1 to 13.00 baryon-1 at 10 . We follow the same prescription as Spiegel & Burrows (2012) for the maximum as a function of mass, which ensures that all planets are gravitationally bound. We assumed a linear-flat prior in mass over the whole grid of models and a normally-distributed age corresponding to the BPMG ( Myr; Bell et al., 2015). This resulted in a mass posterior with a median and 1 interval of using the evolutionary tracks of Spiegel & Burrows (2012). We found that other widely-used hot-start models give similar masses; for example, Saumon & Marley (2008) models result in a planet mass of using the same analysis.
For cold-start models, in any given model comparison we adopted a single value for . These values ranged from the models’ lowest (coldest-start) case of 8.0 baryon-1 up to an intermediate (warm-start) value of 9.5 baryon-1. The coldest-start models from Spiegel & Burrows (2012) reach luminosities only as high as dex at the age of the BPMG. This means that our analysis essentially had an upper limit imposed by the model grid on mass, as 32% of the 2-D luminosity-age distribution was higher than the highest cold-start track (corresponding to a mass of 15 ). We corrected for this in our single-tailed probability calculations by approximating that 32% of the model-derived masses would be 15 if those models were available. The single-tailed test asks whether each Monte Carlo trial for the model-derived mass is higher than the mass drawn from our measured posterior distribution. So if, for example, 50% of our trials tested positive then our corrected probability would be .
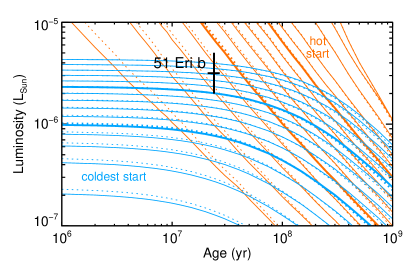
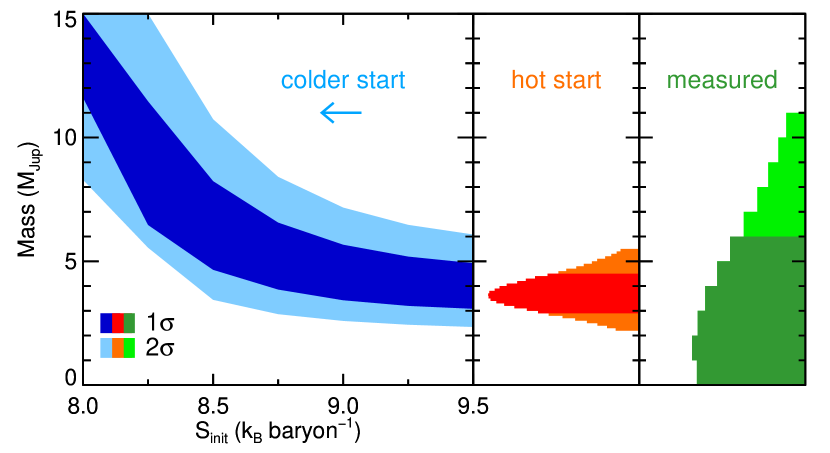
Figure 6 shows our inferred mass ranges for 51 Eri b under different assumed initial entropy. As expected, for higher initial entropy the planet’s luminosity can be explained by a lower mass, while conversely the lowest entropy case requires a very high mass to reproduce 51 Eri b’s luminosity. Even with a moderately warm-start entropy of baryon-1, the mass inferred from evolutionary models is nearly the same as from the hot-start scenario.
In single-tailed tests of the model-derived mass distribution, we found that the coldest-start Spiegel & Burrows (2012) models ( baryon-1) were inconsistent with our observed distribution at 97.0% confidence. This drops to only 76% confidence at the next model grid step of baryon-1.
3.3 Implications for the origin of 51 Eri b
The limit of baryon-1 that we find for the initial entropy of 51 Eri b is the first such result for a potentially cold-start planet. It agrees well with such constraints derived by Marleau & Cumming (2014) for other directly imaged planets from luminosity alone. They found baryon-1 for Pic b and baryon-1 for the HR 8799 planets and 2MASSW J1207334393254 b.
Our result provides further observational evidence against the cold-start scenario for giant planet formation. This scenario is commonly linked to the core-accretion model of giant planet formation (Pollack et al., 1996; Bodenheimer et al., 2000; Hubickyj et al., 2005; Marley et al., 2007). However, there are growing indications that not only does the core-accretion model not necessarily imply a low initial entropy, but such cold starts may be rare in core accretion. Mordasini (2013) showed that even completely cold core accretion can lead to a high entropy and planet luminosity if the core mass is sufficiently large. Berardo et al. (2017) concluded that cold-start core accretion may be difficult to achieve without the accretion shock staying cool (close to the temperature of the nebula), in addition to accretion rates staying low. Indeed, they suggest that the special conditions needed imply that 51 Eri b is unlikely to be a cold-start planet, and simulations of accretion shocks by Marleau et al. (2019) further support this idea. Therefore, core accretion is an entirely plausible formation scenario for 51 Eri b, in spite of our result ruling out low initial entropy for the planet.
Our entropy constraint is equally consistent with a hot-start formation by gravitational instability. It is generally accepted that this mechanism is unlikely to form most giant planets (e.g., Rafikov, 2005), especially those on closer orbits like 51 Eri b with a semimajor axis of AU. It has also been suggested that if some gas giants do form by gravitational instability, then they are better thought of as the low-mass tail of disk-born stellar and brown dwarf companions (Kratter et al., 2010). Observations broadly support this view, as population studies find that the companion mass function rises steeply to lower masses (e.g., Wagner et al., 2019), and these lower-mass giant planets orbit higher-metallicity stars (Schlaufman, 2018)—both hallmarks of core accretion. Our measured mass distribution for 51 Eri b is consistent with both lower- and higher-mass planet regimes in the context of these previous works.
In order to explain the present-day location of 51 Eri b in the gravitational instability scenario, disk migration could have brought it inward from an initially wider separation. This might also help explain its eccentricity, as only the widest planets formed by gravitational instability are expected to have as eccentric orbits as 51 Eri b (Hall et al., 2017). However, such a formation history faces the serious problem that planets as massive as 51 Eri b would seem to be expected to migrate outward, not inward, from their birthplace (Dempsey et al., 2021). Thus, perhaps an alternative pathway to decrease semimajor axis and increase eccentricity for 51 Eri b in the gravitational instability scenario would be forming on a wider orbit and being scattered inward by another planet that may or may not remain in the system at the present day.
Indeed, even in the core accretion scenario, planet-planet scattering would probably be required to achieve the relatively high eccentricity of 51 Eri b. Maire et al. (2019) discussed dynamical origins for the eccentricity of 51 Eri b in detail and concluded that Kozai-Lidov oscillations from GJ 3305 AB, the wide stellar companion to 51 Eri, are not likely. Alternatively, secular interactions with the disk can pump up eccentricity but only to perhaps (e.g., Papaloizou et al., 2001). But even then a high planet mass (10 ), which is disfavoured by our mass posterior, is needed to clear a big enough gap in the disk to reach the highest eccentricities. Planet-planet scattering tends to retain the more massive of the two original planets, so if the hypothetical scatterer were still in the system, it would likely be fainter than 51 Eri b and undetectable so far.
To summarise, our upper limit on the initial entropy of 51 Eri b rules out the coldest-start versions of the core accretion scenario. Formation by core accretion does not necessarily imply a low initial entropy, and, conversely, a high initial entropy does not necessarily imply formation by gravitational instability. Therefore, our results are consistent with a high-entropy core accretion scenario, while the 10 AU orbit of 51 Eri b disfavours formation by gravitational instability.
3.4 Prospects for an improved dynamical mass
The mass uncertainty scales linearly with the proper motion uncertainty (e.g., see Equation 7 of Brandt et al., 2019), which in turn scales as . Gaia DR4 is expected to include 60 months of data, compared to the 34 months in EDR3, implying a factor of 2.3 improvement with no other changes to the astrometric precision of bright stars like 51 Eri b. Therefore, using the same approach as we have here comparing the Gaia proper motion to the long-term Hipparcos-Gaia one is expected to provide a 2.3 more precise mass for 51 Eri b.
To validate this expectation, we performed an identical orbital analysis using Gaia proper motion errors that we reduced artificially by a factor of 2.3. Given that the input proper motion anomaly was still zero, we found an upper limit of 4.2 at 2, which is about a 2.5 improvement over our EDR3-based result and consistent with the expectation. If further improvements are made for bright stars, then a 1-mass uncertainty of 1 may be possible. In this more optimistic case, the hot-start model-predicted mass of would mean a 3–4 detection of 51 Eri b using Gaia DR4.
Gaia DR3 will provide seven-parameter solutions that include acceleration, and Gaia DR4 will provide epoch astrometry. These will enable a measurement of the mass of 51 Eri b within Gaia itself without recourse to Hipparcos. In order to determine the expected acceleration as a function of planet mass, we fitted second-order polynomials to the astrometric orbit of 51 Eri A, as defined by our MCMC posterior, uniformly sampled in time from 2014.5 onward. For a nominal 5-year mission we find second-order terms in RA and Dec of and , respectively. The scatter about the fit, which we performed in log-space, was about 0.06 dex, which reflects the uncertainty in our orbit fit. For a 10-year extended Gaia mission, the second-order terms are similar in amplitude but the goodness-of-fit is worse, with scatter about the second-order polynomial of 2 as, as expected for Keplerian motion over a significant fraction of an orbital period not following a simple polynomial.
To estimate the accuracy of such second-order polynomial measurements in future Gaia data releases, we used the same epoch-astrometry tool htof as in our orbit analysis. htof can access up to 10 years of predicted scans from the Gaia observation forecast tool GOST222https://gaia.esac.esa.int/gost/ and compute the precision in seven-parameter fits. To calibrate this prediction for 51 Eri, we adjusted the along-scan errors so that the fitted parameter errors for a simulation of Gaia EDR3 matched those in the published catalogue. It is expected that Gaia DR4 will be based on 5.5 years of astrometry, for which htof predicts uncertainties in the RA and Dec second-order terms of 31 as yr-2 and 38 as yr-2, respectively. This would be insufficient to detect 51 Eri b at any plausible mass. For a 10-year mission, htof predicts an uncertainty of 6 as yr-2 in acceleration for 51 Eri, which corresponds to a 1 detection of a hot-start 51 Eri b. Overall, our analysis suggests that substantial improvements will likely be needed in the astrometric errors for bright stars like 51 Eri in Gaia to achieve a significant acceleration detection without using the Hipparcos-Gaia long-term proper motion.
As for detecting 51 Eri b by RVs, our orbital analysis predicts the semi-amplitude of the signal due to 51 Eri b, with an upper limit of 53 m s-1 at 2. This will not be feasible to detect given the star’s pulsation amplitude of 1476 m s-1 and of 80 km s-1 (Grandjean et al., 2020). The planet Pic b provides a useful point of comparison as its semimajor axis ( AU) is similar to 51 Eri b, but its orbit is nearly edge-on and mass ( ) is much higher (Brandt et al., 2021d). Assuming 51 Eri b is about 3 less massive than Pic b, its more face-on inclination implies that its RV semi-amplitude would be about 5 smaller. Pic A has been observed with HARPS intensively for at least 15 years (Lagrange et al., 2019; Vandal et al., 2020) and not yet yielded a significant RV detection of Pic b (unlike the closer-in planet Pic c), so 51 Eri b is expected to likewise be beyond the reach of RV detection.
4 Conclusions
We present an upper limit on the mass of 51 Eri b derived from the cross-calibration of the Hipparcos and Gaia EDR3 catalogues by Brandt (2021). Our joint analysis of the new absolute astrometry and relative astrometry from the literature results in a concordant orbit fit that rules out planet masses of 10.9 at 2 and 12 at 98% confidence.
We have reassessed the luminosity of 51 Eri b using a direct, photometric approach that relies minimally on the details of atmospheric models. The luminosity of dex that we find is somewhat higher than reported by Rajan et al. (2017) but generally consistent with other work (Macintosh et al., 2015; Samland et al., 2017).
We have derived a lower limit on the initial specific entropy of 51 Eri b ( baryon-1) that rules out the coldest-start planet formation scenarios. This supports 51 Eri b forming in a similar way as other directly-imaged planets, like the Pic and HR 8799 planets, that are only consistent with hot- or warm-start scenarios. On its own, a moderately-high initial entropy does not necessarily favour formation via either core accretion or gravitational instability. However, 51 Eri b’s semimajor axis of AU is most consistent with core accretion, perhaps with subsequent planet-planet scattering to explain its moderate eccentricity (0.35–0.66 at 2).
An important step toward understanding the origins of the coldest directly imaged planets like 51 Eri b will include spectroscopic measurements to probe its composition with existing (e.g., Keck/KPIC; Mawet et al., 2017; Wang et al., 2021b) and upcoming ground-based facilities (e.g., Subaru/REACH; Kotani et al., 2020; and VLT/HiRISE; Vigan et al., 2018), as well as JWST. On a similar time horizon, we expect to see some improvement in the measured mass of 51 Eri b with future Gaia data releases. Beyond Gaia, the Nancy Grace Roman Space Telescope has the potential to improve dynamical masses for planets like 51 Eri b with novel techniques to enable high-precision absolute astrometry for bright stars (Melchior et al., 2018; WFIRST Astrometry Working Group et al., 2019).
Acknowledgements
We are indebted to Kaitlin Kratter and Ken Rice for very helpful discussions about planet formation theory. We are grateful to the reviewer for a thoughtful and prompt report that improved the manuscript. G.M.B. is supported by the National Science Foundation (NSF) Graduate Research Fellowship under grant #1650114. T.B. gratefully acknowledges support from NASA under grant #80NSSC18K0439. This work has made use of data from the European Space Agency (ESA) mission Gaia (https://www.cosmos.esa.int/Gaia), processed by the Gaia Data Processing and Analysis Consortium (DPAC, https://www.cosmos.esa.int/web/Gaia/dpac/consortium). Funding for the DPAC has been provided by national institutions, in particular the institutions participating in the Gaia Multilateral Agreement.
Data Availability
HGCA-EDR3 is available as a FITS file in the supplemental article data at https://iopscience.iop.org/article/10.3847/1538-4365/abf93c. ATMO 2020 model data can be retrieved from https://noctis.erc-atmo.eu:5001/sharing/zyU96xA6o. The model data from Spiegel & Burrows (2012) can be retrieved from https://www.astro.princeton.edu/~burrows/warmstart/index.html. Our MCMC chain and orvara configuration file are available in the supplemental data in the online version of this article.
References
- Bell et al. (2015) Bell C. P. M., Mamajek E. E., Naylor T., 2015, MNRAS, 454, 593
- Berardo et al. (2017) Berardo D., Cumming A., Marleau G.-D., 2017, ApJ, 834, 149
- Bodenheimer et al. (2000) Bodenheimer P., Hubickyj O., Lissauer J. J., 2000, Icarus, 143, 2
- Boss (1998) Boss A. P., 1998, ApJ, 503, 923
- Brandt (2018) Brandt T. D., 2018, ApJS, 239, 31
- Brandt (2021) Brandt T. D., 2021, ApJS, 254, 42
- Brandt et al. (2019) Brandt T. D., Dupuy T. J., Bowler B. P., 2019, AJ, 158, 140
- Brandt et al. (2020) Brandt T. D., Dupuy T. J., Bowler B. P., Bardalez Gagliuffi D. C., Faherty J., Brandt G. M., Michalik D., 2020, AJ, 160, 196
- Brandt et al. (2021a) Brandt T. D., Dupuy T. J., Li Y., Brandt G. M., Zeng Y., Michalik D., Bardalez Gagliuffi D. C., Raposo-Pulido V., 2021a, arXiv e-prints, p. arXiv:2105.11671
- Brandt et al. (2021b) Brandt G. M., Michalik D., Brandt T. D., Li Y., Dupuy T. J., Zeng Y., 2021b, arXiv e-prints, p. arXiv:2109.06761
- Brandt et al. (2021c) Brandt G. M., et al., 2021c, arXiv e-prints, p. arXiv:2109.07525
- Brandt et al. (2021d) Brandt G. M., Brandt T. D., Dupuy T. J., Li Y., Michalik D., 2021d, AJ, 161, 179
- Brandt et al. (2021e) Brandt G. M., Brandt T. D., Dupuy T. J., Michalik D., Marleau G.-D., 2021e, ApJ, 915, L16
- Burrows et al. (1997) Burrows A., et al., 1997, ApJ, 491, 856
- De Rosa et al. (2020) De Rosa R. J., et al., 2020, AJ, 159, 1
- Dempsey et al. (2021) Dempsey A. M., Muñoz D. J., Lithwick Y., 2021, ApJ, 918, L36
- Dupuy & Liu (2017) Dupuy T. J., Liu M. C., 2017, ApJS, 231, 15
- Dupuy et al. (2019) Dupuy T. J., Brandt T. D., Kratter K. M., Bowler B. P., 2019, ApJ, 871, L4
- ESA (1997) ESA ed. 1997, The HIPPARCOS and TYCHO catalogues. Astrometric and photometric star catalogues derived from the ESA HIPPARCOS Space Astrometry Mission ESA Special Publication Vol. 1200
- Flagg et al. (2019) Flagg L., Johns-Krull C. M., Nofi L., Llama J., Prato L., Sullivan K., Jaffe D. T., Mace G., 2019, ApJ, 878, L37
- Foreman-Mackey et al. (2013) Foreman-Mackey D., Hogg D. W., Lang D., Goodman J., 2013, PASP, 125, 306
- Fortney et al. (2008) Fortney J. J., Marley M. S., Saumon D., Lodders K., 2008, ApJ, 683, 1104
- Goodman & Weare (2010) Goodman J., Weare J., 2010, Communications in Applied Mathematics and Computational Science, 5, 65
- Grandjean et al. (2020) Grandjean A., et al., 2020, A&A, 633, A44
- Hall et al. (2017) Hall C., Forgan D., Rice K., 2017, MNRAS, 470, 2517
- Hubickyj et al. (2005) Hubickyj O., Bodenheimer P., Lissauer J. J., 2005, Icarus, 179, 415
- Kotani et al. (2020) Kotani T., et al., 2020, in Society of Photo-Optical Instrumentation Engineers (SPIE) Conference Series. p. 1144878, doi:10.1117/12.2561755
- Kratter et al. (2010) Kratter K. M., Murray-Clay R. A., Youdin A. N., 2010, ApJ, 710, 1375
- Lagrange et al. (2019) Lagrange A. M., et al., 2019, Nature Astronomy, 3, 1135
- Lindegren et al. (2021) Lindegren L., et al., 2021, A&A, 649, A2
- Macintosh et al. (2015) Macintosh B., et al., 2015, Science, 350, 64
- Maire et al. (2019) Maire A. L., et al., 2019, A&A, 624, A118
- Marleau & Cumming (2014) Marleau G. D., Cumming A., 2014, MNRAS, 437, 1378
- Marleau et al. (2019) Marleau G.-D., Mordasini C., Kuiper R., 2019, ApJ, 881, 144
- Marley et al. (2007) Marley M. S., Fortney J. J., Hubickyj O., Bodenheimer P., Lissauer J. J., 2007, ApJ, 655, 541
- Mawet et al. (2017) Mawet D., et al., 2017, in Society of Photo-Optical Instrumentation Engineers (SPIE) Conference Series. p. 1040029, doi:10.1117/12.2274891
- Melchior et al. (2018) Melchior P., Spergel D., Lanz A., 2018, AJ, 155, 102
- Mordasini (2013) Mordasini C., 2013, A&A, 558, A113
- Papaloizou et al. (2001) Papaloizou J. C. B., Nelson R. P., Masset F., 2001, A&A, 366, 263
- Phillips et al. (2020) Phillips M. W., et al., 2020, A&A, 637, A38
- Pollack et al. (1996) Pollack J. B., Hubickyj O., Bodenheimer P., Lissauer J. J., Podolak M., Greenzweig Y., 1996, Icarus, 124, 62
- Rafikov (2005) Rafikov R. R., 2005, ApJ, 621, L69
- Rajan et al. (2017) Rajan A., et al., 2017, AJ, 154, 10
- Samland et al. (2017) Samland M., et al., 2017, A&A, 603, A57
- Saumon & Marley (2008) Saumon D., Marley M. S., 2008, ApJ, 689, 1327
- Schlaufman (2018) Schlaufman K. C., 2018, ApJ, 853, 37
- Snellen & Brown (2018) Snellen I. A. G., Brown A. G. A., 2018, Nature Astronomy, 2, 883
- Spiegel & Burrows (2012) Spiegel D. S., Burrows A., 2012, ApJ, 745, 174
- Vandal et al. (2020) Vandal T., Rameau J., Doyon R., 2020, AJ, 160, 243
- Vigan et al. (2018) Vigan A., et al., 2018, in Evans C. J., Simard L., Takami H., eds, Society of Photo-Optical Instrumentation Engineers (SPIE) Conference Series Vol. 10702, Ground-based and Airborne Instrumentation for Astronomy VII. p. 1070236 (arXiv:1806.10618), doi:10.1117/12.2313681
- Vousden et al. (2016) Vousden W. D., Farr W. M., Mandel I., 2016, MNRAS, 455, 1919
- WFIRST Astrometry Working Group et al. (2019) WFIRST Astrometry Working Group et al., 2019, Journal of Astronomical Telescopes, Instruments, and Systems, 5, 044005
- Wagner et al. (2019) Wagner K., Apai D., Kratter K. M., 2019, ApJ, 877, 46
- Wang et al. (2021a) Wang J. J., Kulikauskas M., Blunt S., 2021a, whereistheplanet: Predicting positions of directly imaged companions (ascl:2101.003)
- Wang et al. (2021b) Wang J. J., et al., 2021b, AJ, 162, 148
- Zhang et al. (2021) Zhang Z., Liu M. C., Claytor Z. R., Best W. M. J., Dupuy T. J., Siverd R. J., 2021, ApJ, 916, L11
- van Leeuwen (2007) van Leeuwen F., 2007, A&A, 474, 653