RZiMM-scRNA: A regularized zero-inflated mixture model framework for single-cell RNA-seq data
Abstract
Applications of single-cell RNA sequencing in various biomedical research areas have been blooming. This new technology provides unprecedented opportunities to study disease heterogeneity at the cellular level. However, unique characteristics of scRNA-seq data, including large dimensionality, high dropout rates, and possibly batch effects, bring great difficulty into the analysis of such data. Not appropriately addressing these issues obstructs true scientific discovery. Herein, we propose a unified Regularized Zero-inflated Mixture Model framework designed for scRNA-seq data (RZiMM-scRNA) to simultaneously detect cell subgroups and identify gene differential expression based on a developed importance score, accounting for both dropouts and batch effects. We conduct extensive simulation studies in which we evaluate the performance of RZiMM-scRNA and compare it with several popular methods, including Seurat, SC3, K-Means, and Hierarchical Clustering. Simulation results show that RZiMM-scRNA demonstrates superior clustering performance and enhanced biomarker detection accuracy compared to alternative methods, especially when cell subgroups are less distinct, verifying the robustness of our method.
Our empirical investigations focus on two brain tumor studies dealing with astrocytoma of various grades, including the most malignant of all brain tumors, glioblastoma multiforme (GBM). Our goal is to delineate cell heterogeneity and identify driving biomarkers associated with these tumors. Notably, RZiMM-scNRA successfully identifies a small group of oligodendrocyte cells which has drawn much attention in biomedical literature on brain cancers. In addition, our method discovers several new biomarkers which are not discussed in the original studies, including PLP1, BCAN, and PTPRZ1 — all associated with the development and malignant growth of glioma — as well as CAMK2B, which is downregulated in glioma and GBM, and implicated in neurodevelopment, brain function, learning and memory processes.
keywords:
, and
1 Introduction
Single-cell RNA sequencing (scRNA-seq) techniques have recently emerged and enabled large volumes of transcriptome profiling of individual cells (Wang and Bodovitz, 2010; Prakadan, Shalek and Weitz, 2017). Unlike conventional gene analyses of bulk samples where an average of gene expression levels in a bulk cell population is measured and individual cell characteristics are ignored, scRNA-seq data provide detailed information of gene expressions at the level of individual cells (Hedlund and Deng, 2018). Research using scRNA-seq has led to detection of new cell types, delineation of cell heterogeneity, identification of gene regulatory mechanisms, cell developmental dynamics, and other important discoveries (Xue et al., 2013; Treutlein et al., 2014; Grün et al., 2015; Petropoulos et al., 2016; Reinius et al., 2016).
Our empirical investigations aim to advance understanding of brain tumors, including glioblastoma multiforme (GBM), which is fast-growing and the most aggressive of all brain tumors. The first study we encounter focuses on various grades of astrocytoma, the most common type of primary brain tumors affecting adults and can occur in most parts of the brain and in the spinal cord. These tumors are quite resistant to therapies and often progress rapidly to high-grade lesions (de Sousa et al., 2017). The astrocytoma scRNA-seq data is generated from ten IDH-mutant human astrocytoma tumors of different grades by Venteicher et al., and available in the Gene Expression Omnibus (GEO) database under accession number GSE89567 (Barrett et al., 2012). In the second study, high-grade astrocytoma scRNA-seq count data is generated by Yuan et al. and available in the GEO database under accession number GSE103224. In this study, samples from eight patients were taken of the cellular milieu of high-grade gliomas, namely the most aggressive types — GBM and anaplastic astrocytoma. We intend to identify hidden cell subgroup structures and discover important biomarkers which drive these structures.
Despite its great promise in advancing our knowledge of diseases, several challenges are encountered in the analysis of such scRNA-seq data, prompting the development of novel analytical strategies (Kiselev, Andrews and Hemberg, 2019; Petegrosso, Li and Kuang, 2019). Following quality control and normalization, an essential aspect of scRNA-seq data analysis is unsupervised clustering to identify hidden cell subgroup structures and the biomarkers which drive these patterns. However, many problems arise when clustering scRNA-seq data (Kiselev, Andrews and Hemberg, 2019), such as high dimensionality, high rate of dropouts, and the presence of sample/batch effects. High dimensionality refers to the large numbers of cells and genes in a tissue sample. Dropout events are zero expressions of transcripts in single cells, due to low expressions/undetectable levels, false quantification, or failure in amplification (Stegle, Teichmann and Marioni, 2015; Kiselev, Andrews and Hemberg, 2019; Petegrosso, Li and Kuang, 2019), which can not be addressed via simple normalization (Vallejos et al., 2017). Sample/batch effects may be induced by sample heterogeneity, or technical issues and experimental designs (Büttner et al., 2017). Failure to appropriately account for these effects can introduce non-trivial bias and significantly impact clustering algorithms (Tung et al., 2017).
On the other hand, many methods have been developed to particularly deal with dropouts based on imputation techniques and zero-inflated models. For example, CIDR (Lin, Troup and Ho, 2017), CMF-Impute (Xu et al., 2020) and ZIFA (Pierson and Yau, 2015) impute gene expression values in dropout events based on cell and gene similarities or parametric modeling with latent variables. However, imputation methods usually require various conditions and may lead to new bias and the elimination of biologically meaningful variation. SC3 (Kiselev et al., 2017) is a popular pipeline for scRNA-seq data using combined clustering methods, while it does not perform any form of batch effect correction. Existing approaches to correct for batch effects include model-based adjustment, such as Combat (Johnson, Li and Rabinovic, 2007); canonical correlation analysis (CCA) subspace alignment, such as Seurat (Butler et al., 2018); and mutual nearest neighbors (MNN), such as fastMNN (Haghverdi et al., 2018) and BEER (Zhang, Wu and Tian, 2019). Unfortunately, these existing methods have various drawbacks. For example, Combat (Johnson, Li and Rabinovic, 2007) was initially designed for bulk cell data, and thus provides no special treatment for dropout events. Seurat (Butler et al., 2018), fastMNN (Haghverdi et al., 2018), BEER (Zhang, Wu and Tian, 2019), and ZINB-WaVE (Risso et al., 2018) first perform dimensionality reduction and correct for batch effects, followed by cell clustering. However, these multi-staged approaches often lose information across the separate steps, as the analysis conducted at a given step is conditional on the summarized data obtained in the previous stage, and therefore cannot recover any useful information that might have been lost then. In summary, none of these discussed methods provide a unified strategy to systematically analyze scRNA-seq data.
We also remark that the most common practice in scRNA-seq data analysis is still to analyze a single biological sample at a time, followed by manually summarizing the common findings shared by different samples. Yet this strategy fails to leverage information shared across samples and potentially sacrifices the detection power. To address this drawback, our method will take into account all the samples jointly in the new modeling system.
Specifically, we propose RZiMM-scRNA, a Regularized Zero-inflated Mixture Model framework to simultaneously cluster cells and identify differentially expressed genes between cell subgroups in scRNA-seq data. RZiMM-scRNA also accounts for dropout events and sample heterogeneity. In particular, estimation of the latent group allocation and effect is directly linked to cell clustering membership construction. An -penalty on the pairwise differences of group effects within a gene is also incorporated to impose sparsity on the space of differentially expressed genes as a treatment for high dimensionality. Lastly, the parametric nature of RZiMM-scRNA naturally allows for the development of an importance score for biomarker identification, whose statistical significance can also be assessed. Unlike popular two-staged methods which are unable to fully utilize information in the data, RZiMM-scRNA is a unified model framework that addresses all of the discussed challenges. We demonstrate the promise of the proposed method via extensive simulation studies and applications to two brain cancer scRNA-seq datasets.
2 Method
2.1 A New Model Framework
We start with the notations. Let be the normalized expression of the gene from the cell, for , . Note that the cells from all the samples (patients) are collapsed together in our analysis. To account for sparse values in the single-cell gene expression data, we assume that follows a zero-inflated mixture distribution,
| (1) |
where is the probability that gene has a non-zero value and is a specified distribution for non-zero values of gene , with mean in cell and variance . The proposed framework can accommodate a wide range of data types by specifying with different forms of distributions, including Gaussian, Poisson, and negative binomial, which have been widely used in modeling scRNA-seq data.
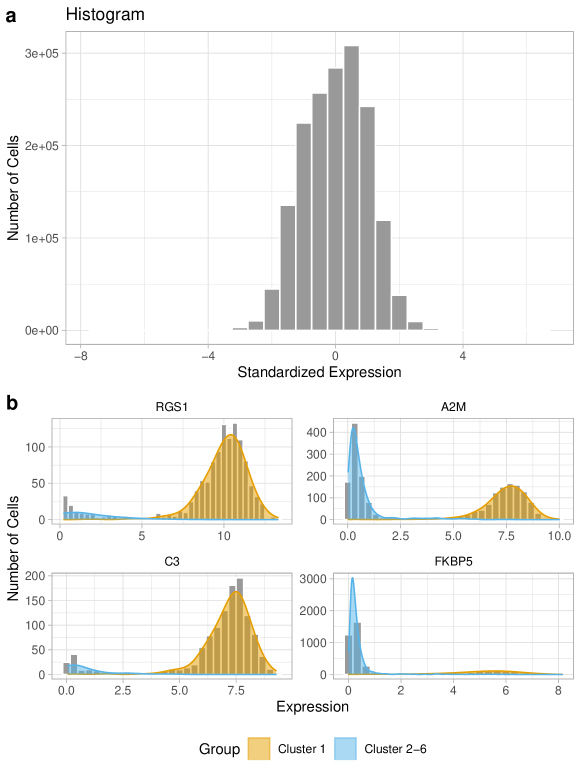
Motivated by the astrocytoma scRNA-seq data previously described and also for the purpose of demonstration, we first focus our discussion on the Gaussian distribution . This data set exhibits a high prevalence of dropout events and 75.3% of expression values are zeros. Figure 4a displays the histogram of the standardized non-zero expression values from five hundred randomly selected genes, revealing that its distribution appears symmetric, bell-shaped, and close to a standard normal distribution. Moreover, Figure 4b depicts histograms and density plots of the non-zero expression values for four randomly selected genes, RGS1, A2M, C3 and FKBP5. We observe multiple peaks in the distribution of each gene, indicating the existence of cell subgroup structures.
As shown in a t-SNE plot (Figure 6b) of the glioma data, cells from the same sample are mostly clustered together, illustrating the difficulty of identifying biologically meaningful cell subgroups without adjusting for the sample effect. To perform simultaneous cell clustering and differential gene expression detection while accounting for the sample effect (high within-sample correlation), we impose the following structure on the mean expression parameter ,
| (2) |
Herein, corresponds to the sample effect for the th gene in sample , where is the function that gives the sample ID for each cell. For example, indicates that cell comes from sample ; correspondingly, represents the effect of sample for gene . is the indicator of cell subgroup membership for cell , which is of primary interest to estimate. Specifically, indicates that cell belongs to hidden subgroup , and for all . In addition, represents the corresponding effect of gene in cell subgroup . For model identification, we set for gene in sample .
Let us denote . The log-likelihood can be written as
| log-L | (3) |
The other important task is to identify which genes are the main contributors to cell subgroup differentiation. To achieve this, we further regularize the estimation of via the sparsity-induced penalty on the difference between and , denoted by . That is, we look to force the trivial genes that are not differentially expressed among the cell subgroups, which are also estimated, to satisfy . Naturally, the genes which have the largest differences among s are likely the main drivers of cell subgroup formation. The penalized negative log-likelihood can be written as,
| (4) |
where includes all unknown parameters to be estimated, and the tuning parameter corresponds to the weight of the penalty term .
Incorporating the above-described parameter regularization, the new model framework is called Regularized Zero-inflated Mixture Models for scRNA data (RZiMM-scRNA).
2.2 Parameter Estimation.
We estimate via minimizing , such that
| (5) |
First, we obtain the estimate of , the probability of non-zero values for gene , by solving ,
| (6) |
Note that minimization of the loss function (4) is convex when either or is fixed, but not jointly convex in . Therefore, we iteratively estimate and conditional on each other, by minimizing the following terms separated from ,
| (7) |
can be written as,
| (8) |
Herein, , is a vector of ’s when , and is a matrix for the group allocation. The is a matrix, with the element when cell belongs to sample , and 0 otherwise. The and include only rows corresponding to .
Since the penalty term is non-differentiable, we adopt Majorization Maximization (MM) algorithm (Lange, 2013) in the optimization procedure,
| (9) |
where , is differentiable and the equivalence holds when .
Conditional on , we can obtain the estimate of and iteratively as follows,
-
1.
Set , where to avoid division by zero.
-
2.
Estimate and by setting .
We follow this by solving to estimate . Then, conditional on the estimate of , and , for , we estimate in the following,
| (10) |
where , when , and 0 otherwise.
The complete procedure can be summarized as follows,
The tuning parameter of the penalty term and the optimal number of cell types can be automatically determined based on the modified BIC proposed by Wang, Li and Leng,
where is the number of total parameters, is a pre-specified parameter. We set as suggested by Wang, Li and Leng. As shown by Wang, Li and Leng, this modification improves the performance over the original BIC, which tends to obtain over-parsimonious results on clustering.
2.3 Gene Importance Scoring.
The new model framework not only achieves cell subgroup (type) discovery in a data-adaptive fashion, but also provides meaningful insight in detection of important genes. To identify the differentially expressed genes which drive formation of different cell types by RZiMM-scRNA, we define an importance score for each gene as the summation of pairwise differences between cell types,
| (11) |
Genes with large values of are considered to be cluster-distinctive biomarker candidates.
2.4 Cell-Type-Specific Driving Differential Gene Expression.
It is also straightforward to utilize RZiMM-scRNA to identify genes that are non-trivially over-expressed or under-expressed in a specific cell type. We define the measure of differential expression level for gene in cell type as,
| (12) |
Genes with the largest magnitudes of have the most over-expression or under-expression in cell type , and are viewed as the main contributors to separate cell type from the others. This measure is useful in aligning cell clusters to known cell types and identifying new biomarkers of a specific cell type.
2.5 A remark
The focus of this paper is to introduce and apply a new joint-sample modeling framework for simultaneous discovery of cell subtypes and detection of driving gene markers. This new system yields an intuitive measure of gene importance, which can be used to directly rank genes according to their strength of association with the discovered cell subgroups. Statistical significance can also be assessed through bootstrapping, which will be deferred to our future investigation.
3 Results
We conduct extensive simulation studies to assess the performance of RZiMM-scRNA in some common settings and conclude with an application to the previously described astrocytoma scRNA-seq datasets.
In addition to RZiMM-scRNA, we also implement Hierarchical Clustering (H-Clust), K-means, Seurat, SC3, fastMNN, and RZiMM not adjusting for within-sample effect (RZiMM-Naive) for comparison. H-Clust and K-Means are used to cluster the cells and ANOVA are then conducted using the “anova” function in R package “stats” (R Core Team, 2018) to detect significant genes based on likelihood-ratio test. FastMNN extracts fifty top features in the PC space based on PCA with batch effects corrected and then performs cell clustering via K-means. The gene statistical significance level is then determined in the same way as in H-Clust and K-Means. Seurat and SC3 have their own pipelines to identify differentially expressed genes.
K-means and H-Clust are implemented using the functions “kmeans” and “hclust”, respectively, in R package “stats”. For H-Clust, we use one minus Pearson correlation as the dissimilarity measurement coupled with average agglomeration. We then use “cutree” function in R package “stats” to divide the ordered cells into clusters. For K-Means, Euclidean distance is used as the dissimilarity measurement. FastMNN is implemented using function “fastMNN” in R package “batchelor”. Seurat and SC3 are implemented using R packages “Seurat” and “SC3”.
3.1 Simulation Study
3.1.1 Expression Data from Zero-inflated Gaussian Distribution
In this study, we generate zero-inflated expression data from models (1) and (2), assuming is a Gaussian distribution, which is motivated by the first brain cancer study. We consider cells, genes, samples, and hidden cell subgroups, where sample ID and subgroup membership are randomly assigned. Each of the genes is a differentially expressed (DE) gene, where a randomly selected cell subgroup is designed to have a higher mean expression than the other three subgroups by a value drawn from the uniform distribution , while the other three groups have a constant effect drawn from . The effect size, ranging from 0.5 to 1.5, indicates the difference in DE genes between subgroups. For genes , we set where . That is, these genes are not differentially expressed among the cell subgroups. In each scenario of value, one hundred simulated data sets are used for investigation. The gene-specific sample effect is drawn from the normal distribution , for , . Therefore, the mean expression . Further, the probability of zero-expression , and the gene expression intensity values are generated as , where and . The within-sample correlation structure at is visualized in Supplement Figure S1, where the positive correlation among cells within a sample (block-wise) is clearly observed.
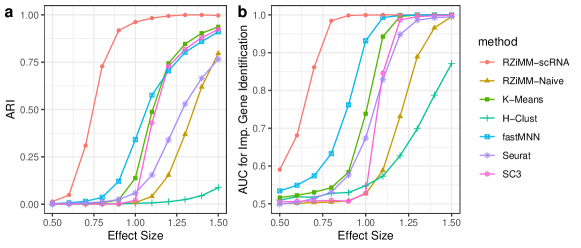
We assume four cell clusters (also the truth) for all methods, as our focus is to compare cell subgroup composition and biomarker detection among the various methods. To evaluate the clustering performance, we use the Adjusted Rand Index (ARI) (Hubert and Arabie, 1985). In addition, we use the area under ROC curve (AUC) as the measure of biomarker detection accuracy, where larger values of AUC correspond to higher biomarker detection accuracy. Figure 1a-b plots the clustering and biomarker detection accuracies for each of the methods averaged over the one hundred simulated data sets against various values of . It is clear that RZiMM-scRNA consistently outperforms all the other methods in both clustering and biomarker detection accuracy. As the effect size increases, the ARI for clustering and AUC for DE gene identification from all methods are improved. The value of needed for RZiMM-scRNA to reach perfect ARI and AUC is around 1, and that for other methods is greater than 1.5. This promising performance on zero-inflated expression data drawn from the Gaussian distribution suggests that RZiMM-scRNA is a powerful method to analyze the astrocytoma scRNA-seq expression data.
3.1.2 Count Data from Zero-inflated Poisson Distribution
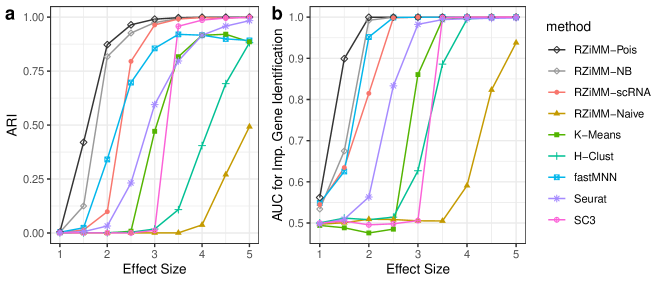
In this study, the popular Poisson distribution is considered to mimic the count nature of the data generated by single-cell RNA-sequencing. Similar to the previous simulation setting, we consider cells, genes, samples, and hidden cell subgroups. Each of the genes is a differentially expressed (DE) gene, where a randomly selected cell subgroup is designed to have a higher mean expression than the other three subgroups by a value drawn from the uniform distribution , while the other three groups have a constant effect parameter drawn from . The effect size, ranging from 1 to 5, indicates the degree of difference in DE genes between subgroups. For genes , we set where . The gene-specific sample effect is allowed to vary, drawn from the normal distribution , for , . The mean expression . Further, the probability of zero-expression , and thus , where and , resulting in the count data following zero-inflated Poisson distributions.
As discussed in Section 3, the proposed model framework can flexibly accommodate non-Gaussian distributed data. We use RZiMM-Pois as the abbreviation of out method implemented under zero-inflated Poisson distribution. We are also interested to examine the performance of adopting zero-inflated negative binomial distribution (RZiMM-NB) and zero-inflated Gaussian distribution (RZiMM-scRNA). From the comparison, we hope to assess the robustness of results to various distributions. Note that the result under the true Poisson distribution (RZIMM-Pois) is treated as the benchmark.
Figure 2 displays the ARI and AUC results of all the considered methods. Note that RZIMM-NB’s performance is very close to the benchmark RZIMM-Pois, which is not surprising due to their intrinsic mathematical connection. Interestingly, the next best performers are RZIMM-scRNA and fastMNN. The fairly good performance of RZIMM-scRNA suggests that the Gaussian distribution works robustly and reasonably well, regardless of the true underlying data distributions. In addition, both popular pipeline methods Seurat and SC3 demonstrate inferior performance. Overall, the result demonstrates that the RZiMM model framework is a powerful substitute to the most common alternatives of scRNA-seq data analysis.
3.2 A Semi-simulation Scenario based on the Real Astrocytoma Data
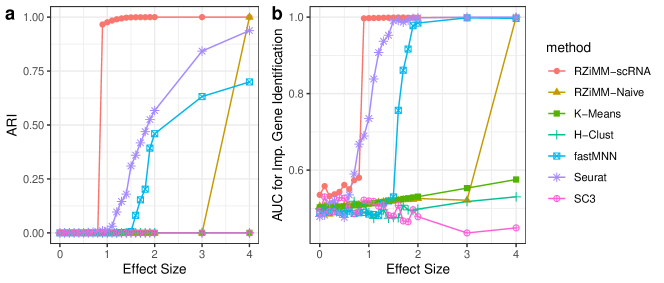
We would like to make the simulated data as close to the reality as possible, while being able to generate some truth structure for performance assessment. Instead of generating the data from parametric models, we fully utilize the first astrocytoma scRNA-seq dataset via permutation. Specifically, we first randomly permute expression intensities of each gene across cells within a sample, as to remove the unknown underlying cell subgroup structure while preserving the within-sample correlation. Next, we add the true structure of cell subgroups and the corresponding driving gene biomarkers as follows. We randomly divide the cells into four clusters and select one hundred genes as the pseudo-important biomarkers. For each of these important genes, we elevate the expression intensities in a randomly assigned cell subgroup by a positive value drawn from the uniform distribution , where several values of between and are examined.
Note that corresponds to the effect size of the hidden cell subgroups, where larger values of correspond to more distinct cell subgroups and less difficulty for a method to correctly identify the underlying cell subgroup structure. The cell correlation map at is presented in Supplement Figure S2, in which cells are ordered by sample and then by true hidden subgroup within each sample. The within-sample correlation is quite noticeable in the glioma data, as shown in different blocks. For example, the second sample to the left MGH61 (shown in gray) reveals a strong between-cell correlation. The small blocks in the map manifest the non-trivial correlation within a cell subgroup.
We again compare the clustering and biomarker detection accuracies across methods (see Figure 1c-d). We observe that RZiMM-scRNA is the most powerful of all the methods, as it starts accurately detecting the underlying true cell subgroup structure with the smallest effect size . Specifically, we observe that RZiMM-scRNA can detect true cell clusters with 100% accuracy for effect sizes of at least . In contrast, Seurat can only achieve perfect accuracy when the effect size is greater than . Since SC3, RZiMM-Naive, K-Means, and H-Clust are unable to account for the sample effect, they completely fail to detect the true cell subgroups when and cannot identify the important genes (low AUC in the right panel). Only as the effect size becomes very large (specifically, ) can RZiMM-Naive fully detect the true subgroup structure and important genes, whereas SC3, K-Means and H-Clust cannot improve their performance.
This study also suggests that RZiMM-scRNA, compared to the other methods, will likely provide more meaningful insight from the astrocytoma data, as the empirical distributions of gene expression data in that real study are essentially preserved in our simulation.
3.3 Analysis of Astrocytoma Data
Finally, we apply each of the methods to the first astrocytoma scRNA-seq dataset. In the study done by Venteicher et al., ten IDH-mutant human astrocytoma tumors spanning grades II to IV were disaggregated, sorted into single cells, and profiled by Smart-seq2 (Picelli et al., 2014). Expression levels were quantified as , where refers to transcript-per-million for gene in sample , as calculated using the software RSEM (RNA-Seq by Expectation-Maximization, Li and Dewey (2011)). Cells with fewer than 3,000 detected genes or an average expression level of a curated list of housekeeping genes below 2.5 were excluded. Consequently, 6,341 single cells were retained in the study. In accordance with the analysis conducted by Venteicher et al., we include 8,231 genes among the total of 23,686 for further analysis, whose expression levels satisfy .
An important first task we must address is determining the optimal number of cell clusters for each method. For RZiMM-scRNA, we adopt modified BIC (Wang, Li and Leng, 2009) as the model selection criterion integrated with the model-based method, with a grid search over and (see Supplement Figure S4). As the result, we obtain as the optimal number of clusters. For K-Means, H-Clust, and fastMNN, we utilize average silhouette value (Rousseeuw, 1987) and gap statistics (Tibshirani, Walther and Hastie, 2001), examining the range of from to . The average silhouette value method is implemented using the “fviz_nbclust” function in R package “factoextra” (Kassambara and Mundt, 2019) and the gap statistic is implemented using MATLAB package “clustering.evaluation”. The average silhouette value method suggests cell clusters for the three methods, which is too small to capture the important pattern in our data. On the other hand, the gap statistics suggests , , and clusters for K-Means, H-Clust and fastMNN, respectively (see Supplement Figure S5). Taking into account the discordance between the average silhouette value and gap statistic suggestions, and for fair comparison, we use clusters for these methods.
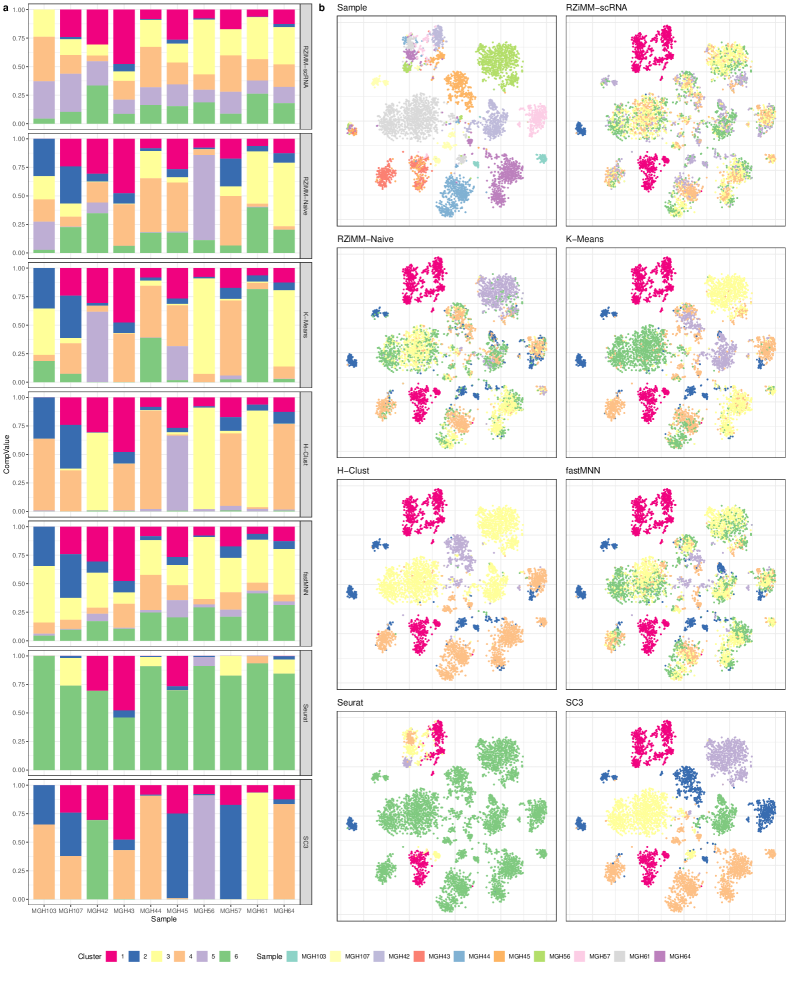
Figure 6a is a compositional plot displaying the proportions of cells clustered into each cell group for each sample. We notice that for several patient samples, such as MGH56 and MGH61, SC3, K-Means and H-Clust tend to cluster cells together by sample. This is also observed for RZiMM-Naive and SC3. For example, the cells of sample MGH56 are mostly clustered into Cluster 5 (purple) by RZiMM-Naive and SC3, or Cluster 3 (yellow) by both K-Means and H-Clust. Once again, we see the importance of addressing sample effect. Without the ability to handle the sample effect, the clustering patterns of RZiMM-Naive, SC3 K-Means, and H-Clust are dominated by sample identity, rather than biologically important distinctions. These same clustering patterns are observed in a correlation map (Figure 5), which reveals prominent within-sample correlations, and in t-SNE plots (Figure 6b), where cells appear to be clustered by sample identity.
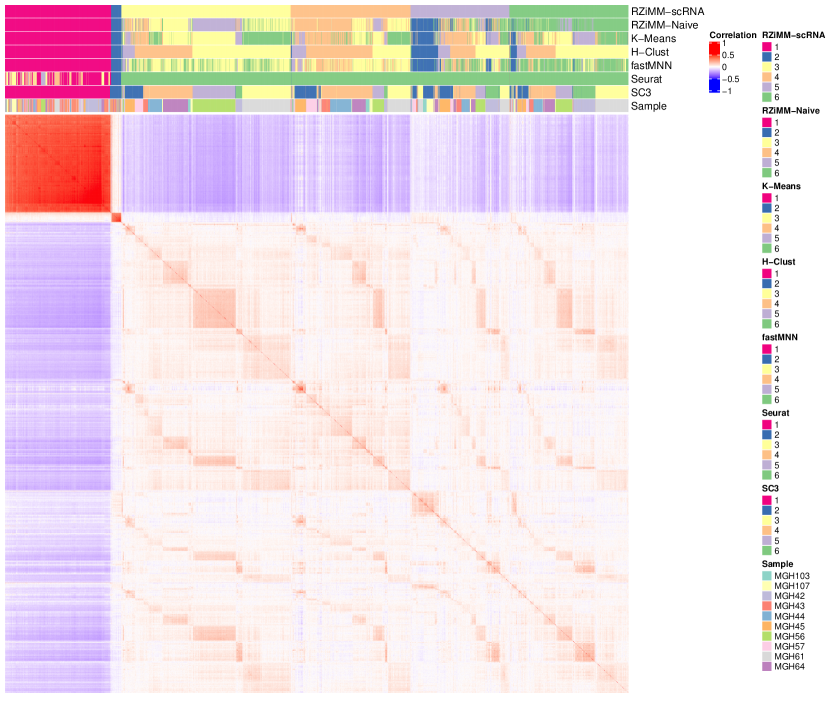
The cell correlation map (Figure 5) presents the pairwise Pearson correlation between cells and the heatmap (Supp Figure S3) shows the expression intensity of each gene in each cell, both of which are annotated with sample labels and the clustering membership estimated by each method. The cells are first ordered by the six clusters identified by RZiMM-scRNA, and then ordered within each cluster by H-Clust. Note that Cluster 1 from RZiMM-scRNA (red) is identified by six clustering methods, as it contains highly correlated cells, but not by Seurat as shown by the correlation map in Figure 5. The heatmap in Supp Figure S3 also reveals that a large group of genes are highly expressed in Cluster 1, which is made easily identifiable by all the clustering methods. Interestingly, Cluster 1 matches the microglial group of cells reported in Venteicher et al.. Microglial cells mediate immune responses in the central nervous system and are re-programmed by tumor cells to create a favorable microenvironment for cancer progression (Abels et al., 2019). Moreover, Cluster 2 from RZiMM-scRNA (blue) and Seurat is composed of a small group of highly correlated cells, as shown in the correlation map. In fact, Cluster 2 matches another biologically meaningful cell type in the oligodendrocyte group reported by Venteicher et al.. Oligodendrocytes produce myelin in the central nervous system and its precursor cells help modulate particular microenvironments for glioma cells (Hide et al., 2018). However, none of the aforementioned methods other than RZiMM-scRNA or Seurat are able to distinguish this cell type from the other cells in our data. Specifically, these other methods tend to combine cells in Cluster 2 with some cells in Clusters 5 and 6, as identified by RZiMM-scRNA, into the same subgroup, indicated by blue for all the other methods.
We also visualize this result using two-dimensional t-SNE plots in Figure 6b. In the top left panel, the plot is colored by sample; while in other panels, the plot is colored by the clustering result for each method. Again, Cluster 2 is revealed to be clearly separated from the other cells. However, only RZiMM-scRNA and Seurat can sharply identify this pattern. All the other methods pool many other cells, which appear to be distant, into this cluster (blue). This demonstrates the superior performance of RZiMM-scRNA, as well as Seurat in identifying rare cell types.
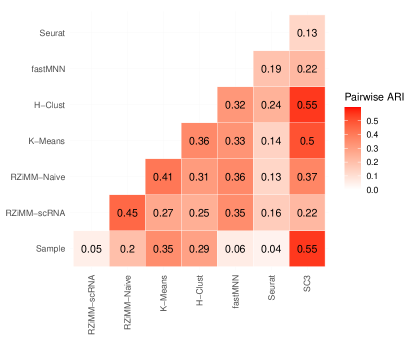
In Figure 7, pairwise ARIs across different clustering methods and sample ID are presented. It is noteworthy that when comparing RZiMM-scRNA, fastMNN and Seurat results to sample ID, the ARI is close to zero, while other methods have fairly high ARIs to sample ID. This result indicates that RZiMM-scRNA, fastMNN and Seurat can effectively remove the batch effects, while the other methods fail. In addition, RZiMM-scRNA shows better agreement with RZiMM-Naive and fastMNN, indicated by fairly large ARI values. In contrast, Seurat has overall low agreement with all the other methods.
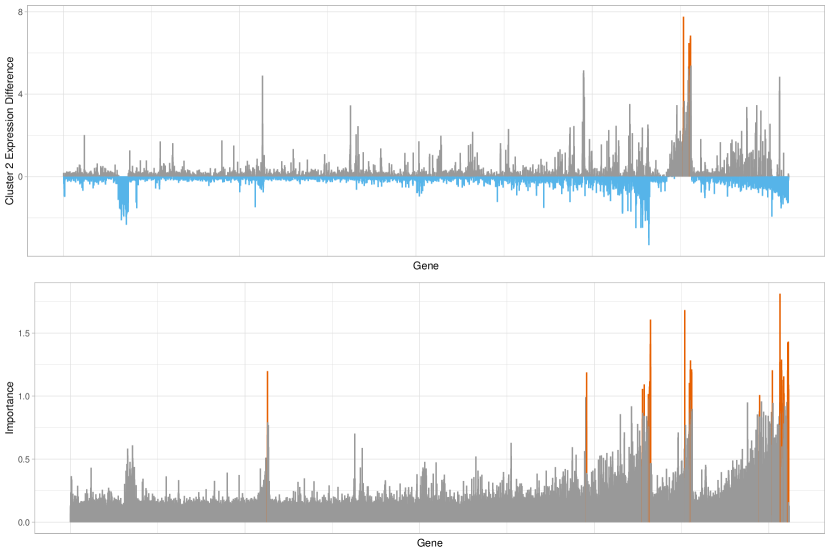
For the particularly interesting Cluster 2 corresponding to the oligodendrocyte cell type, we also compute the measure of differential gene expression between Cluster 2 and all the other clusters according to equation (13) in RZiMM-scRNA, which is displayed in the top panel of Figure 8. The under-expressed genes in Cluster 2 are colored in blue, the top five over-expressed genes in Cluster 2 () are colored in orange, and the rest are colored in gray. We observe a set of genes highly over-expressed in Cluster 2 with the differential expression measure over four. In particular, the top five over-expressed genes in Cluster 2, PLP1, CLDN11, MOG, MBP and TF, are colored in orange. These five genes are also among the top forty important genes identified by RZiMM-scRNA, which yield the overall largest differentiation across the six cell clusters, presented in the bottom panel of Figure 8 and Supplement Table S1. In Supplement Table S1, we observe that these forty genes are either over-expressed in Cluster 1 or 2 or under-expressed in Cluster 1 or 2, as compared to all the other clusters.
Furthermore, we investigate the biological significance of the identified top forty genes. Promisingly, proteins encoded by most of these genes play roles in the nervous system ranging from immune response to cell migration and proliferation, and many are associated with forms of brain cancer, brain disease, and other ailments. We include a brief description of the biological significance of some of these genes in Table LABEL:tab:imp, specifically, their relationship to cancers such as low-grade glioma (LGG), high-grade glioma (HGG), and glioblastoma (GBM), and neurological and neurodegenerative diseases. For a more extensive account of the function and biological significance of these genes, please refer to Table S2 in the Supplement.
.
| Gene | Significance | Ref. |
|---|---|---|
| SPP1 | - Upregulated by glioma-associated microglia/macrophages (GAMs) and associated with poor patient prognosis in LGG and GBM | Chen et al. (2019a) Szulzewsky et al. (2015) |
| PLP1 | - Key for glioma development and associated with patient prognosis | Chen et al. (2019b) |
| BCAN | - May promote the growth and motility of brain tumor cells | O’Leary et al. (2016) |
| RGS1 | - Gene polymorphisms associated with MS | Caballero-Franco and Kissler (2016) Sawcer et al. (2011) |
| CD74 | - Upregulated in HGG and positively associated with patient survival | Zeiner et al. (2015) |
| GPM6A | - Identified as a top gene candidate as a causal gene for SZ | Ma et al. (2018) |
| PTPRZ1 | - Upregulated in LGG and GBM, and associated with malignant growth of GBM and poor patient prognosis | Xia et al. (2019) Shi et al. (2017) |
| CCL3 | - Downregulated in HGG | Vidyarthi et al. (2019) |
| SEPP1 | - Inactivation causes severe neurological dysfunction and brainstem neurodegeneration in mice | Byrns et al. (2014) |
| GSN | - Significantly downregulated in many cancers including GBM | Miyauchi et al. (2018) |
| FXYD6 | - Downregulated in brain of AD mouse model | George et al. (2010) |
| MOG | - Anti-MOG antibodies associated with demyelinating diseases such as acute disseminated encephalomyelitis and neuromyelitis optica spectrum disorder | Sinmaz et al. (2016) |
| MBP | - Increased expression levels detected in AD cortex and could be involved in amyloid plaque formation | Zhan et al. (2015) |
| CCL4 | - Upregulated by GAMs | Zeiner et al. (2019) |
| A2M | - Inhibits proliferation, migration, and invasion of astrocytoma cells | Lindner et al. (2010) |
| APOE | - Upregulated in grade II-IV astrocytoma | Rousseau et al. (2006) |
| CRYAB | - Upregulated in IDH1 mutant anaplastic astrocytoma and GBM | Avliyakulov et al. (2014) Kore and Abraham (2014) |
| CLDN11 | - Absence in CNS myelin perturbs behavior in mice and could lead to neuropsychiatric disease | Maheras et al. (2018) |
| FEZ1 | - Abnormal, unphosphorylated co-aggregates present in brains of transgenic AD mice models | Butkevich et al. (2016) |
| HLA-E | - Upregulated in grade II-IV astrocytoma | Mittelbronn et al. (2007) |
| TF | - May play role in increased iron deposition in MS brain | Khalil et al. (2014) |
| HLA-DRA | - Low expression levels associated with poor prognosis in pediatric adrenocortical tumors | Leite et al. (2014) |
| C1orf61 | - May participate in occurrence and development of GBM | Jia et al. (2019) |
| APLP1 | - May contribute to pathogenesis of AD-associated neurodegeneration | Bayer et al. (1997) |
| CD24 | - Over-expression stimulates glioma cell migration, invasion, colony formation, and tumor growth in mice | Barash et al. (2019) |
| LAPTM5 | - May be used by glioma to negatively modulate antitumoral response of immune system | M. Hajj et al. (2020) |
| C1QB | - Upregulated in diverse grade of gliomas and plays important role in pathogenesis | Mangogna et al. (2019) |
| IL1B | - Highly expressed in GBM and promotes glioma spheroid formation | Wang et al. (2019) |
We see in Table LABEL:tab:imp that PLP1, BCAN, and PTPRZ1 are all associated with the development and malignant growth of glioma. This is a striking observation since, in terms of gene importance score, three of the seven top differentially expressed genes play notable roles in glioma progression and malignancy. Along with this consideration, we observe that a large proportion of the top forty important genes are associated with brain cancer and neurological or neurodegenerative disease. This shows that RZiMM-scRNA is quite effective in detecting biologically important genes in real scRNA-seq data.
It is also noteworthy that many of the top over-expressed genes in each cluster established by our new method serve similar biological functions. Upon evaluation of cluster-specific expression difference (12), we determine the top over- and under-expressed genes in specific cell clusters. For example, we find that the top upregulated genes in Cluster 1 are RGS1, CD74, CCL3, CCL4, and HLA-DRA. We see in Table S2 that these genes are involved in immune function and regulation, revealing that particular cells dealing with immune system mediation in glioma are grouped together by RZiMM-scRNA. Likewise, we observe that PLP1, CLDN11, MOG, and MBP are all highly over-expressed in Cluster 2 and note that these genes play roles in oligodendrocyte development and myelination. The fact that the top upregulated genes in each cluster serve similar biological functions suggests that RZiMM-scRNA is effective in clustering individual cells into groups in accordance with their biological functions.
In addition to new biomarkers discovered by our method, our findings are also supported by the previous analysis done by Venteicher et al.. They reported the presence of an inflammatory program active in GAMs consisting of cytokines and chemokines, in which genes such as CCL3, CCL4, and IL1B are active. This is consistent with our result that these genes, along with other genes involved in immune regulation, are over-expressed in Cluster 1. Likewise, the previous analysis discovered a group of nonmalignant oligodendrocytes in their clustering that preferentially expressed markers such as MBP and CLDN11. These genes are also upregulated in our Cluster 2 along with other oligodendrocytic markers. Moreover, the efficacy of our method is proven by our finding that the most under-expressed genes across these two cell groups include BCAN, PTPRZ1, and GPM6A. Since these genes are involved in neuronal migration and the growth of brain tumor cells, the downregulation of these genes is consistent with these cells being nonmalignant, which is confirmed by the properties we discuss.
3.4 Analysis of High-Grade Astrocytoma Data
In this study of aggressive brain tumor types, conducted by Yuan et al., samples from eight patients were taken of the cellular milieu of high-grade gliomas, namely glioblastoma and anaplastic astrocytoma. Taken together, total cells were profiled across total genes, among which the majority have very sparse data. Posterior to the similar filtering procedure conducted in the first study, we retain 3550 genes in our data analysis.
Based on the empirical distribution of this dataset, a zero-inflated Poisson distribution seems to provide better fit than the Gaussian distribution. We thus implement our algorithm assuming the zero-inflated Poisson distribution, in which the number of cell subgroups is fixed to six, as suggested in the original study by Yuan et al. for fair comparisons.
Out of the top genes identified by our method, of these are important genes found in the previous analysis—KLK4, KIF18B, NCAPH, NCAPG, SUSD3, TROAP, ABCB1, MYBPC1, KIFC1, GTSE1, PRC1, MAD2L1, TPX2, and EFHD1. This finding helps support the meaningfulness of our obtained result. In addition, our method demonstrates its potential to make new discoveries as we continue to investigate the biological significance of the top genes which are not discussed in the previous work. Excitingly, we find that many of these genes are associated with cancers as well as neurological and neurodegenerative diseases. We include a brief description of the biological significance of some of these genes in Table LABEL:tab:imp2.
| Gene | Significance | Ref. |
|---|---|---|
| CAMK2B | - Downregulated in GBM and glioma, implicated in neurodevelopment, brain function, learning and memory processes | Xiong et al. (2019) Johansson, Göransson and Westermark (2005) Nicole and Pacary (2020) |
| LZTS2 | - Tumor suppressor gene influencing proliferation of cancer cell lines such as breast, colon, prostate, and glioma | Thyssen et al. (2006) Kim et al. (2011) |
| CBR1 | - Decreased expression associated with tumor metastasis and poor prognosis - Upregulated in AD brains - Partially responsible for down syndrome cognitive impairments | Murakami et al. (2011) Balcz et al. (2001) Arima-Yoshida et al. (2020) |
| PAQR8 | - Downregulated in GBM and malignant endometrial cancer tissue | Moral-Morales et al. (2020) Sinreih et al. (2018) |
| KANK2 | - Potential tumor suppressor gene involved in regulation of apoptosis, cell cycle, and transcription | Zhang et al. (2018) Wang et al. (2014) |
| ZNF713 | - Misregulation in brain may be involved in pathogenicity of autistic disorder | Metsu et al. (2014) |
| USP54 | - Overexpressed in colorectal cancer stem cells and promotes intestinal tumorigenesis | Fraile et al. (2016) |
| MSANTD3 | - May be associated with familial squamous cell lung carcinoma | Byun et al. (2018) |
| DYNLL1P1 | - May be associated with schizophrenia | Peyrot and Price (2021) |
We observe in Table LABEL:tab:imp2 that many of our identified new biomarkers are connected to tumorigenicity, neurodevelopment, and neurological diseases. For example, CAMK2B is found to be downregulated in GBM and is implicated in neuro-development, brain function, learning and memory processes. Likwise, we find that PAQR8 is downregulated in GBM and malignant endometrial cancer tissues. The application of our method to this high-grade astrocytoma data further demonstrates the effectiveness of RZiMM-scRNA in detecting biologically meaningful genes in real scRNA-seq data.
4 Discussion
Single-cell RNA-seq is a valuable technique for gaining important biological insight into the formation and progression of heterogeneous diseases. However, using inappropriate methods to analyze such data can result in incomplete or misleading biological conclusions. Compared to bulk sample RNA-seq, the data generated from scRNA-seq possess unique characteristics, including the presence of dropouts and batch/sample effects, which brings additional challenges into data analysis. Without proper treatment for these issues, biologically meaningful discoveries, such as underlying cell heterogeneity patterns, cannot be made by unsupervised clustering algorithms. In this paper, we present a novel analytical method — RZiMM-scRNA, a unified statistical framework to simultaneously discover cell subtypes and identify differential gene expression, while accounting for both dropouts and sample effects. We illustrate its superior performance in terms of both clustering and biomarker identification over several widely used methods including Seurat, SC3, K-Means, H-Clust, and fastMNN, via comprehensive simulation studies in some commmon settings and an application to astrocytoma scRNA-seq data.
In the simulation studies, RZiMM-scRNA demonstrates its effectiveness in discovering hidden cell subgroups and detecting important biomarkers, despite the presence of dropout events and sample effects. As demonstrated by the count data simulation study, our new framework can be straightforwardly implemented under non-Gaussian distributions, for example, the zero-inflated Poisson or negative binomial models that are widely used for the count data. Interestingly, we also observe that the performance of adopting zero-inflated Gaussian distribution in the proposed framework is quite robust to different underlying distribution forms that are widely considered for scRNA-Seq data.
Moreover, we find during the first real astrocytoma scRNA-seq data application that RZiMM-scRNA identifies two biologically meaningful cell types, previously annotated as microglia and oligodendrocytes by Venteicher et al., while the other methods fail to identify the small oligodendrocyte type. Utilizing the model framework of RZiMM-scRNA, we are able to identify top genes that are significantly over-expressed in the oligodendrocyte type, some of which are also reported by Venteicher et al.. The informative paradigm of RZiMM-scRNA also allows us to identify top genes which are differentially expressed across all the hidden cell subgroups, most of which are confirmed to be GBM-related by the related literature. Likewise, the second real data application to high-grade astrocytoma tumors further demonstrates the promise of our model framework in terms of biomarker detection.
In our future investigation, we will develop bootstrapping methods to assess the statistical significance of identified genes that differentiate between discovered cell subtypes.
The work was partially supported by the National Institute of Health Grants NCI 5P30 CA013696, NCI P01 CA098101, NIAID 1R01 AI143886, and NCI 1R01 CA219896.
Supplementary Information \sdescriptionWe provide additional plots and tables for the results section in Supplementary Information. {supplement} \stitleCode and Software \sdescriptionWe have developed an R package “RZiMM”, to implement our proposed method, and scripts to perform simulational and real applications.
References
- Abels et al. (2019) {barticle}[author] \bauthor\bsnmAbels, \bfnmErik R\binitsE. R., \bauthor\bsnmMaas, \bfnmSybren LN\binitsS. L., \bauthor\bsnmNieland, \bfnmLisa\binitsL., \bauthor\bsnmWei, \bfnmZhiyun\binitsZ., \bauthor\bsnmCheah, \bfnmPike See\binitsP. S., \bauthor\bsnmTai, \bfnmEric\binitsE., \bauthor\bsnmKolsteeg, \bfnmChristy-Joy\binitsC.-J., \bauthor\bsnmDusoswa, \bfnmSophie A\binitsS. A., \bauthor\bsnmTing, \bfnmDavid T\binitsD. T., \bauthor\bsnmHickman, \bfnmSuzanne\binitsS. \betalet al. (\byear2019). \btitleGlioblastoma-associated microglia reprogramming is mediated by functional transfer of extracellular miR-21. \bjournalCell reports \bvolume28 \bpages3105–3119. \endbibitem
- Arima-Yoshida et al. (2020) {barticle}[author] \bauthor\bsnmArima-Yoshida, \bfnmFumiko\binitsF., \bauthor\bsnmRaveau, \bfnmMatthieu\binitsM., \bauthor\bsnmShimohata, \bfnmAtsushi\binitsA., \bauthor\bsnmAmano, \bfnmKenji\binitsK., \bauthor\bsnmFukushima, \bfnmAkihiro\binitsA., \bauthor\bsnmWatanave, \bfnmMasashi\binitsM., \bauthor\bsnmKobayashi, \bfnmShizuka\binitsS., \bauthor\bsnmHattori, \bfnmSatoko\binitsS., \bauthor\bsnmUsui, \bfnmMasaya\binitsM., \bauthor\bsnmSago, \bfnmHaruhiko\binitsH. \betalet al. (\byear2020). \btitleImpairment of spatial memory accuracy improved by Cbr1 copy number resumption and GABA B receptor-dependent enhancement of synaptic inhibition in Down syndrome model mice. \bjournalScientific reports \bvolume10 \bpages1–15. \endbibitem
- Avliyakulov et al. (2014) {barticle}[author] \bauthor\bsnmAvliyakulov, \bfnmNuraly K\binitsN. K., \bauthor\bsnmRajavel, \bfnmKavitha S\binitsK. S., \bauthor\bsnmLe, \bfnmKhanh Minh T\binitsK. M. T., \bauthor\bsnmGuo, \bfnmLea\binitsL., \bauthor\bsnmMirsadraei, \bfnmLeili\binitsL., \bauthor\bsnmYong, \bfnmWilliam H\binitsW. H., \bauthor\bsnmLiau, \bfnmLinda M\binitsL. M., \bauthor\bsnmLi, \bfnmSichen\binitsS., \bauthor\bsnmLai, \bfnmAlbert\binitsA., \bauthor\bsnmNghiemphu, \bfnmPhioanh L\binitsP. L. \betalet al. (\byear2014). \btitleC-terminally truncated form of B-crystallin is associated with IDH1 R132H mutation in anaplastic astrocytoma. \bjournalJournal of neuro-oncology \bvolume117 \bpages53–65. \endbibitem
- Balcz et al. (2001) {bincollection}[author] \bauthor\bsnmBalcz, \bfnmB\binitsB., \bauthor\bsnmKirchner, \bfnmL\binitsL., \bauthor\bsnmCairns, \bfnmN\binitsN., \bauthor\bsnmFountoulakis, \bfnmM\binitsM. and \bauthor\bsnmLubec, \bfnmG\binitsG. (\byear2001). \btitleIncreased brain protein levels of carbonyl reductase and alcohol dehydrogenase in Down syndrome and Alzheimer’s disease. In \bbooktitleProtein Expression in Down Syndrome Brain \bpages193–201. \bpublisherSpringer. \endbibitem
- Barash et al. (2019) {barticle}[author] \bauthor\bsnmBarash, \bfnmUri\binitsU., \bauthor\bsnmSpyrou, \bfnmArgyris\binitsA., \bauthor\bsnmLiu, \bfnmPei\binitsP., \bauthor\bsnmVlodavsky, \bfnmEuvgeni\binitsE., \bauthor\bsnmZhu, \bfnmChenchen\binitsC., \bauthor\bsnmLuo, \bfnmJuanjuan\binitsJ., \bauthor\bsnmSu, \bfnmDongsheng\binitsD., \bauthor\bsnmIlan, \bfnmNeta\binitsN., \bauthor\bsnmForsberg-Nilsson, \bfnmKarin\binitsK., \bauthor\bsnmVlodavsky, \bfnmIsrael\binitsI. \betalet al. (\byear2019). \btitleHeparanase promotes glioma progression via enhancing CD24 expression. \bjournalInternational journal of cancer \bvolume145 \bpages1596–1608. \endbibitem
- Barrett et al. (2012) {barticle}[author] \bauthor\bsnmBarrett, \bfnmTanya\binitsT., \bauthor\bsnmWilhite, \bfnmStephen E\binitsS. E., \bauthor\bsnmLedoux, \bfnmPierre\binitsP., \bauthor\bsnmEvangelista, \bfnmCarlos\binitsC., \bauthor\bsnmKim, \bfnmIrene F\binitsI. F., \bauthor\bsnmTomashevsky, \bfnmMaxim\binitsM., \bauthor\bsnmMarshall, \bfnmKimberly A\binitsK. A., \bauthor\bsnmPhillippy, \bfnmKatherine H\binitsK. H., \bauthor\bsnmSherman, \bfnmPatti M\binitsP. M., \bauthor\bsnmHolko, \bfnmMichelle\binitsM. \betalet al. (\byear2012). \btitleNCBI GEO: archive for functional genomics data sets—update. \bjournalNucleic acids research \bvolume41 \bpagesD991–D995. \endbibitem
- Bayer et al. (1997) {barticle}[author] \bauthor\bsnmBayer, \bfnmThomas A\binitsT. A., \bauthor\bsnmPaliga, \bfnmKrzysztof\binitsK., \bauthor\bsnmWeggen, \bfnmSascha\binitsS., \bauthor\bsnmWiestler, \bfnmOtmar D\binitsO. D., \bauthor\bsnmBeyreuther, \bfnmKonrad\binitsK. and \bauthor\bsnmMulthaup, \bfnmGerd\binitsG. (\byear1997). \btitleAmyloid precursor-like protein 1 accumulates in neuritic plaques in Alzheimer’s disease. \bjournalActa neuropathologica \bvolume94 \bpages519–524. \endbibitem
- Butkevich et al. (2016) {barticle}[author] \bauthor\bsnmButkevich, \bfnmEugenia\binitsE., \bauthor\bsnmHärtig, \bfnmWolfgang\binitsW., \bauthor\bsnmNikolov, \bfnmMiroslav\binitsM., \bauthor\bsnmErck, \bfnmChristian\binitsC., \bauthor\bsnmGrosche, \bfnmJens\binitsJ., \bauthor\bsnmUrlaub, \bfnmHenning\binitsH., \bauthor\bsnmSchmidt, \bfnmChristoph F\binitsC. F., \bauthor\bsnmKlopfenstein, \bfnmDieter R\binitsD. R. and \bauthor\bsnmChua, \bfnmJohn Jia En\binitsJ. J. E. (\byear2016). \btitlePhosphorylation of FEZ1 by Microtubule Affinity Regulating Kinases regulates its function in presynaptic protein trafficking. \bjournalScientific reports \bvolume6 \bpages1–15. \endbibitem
- Butler et al. (2018) {barticle}[author] \bauthor\bsnmButler, \bfnmAndrew\binitsA., \bauthor\bsnmHoffman, \bfnmPaul\binitsP., \bauthor\bsnmSmibert, \bfnmPeter\binitsP., \bauthor\bsnmPapalexi, \bfnmEfthymia\binitsE. and \bauthor\bsnmSatija, \bfnmRahul\binitsR. (\byear2018). \btitleIntegrating single-cell transcriptomic data across different conditions, technologies, and species. \bjournalNature biotechnology \bvolume36 \bpages411–420. \endbibitem
- Büttner et al. (2017) {barticle}[author] \bauthor\bsnmBüttner, \bfnmMaren\binitsM., \bauthor\bsnmMiao, \bfnmZhichao\binitsZ., \bauthor\bsnmWolf, \bfnmF Alexander\binitsF. A., \bauthor\bsnmTeichmann, \bfnmSarah A\binitsS. A. and \bauthor\bsnmTheis, \bfnmFabian J\binitsF. J. (\byear2017). \btitleAssessment of batch-correction methods for scRNA-seq data with a new test metric. \bjournalBioRxiv \bpages200345. \endbibitem
- Byrns et al. (2014) {barticle}[author] \bauthor\bsnmByrns, \bfnmChina N\binitsC. N., \bauthor\bsnmPitts, \bfnmMatthew W\binitsM. W., \bauthor\bsnmGilman, \bfnmChristy A\binitsC. A., \bauthor\bsnmHashimoto, \bfnmAnn C\binitsA. C. and \bauthor\bsnmBerry, \bfnmMarla J\binitsM. J. (\byear2014). \btitleMice lacking selenoprotein P and selenocysteine lyase exhibit severe neurological dysfunction, neurodegeneration, and audiogenic seizures. \bjournalJournal of Biological Chemistry \bvolume289 \bpages9662–9674. \endbibitem
- Byun et al. (2018) {barticle}[author] \bauthor\bsnmByun, \bfnmJinyoung\binitsJ., \bauthor\bsnmSchwartz, \bfnmAnn G\binitsA. G., \bauthor\bsnmLusk, \bfnmChristine\binitsC., \bauthor\bsnmWenzlaff, \bfnmAngela S\binitsA. S., \bauthor\bsnmDe Andrade, \bfnmMariza\binitsM., \bauthor\bsnmMandal, \bfnmDiptasri\binitsD., \bauthor\bsnmGaba, \bfnmColette\binitsC., \bauthor\bsnmYang, \bfnmPing\binitsP., \bauthor\bsnmYou, \bfnmMing\binitsM., \bauthor\bsnmKupert, \bfnmElena Y\binitsE. Y. \betalet al. (\byear2018). \btitleGenome-wide association study of familial lung cancer. \bjournalCarcinogenesis \bvolume39 \bpages1135–1140. \endbibitem
- Caballero-Franco and Kissler (2016) {barticle}[author] \bauthor\bsnmCaballero-Franco, \bfnmCelia\binitsC. and \bauthor\bsnmKissler, \bfnmStephan\binitsS. (\byear2016). \btitleThe autoimmunity-associated gene RGS1 affects the frequency of T follicular helper cells. \bjournalGenes & Immunity \bvolume17 \bpages228–238. \endbibitem
- Chen et al. (2019a) {barticle}[author] \bauthor\bsnmChen, \bfnmJiawei\binitsJ., \bauthor\bsnmHou, \bfnmChongxian\binitsC., \bauthor\bsnmZheng, \bfnmZongtai\binitsZ., \bauthor\bsnmLin, \bfnmHan\binitsH., \bauthor\bsnmLv, \bfnmGuangzhao\binitsG. and \bauthor\bsnmZhou, \bfnmDong\binitsD. (\byear2019a). \btitleIdentification of Secreted Phosphoprotein 1 (SPP1) as a Prognostic Factor in Lower-Grade Gliomas. \bjournalWorld neurosurgery \bvolume130 \bpagese775–e785. \endbibitem
- Chen et al. (2019b) {barticle}[author] \bauthor\bsnmChen, \bfnmYS\binitsY., \bauthor\bsnmGuo, \bfnmY\binitsY., \bauthor\bsnmShen, \bfnmHW\binitsH., \bauthor\bsnmZhang, \bfnmP\binitsP. and \bauthor\bsnmChen, \bfnmH\binitsH. (\byear2019b). \btitleScreening function enrichment and related signaling pathways bioinformatics analysis of differentially expressed gene in glioma. \bjournalZhonghua yi xue za zhi \bvolume99 \bpages2311–2314. \endbibitem
- de Sousa et al. (2017) {barticle}[author] \bauthor\bparticlede \bsnmSousa, \bfnmJuliana Ferreira\binitsJ. F., \bauthor\bsnmTorrieri, \bfnmRaul\binitsR., \bauthor\bsnmSerafim, \bfnmRodolfo Bortolozo\binitsR. B., \bauthor\bsnmDi Cristofaro, \bfnmLuis Fernando Macedo\binitsL. F. M., \bauthor\bsnmEscanfella, \bfnmFábio Dalbon\binitsF. D., \bauthor\bsnmRibeiro, \bfnmRodrigo\binitsR., \bauthor\bsnmZanette, \bfnmDalila Lucíola\binitsD. L., \bauthor\bsnmPaçó-Larson, \bfnmMaria Luisa\binitsM. L., \bauthor\bparticleda \bsnmSilva Jr, \bfnmWilson Araujo\binitsW. A., \bauthor\bsnmTirapelli, \bfnmDaniela Pretti da Cunha\binitsD. P. d. C. \betalet al. (\byear2017). \btitleExpression signatures of DNA repair genes correlate with survival prognosis of astrocytoma patients. \bjournalTumor Biology \bvolume39 \bpages1010428317694552. \endbibitem
- Fraile et al. (2016) {barticle}[author] \bauthor\bsnmFraile, \bfnmJulia M\binitsJ. M., \bauthor\bsnmCampos-Iglesias, \bfnmDiana\binitsD., \bauthor\bsnmRodríguez, \bfnmFrancisco\binitsF., \bauthor\bsnmEspañol, \bfnmYaiza\binitsY. and \bauthor\bsnmFreije, \bfnmJosé MP\binitsJ. M. (\byear2016). \btitleThe deubiquitinase USP54 is overexpressed in colorectal cancer stem cells and promotes intestinal tumorigenesis. \bjournalOncotarget \bvolume7 \bpages74427. \endbibitem
- George et al. (2010) {barticle}[author] \bauthor\bsnmGeorge, \bfnmAmee J\binitsA. J., \bauthor\bsnmGordon, \bfnmLavinia\binitsL., \bauthor\bsnmBeissbarth, \bfnmTim\binitsT., \bauthor\bsnmKoukoulas, \bfnmIrene\binitsI., \bauthor\bsnmHolsinger, \bfnmRM Damian\binitsR. D., \bauthor\bsnmPerreau, \bfnmVictoria\binitsV., \bauthor\bsnmCappai, \bfnmRoberto\binitsR., \bauthor\bsnmTan, \bfnmSeong-Seng\binitsS.-S., \bauthor\bsnmMasters, \bfnmColin L\binitsC. L., \bauthor\bsnmScott, \bfnmHamish S\binitsH. S. \betalet al. (\byear2010). \btitleA serial analysis of gene expression profile of the Alzheimer’s disease Tg2576 mouse model. \bjournalNeurotoxicity research \bvolume17 \bpages360–379. \endbibitem
- Grün et al. (2015) {barticle}[author] \bauthor\bsnmGrün, \bfnmDominic\binitsD., \bauthor\bsnmLyubimova, \bfnmAnna\binitsA., \bauthor\bsnmKester, \bfnmLennart\binitsL., \bauthor\bsnmWiebrands, \bfnmKay\binitsK., \bauthor\bsnmBasak, \bfnmOnur\binitsO., \bauthor\bsnmSasaki, \bfnmNobuo\binitsN., \bauthor\bsnmClevers, \bfnmHans\binitsH. and \bauthor\bsnmVan Oudenaarden, \bfnmAlexander\binitsA. (\byear2015). \btitleSingle-cell messenger RNA sequencing reveals rare intestinal cell types. \bjournalNature \bvolume525 \bpages251–255. \endbibitem
- Haghverdi et al. (2018) {barticle}[author] \bauthor\bsnmHaghverdi, \bfnmLaleh\binitsL., \bauthor\bsnmLun, \bfnmAaron TL\binitsA. T., \bauthor\bsnmMorgan, \bfnmMichael D\binitsM. D. and \bauthor\bsnmMarioni, \bfnmJohn C\binitsJ. C. (\byear2018). \btitleBatch effects in single-cell RNA-sequencing data are corrected by matching mutual nearest neighbors. \bjournalNature biotechnology \bvolume36 \bpages421–427. \endbibitem
- Hedlund and Deng (2018) {barticle}[author] \bauthor\bsnmHedlund, \bfnmEva\binitsE. and \bauthor\bsnmDeng, \bfnmQiaolin\binitsQ. (\byear2018). \btitleSingle-cell RNA sequencing: technical advancements and biological applications. \bjournalMolecular aspects of medicine \bvolume59 \bpages36–46. \endbibitem
- Hide et al. (2018) {barticle}[author] \bauthor\bsnmHide, \bfnmTakuichiro\binitsT., \bauthor\bsnmKomohara, \bfnmYoshihiro\binitsY., \bauthor\bsnmMiyasato, \bfnmYuko\binitsY., \bauthor\bsnmNakamura, \bfnmHideo\binitsH., \bauthor\bsnmMakino, \bfnmKeishi\binitsK., \bauthor\bsnmTakeya, \bfnmMotohiro\binitsM., \bauthor\bsnmKuratsu, \bfnmJun-ichi\binitsJ.-i., \bauthor\bsnmMukasa, \bfnmAkitake\binitsA. and \bauthor\bsnmYano, \bfnmShigetoshi\binitsS. (\byear2018). \btitleOligodendrocyte progenitor cells and macrophages/microglia produce glioma stem cell niches at the tumor border. \bjournalEBioMedicine \bvolume30 \bpages94–104. \endbibitem
- Hubert and Arabie (1985) {barticle}[author] \bauthor\bsnmHubert, \bfnmLawrence\binitsL. and \bauthor\bsnmArabie, \bfnmPhipps\binitsP. (\byear1985). \btitleComparing partitions. \bjournalJournal of classification \bvolume2 \bpages193–218. \endbibitem
- Jia et al. (2019) {barticle}[author] \bauthor\bsnmJia, \bfnmDanyun\binitsD., \bauthor\bsnmLin, \bfnmWei\binitsW., \bauthor\bsnmTang, \bfnmHongli\binitsH., \bauthor\bsnmCheng, \bfnmYifan\binitsY., \bauthor\bsnmXu, \bfnmKaiwei\binitsK., \bauthor\bsnmHe, \bfnmYanshu\binitsY., \bauthor\bsnmGeng, \bfnmWujun\binitsW. and \bauthor\bsnmDai, \bfnmQinxue\binitsQ. (\byear2019). \btitleIntegrative analysis of DNA methylation and gene expression to identify key epigenetic genes in glioblastoma. \bjournalAging (Albany NY) \bvolume11 \bpages5579. \endbibitem
- Johansson, Göransson and Westermark (2005) {barticle}[author] \bauthor\bsnmJohansson, \bfnmFredrik K\binitsF. K., \bauthor\bsnmGöransson, \bfnmHanna\binitsH. and \bauthor\bsnmWestermark, \bfnmBengt\binitsB. (\byear2005). \btitleExpression analysis of genes involved in brain tumor progression driven by retroviral insertional mutagenesis in mice. \bjournalOncogene \bvolume24 \bpages3896–3905. \endbibitem
- Johnson, Li and Rabinovic (2007) {barticle}[author] \bauthor\bsnmJohnson, \bfnmW Evan\binitsW. E., \bauthor\bsnmLi, \bfnmCheng\binitsC. and \bauthor\bsnmRabinovic, \bfnmAriel\binitsA. (\byear2007). \btitleAdjusting batch effects in microarray expression data using empirical Bayes methods. \bjournalBiostatistics \bvolume8 \bpages118–127. \endbibitem
- Kassambara and Mundt (2019) {bmanual}[author] \bauthor\bsnmKassambara, \bfnmAlboukadel\binitsA. and \bauthor\bsnmMundt, \bfnmFabian\binitsF. (\byear2019). \btitlefactoextra: Extract and Visualize the Results of Multivariate Data Analyses \bnoteR package version 1.0.6. \endbibitem
- Khalil et al. (2014) {barticle}[author] \bauthor\bsnmKhalil, \bfnmM\binitsM., \bauthor\bsnmRiedlbauer, \bfnmB\binitsB., \bauthor\bsnmLangkammer, \bfnmC\binitsC., \bauthor\bsnmEnzinger, \bfnmC\binitsC., \bauthor\bsnmRopele, \bfnmS\binitsS., \bauthor\bsnmStojakovic, \bfnmT\binitsT., \bauthor\bsnmScharnagl, \bfnmH\binitsH., \bauthor\bsnmCulea, \bfnmV\binitsV., \bauthor\bsnmPetzold, \bfnmA\binitsA., \bauthor\bsnmTeunissen, \bfnmCE\binitsC. \betalet al. (\byear2014). \btitleCerebrospinal fluid transferrin levels are reduced in patients with early multiple sclerosis. \bjournalMultiple Sclerosis Journal \bvolume20 \bpages1569–1577. \endbibitem
- Kim et al. (2011) {barticle}[author] \bauthor\bsnmKim, \bfnmJong Myung\binitsJ. M., \bauthor\bsnmSong, \bfnmJi Sun\binitsJ. S., \bauthor\bsnmCho, \bfnmHyun Hwa\binitsH. H., \bauthor\bsnmShin, \bfnmKeun Koo\binitsK. K., \bauthor\bsnmBae, \bfnmYong Chan\binitsY. C., \bauthor\bsnmLee, \bfnmByung Ju\binitsB. J. and \bauthor\bsnmJung, \bfnmJin Sup\binitsJ. S. (\byear2011). \btitleEffect of the modulation of leucine zipper tumor suppressor 2 expression on proliferation of various cancer cells functions as a tumor suppressor. \bjournalMolecular and cellular biochemistry \bvolume346 \bpages125–136. \endbibitem
- Kiselev, Andrews and Hemberg (2019) {barticle}[author] \bauthor\bsnmKiselev, \bfnmVladimir Yu\binitsV. Y., \bauthor\bsnmAndrews, \bfnmTallulah S\binitsT. S. and \bauthor\bsnmHemberg, \bfnmMartin\binitsM. (\byear2019). \btitleChallenges in unsupervised clustering of single-cell RNA-seq data. \bjournalNature Reviews Genetics \bvolume20 \bpages273–282. \endbibitem
- Kiselev et al. (2017) {barticle}[author] \bauthor\bsnmKiselev, \bfnmVladimir Yu\binitsV. Y., \bauthor\bsnmKirschner, \bfnmKristina\binitsK., \bauthor\bsnmSchaub, \bfnmMichael T\binitsM. T., \bauthor\bsnmAndrews, \bfnmTallulah\binitsT., \bauthor\bsnmYiu, \bfnmAndrew\binitsA., \bauthor\bsnmChandra, \bfnmTamir\binitsT., \bauthor\bsnmNatarajan, \bfnmKedar N\binitsK. N., \bauthor\bsnmReik, \bfnmWolf\binitsW., \bauthor\bsnmBarahona, \bfnmMauricio\binitsM., \bauthor\bsnmGreen, \bfnmAnthony R\binitsA. R. \betalet al. (\byear2017). \btitleSC3: consensus clustering of single-cell RNA-seq data. \bjournalNature methods \bvolume14 \bpages483–486. \endbibitem
- Kore and Abraham (2014) {barticle}[author] \bauthor\bsnmKore, \bfnmRajshekhar A\binitsR. A. and \bauthor\bsnmAbraham, \bfnmEdathara C\binitsE. C. (\byear2014). \btitleInflammatory cytokines, interleukin-1 beta and tumor necrosis factor-alpha, upregulated in glioblastoma multiforme, raise the levels of CRYAB in exosomes secreted by U373 glioma cells. \bjournalBiochemical and biophysical research communications \bvolume453 \bpages326–331. \endbibitem
- Lange (2013) {bincollection}[author] \bauthor\bsnmLange, \bfnmKenneth\binitsK. (\byear2013). \btitleThe MM algorithm. In \bbooktitleOptimization \bpages185–219. \bpublisherSpringer. \endbibitem
- Leite et al. (2014) {barticle}[author] \bauthor\bsnmLeite, \bfnmFabíola A\binitsF. A., \bauthor\bsnmLira, \bfnmRegia CP\binitsR. C., \bauthor\bsnmFedatto, \bfnmPaola F\binitsP. F., \bauthor\bsnmAntonini, \bfnmSonir RR\binitsS. R., \bauthor\bsnmMartinelli Jr, \bfnmCarlos E\binitsC. E., \bauthor\bparticlede \bsnmCastro, \bfnmMargaret\binitsM., \bauthor\bsnmNeder, \bfnmLuciano\binitsL., \bauthor\bsnmRamalho, \bfnmLeandra NZ\binitsL. N., \bauthor\bsnmTucci Jr, \bfnmSilvio\binitsS., \bauthor\bsnmMastelaro, \bfnmMaria J\binitsM. J. \betalet al. (\byear2014). \btitleLow expression of HLA-DRA, HLA-DPA1, and HLA-DPB1 is associated with poor prognosis in pediatric adrenocortical tumors (ACT). \bjournalPediatric blood & cancer \bvolume61 \bpages1940–1948. \endbibitem
- Li and Dewey (2011) {barticle}[author] \bauthor\bsnmLi, \bfnmBo\binitsB. and \bauthor\bsnmDewey, \bfnmColin N\binitsC. N. (\byear2011). \btitleRSEM: accurate transcript quantification from RNA-Seq data with or without a reference genome. \bjournalBMC bioinformatics \bvolume12 \bpages323. \endbibitem
- Lin, Troup and Ho (2017) {barticle}[author] \bauthor\bsnmLin, \bfnmPeijie\binitsP., \bauthor\bsnmTroup, \bfnmMichael\binitsM. and \bauthor\bsnmHo, \bfnmJoshua WK\binitsJ. W. (\byear2017). \btitleCIDR: Ultrafast and accurate clustering through imputation for single-cell RNA-seq data. \bjournalGenome biology \bvolume18 \bpages59. \endbibitem
- Lindner et al. (2010) {barticle}[author] \bauthor\bsnmLindner, \bfnmInge\binitsI., \bauthor\bsnmHemdan, \bfnmNasr YA\binitsN. Y., \bauthor\bsnmBuchold, \bfnmMartin\binitsM., \bauthor\bsnmHuse, \bfnmKlaus\binitsK., \bauthor\bsnmBigl, \bfnmMarina\binitsM., \bauthor\bsnmOerlecke, \bfnmIlka\binitsI., \bauthor\bsnmRicken, \bfnmAlbert\binitsA., \bauthor\bsnmGaunitz, \bfnmFrank\binitsF., \bauthor\bsnmSack, \bfnmUlrich\binitsU., \bauthor\bsnmNaumann, \bfnmAndreas\binitsA. \betalet al. (\byear2010). \btitle2-macroglobulin inhibits the malignant properties of astrocytoma cells by impeding -catenin signaling. \bjournalCancer research \bvolume70 \bpages277–287. \endbibitem
- M. Hajj et al. (2020) {barticle}[author] \bauthor\bsnmM. Hajj, \bfnmGlaucia N\binitsG. N., \bauthor\bparticleda \bsnmSilva, \bfnmFernanda F\binitsF. F., \bauthor\bparticlede \bsnmBellis, \bfnmBárbara\binitsB., \bauthor\bsnmLupinacci, \bfnmFernanda CS\binitsF. C., \bauthor\bsnmBellato, \bfnmHermano M\binitsH. M., \bauthor\bsnmCruz, \bfnmJuvanier R\binitsJ. R., \bauthor\bsnmSegundo, \bfnmClaudionor NC\binitsC. N., \bauthor\bsnmFaquini, \bfnmIgor V\binitsI. V., \bauthor\bsnmTorres, \bfnmLeuridan C\binitsL. C., \bauthor\bsnmSanematsu, \bfnmPaulo I\binitsP. I. \betalet al. (\byear2020). \btitleAberrant expression of RSK1 characterizes high-grade gliomas with immune infiltration. \bjournalMolecular oncology \bvolume14 \bpages159–179. \endbibitem
- Ma et al. (2018) {barticle}[author] \bauthor\bsnmMa, \bfnmChangguo\binitsC., \bauthor\bsnmGu, \bfnmChunjie\binitsC., \bauthor\bsnmHuo, \bfnmYongxia\binitsY., \bauthor\bsnmLi, \bfnmXiaoyan\binitsX. and \bauthor\bsnmLuo, \bfnmXiong-Jian\binitsX.-J. (\byear2018). \btitleThe integrated landscape of causal genes and pathways in schizophrenia. \bjournalTranslational psychiatry \bvolume8 \bpages1–14. \endbibitem
- Maheras et al. (2018) {barticle}[author] \bauthor\bsnmMaheras, \bfnmKathleen J\binitsK. J., \bauthor\bsnmPeppi, \bfnmMarcello\binitsM., \bauthor\bsnmGhoddoussi, \bfnmFarhad\binitsF., \bauthor\bsnmGalloway, \bfnmMatthew P\binitsM. P., \bauthor\bsnmPerrine, \bfnmShane A\binitsS. A. and \bauthor\bsnmGow, \bfnmAlexander\binitsA. (\byear2018). \btitleAbsence of claudin 11 in CNS myelin perturbs behavior and neurotransmitter levels in mice. \bjournalScientific reports \bvolume8 \bpages1–16. \endbibitem
- Mangogna et al. (2019) {barticle}[author] \bauthor\bsnmMangogna, \bfnmAlessandro\binitsA., \bauthor\bsnmBelmonte, \bfnmBeatrice\binitsB., \bauthor\bsnmAgostinis, \bfnmChiara\binitsC., \bauthor\bsnmZacchi, \bfnmPaola\binitsP., \bauthor\bsnmIacopino, \bfnmDomenico Gerardo\binitsD. G., \bauthor\bsnmMartorana, \bfnmAnna\binitsA., \bauthor\bsnmRodolico, \bfnmVito\binitsV., \bauthor\bsnmBonazza, \bfnmDeborah\binitsD., \bauthor\bsnmZanconati, \bfnmFabrizio\binitsF., \bauthor\bsnmKishore, \bfnmUday\binitsU. \betalet al. (\byear2019). \btitlePrognostic Implications of the Complement Protein C1q in Gliomas. \bjournalFrontiers in immunology \bvolume10 \bpages2366. \endbibitem
- Metsu et al. (2014) {barticle}[author] \bauthor\bsnmMetsu, \bfnmSofie\binitsS., \bauthor\bsnmRainger, \bfnmJacqueline K\binitsJ. K., \bauthor\bsnmDebacker, \bfnmKim\binitsK., \bauthor\bsnmBernhard, \bfnmBirgitta\binitsB., \bauthor\bsnmRooms, \bfnmLiesbeth\binitsL., \bauthor\bsnmGrafodatskaya, \bfnmDaria\binitsD., \bauthor\bsnmWeksberg, \bfnmRosanna\binitsR., \bauthor\bsnmFombonne, \bfnmEric\binitsE., \bauthor\bsnmTaylor, \bfnmMartin S\binitsM. S., \bauthor\bsnmScherer, \bfnmStephen W\binitsS. W. \betalet al. (\byear2014). \btitleA CGG-Repeat Expansion Mutation in ZNF 713 Causes FRA 7 A: Association with Autistic Spectrum Disorder in Two Families. \bjournalHuman mutation \bvolume35 \bpages1295–1300. \endbibitem
- Mittelbronn et al. (2007) {barticle}[author] \bauthor\bsnmMittelbronn, \bfnmMichel\binitsM., \bauthor\bsnmSimon, \bfnmPerikles\binitsP., \bauthor\bsnmLöffler, \bfnmChristian\binitsC., \bauthor\bsnmCapper, \bfnmDavid\binitsD., \bauthor\bsnmBunz, \bfnmBenedikt\binitsB., \bauthor\bsnmHarter, \bfnmPatrick\binitsP., \bauthor\bsnmSchlaszus, \bfnmHolger\binitsH., \bauthor\bsnmSchleich, \bfnmAriane\binitsA., \bauthor\bsnmTabatabai, \bfnmGhazaleh\binitsG., \bauthor\bsnmGoeppert, \bfnmBenjamin\binitsB. \betalet al. (\byear2007). \btitleElevated HLA-E levels in human glioblastomas but not in grade I to III astrocytomas correlate with infiltrating CD8+ cells. \bjournalJournal of neuroimmunology \bvolume189 \bpages50–58. \endbibitem
- Miyauchi et al. (2018) {barticle}[author] \bauthor\bsnmMiyauchi, \bfnmEisuke\binitsE., \bauthor\bsnmFuruta, \bfnmTakuya\binitsT., \bauthor\bsnmOhtsuki, \bfnmSumio\binitsS., \bauthor\bsnmTachikawa, \bfnmMasanori\binitsM., \bauthor\bsnmUchida, \bfnmYasuo\binitsY., \bauthor\bsnmSabit, \bfnmHemragul\binitsH., \bauthor\bsnmObuchi, \bfnmWataru\binitsW., \bauthor\bsnmBaba, \bfnmTomoko\binitsT., \bauthor\bsnmWatanabe, \bfnmMichitoshi\binitsM., \bauthor\bsnmTerasaki, \bfnmTetsuya\binitsT. \betalet al. (\byear2018). \btitleIdentification of blood biomarkers in glioblastoma by SWATH mass spectrometry and quantitative targeted absolute proteomics. \bjournalPloS one \bvolume13. \endbibitem
- Moral-Morales et al. (2020) {barticle}[author] \bauthor\bsnmMoral-Morales, \bfnmDel\binitsD., \bauthor\bsnmGonzález-Orozco, \bfnmJuan Carlos\binitsJ. C., \bauthor\bsnmCapetillo-Velázquez, \bfnmJosé Moisés\binitsJ. M., \bauthor\bsnmPiña-Medina, \bfnmAna Gabriela\binitsA. G., \bauthor\bsnmCamacho-Arroyo, \bfnmIgnacio\binitsI. \betalet al. (\byear2020). \btitleThe role of mPR and mPR in human glioblastoma cells: expression, hormonal regulation, and possible clinical outcome. \bjournalHormones and Cancer \bvolume11 \bpages117–127. \endbibitem
- Murakami et al. (2011) {barticle}[author] \bauthor\bsnmMurakami, \bfnmAkihiro\binitsA., \bauthor\bsnmFukushima, \bfnmChikako\binitsC., \bauthor\bsnmYoshidomi, \bfnmKeiko\binitsK., \bauthor\bsnmSueoka, \bfnmKotaro\binitsK., \bauthor\bsnmNawata, \bfnmShugo\binitsS., \bauthor\bsnmYokoyama, \bfnmYoshihito\binitsY., \bauthor\bsnmTsuchida, \bfnmShigeki\binitsS., \bauthor\bsnmIsmail, \bfnmEndom\binitsE., \bauthor\bsnmAl-Mulla, \bfnmFahd\binitsF. and \bauthor\bsnmSugino, \bfnmNorihiro\binitsN. (\byear2011). \btitleSuppression of carbonyl reductase expression enhances malignant behaviour in uterine cervical squamous cell carcinoma: Carbonyl reductase predicts prognosis and lymph node metastasis. \bjournalCancer letters \bvolume311 \bpages77–84. \endbibitem
- Nicole and Pacary (2020) {barticle}[author] \bauthor\bsnmNicole, \bfnmOlivier\binitsO. and \bauthor\bsnmPacary, \bfnmEmilie\binitsE. (\byear2020). \btitleCaMKII in Neuronal Development and Plasticity: An Emerging Candidate in Brain Diseases. \bjournalInternational Journal of Molecular Sciences \bvolume21 \bpages7272. \endbibitem
- O’Leary et al. (2016) {barticle}[author] \bauthor\bsnmO’Leary, \bfnmNuala A\binitsN. A., \bauthor\bsnmWright, \bfnmMathew W\binitsM. W., \bauthor\bsnmBrister, \bfnmJ Rodney\binitsJ. R., \bauthor\bsnmCiufo, \bfnmStacy\binitsS., \bauthor\bsnmHaddad, \bfnmDiana\binitsD., \bauthor\bsnmMcVeigh, \bfnmRich\binitsR., \bauthor\bsnmRajput, \bfnmBhanu\binitsB., \bauthor\bsnmRobbertse, \bfnmBarbara\binitsB., \bauthor\bsnmSmith-White, \bfnmBrian\binitsB., \bauthor\bsnmAko-Adjei, \bfnmDanso\binitsD. \betalet al. (\byear2016). \btitleReference sequence (RefSeq) database at NCBI: current status, taxonomic expansion, and functional annotation. \bjournalNucleic acids research \bvolume44 \bpagesD733–D745. \endbibitem
- Petegrosso, Li and Kuang (2019) {barticle}[author] \bauthor\bsnmPetegrosso, \bfnmRaphael\binitsR., \bauthor\bsnmLi, \bfnmZhuliu\binitsZ. and \bauthor\bsnmKuang, \bfnmRui\binitsR. (\byear2019). \btitleMachine learning and statistical methods for clustering single-cell RNA-sequencing data. \bjournalBriefings in bioinformatics. \endbibitem
- Petropoulos et al. (2016) {barticle}[author] \bauthor\bsnmPetropoulos, \bfnmSophie\binitsS., \bauthor\bsnmEdsgärd, \bfnmDaniel\binitsD., \bauthor\bsnmReinius, \bfnmBjörn\binitsB., \bauthor\bsnmDeng, \bfnmQiaolin\binitsQ., \bauthor\bsnmPanula, \bfnmSarita Pauliina\binitsS. P., \bauthor\bsnmCodeluppi, \bfnmSimone\binitsS., \bauthor\bsnmReyes, \bfnmAlvaro Plaza\binitsA. P., \bauthor\bsnmLinnarsson, \bfnmSten\binitsS., \bauthor\bsnmSandberg, \bfnmRickard\binitsR. and \bauthor\bsnmLanner, \bfnmFredrik\binitsF. (\byear2016). \btitleSingle-cell RNA-seq reveals lineage and X chromosome dynamics in human preimplantation embryos. \bjournalCell \bvolume165 \bpages1012–1026. \endbibitem
- Peyrot and Price (2021) {barticle}[author] \bauthor\bsnmPeyrot, \bfnmWouter J\binitsW. J. and \bauthor\bsnmPrice, \bfnmAlkes L\binitsA. L. (\byear2021). \btitleIdentifying loci with different allele frequencies among cases of eight psychiatric disorders using CC-GWAS. \bjournalNature genetics \bvolume53 \bpages445–454. \endbibitem
- Picelli et al. (2014) {barticle}[author] \bauthor\bsnmPicelli, \bfnmSimone\binitsS., \bauthor\bsnmFaridani, \bfnmOmid R\binitsO. R., \bauthor\bsnmBjörklund, \bfnmÅsa K\binitsÅ. K., \bauthor\bsnmWinberg, \bfnmGösta\binitsG., \bauthor\bsnmSagasser, \bfnmSven\binitsS. and \bauthor\bsnmSandberg, \bfnmRickard\binitsR. (\byear2014). \btitleFull-length RNA-seq from single cells using Smart-seq2. \bjournalNature protocols \bvolume9 \bpages171. \endbibitem
- Pierson and Yau (2015) {barticle}[author] \bauthor\bsnmPierson, \bfnmEmma\binitsE. and \bauthor\bsnmYau, \bfnmChristopher\binitsC. (\byear2015). \btitleZIFA: Dimensionality reduction for zero-inflated single-cell gene expression analysis. \bjournalGenome biology \bvolume16 \bpages241. \endbibitem
- Prakadan, Shalek and Weitz (2017) {barticle}[author] \bauthor\bsnmPrakadan, \bfnmSanjay M\binitsS. M., \bauthor\bsnmShalek, \bfnmAlex K\binitsA. K. and \bauthor\bsnmWeitz, \bfnmDavid A\binitsD. A. (\byear2017). \btitleScaling by shrinking: empowering single-cell’omics’ with microfluidic devices. \bjournalNature Reviews Genetics \bvolume18 \bpages345. \endbibitem
- Reinius et al. (2016) {barticle}[author] \bauthor\bsnmReinius, \bfnmBjörn\binitsB., \bauthor\bsnmMold, \bfnmJeff E\binitsJ. E., \bauthor\bsnmRamsköld, \bfnmDaniel\binitsD., \bauthor\bsnmDeng, \bfnmQiaolin\binitsQ., \bauthor\bsnmJohnsson, \bfnmPer\binitsP., \bauthor\bsnmMichaëlsson, \bfnmJakob\binitsJ., \bauthor\bsnmFrisén, \bfnmJonas\binitsJ. and \bauthor\bsnmSandberg, \bfnmRickard\binitsR. (\byear2016). \btitleAnalysis of allelic expression patterns in clonal somatic cells by single-cell RNA–seq. \bjournalNature genetics \bvolume48 \bpages1430. \endbibitem
- Risso et al. (2018) {barticle}[author] \bauthor\bsnmRisso, \bfnmDavide\binitsD., \bauthor\bsnmPerraudeau, \bfnmFanny\binitsF., \bauthor\bsnmGribkova, \bfnmSvetlana\binitsS., \bauthor\bsnmDudoit, \bfnmSandrine\binitsS. and \bauthor\bsnmVert, \bfnmJean-Philippe\binitsJ.-P. (\byear2018). \btitleA general and flexible method for signal extraction from single-cell RNA-seq data. \bjournalNature communications \bvolume9 \bpages1–17. \endbibitem
- Rousseau et al. (2006) {barticle}[author] \bauthor\bsnmRousseau, \bfnmAudrey\binitsA., \bauthor\bsnmNutt, \bfnmCatherine L\binitsC. L., \bauthor\bsnmBetensky, \bfnmRebecca A\binitsR. A., \bauthor\bsnmIafrate, \bfnmA John\binitsA. J., \bauthor\bsnmHan, \bfnmMoonjoo\binitsM., \bauthor\bsnmLigon, \bfnmKeith L\binitsK. L., \bauthor\bsnmRowitch, \bfnmDavid H\binitsD. H. and \bauthor\bsnmLouis, \bfnmDavid N\binitsD. N. (\byear2006). \btitleExpression of oligodendroglial and astrocytic lineage markers in diffuse gliomas: use of YKL-40, ApoE, ASCL1, and NKX2-2. \bjournalJournal of Neuropathology & Experimental Neurology \bvolume65 \bpages1149–1156. \endbibitem
- Rousseeuw (1987) {barticle}[author] \bauthor\bsnmRousseeuw, \bfnmPeter J\binitsP. J. (\byear1987). \btitleSilhouettes: a graphical aid to the interpretation and validation of cluster analysis. \bjournalJournal of computational and applied mathematics \bvolume20 \bpages53–65. \endbibitem
- Sawcer et al. (2011) {barticle}[author] \bauthor\bsnmSawcer, \bfnmStephen\binitsS., \bauthor\bsnmHellenthal, \bfnmGarrett\binitsG., \bauthor\bsnmPirinen, \bfnmMatti\binitsM., \bauthor\bsnmSpencer, \bfnmChris CA\binitsC. C., \bauthor\bsnmPatsopoulos, \bfnmNikolaos A\binitsN. A., \bauthor\bsnmMoutsianas, \bfnmLoukas\binitsL., \bauthor\bsnmDilthey, \bfnmAlexander\binitsA., \bauthor\bsnmSu, \bfnmZhan\binitsZ., \bauthor\bsnmFreeman, \bfnmColin\binitsC., \bauthor\bsnmHunt, \bfnmSarah E\binitsS. E. \betalet al. (\byear2011). \btitleGenetic risk and a primary role for cell-mediated immune mechanisms in multiple sclerosis. \bjournalNature \bvolume476 \bpages214. \endbibitem
- Shi et al. (2017) {barticle}[author] \bauthor\bsnmShi, \bfnmYu\binitsY., \bauthor\bsnmPing, \bfnmYi-Fang\binitsY.-F., \bauthor\bsnmZhou, \bfnmWenchao\binitsW., \bauthor\bsnmHe, \bfnmZhi-Cheng\binitsZ.-C., \bauthor\bsnmChen, \bfnmCong\binitsC., \bauthor\bsnmZhang, \bfnmLin\binitsL., \bauthor\bsnmChen, \bfnmLu\binitsL., \bauthor\bsnmLan, \bfnmXun\binitsX., \bauthor\bsnmZhang, \bfnmXian-Chao\binitsX.-C., \bauthor\bsnmZhou, \bfnmKai\binitsK. \betalet al. (\byear2017). \btitleTumour-associated macrophages secrete pleiotrophin to promote PTPRZ1 signalling in glioblastoma stem cells for tumour growth. \bjournalNature communications \bvolume8 \bpages1–17. \endbibitem
- Sinmaz et al. (2016) {barticle}[author] \bauthor\bsnmSinmaz, \bfnmNese\binitsN., \bauthor\bsnmNguyen, \bfnmTina\binitsT., \bauthor\bsnmTea, \bfnmFiona\binitsF., \bauthor\bsnmDale, \bfnmRussell C\binitsR. C. and \bauthor\bsnmBrilot, \bfnmFabienne\binitsF. (\byear2016). \btitleMapping autoantigen epitopes: molecular insights into autoantibody-associated disorders of the nervous system. \bjournalJournal of neuroinflammation \bvolume13 \bpages219. \endbibitem
- Sinreih et al. (2018) {barticle}[author] \bauthor\bsnmSinreih, \bfnmMaša\binitsM., \bauthor\bsnmKnific, \bfnmTamara\binitsT., \bauthor\bsnmThomas, \bfnmPeter\binitsP., \bauthor\bsnmGrazio, \bfnmSnježana Frković\binitsS. F. and \bauthor\bsnmRižner, \bfnmTea Lanišnik\binitsT. L. (\byear2018). \btitleMembrane progesterone receptors and have potential as prognostic biomarkers of endometrial cancer. \bjournalThe Journal of steroid biochemistry and molecular biology \bvolume178 \bpages303–311. \endbibitem
- Stegle, Teichmann and Marioni (2015) {barticle}[author] \bauthor\bsnmStegle, \bfnmOliver\binitsO., \bauthor\bsnmTeichmann, \bfnmSarah A\binitsS. A. and \bauthor\bsnmMarioni, \bfnmJohn C\binitsJ. C. (\byear2015). \btitleComputational and analytical challenges in single-cell transcriptomics. \bjournalNature Reviews Genetics \bvolume16 \bpages133–145. \endbibitem
- Szulzewsky et al. (2015) {barticle}[author] \bauthor\bsnmSzulzewsky, \bfnmFrank\binitsF., \bauthor\bsnmPelz, \bfnmAndreas\binitsA., \bauthor\bsnmFeng, \bfnmXi\binitsX., \bauthor\bsnmSynowitz, \bfnmMichael\binitsM., \bauthor\bsnmMarkovic, \bfnmDarko\binitsD., \bauthor\bsnmLangmann, \bfnmThomas\binitsT., \bauthor\bsnmHoltman, \bfnmInge R\binitsI. R., \bauthor\bsnmWang, \bfnmXi\binitsX., \bauthor\bsnmEggen, \bfnmBart JL\binitsB. J., \bauthor\bsnmBoddeke, \bfnmHendrikus WGM\binitsH. W. \betalet al. (\byear2015). \btitleGlioma-associated microglia/macrophages display an expression profile different from M1 and M2 polarization and highly express Gpnmb and Spp1. \bjournalPloS one \bvolume10. \endbibitem
- R Core Team (2018) {bmanual}[author] \bauthor\bsnmR Core Team (\byear2018). \btitleR: A Language and Environment for Statistical Computing \bpublisherR Foundation for Statistical Computing, \baddressVienna, Austria. \endbibitem
- Thyssen et al. (2006) {barticle}[author] \bauthor\bsnmThyssen, \bfnmGregory\binitsG., \bauthor\bsnmLi, \bfnmTzu-Huey\binitsT.-H., \bauthor\bsnmLehmann, \bfnmLynn\binitsL., \bauthor\bsnmZhuo, \bfnmMing\binitsM., \bauthor\bsnmSharma, \bfnmManju\binitsM. and \bauthor\bsnmSun, \bfnmZijie\binitsZ. (\byear2006). \btitleLZTS2 is a novel -catenin-interacting protein and regulates the nuclear export of -catenin. \bjournalMolecular and cellular biology \bvolume26 \bpages8857–8867. \endbibitem
- Tibshirani, Walther and Hastie (2001) {barticle}[author] \bauthor\bsnmTibshirani, \bfnmRobert\binitsR., \bauthor\bsnmWalther, \bfnmGuenther\binitsG. and \bauthor\bsnmHastie, \bfnmTrevor\binitsT. (\byear2001). \btitleEstimating the number of clusters in a data set via the gap statistic. \bjournalJournal of the Royal Statistical Society: Series B (Statistical Methodology) \bvolume63 \bpages411–423. \endbibitem
- Treutlein et al. (2014) {barticle}[author] \bauthor\bsnmTreutlein, \bfnmBarbara\binitsB., \bauthor\bsnmBrownfield, \bfnmDoug G\binitsD. G., \bauthor\bsnmWu, \bfnmAngela R\binitsA. R., \bauthor\bsnmNeff, \bfnmNorma F\binitsN. F., \bauthor\bsnmMantalas, \bfnmGary L\binitsG. L., \bauthor\bsnmEspinoza, \bfnmF Hernan\binitsF. H., \bauthor\bsnmDesai, \bfnmTushar J\binitsT. J., \bauthor\bsnmKrasnow, \bfnmMark A\binitsM. A. and \bauthor\bsnmQuake, \bfnmStephen R\binitsS. R. (\byear2014). \btitleReconstructing lineage hierarchies of the distal lung epithelium using single-cell RNA-seq. \bjournalNature \bvolume509 \bpages371–375. \endbibitem
- Tung et al. (2017) {barticle}[author] \bauthor\bsnmTung, \bfnmPo-Yuan\binitsP.-Y., \bauthor\bsnmBlischak, \bfnmJohn D\binitsJ. D., \bauthor\bsnmHsiao, \bfnmChiaowen Joyce\binitsC. J., \bauthor\bsnmKnowles, \bfnmDavid A\binitsD. A., \bauthor\bsnmBurnett, \bfnmJonathan E\binitsJ. E., \bauthor\bsnmPritchard, \bfnmJonathan K\binitsJ. K. and \bauthor\bsnmGilad, \bfnmYoav\binitsY. (\byear2017). \btitleBatch effects and the effective design of single-cell gene expression studies. \bjournalScientific reports \bvolume7 \bpages39921. \endbibitem
- Vallejos et al. (2017) {barticle}[author] \bauthor\bsnmVallejos, \bfnmCatalina A\binitsC. A., \bauthor\bsnmRisso, \bfnmDavide\binitsD., \bauthor\bsnmScialdone, \bfnmAntonio\binitsA., \bauthor\bsnmDudoit, \bfnmSandrine\binitsS. and \bauthor\bsnmMarioni, \bfnmJohn C\binitsJ. C. (\byear2017). \btitleNormalizing single-cell RNA sequencing data: challenges and opportunities. \bjournalNature methods \bvolume14 \bpages565. \endbibitem
- Venteicher et al. (2017) {barticle}[author] \bauthor\bsnmVenteicher, \bfnmAndrew S\binitsA. S., \bauthor\bsnmTirosh, \bfnmItay\binitsI., \bauthor\bsnmHebert, \bfnmChristine\binitsC., \bauthor\bsnmYizhak, \bfnmKeren\binitsK., \bauthor\bsnmNeftel, \bfnmCyril\binitsC., \bauthor\bsnmFilbin, \bfnmMariella G\binitsM. G., \bauthor\bsnmHovestadt, \bfnmVolker\binitsV., \bauthor\bsnmEscalante, \bfnmLeah E\binitsL. E., \bauthor\bsnmShaw, \bfnmMcKenzie L\binitsM. L., \bauthor\bsnmRodman, \bfnmChristopher\binitsC. \betalet al. (\byear2017). \btitleDecoupling genetics, lineages, and microenvironment in IDH-mutant gliomas by single-cell RNA-seq. \bjournalScience \bvolume355 \bpageseaai8478. \endbibitem
- Vidyarthi et al. (2019) {barticle}[author] \bauthor\bsnmVidyarthi, \bfnmAurobind\binitsA., \bauthor\bsnmAgnihotri, \bfnmTapan\binitsT., \bauthor\bsnmKhan, \bfnmNargis\binitsN., \bauthor\bsnmSingh, \bfnmSanpreet\binitsS., \bauthor\bsnmTewari, \bfnmManoj K\binitsM. K., \bauthor\bsnmRadotra, \bfnmBishan D\binitsB. D., \bauthor\bsnmChatterjee, \bfnmDeepyan\binitsD. and \bauthor\bsnmAgrewala, \bfnmJaved N\binitsJ. N. (\byear2019). \btitlePredominance of M2 macrophages in gliomas leads to the suppression of local and systemic immunity. \bjournalCancer Immunology, Immunotherapy \bvolume68 \bpages1995–2004. \endbibitem
- Wang and Bodovitz (2010) {barticle}[author] \bauthor\bsnmWang, \bfnmDaojing\binitsD. and \bauthor\bsnmBodovitz, \bfnmSteven\binitsS. (\byear2010). \btitleSingle cell analysis: the new frontier in ‘omics’. \bjournalTrends in biotechnology \bvolume28 \bpages281–290. \endbibitem
- Wang, Li and Leng (2009) {barticle}[author] \bauthor\bsnmWang, \bfnmHansheng\binitsH., \bauthor\bsnmLi, \bfnmBo\binitsB. and \bauthor\bsnmLeng, \bfnmChenlei\binitsC. (\byear2009). \btitleShrinkage tuning parameter selection with a diverging number of parameters. \bjournalJournal of the Royal Statistical Society: Series B (Statistical Methodology) \bvolume71 \bpages671–683. \endbibitem
- Wang et al. (2014) {barticle}[author] \bauthor\bsnmWang, \bfnmJiajia\binitsJ., \bauthor\bsnmFeng, \bfnmXuemei\binitsX., \bauthor\bsnmBai, \bfnmZhouxian\binitsZ., \bauthor\bsnmJin, \bfnmLee-Way\binitsL.-W., \bauthor\bsnmDuan, \bfnmYong\binitsY. and \bauthor\bsnmLei, \bfnmHongxing\binitsH. (\byear2014). \btitleChromosome 19p in Alzheimer’s disease: When genome meets transcriptome. \bjournalJournal of Alzheimer’s disease \bvolume38 \bpages245–250. \endbibitem
- Wang et al. (2019) {barticle}[author] \bauthor\bsnmWang, \bfnmShao-Ming\binitsS.-M., \bauthor\bsnmLin, \bfnmHong-Yi\binitsH.-Y., \bauthor\bsnmChen, \bfnmYen-Lin\binitsY.-L., \bauthor\bsnmHsu, \bfnmTsung-I\binitsT.-I., \bauthor\bsnmChuang, \bfnmJian-Ying\binitsJ.-Y., \bauthor\bsnmKao, \bfnmTzu-Jen\binitsT.-J. and \bauthor\bsnmKo, \bfnmChiung-Yuan\binitsC.-Y. (\byear2019). \btitleCCAAT/enhancer-binding protein delta regulates the stemness of glioma stem-like cells through activating PDGFA expression upon inflammatory stimulation. \bjournalJournal of neuroinflammation \bvolume16 \bpages146. \endbibitem
- Xia et al. (2019) {barticle}[author] \bauthor\bsnmXia, \bfnmZhenkun\binitsZ., \bauthor\bsnmOuyang, \bfnmDengjie\binitsD., \bauthor\bsnmLi, \bfnmQianying\binitsQ., \bauthor\bsnmLi, \bfnmMoyun\binitsM., \bauthor\bsnmZou, \bfnmQiongyan\binitsQ., \bauthor\bsnmLi, \bfnmLun\binitsL., \bauthor\bsnmYi, \bfnmWenjun\binitsW. and \bauthor\bsnmZhou, \bfnmEnxiang\binitsE. (\byear2019). \btitleThe expression, functions, interactions and prognostic values of PTPRZ1: a review and bioinformatic analysis. \bjournalJournal of Cancer \bvolume10 \bpages1663. \endbibitem
- Xiong et al. (2019) {barticle}[author] \bauthor\bsnmXiong, \bfnmDan-Dan\binitsD.-D., \bauthor\bsnmXu, \bfnmWen-Qing\binitsW.-Q., \bauthor\bsnmHe, \bfnmRong-Quan\binitsR.-Q., \bauthor\bsnmDang, \bfnmYi-Wu\binitsY.-W., \bauthor\bsnmChen, \bfnmGang\binitsG. and \bauthor\bsnmLuo, \bfnmDian-Zhong\binitsD.-Z. (\byear2019). \btitleIn silico analysis identified miRNA-based therapeutic agents against glioblastoma multiforme. \bjournalOncology reports \bvolume41 \bpages2194–2208. \endbibitem
- Xu et al. (2020) {barticle}[author] \bauthor\bsnmXu, \bfnmJunlin\binitsJ., \bauthor\bsnmCai, \bfnmLijun\binitsL., \bauthor\bsnmLiao, \bfnmBo\binitsB., \bauthor\bsnmZhu, \bfnmWen\binitsW. and \bauthor\bsnmYang, \bfnmJiaLiang\binitsJ. (\byear2020). \btitleCMF-Impute: an accurate imputation tool for single-cell RNA-seq data. \bjournalBioinformatics. \endbibitem
- Xue et al. (2013) {barticle}[author] \bauthor\bsnmXue, \bfnmZhigang\binitsZ., \bauthor\bsnmHuang, \bfnmKevin\binitsK., \bauthor\bsnmCai, \bfnmChaochao\binitsC., \bauthor\bsnmCai, \bfnmLingbo\binitsL., \bauthor\bsnmJiang, \bfnmChun-yan\binitsC.-y., \bauthor\bsnmFeng, \bfnmYun\binitsY., \bauthor\bsnmLiu, \bfnmZhenshan\binitsZ., \bauthor\bsnmZeng, \bfnmQiao\binitsQ., \bauthor\bsnmCheng, \bfnmLiming\binitsL., \bauthor\bsnmSun, \bfnmYi E\binitsY. E. \betalet al. (\byear2013). \btitleGenetic programs in human and mouse early embryos revealed by single-cell RNA sequencing. \bjournalNature \bvolume500 \bpages593–597. \endbibitem
- Yuan et al. (2018) {barticle}[author] \bauthor\bsnmYuan, \bfnmJinzhou\binitsJ., \bauthor\bsnmLevitin, \bfnmHanna Mendes\binitsH. M., \bauthor\bsnmFrattini, \bfnmVeronique\binitsV., \bauthor\bsnmBush, \bfnmErin C\binitsE. C., \bauthor\bsnmBoyett, \bfnmDeborah M\binitsD. M., \bauthor\bsnmSamanamud, \bfnmJorge\binitsJ., \bauthor\bsnmCeccarelli, \bfnmMichele\binitsM., \bauthor\bsnmDovas, \bfnmAthanassios\binitsA., \bauthor\bsnmZanazzi, \bfnmGeorge\binitsG., \bauthor\bsnmCanoll, \bfnmPeter\binitsP. \betalet al. (\byear2018). \btitleSingle-cell transcriptome analysis of lineage diversity in high-grade glioma. \bjournalGenome medicine \bvolume10 \bpages1–15. \endbibitem
- Zeiner et al. (2015) {barticle}[author] \bauthor\bsnmZeiner, \bfnmPia S\binitsP. S., \bauthor\bsnmPreusse, \bfnmCorinna\binitsC., \bauthor\bsnmBlank, \bfnmAnna-Eva\binitsA.-E., \bauthor\bsnmZachskorn, \bfnmCornelia\binitsC., \bauthor\bsnmBaumgarten, \bfnmPeter\binitsP., \bauthor\bsnmCaspary, \bfnmLixi\binitsL., \bauthor\bsnmBraczynski, \bfnmAnne K\binitsA. K., \bauthor\bsnmWeissenberger, \bfnmJakob\binitsJ., \bauthor\bsnmBratzke, \bfnmHansjürgen\binitsH., \bauthor\bsnmReiß, \bfnmSandy\binitsS. \betalet al. (\byear2015). \btitleMIF Receptor CD 74 is Restricted to Microglia/Macrophages, Associated with a M 1-Polarized Immune Milieu and Prolonged Patient Survival in Gliomas. \bjournalBrain pathology \bvolume25 \bpages491–504. \endbibitem
- Zeiner et al. (2019) {barticle}[author] \bauthor\bsnmZeiner, \bfnmPia S\binitsP. S., \bauthor\bsnmPreusse, \bfnmCorinna\binitsC., \bauthor\bsnmGolebiewska, \bfnmAnna\binitsA., \bauthor\bsnmZinke, \bfnmJenny\binitsJ., \bauthor\bsnmIriondo, \bfnmAne\binitsA., \bauthor\bsnmMuller, \bfnmArnaud\binitsA., \bauthor\bsnmKaoma, \bfnmTony\binitsT., \bauthor\bsnmFilipski, \bfnmKatharina\binitsK., \bauthor\bsnmMüller-Eschner, \bfnmMonika\binitsM., \bauthor\bsnmBernatz, \bfnmSimon\binitsS. \betalet al. (\byear2019). \btitleDistribution and prognostic impact of microglia/macrophage subpopulations in gliomas. \bjournalBrain Pathology \bvolume29 \bpages513–529. \endbibitem
- Zhan et al. (2015) {barticle}[author] \bauthor\bsnmZhan, \bfnmXinhua\binitsX., \bauthor\bsnmJickling, \bfnmGlen C\binitsG. C., \bauthor\bsnmAnder, \bfnmBradley P\binitsB. P., \bauthor\bsnmStamova, \bfnmBoryana\binitsB., \bauthor\bsnmLiu, \bfnmDaZhi\binitsD., \bauthor\bsnmKao, \bfnmPatricia F\binitsP. F., \bauthor\bsnmZelin, \bfnmMariko A\binitsM. A., \bauthor\bsnmJin, \bfnmLee-Way\binitsL.-W., \bauthor\bsnmDeCarli, \bfnmCharles\binitsC. and \bauthor\bsnmSharp, \bfnmFrank R\binitsF. R. (\byear2015). \btitleMyelin Basic Protein Associates with APP, A 1-42, and Amyloid Plaques in Cortex of Alzheimer’s Disease Brain. \bjournalJournal of Alzheimer’s disease \bvolume44 \bpages1213–1229. \endbibitem
- Zhang, Wu and Tian (2019) {barticle}[author] \bauthor\bsnmZhang, \bfnmFeng\binitsF., \bauthor\bsnmWu, \bfnmYu\binitsY. and \bauthor\bsnmTian, \bfnmWeidong\binitsW. (\byear2019). \btitleA novel approach to remove the batch effect of single-cell data. \bjournalCell discovery \bvolume5 \bpages1–4. \endbibitem
- Zhang et al. (2018) {barticle}[author] \bauthor\bsnmZhang, \bfnmDa-Lin\binitsD.-L., \bauthor\bsnmQu, \bfnmLi-Wei\binitsL.-W., \bauthor\bsnmMa, \bfnmLiang\binitsL., \bauthor\bsnmZhou, \bfnmYong-Chun\binitsY.-C., \bauthor\bsnmWang, \bfnmGui-Zhen\binitsG.-Z., \bauthor\bsnmZhao, \bfnmXin-Chun\binitsX.-C., \bauthor\bsnmZhang, \bfnmChen\binitsC., \bauthor\bsnmZhang, \bfnmYan-Fei\binitsY.-F., \bauthor\bsnmWang, \bfnmMin\binitsM., \bauthor\bsnmZhang, \bfnmMei-Ying\binitsM.-Y. \betalet al. (\byear2018). \btitleGenome-wide identification of transcription factors that are critical to non-small cell lung cancer. \bjournalCancer letters \bvolume434 \bpages132–143. \endbibitem