An upgraded focal plane detector for the MAGNEX spectrometer
Abstract
An upgraded and improved version of the focal plane detector (FPD) of the large-acceptance magnetic spectrometer MAGNEX is described here. The FPD consists of a tracker operating at low pressure and of a silicon detector wall. Thanks to a different geometry of the electron multiplication and induction elements, the new detector guarantees a superior signal to noise ratio, resulting in a more accurate tracking and a cleaner identification of the detected heavy ions. The new detector has been tested by using a 18O beam at an energy of 84 MeV. A description of the new FPD that pinpoints the innovation and the obtained performances is given and discussed in details.
keywords:
Magnetic spectrometer , Focal plane detector , MAGNEX1 Introduction
Modern nuclear physics studies often require to join the advantages of the magnetic spectrometry (strong rejection factors of reaction products, zero-degree measurements, etc.) with the possibility to measure heavy ions. Moreover, in order to explore rare nuclear processes [1, 2, 3], modern magnetic spectrometers have grown toward large acceptance in momentum and solid angle as well as large dynamic range in mass and energy [4, 5, 6, 7]. An example of this class of devices is the MAGNEX spectrometer [8, 9, 10] installed at the INFN-LNS laboratory in Catania. Its magnetic structure, based on a vertically focusing quadrupole and a horizontally dispersing and focusing bending magnet, ensures a momentum acceptance of about 24% and a solid angle of 50 msr. The development of large-acceptance magnetic spectrometers requires more advanced Focal Plane Detectors (FPD). These have to provide not only an unambiguous particle identification, but also an accurate three-dimensional tracking of the ions trajectory downstream of the magnetic elements [11, 12, 13, 14]. The FPDs are, therefore, the heart of the modern large-acceptance magnetic spectrometers. In the present paper the upgrade of MAGNEX FPD [15] will be described. The new FPD has been developed with the aim to improve the tracking and the identification performances.
The paper is organized as follows: Section 2 describes the design of the new detector, emphasizing the new adopted solutions compared to the previous ones; Section 3 presents a detailed characterization of the new FPD response to beam generated ions; Section 4 summarizes the results and our conclusions.
2 Focal plane detector design
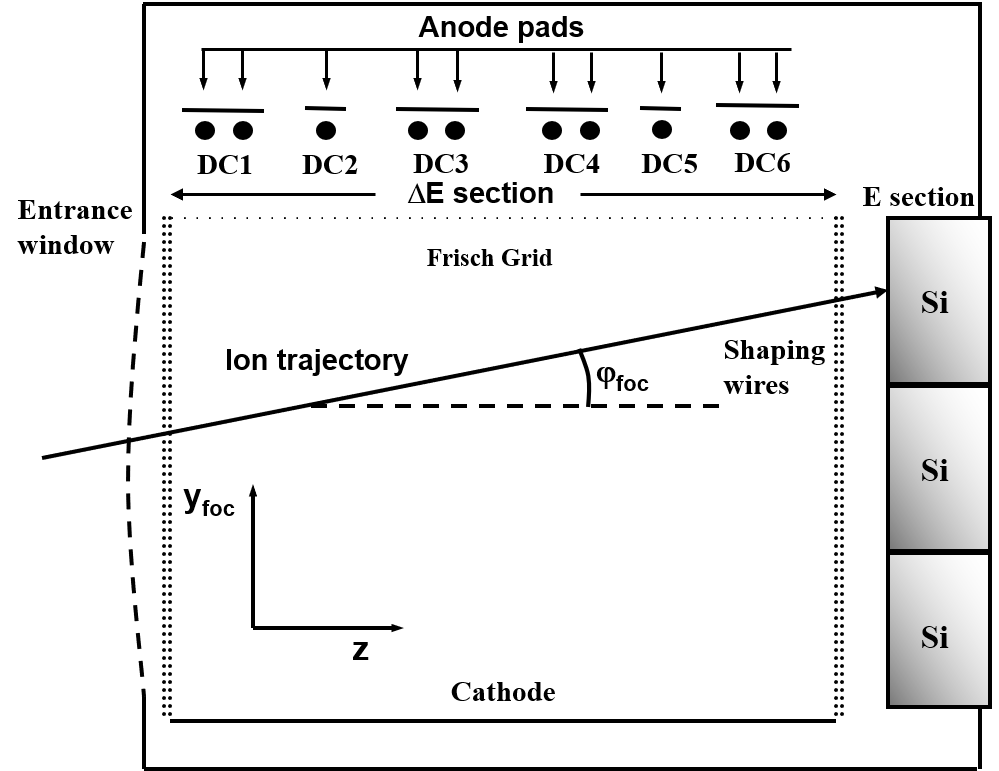
The MAGNEX FPD consists of two sections: a gas tracker sensitive to the energy loss of the ions and a stopping wall for the measurements of their residual energy [15]. The gas tracker is a proportional drift chamber with a total active volume of 136020090 mm3, divided in six sections that are six independent position-sensitive proportional counters, whereas the stopping wall, placed behind the gas tracker, is made of 57 silicon pad detectors covering an area of 1360200 mm2, see Fig. 1.
2.1 The gas tracker
The gas tracker is contained in a vacuum chamber that is isolated from the high-vacuum upstream region by a large mylar® window (220920 mm2) with typical thickness ranging from 1.5 to 6 m, depending on the pressure filling the chamber. The active region is filled with 99.95% isobutane at pressure that ranges from few mbar up to several tenths of mbar. The use of pure isobutane guarantees a fast drift velocity and very good operational stability, [16, 17, 18]. In order to avoid further dead layer there is no exit window, the silicon detectors of the stopping wall are therefore embedded in the gas. The FPD vacuum chamber is movable of 0.08 m along the optical axis of the spectrometer to allow to translate the focal plane according to different focus conditions. In order to reduce the effect of the chromatic aberrations the FPD is tilted at an angle =59.2∘ relative to the optical axis direction [19].
In the tracker, sketched in Fig. 1 it is possible to identify three different regions. A drift region defined by the cathode and the Frish grid, a multiplication region which extends between the Frish grid and the proportional wires, and an induction region which extends between the DC wires and the segmented anode.
The drift region is defined by the cathode, an aluminum plate 120090 mm2 large that is usually biased at voltage values ranging between -900 and -1500 V and a Frish grid, that is made of ten gold-plated tungsten wires with a diameter of 50 m placed at a distance of 5 mm one from each other. In order to make as uniform as possible the electric field of the drift region and to shield the inner electric field from the high voltage applied to the silicon detectors at the stopping wall [20], the active area of the tracker is surrounded by a double partition grid consisting of 41 couples of rings made of gold-plated wires.
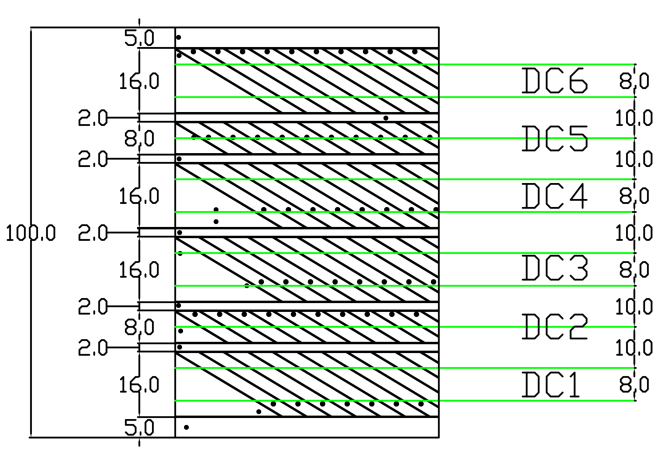
The multiplication region is 20 mm high and is defined by the Frish grid and the plane where 10 proportional wires are located. Each of the proportional wires is 50 m thick and is made of gold-plated tungsten. Such wires are biased to a voltage usually in the range between +500 V and +1300 V, provided by a common power supply. The ten wires are shared among the six proportional counters DCi, i=1, 6. DC2 and DC5 have just a single wire while the the other DCs have two proportional wires as shown in Fig. 2. An additional partition grid similar to the one used in the drift region is present with the aim to reduce the border effects of the electric field in the multiplication region.
The induction region is defined by the plane where the 10 proportional wires lay and the anode: the latter consisting of a segmented read-out plane. In Fig. 2 a bottom view of the anode is shown. The anode is divided in 6 longitudinal strips, one for each DC, being the strip corresponding to DC2 and DC5 8 mm wide while the others are 16 mm wide. Each strip is further segmented in pads (221 for DC2 and DC5 and 223 for DC1,3,4,6) oriented along the spectrometer optical axis, that is with an angle equal to , see Fig. 2.
2.2 The silicon stopping wall
The silicon stopping wall is embedded in the gas filling the tracker to avoid further
dead layers.
The stopping wall is made of 57 silicon detectors arranged in 19 columns. Each detector is
5070 mm2 wide and 500 m or 1000 m thick depending on the range of the
ions to stop. They are mounted orthogonally to the optical axis of MAGNEX in order to minimize
the effective dead layer.
The closest distance of the silicon detector from the active area of the tracker is 15 mm
that is enough to avoid interference with the electric field of the drift region of the tracker.
2.3 The working principle
When an incident particle crosses the entrance window entering the drift region, it generates a track of ions and electrons in the gas. The presence of a uniform electric field of about 50 V/cm in the drift region makes the ions drift towards the cathode and the electrons towards the Frish grid, these last with a velocity of about 5 cm/s [16]. After the Frish grid the primary electrons enter the multiplication region, are then accelerated by the strong electric field generated by the proportional wires and the multiplication occurs. Since the gas counters work in a proportional regime, the avalanches produced close to the wires generate a signal on the wires themselves which is proportional to the energy loss of the ion in the gas. Therefore six independent measurements of the energy loss are available, one for each DC.
In addition to the signal produced on the DC wires, the electron avalanche produced close to the wires induces a charge in a given number of pads of the strip laying just above the wires. The center of gravity of the charge distribution of the pads corresponding to a given DC is extracted. The six centers of gravity are converted in horizontal position providing six independent measurements Xi with . From them, the position of the crossing point between the ion track and the focal plane Xf as well as the horizontal angle of the track is obtained. After crossing the gas tracker the ions hit the silicon detector stopping wall.
The vertical position is extracted by measuring the arrival time of the electron avalanches in the wires taking advantage of the fact that the tracker works in a regime where the drift velocity is almost constant in the whole volume of the detector. Six vertical positions are extracted measuring the drift time of the primary electrons along in the drift region. The start signal is generated when the ion producing the track hits one of the silicon detector of the stopping wall. The six vertical positions Yi with are used to obtain the vertical position Yf on the focal plane detector and the angle of the ion track. The 57 silicon detectors of the stopping wall, in addition to the start signal for the drift time measurements, provide also the residual energy of the ions that is used mainly for identification purposes.
Thanks to the very small dead layer, almost entirely due to the mylar® window, the energy threshold for the detection of charged particles crossing the FPD is about 0.5 MeV/u.
3 Detector performaces
The FPD was tested with a 18O beam delivered by the tandem MP at INFN Laboratori Nazionali del Sud in Catania, Italy, at an energy of 84 MeV impinging on thin gold and carbon targets. The interaction between the beam particles and the target took place in the center of the MAGNEX scattering chamber. The angle between the optical axis of the spectrometer and the beam direction is named . The spectrometer worked in full-acceptance mode which means an angular range ( -5.2 + 6.3∘) [21, 22]. Two collimators were installed upstream the target in order to limit the spot size and angular divergence of the beam at the target position to 1.78 mm 1 mrad in the horizontal direction and 2.8 mm 1.2 mrad in the vertical one. In some of the runs a multi-hole collimator was placed 206 mm downstream the target in order to select ejectiles with well defined trajectories. The multihole collimator has 65 circular holes with a diameter of 1 mm, arranged in five rows 11.5 mm spaced and 13 columns 3 mm spaced. The ions coming from the target which enter in the spectrometer acceptance were momentum analyzed and focused on the FPD. The FPD was filled with isobutane C4H10 at a pressure of 15 mbar. In the following section we will analyze the main characteristics of the FPD, that is the resolution of the energy lost in the gas; the angular resolution; the position resolution, and the particle identification performances.
3.1 Energy loss measurements
Even if the energy loss measurement of the new FPD is based on the same principles as the old one Ref. [15], some difference is present. In fact the old FPD was composed of five drift chambers, but, usually, only the central one, the largest, was used to measure the energy loss E. In the present FPD, there are six independent drift chambers with comparable active volume (DC1, DC2, DC3, DC4, DC5, DC6). The total active volume of the six drift chambers is larger than the volume of the single drift chamber used in the old FPD for the E measurement. This fact ensures higher charge collection and therefore a better energy resolution for the new FPD, in the same ionization conditions.
Before making any further consideration on the E measurements we have to underline that the FPD of a large-acceptance spectrometer should be designed to measure trajectories with very different incident angles and therefore with different effective lengths inside the FPD itself. In the case of MAGNEX the FPD is tilted of =59.2∘ relative to the central trajectory, and (angle in the dispersive direction) ranges between a minimum value of 40∘ and a maximum value of 72∘.
Therefore the linear length of the trajectory inside the active volume of the FPD can range from about -35% up to about +65% of the central trajectory. The contribution coming from the non-dispersive direction is almost negligible since the angle in ranges from -2∘ to +2∘ [12].
As a consequence the E measurement is corrected for the effective thickness and normalized to the energy loss of the reference trajectory angle =59.2∘. Therefore we introduce the quantity Ecorr:
| (1) |
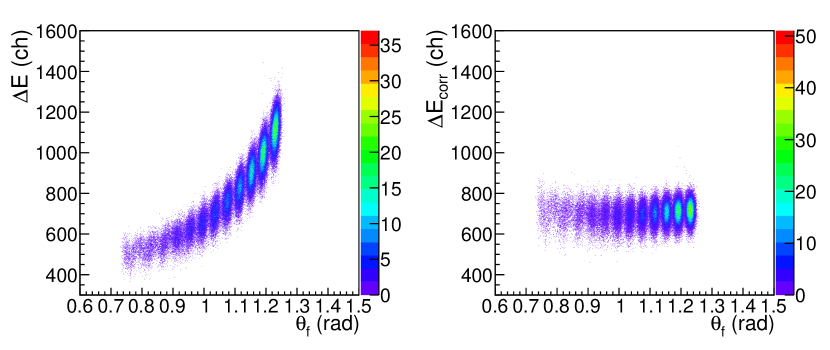
To evaluate the effectiveness of this correction procedure the elastic scattering of 18O beam at 84 MeV on a 122 g/cm2 thick gold target was used. The FPD was working with 99.95%-pure isobutane gas at a pressure of 15 mbar. The voltage applied to the cathode and wires were -1000 V and +720 V respectively. The effect of such a correction is shown in Fig. 3. In the left panel E as a function of is shown and it is evident the dependence of the measured energy loss from the horizontal incident angle . In right panel, where Ecorr as a function of is shown, the dependence of the energy on the angle is removed as expected. It is, therefore, evident that a precise measurement of the angle is not only important for reconstruction purposes but it is also critical for identification purposes using the E-E technique.
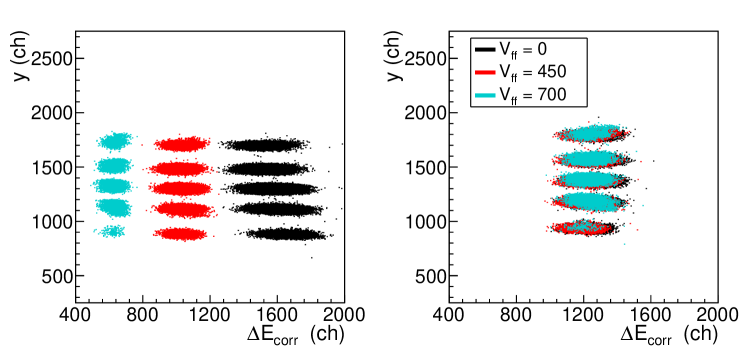
Border effects for the charge-collection efficiency are known to be present in particular at the entrance and exit of the FPD, where the electric field could be not uniform. Such non uniformity can worsen the tracking performances and generate a dependence of the collected charge from the y-coordinate. In order to mitigate such effects the voltage of the partition grid in the electron multiplication region was varied looking for the achievable best condition. The change of the energy channel for different values of the partition grid potential, all other parameters being equal, is shown in Fig. 4 where vs Ecorr is plotted for DC1 (example of a border DC) and DC3 (example of a central DC). Different colors correspond to different bias applied to partition grid potential. For the case of the central DC3 there is no effect, for DC1 there is a strong effect that reduces the amplitude of the energy loss signals and virtually removes the dependence on the y coordinate.
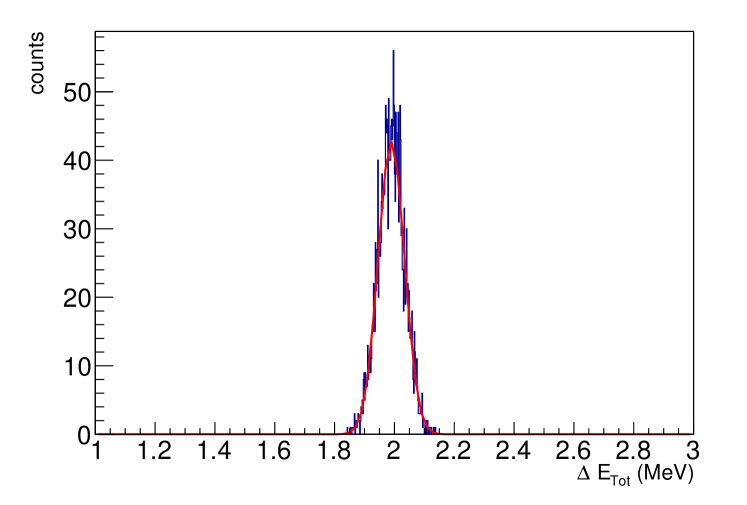
In order to study the intrinsic resolution of the energy loss () measurement, the elastic scattering data collected with the multiple hole collimator were analyzed. Moreover, the events corresponding to each hole of the collimator were selected with a condition in ( 2 mrad) and y ( 2 mm) in order to remove the dependence on the ion trajectory. While the FWHM of the Ecorr distribution for each single DCi was about 10%, the overall resolution obtained by summing all the energy measured by the six DCs is about 5%. The total energy here considered is given by
The result does not depends significantly on the particular value of and y. An example of such calibrated energy spectrum is shown in Fig. 5.
3.2 Particle identification
In this section the particle identification procedure and typical results for the new MAGNEX FPD are shown.
The data were taken using a 18O beam at 84 MeV impinging on a 238 g/cm2 thick 12C target. The spectrometer was set at =10∘.
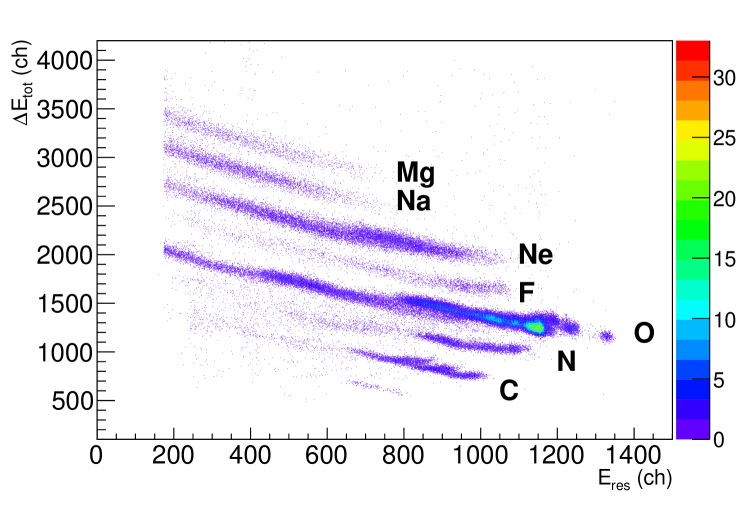
In Fig. 6 the energy lost in the drift chamber corrected for the incident angle () versus the residual energy Eres measured by one of the silicon detectors is shown. The different loci correspond to different values of the atomic number Z.
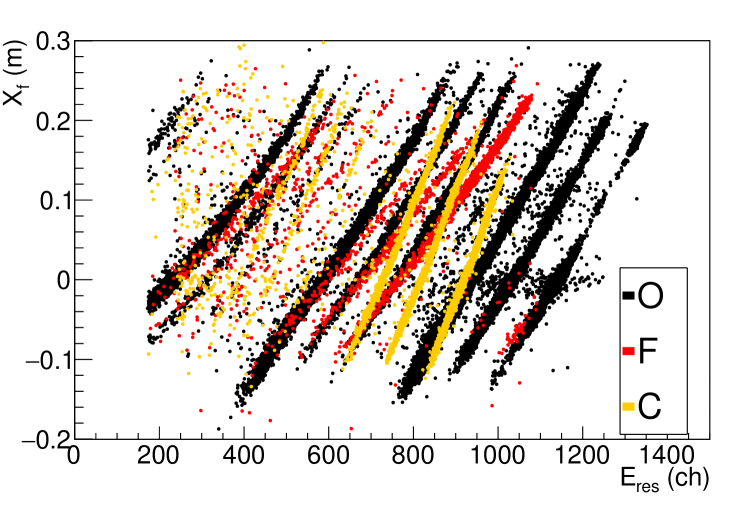
In Fig. 7 the position on the FPD Xf versus the residual energy Eres in one of the silicon detectors is shown. In this plot ions with the same Z gather on lines with the same slope, larger (smaller) slopes correspond to larger (smaller) Z. Ions having same Z but different masses can be identified as lines with the same slope but shifted at smaller (larger) Xf value for low (high) masses. This is the result of the relationship between the kinetic energy (related to the parameter Eres) and the magnetic rigidity (related to the parameter Xf) of the charged particles traversing a magnetic spectrometer. This identification technique has been reported in details in Ref. [23].
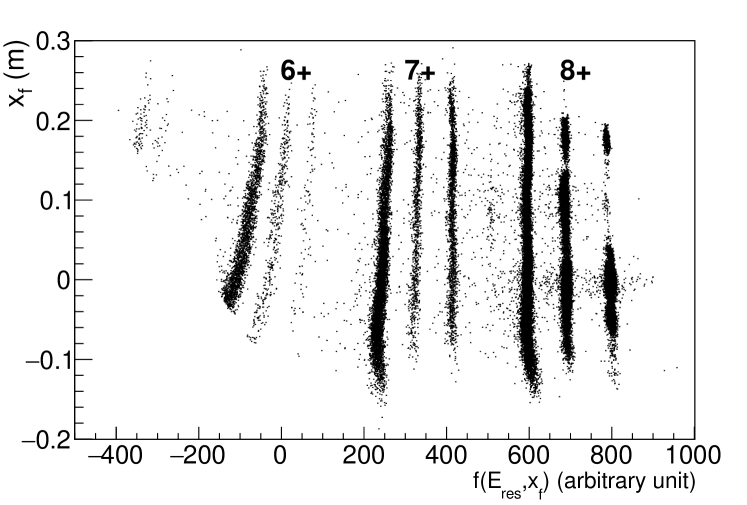
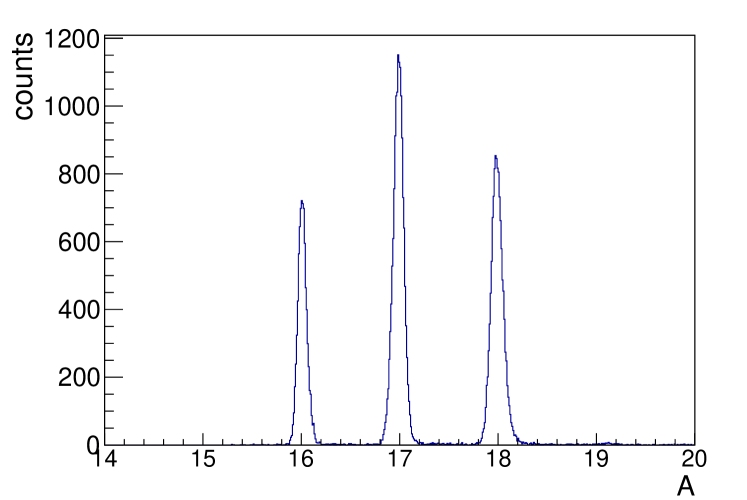
These lines can be transformed in vertical lines using a rotation in the plane Xf - Eres as shown in Fig 8. After the rotation, the loci corresponding to oxygen isotopes with charge state 8+ are selected, thus a cut on Xf is performed and, eventually, they are projected on the x-axis (Fig. 9). From this figure the mass resolving power of the FPD can be determined; it is defined as , where M is the mass of the central peak and M is the FWHM of such peak. For example for oxygen ions the resolving power, in this specific working conditions, is M=1/136, as shown in Fig. 9.
3.3 Position and angle measurements in the dispersive direction
The position along the horizontal direction is determined by means of the distribution of charge induced on the pads. The number of hit pads is usually between 5 and 25 depending mainly on the incident angle of the ion and its energy loss. A generalization of the center of gravity method [24] is used to extract the centroid of the charge distribution as discussed in Refs. [25, 15].
The position resolution has been estimated using the multi-hole collimator. Several effects can influence the estimate of the position resolution like: the size of the collimator holes, the beam-spot size, multiple scattering in the detector itself, and straggling in the entrance window. These effects can be partially compensated by considering the difference between two coordinates as, for example, Xi-X3 instead that a single coordinate Xi. X3 was chosen as reference wire since, being a central drift chamber, it is less sensible to border effects that could affect the edge drift chambers.
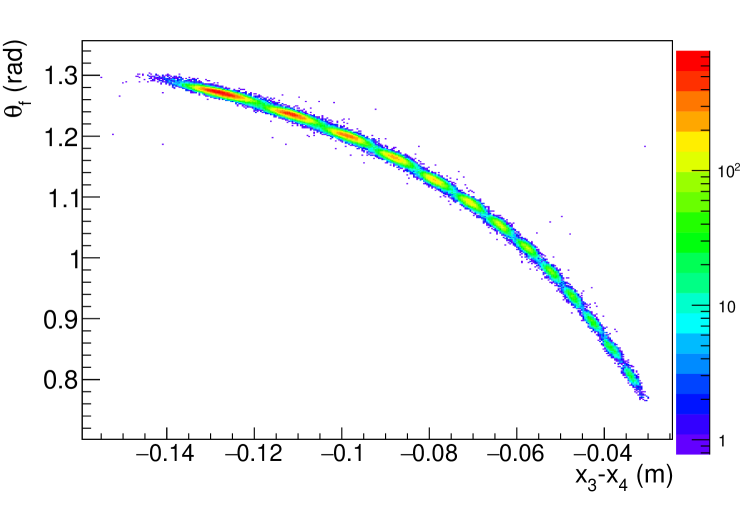
In Fig. 10 the angle versus X3-X4 is shown after a gate on the elastic scattering was applied. Each spot of the plot corresponds to a bunch of trajectories passing through the same hole having a given average angle at the focal plane As increases the X3-X4 distribution of each spot becomes broader.
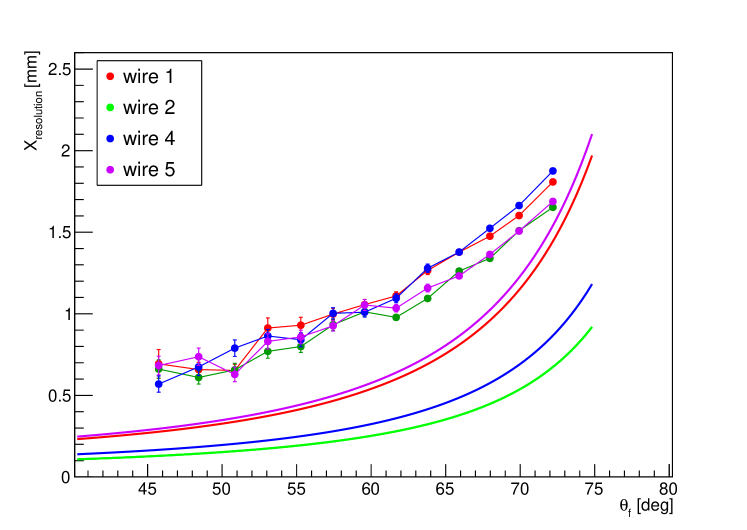
For each spot of Fig. 10 a narrow gate of 2 mrad in was applied and the position distributions of all the Xi variables where obtained. Such angular spread corresponds, for example, to a position spread of about 0.12 mm at =40∘ and 0.65 mm at =72∘. This geometrical contribution to the overall width of the position distribution is shown in Fig. 11 as a continuous line for all the Xi, while points correspond to the experimental FWHM measured at each angle. The horizontal resolution Xi-X3 was estimated for all the wires. No significant difference between different DCi was found. The final resolution is estimated to be around 0.6 mm for each wire.
All the coordinates Xi, i=1, 6 are used, together with the longitudinal coordinates Zi, i=1, 6 for the definition of the horizontal angle . The use of six points guarantees a better precision compared to the previous FPD that used just four points.
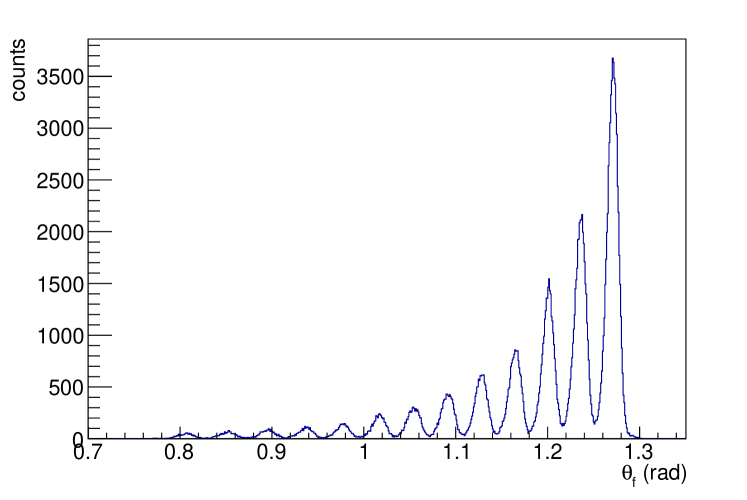
The plot of measured is shown in Fig. 12. Each peak in the plot corresponds to trajectories passing through one of middle-raw hole of the multi-hole collimator. The difference in counts for each peak is due to different cross section of the elastic scattering at different angles.
The method used to estimate the angular resolution is described in detail in the following. The first step consists in selecting a group of trajectories by applying a gate on the first and the last DCs, (i.e. DC1 and DC6). The trajectories are selected with an average value of 1000 mrad and a FWHM of 3.2 mrad.
In the second step the trajectory of the events selected in the first step are extracted, using the obtain from the other four DCs, thus excluding X1 and X6. The angular distribution of such events has a spread of 3.9 mrad (FWHM), taking into account the initial spread of selected trajectories it is possible to extract a value for the resolution of the tracker of 2.2 mrad (FWHM). The resolution here extracted should be considered as an upper limit of the actual resolution, since the resolution of the full tracker is done using six X-positions for each events instead of the previous four X-positions we were using for the resolution estimation. The resolution here obtained is much better than the previous detector, where 5 mrad (FWHM) was obtained using a similar procedure.
3.3.1 The cross-talk effect
A phenomenon present in the old FPD that affected the horizontal position measurements of the
ion track is the
cross-talk [25]. In fact, the electron avalanche produced by a given
proportional wire can induce a charge also in pads corresponding to a neighboring wire.
Therefore, the resulted charge distributions measured for a given wire may be distorted
affecting the final determination of the Xi coordinate.
In order to mitigate this problem some modification in the new FPD design was required.
The geometry of the wires and strips was changed making the average distance
between two adjacent strips
larger than the distance between each wire and the corresponding strip.
The segmented strips were separated from each other by a 2 mm spacer as shown in Fig. 2.
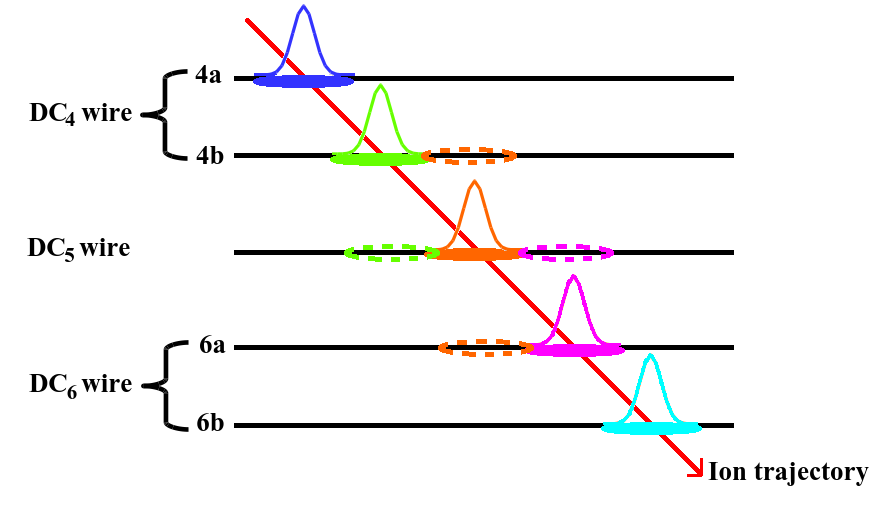
We briefly describe the adopted procedure for estimating the cross-talk induced signal on DC5 strip for a typical event, the same procedure can be extended for the other DCs. As a first step, the measured induced charge distributions of DC4 and DC6 wires were fitted each by a Gaussian function. Since DC4 and DC6 are composed by two wires each (see Fig. 2) the charge distribution was decomposed into two internal Gaussian curves, each one describing the induced charge of each wire. Then, having determined the height A, the centroid (mean value) and the standard deviation of the distributions, each one was further decomposed into two Gaussian functions with:
| (2) |
| (3) |
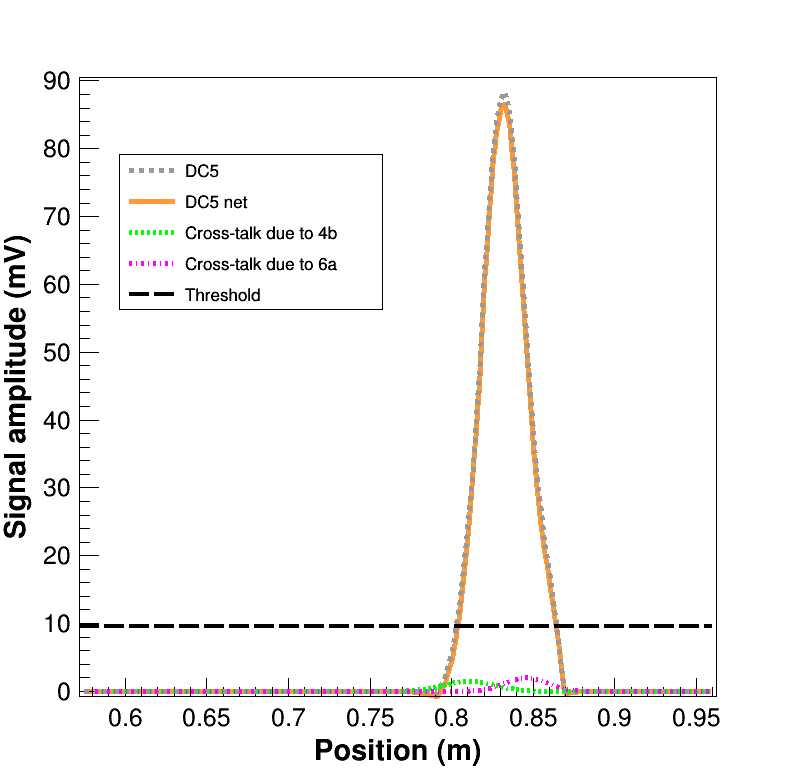
where, Aa, Ab are the heights and , are the standard deviations of the two Gaussian functions. These so called ”internal” Gaussian functions are associated to the signal originating the induced charge of each of the two wires composing DC4 and DC6, namely, DC4a, DC4b, DC6a and DC6b. In the last step of the analysis, the DC4b and DC6a distributions were superimposed to the measured induced signal of DC5 and were renormalized such as to describe the shape of the distribution. The results of the charge distribution analysis for DC5 for a single elastic scattering event with 62o are presented in Fig. 14. It is evident that the distortion in the shape of the charge distribution caused by the cross-talk is small. In addition, the amplitude of cross-talk signal is well-below the level of the threshold, which was determined through an iterative procedure by means of the optimized Center Of Gravity (COG) algorithm [25]. Therefore, we may conclude that the cross-talk phenomena are under control.
3.4 Vertical position and angle measurements
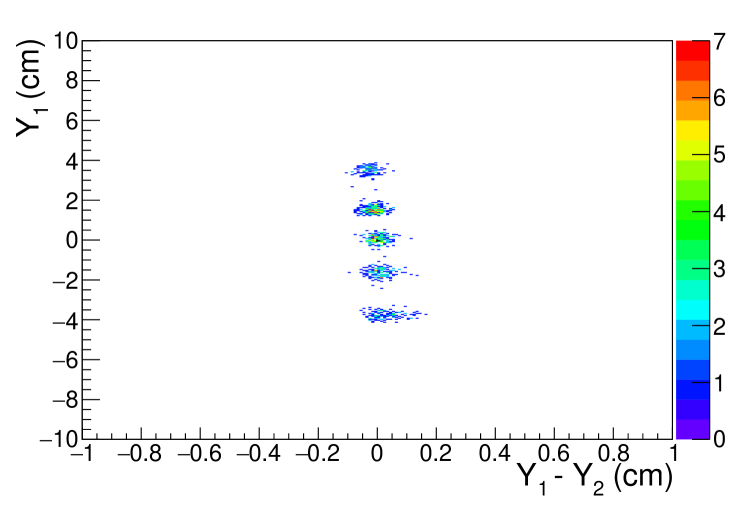
The Y resolution has been calculated plotting Y3 versus the difference Y1 -Y2 shown in Fig. 15. The five spots correspond to the particle passing through each of the five vertical rows of holes of the multi-hole collimator. The FWHM of each spot on the abscissa-projection is 0.6 mm giving a resolution of about 0.4 mm for the single CD.
The vertical angle is obtained by a linear fit of the six vertical positions Y1, Y2, Y3, Y4 ,Y5 ,Y6 and the six coordinates Z1, Z2, Z3, Z4 ,Z5 ,Z6 defined by the position of the six drift chambers. That is
| (4) |
where is . For the estimate of the angular resolution we used the formula for the error of the parameters of a linear fit:
| (5) |
where in place of the Y resolution have been used. The resolution depends on the horizontal angle of the particle trajectory since this influences the actual trajectory length inside the tracker. It ranges from 0.3 to 0.7 mrad for trajectories with =40∘ and =70∘ respectively. We conclude that, also in the vertical direction the position resolution as well the angular resolution are better than those of the previous detector.
4 Summary and Conclusions
The new focal plane detector of the large-acceptance MAGNEX spectrometer has been described underlining the innovative aspects relative to the previous FPD.
It keeps many characteristics of the old FPD, that is the capability to work at pressure ranging from few mbar to several tenth of mbar using a thin entrance window. This guarantees a very low detection threshold and the capability to identify particles in a broad range of ionizing condition. The main characteristics of the new MAGNEX focal plane detector and position and angular resolution obtained by using the scattering of 18O beam of 84 MeV are listed in Tab. 4.
The new design based on the segmentation of the gas tracker in six drift chambers all of similar size guarantees better performances in terms of tracking precision. The track is now sampled in six positions to be compared to the four of the old FPD, with a consequent better position and angular resolution of the ion tracks. The energy loss the performances have been improved since a longer portion of the track in the ionizing gas is sampled compared to the previous FPD, guaranteeing an higher resolution and therefore a better identification capability. In the design of the new detector, a special care has been given to reduce the effects of the cross-talk between neighboring strips. In the new FPD the cross-talk has been minimized and its effects on the track reconstruction are now negligible.
| Energy loss resolution for 18O | 5% |
|---|---|
| Horizontal position resolution | 0.6 mm |
| Horizontal angular resolution | 2.2 mrad |
| Vertical position resolution | 0.4 mm |
| Vertical angular resolution | 0.5 mrad |
Acknowledgments
This project has received funding from the European Union’s Horizon 2020 research and innovation program under the ERC grant agreement GA 714625.
References
- [1] K. Kisamori, S. Shimoura, H. Miya, S. Michimasa, S. Ota, M. Assie, H. Baba, T. Baba, D. Beaumel, M. Dozono, T. Fujii, N. Fukuda, S. Go, F. Hammache, E. Ideguchi, N. Inabe, M. Itoh, D. Kameda, S. Kawase, T. Kawabata, M. Kobayashi, Y. Kondo, T. Kubo, Y. Kubota, M. Kurata-Nishimura, C. S. Lee, Y. Maeda, H. Matsubara, K. Miki, T. Nishi, S. Noji, S. Sakaguchi, H. Sakai, Y. Sasamoto, M. Sasano, H. Sato, Y. Shimizu, A. Stolz, H. Suzuki, M. Takaki, H. Takeda, S. Takeuchi, A. Tamii, L. Tang, H. Tokieda, M. Tsumura, T. Uesaka, K. Yako, Y. Yanagisawa, R. Yokoyama, K. Yoshida, Candidate resonant tetraneutron state populated by the reaction, Phys. Rev. Lett. 116 (2016) 052501.
- [2] Cappuzzello, F., Agodi, C., Cavallaro, M., Carbone, D., Tudisco, S., Lo Presti, D., Oliveira, J. R. B., Finocchiaro, P., Colonna, M., Rifuggiato, D., Calabretta, L., Calvo, D., Pandola, L., Acosta, L., Auerbach, N., Bellone, J., Bijker, R., Bonanno, D., Bongiovanni, D., Borello-Lewin, T., Boztosun, I., Brunasso, O., Burrello, S., Calabrese, S., Calanna, A., Chávez Lomelí, E. R., D´Agostino, G., De Faria, P. N., De Geronimo, G., Delaunay, F., Deshmukh, N., Ferreira, J. L., Fisichella, M., Foti, A., Gallo, G., Garcia-Tecocoatzi, H., Greco, V., Hacisalihoglu, A., Iazzi, F., Introzzi, R., Lanzalone, G., Lay, J. A., La Via, F., Lenske, H., Linares, R., Litrico, G., Longhitano, F., Lubian, J., Medina, N. H., Mendes, D. R., Moralles, M., Muoio, A., Pakou, A., Petrascu, H., Pinna, F., Reito, S., Russo, A. D., Russo, G., Santagati, G., Santopinto, E., Santos, R. B. B., Sgouros, O., da Silveira, M. A. G., Solakci, S. O., Souliotis, G., Soukeras, V., Spatafora, A., Torresi, D., Magana Vsevolodovna, R., Yildirim, A., Zagatto, V. A. B., The numen project: Nuclear matrix elements for neutrinoless double beta decay, Eur. Phys. J. A 54 (5) (2018) 72.
-
[3]
D. Pereira, R. Linares, J. Oliveira, J. Lubian, L. Chamon, P. Gomes,
A. Cunsolo, F. Cappuzzello, M. Cavallaro, D. Carbone, A. Foti,
Nuclear
rainbow in the 16o+27al system: The role of couplings at energies far above
the barrier, Physics Letters B 710 (3) (2012) 426 – 429.
doi:https://doi.org/10.1016/j.physletb.2012.03.032.
URL http://www.sciencedirect.com/science/article/pii/S0370269312003061 - [4] T. Kobayashi, N. Chiga, T. Isobe, Y. Kondo, T. Kubo, K. Kusaka, T. Motobayashi, T. Nakamura, J. Ohnishi, H. Okuno, H. Otsu, T. Sako, H. Sato, Y. Shimizu, K. Sekiguchi, K. Takahashi, R. Tanaka, K. Yoneda, Samurai spectrometer for ri beam experiments, Nuclear Instruments and Methods in Physics Research Section B: Beam Interactions with Materials and Atoms 317 (2013) 294 – 304, xVIth International Conference on ElectroMagnetic Isotope Separators and Techniques Related to their Applications, December 2–7, 2012 at Matsue, Japan.
- [5] T. Uesaka, S. Shimoura, H. Sakai, G. Berg, K. Nakanishi, Y. Sasamoto, A. Saito, S. Michimasa, T. Kawabata, T. Kubo, The high resolution sharaq spectrometer, Nuclear Instruments and Methods in Physics Research Section B: Beam Interactions with Materials and Atoms 266 (19) (2008) 4218 – 4222, proceedings of the XVth International Conference on Electromagnetic Isotope Separators and Techniques Related to their Applications.
- [6] A. Stefanini, L. Corradi, G. Maron, A. Pisent, M. Trotta, A. Vinodkumar, S. Beghini, G. Montagnoli, F. Scarlassara, G. Segato, A. D. Rosa, G. Inglima, D. Pierroutsakou, M. Romoli, M. Sandoli, G. Pollarolo, A. Latina, The heavy-ion magnetic spectrometer prisma, Nuclear Physics A 701 (1) (2002) 217 – 221, 5th International Conference on Radioactive Nuclear Beams.
- [7] M. Rejmund, B. Lecornu, A. Navin, C. Schmitt, S. Damoy, O. Delaune, J. Enguerrand, G. Fremont, P. Gangnant, L. Gaudefroy, B. Jacquot, J. Pancin, S. Pullanhiotan, C. Spitaels, Performance of the improved larger acceptance spectrometer: Vamos++, Nuclear Instruments and Methods in Physics Research Section A: Accelerators, Spectrometers, Detectors and Associated Equipment 646 (1) (2011) 184 – 191.
- [8] Cappuzzello, F., Agodi, C., Carbone, D., Cavallaro, M., The magnex spectrometer: Results and perspectives, Eur. Phys. J. A 52 (6) (2016) 167.
- [9] M. Cavallaro, C. Agodi, G. Brischetto, S. Calabrese, F. Cappuzzello, D. Carbone, I. Ciraldo, A. Pakou, O. Sgouros, V. Soukeras, G. Souliotis, A. Spatafora, D. Torresi, The magnex magnetic spectrometer for double charge exchange reactions, Nuclear Instruments and Methods in Physics Research Section B: Beam Interactions with Materials and Atoms 463 (2020) 334 – 338.
- [10] Oxford Handbook of Innovation, Nova Publisher Inc., New York, 2011, Ch. MAGNEX: an innovative large acceptance spectrometer for nuclear reaction studies.
- [11] A. Lazzaro, et al., Inst. Phys. Conf. Ser. 175 (2005) 171.
- [12] F. Cappuzzello, D. Carbone, M. Cavallaro, Measuring the ions momentum vector with a large acceptance magnetic spectrometer, Nuclear Instruments and Methods in Physics Research Section A: Accelerators, Spectrometers, Detectors and Associated Equipment 638 (1) (2011) 74 – 82.
- [13] S. Pullanhiotan, M. Rejmund, A. Navin, W. Mittig, S. Bhattacharyya, Performance of vamos for reactions near the coulomb barrier, Nuclear Instruments and Methods in Physics Research Section A: Accelerators, Spectrometers, Detectors and Associated Equipment 593 (3) (2008) 343 – 352.
- [14] Montanari, D., Farnea, E., Leoni, S., Pollarolo, G., Corradi, L., Benzoni, G., Gadea, A., Fioretto, E., Latina, A., Montagnoli, G., Scarlassara, F., Stefanini, A.M., Szilner, S., Response function of the magnetic spectrometer prisma, Eur. Phys. J. A 47 (1) (2011) 4.
- [15] M. Cavallaro, F. Cappuzzello, D. Carbone, A. Cunsolo, A. Foti, A. Khouaja, M. R. D. Rodrigues, J. S. Winfield, M. Bondì, The low-pressure focal plane detector of the magnex spectrometer, The European Physical Journal A 48 (5) (2012) 59.
- [16] B. Schmidt, Drift properties of electrons in methane and methane noble gas mixtures, Nuclear Instruments and Methods in Physics Research Section A: Accelerators, Spectrometers, Detectors and Associated Equipment 252 (2) (1986) 579 – 585.
- [17] A. Sharma, Muon tracking and triggering with gaseous detectors and some applications, Nuclear Instruments and Methods in Physics Research Section A: Accelerators, Spectrometers, Detectors and Associated Equipment 666 (2012) 98 – 129, advanced Instrumentation.
- [18] W. R. Leo, Techniques for Nuclear and Particle Physics Experiments, 2nd Edition, Springer-Verlag, 1994, Ch. 6, p. 150.
- [19] A. Cunsolo, F. Cappuzzello, A. Foti, A. Lazzaro, A. Melita, C. Nociforo, V. Shchepunov, J. Winfield, Ion optics for large-acceptance magnetic spectrometers: application to the magnex spectrometer, Nuclear Instruments and Methods in Physics Research Section A: Accelerators, Spectrometers, Detectors and Associated Equipment 484 (1) (2002) 56 – 83.
- [20] M. Cavallaro, First application of the magnex spectrometer: investigation of the 19f(7li,7be)19o reaction at 52.2 mev, Ph.D. thesis, Dipartimento di Fisica e Astronomia, Universitá di Catania (2008).
- [21] M. Cavallaro, F. Cappuzzello, D. Carbone, A. Cunsolo, A. Foti, R. Linares, D. Pereira, J. Oliveira, P. Gomes, J. Lubian, R. Chen, Challenging measurement of the 16o+27al elastic and inelastic angular distributions up to large angles, Nuclear Instruments and Methods in Physics Research Section A: Accelerators, Spectrometers, Detectors and Associated Equipment 648 (1) (2011) 46 – 51.
- [22] M. Cavallaro, F. Cappuzzello, D. Carbone, A. Cunsolo, A. Foti, R. Linares, Transport efficiency in large acceptance spectrometers, Nuclear Instruments and Methods in Physics Research Section A: Accelerators, Spectrometers, Detectors and Associated Equipment 637 (1) (2011) 77 – 87.
- [23] F. Cappuzzello, M. Cavallaro, A. Cunsolo, A. Foti, D. Carbone, S. Orrigo, M. Rodrigues, A particle identification technique for large acceptance spectrometers, Nuclear Instruments and Methods in Physics Research Section A: Accelerators, Spectrometers, Detectors and Associated Equipment 621 (1) (2010) 419 – 423.
- [24] G. Charpak, G. Melchart, G. Petersen, F. Sauli, High-accuracy localization of minimum ionizing particles using the cathode-induced charge centre-of-gravity read-out, Nuclear Instruments and Methods 167 (3) (1979) 455 – 464.
- [25] Carbone, D., Cappuzzello, F., Cavallaro, M., Universal algorithm for the analysis of charge distributions in segmented electrodes of gas detectors, Eur. Phys. J. A 48 (5) (2012) 60.