A model Earth-sized planet in the habitable zone of Centauri A/B
Abstract
The bulk chemical composition and interior structure of rocky exoplanets are of fundamental importance to understanding their long-term evolution and potential habitability. Observations of the chemical compositions of the solar system rocky bodies and of other planetary systems have increasingly shown a concordant picture that the chemical composition of rocky planets reflects that of their host stars for refractory elements, whereas this expression breaks down for volatiles. This behavior is explained by devolatilization during planetary formation and early evolution. Here, we apply a devolatilization model calibrated with solar system bodies to the chemical composition of our nearest Sun-like stars – Centauri A and B – to estimate the bulk composition of any habitable-zone rocky planet in this binary system (“-Cen-Earth”). Through further modeling of likely planetary interiors and early atmospheres, we find that compared to Earth, such a planet is expected to have (i) a reduced (primitive) mantle that is similarly dominated by silicates albeit enriched in carbon-bearing species (graphite/diamond); (ii) a slightly larger iron core, with a core mass fraction of wt% (cf. Earth’s 32.5 0.3 wt%); (iii) an equivalent water-storage capacity; and (iv) a CO2-CH4-H2O-dominated early atmosphere that resembles that of Archean Earth. Further taking into account its 25% lower intrinsic radiogenic heating from long-lived radionuclides, an ancient -Cen-Earth ( 1.5-2.5 Gyr older than Earth) is expected to have less efficient mantle convection and planetary resurfacing, with a potentially prolonged history of stagnant-lid regimes.
1 Introduction
To date, over 4900 exoplanets have been confirmed (NASA Exoplanet Archive, 2022)111Accessed on 2022-01-16 at 18:00. and exoplanet statistics suggest that close to 100% of Sun-like (FGK) stars harbor planetary systems (Cassan et al., 2012; Lineweaver & Chopra, 2012; Winn & Fabrycky, 2015; Zhu & Dong, 2021). The occurrence of planets with radii between 0.5 and 1.5 orbiting in the conservative habitable zone (HZ) (Kopparapu et al., 2013) of stars with effective temperatures between 4800 and 6300 K, , is estimated to be at least (Bryson et al., 2021). Discoveries continue with legacy data from missions like Kepler, ongoing space observations by TESS, and ground-based radial velocity surveys (e.g., HARPS, CARMENES). Available data for presumably rock-dominated exoplanets, however, are typically limited to mass and/or radius, and orbital parameters. The James Webb Space Telescope (JWST), launched in December 2021, may be able to detect the atmospheres of a few transiting terrestrial exoplanets orbiting within the HZ of nearby M-dwarf stars (Koll et al., 2019). Towards the end of the 2020s, mid-infrared instruments installed on the 30-40 m Extremely Large Telescope (ELT) are expected to be able to directly image terrestrial, HZ exoplanets around the very nearest FGK stars (Quanz et al., 2015; Bowens et al., 2021). In anticipation of these observations and to guide the development of even more ambitious future space mission concepts, such as HabEx (Gaudi et al., 2020), LUVOIR (The LUVIOR team, 2019), and LIFE (Quanz et al., 2021), we must focus on modeling efforts for predictions of rocky exoplanet bulk compositions and interiors.
Observations of the chemical compositions of rocky bodies in the Solar System (Wang et al., 2019a; Sossi & Fegley, 2018; Carlson et al., 2014; Grossman & Larimer, 1974) and of polluted white dwarfs (Harrison et al., 2021, 2018; Doyle et al., 2019) lend support to the idea that the chemical composition of “terrestrial” (silicate+metal dominated) planets generally reflects that of their host stars for refractory elements, whereas this expression breaks down for volatile elements (Schulze et al., 2021; Adibekyan et al., 2021). This discrepancy can be explained by devolatilization processes (Wang et al., 2019a; Sossi et al., 2019; Norris & Wood, 2017; Hin et al., 2017) that occurred during the formation and early evolution of the terrestrial planets of our best star-planet sample, the Solar System. Analysis shows that a variety of both stochastic and non-stochastic physical processes account for the overall devolatilization outcome. Importantly, the average effect of these processes is generally non-random (Wang, 2018) and follows a trend that reflects the variation of elemental abundances with elemental volatilities (Fegley et al., 2020; Wang et al., 2019a; Sossi & Fegley, 2018). The first quantitative model of devolatilization (Wang et al., 2019a) is being increasingly adopted in the modeling of rocky exoplanetary bulk compositions and interiors (Wang et al., 2019b; Acuña, 2019; Spaargaren et al., 2020) or as a reference for linking star-planet elemental relations (Dorn et al., 2019; Liu et al., 2020; Cowley et al., 2021; Clark et al., 2021; Schulze et al., 2021). Here, we apply this technique to a key target for exoplanet surveys – the Centauri AB System (hereafter, -CenA/B) – our nearest Sun-like stellar neighbors.
1.1 The status of the search for an -CenA/B planet
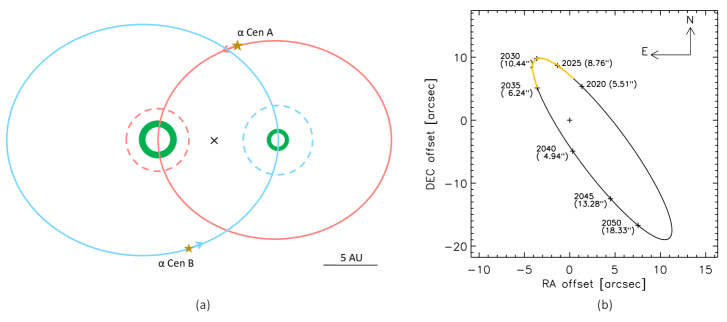
The binary stars of the system – -Cen A (spectral type G2) and B (spectral type K1) – are on an inclined (), eccentric (), year orbit with a separation varying from 35.6 AU to 11.2 AU (Pourbaix & Boffin 2016; Fig. 1) and have an estimated age of 6–7 Gyr (Salmon et al., 2021; Morel, 2018). The binary shares a gravitationally-bound companion star – the red dwarf -Cen C (Proxima Centauri; spectral type M5), which orbits the barycentre of the A/B system with a period of 550 kyr (Kervella et al., 2017). Proxima Cen is confirmed to host at least one planet (Anglada-Escudé et al., 2016; Damasso et al., 2020) whereas such confirmation remains elusive for -CenA/B. The ostensible detection of an Earth-mass exoplanet orbiting -Cen B (Dumusque et al., 2012) was later found to be an artifact of the observational technique (Rajpaul et al., 2016). However, owing to its immediate proximity to our Solar System, -CenA/B continues to generate interest in the search for Earth-like planets (Zhao et al., 2018; Kasper et al., 2019; Beichman et al., 2020; Wagner et al., 2021; Akeson et al., 2021). Radial-velocity measurements put the following detection limits on the masses of planets in the habitable zones of A and B, respectively: and (Zhao et al., 2018). Recent attempts to directly image low-mass planets in -CenA/B with the NEAR experiment at the Very Large Telescope (VLT) observatory have ruled out Jupiter-sized planets (Wagner et al., 2021). A candidate signal that may be consistent with an exoplanet of around -Cen A awaits confirmation (Wagner et al., 2021).
Simultaneously, numerical simulations continue to support the idea that over geological timescales (i.e. yr) stable planetary orbits can persist within the habitable zones of both -Cen A and B (Andrade-Ines & Michtchenko, 2014; Quarles & Lissauer, 2016; Quarles et al., 2020). Such stability is also bolstered by the non-overlapping Hill spheres of the binary stars at their periapsis (Fig. 1a). The interval between the years 2022–2035 will be the next ideal observational timeframe (Fig. 1b), during which searching for planets around A or B with, e.g., JWST/MIRI (Beichman et al., 2020) and ELT/METIS (Quanz et al., 2015; Carlomagno, 2020), will benefit from lower levels of contamination from the other component. It is therefore timely to predict what kind of planets to expect in the -CenA/B system based on theoretical models, and thus provide guidance for future observations. For this study, we focus our analysis on a hypothetical, Earth-sized planet in the habitable zone around either A or B.
2 Data, methods, and analysis
2.1 Stellar chemical compositions

Both -Cen A and B are among the Gaia FGK “benchmark stars”, for which the stellar properties have been carefully calibrated (Heiter et al., 2015; Jofré et al., 2017). The chemical compositions of the two companions have also been determined in detail with high-quality spectra for up to 22 elements (Morel, 2018; Wang et al., 2020a). The datasets of (Morel, 2018; Wang et al., 2020a) are selected for (i) their completeness, high precision and homogeneity for all elements of interest to our study and (ii) their large consistency with other reported results in the literature for Cen A/B (e.g. Neuforge-Verheecke & Magain, 1997; Koch & Edvardsson, 2002; Guiglion et al., 2018). We do not compare the different literature analyses here, and such comparisons have been discussed in detail in our refereed sources.
Figure 2 compares the elemental abundances between -Cen A and B (Columns 2-3, Table 1), which are found to be statistically consistent with each other ( and ), supporting the idea that A and B have a common origin (Beech, 2015). For consistency and simplicity of discussion, we calculate the weighted-average elemental abundances of A and B (Column 4, Table 1). The exceptions to the approach are that (i) since the A and B abundances of Co and Y are inconsistent, we compute unweighted averages and use their abundance spread as uncertainties; (ii) the abundances of Mn and Ce are only available for Cen A and are thus adopted directly for the averaged AB system. We then use the protosolar abundances (Wang et al., 2019a) to convert the differential abundances to the absolute abundances (normalized to Al = 100; Column 5, Table 1). We did not consider the effects of microscopic diffusion in Cen A and B, but as noted in Morel (2018) any changes arising from diffusion can probably be accommodated by the abundance uncertainties.
| Element | [X/H] (dex) | [X/H] (dex) | [X/H] (dex) | (X/Al) (Al=100) | |
|---|---|---|---|---|---|
| C | 9514 | ||||
| O | 0.191 0.014 | 0.147 0.040 | 0.186 0.013 | 14735 | |
| Na | 0.331 0.010 | 0.339 0.036 | 0.332 0.010 | 72 | |
| Mg | 0.250 0.023 | 0.265 0.041 | 0.254 0.020 | 1192 | |
| Al | 0.281 0.013 | 0.298 0.031 | 0.284 0.012 | 100 | |
| Si | 0.261 0.009 | 0.255 0.018 | 0.260 0.008 | 1153 | |
| Ca | 0.217 0.010 | 0.222 0.030 | 0.218 0.009 | 64 | |
| Sc | 0.266 0.014 | 0.257 0.018 | 0.263 0.011 | 0 | |
| Ti | 0.253 0.011 | 0.284 0.033 | 0.256 0.010 | 2 | |
| V | 0.256 0.017 | 0.294 0.050 | 0.260 0.016 | 0 | |
| Cr | 0.248 0.011 | 0.264 0.033 | 0.250 0.010 | 14 | |
| Mn | 0.271 0.019 | – | 0.271 0.019 | 10 | |
| Fe | 0.237 0.007 | 0.221 0.016 | 0.234 0.006 | 959 | |
| Co | 0.288 0.019 | 0.202 0.044 | 2 | ||
| Ni | 0.286 0.009 | 0.278 0.019 | 0.285 0.008 | 59 | |
| Cu | 0.295 0.020 | 0.291 0.034 | 0.294 0.017 | 0 | |
| Zn | 0.266 0.027 | 0.296 0.031 | 0.279 0.020 | 1 | |
| Y | 0.203 0.013 | 0.268 0.029 | 4 | ||
| Zr | 0.270 0.053 | 0.343 0.060 | 0.302 0.040 | 0 | |
| Ba | 0.185 0.025 | 0.179 0.025 | 0.182 0.018 | 4 | |
| Ce | 0.172 0.055 | – | 0.172 0.055 | 1 | |
| Eu | 0.127 0.040 | 0.081 0.060 | 0.113 0.033 | 8 | |
2.2 Devolatilization
We employ the fiducial model of devolatilization (Wang et al., 2019a), which is quantified by the bulk elemental abundance differences between the proto-Sun and the Earth (Wang et al., 2018, 2019a) as a function of 50% condensation temperature (50; Lodders, 2003), to devolatilize the averaged AB system abundances. This process results in the devolatilized host stellar abundances (Column 2, Table 2) as the proxy for the elemental composition of any rocky planet in the HZ of the system (i.e. “-Cen-Earth”). The justification and limitations of applying such a Sun-to-Earth model to other Solar-like planetary systems are presented in Wang et al. (2019b) and also recapped later. Further, since we are interested in how the model -Cen-Earth is different from the bulk Earth by analyzing primarily the individual elements or their ratios, the residuals of the devolatilization model for individual elements (Column 3, Table 2) – i.e. the differences between the bulk Earth composition (Wang et al., 2018) and the model Earth composition as devolatilized from the protosolar abundances (Wang et al., 2019a) – are added onto the devolatilized AB average stellar abundances to obtain the final bulk elemental composition of the model -Cen-Earth (Columns 4-5, Table 2).
| Element | (X/Al) (Al=100) | (X/Al) | (X/Al) (Al=100) | (X/Fe) (Fe=100) | ||||
|---|---|---|---|---|---|---|---|---|
| C | 35 | 0 | .3 | 36 | 4 | |||
| O | 2674 | 13 | 2687 | 306 | ||||
| Na | 18 | 0 | .3 | 18 | 2 | |||
| Mg | 1025 | -15 | 1010 | 115 | ||||
| Al | 100 | 0 | 100 | 11 | ||||
| Si | 923 | 19 | 941 | 107 | ||||
| Ca | 64 | -1 | .8 | 62 | 7 | |||
| Sc | 0 | -0 | .003 | 0 | 0 | |||
| Ti | 2 | -0 | .2 | 2 | 0 | |||
| V | 0 | -0 | .01 | 0 | 0 | |||
| Cr | 11 | 0 | .7 | 12 | 1 | |||
| Mn | 5 | 0 | .1 | 5 | 0 | |||
| Fe | 820 | 57 | 877 | 100 | ||||
| Co | 2 | 0 | .0 | 2 | 0 | |||
| Ni | 53 | -0 | .8 | 52 | 6 | |||
| Cu | 0 | -0 | .02 | 0 | 0 | |||
| Zn | 0 | -0 | .01 | 0 | 0 | |||
| Y | 4 | 0 | 4 | 5 | ||||
| Zr | 0 | 0 | .000 | 0 | 1 | |||
| Ba | 4 | -0 | 4 | 4 | ||||
| Ce | 1 | -0 | 1 | 1 | ||||
| Eu | 7 | 0 | 8 | 9 | ||||
2.3 Key geochemical ratios
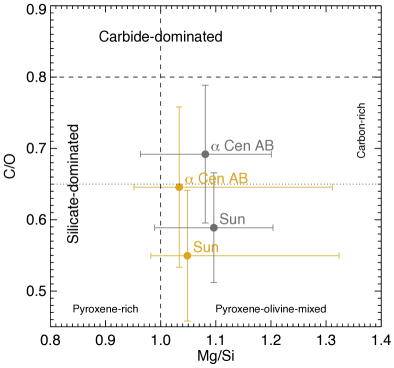
The stellar abundance ratios of carbon to oxygen (C/O) and magnesium to silicon (Mg/Si) are diagnostic indicators, as widely adopted in the literature (e.g. Bond et al., 2010; Delgado Mena et al., 2010; Fortney, 2012; Thiabaud et al., 2015; Brewer & Fischer, 2016; Suárez-Andrés et al., 2018; Zhao et al., 2018; Spaargaren et al., 2020; Clark et al., 2021) (we also use them later), of the plausible composition of any rocky planet around the host star. However, upon the application of our devolatilization approach, both carbon and oxygen are severely depleted in rocky planets relative to their host star and therefore, a planetary (not a stellar) C/O is no longer a valid indicator of rocky planets’ dominant mineral types (silicates vs. carbides). Due to the near-refractory nature (and similar 50; Lodders 2003; Wood et al. 2019) of Mg and Si, their ratio in a star is not significantly altered through the devolatilization process (Wang et al., 2019a) and thus is still a good first-order proxy for Mg/Si in a rocky planet around the host star (Schulze et al., 2021; Adibekyan et al., 2021; Thiabaud et al., 2014; Delgado Mena et al., 2010; Bond et al., 2010).
The oxidation state of a planet is crucial to understand planetary chemistry and internal fractionation of materials (Wade & Wood, 2005; Unterborn et al., 2014) and it is usually recorded by oxygen fugacity () – i.e. the nonideal partial pressure of oxygen. It may, for convenience, be expressed relative to a mineral buffer, such as Iron-Wüstite (IW) and Quartz-Fayalite-Magnetite (QFM) (O’Neill, 1987; Ballhaus et al., 1990; Doyle et al., 2019). In an exoplanetary context, however, the is difficult to estimate, because it changes in response to mineralogy, pressure and temperature (Woodland & Koch, 2003; O’Neill et al., 2006; Armstrong et al., 2019), all of which are unknown in the first place for our model -Cen-Earth. We therefore opt for a proxy – that may be constrained directly from the estimated planetary bulk composition – for the planetary nominal . Considering that O, Mg, Si, and Fe are the most abundant elements in a silicate planet (Wang et al., 2018; Yoshizaki & McDonough, 2020) and that MgO and SiO2 are the major oxides while FeO content heavily depends on the planet’s oxidation state, we propose the bulk (O-Mg-2Si)/Fe as a proxy for the oxidation state of such a planet. For example, if a negative value is found for (O-Mg-2Si)/Fe (indeed for our case as shown in Table 3), it implicitly reveals a reduced nature of the mantle.
Furthermore, since Mg and Si are expected to be the dominant lithophile elements in a silicate mantle (Palme & O’Neill, 2014; Wang et al., 2018; Yoshizaki & McDonough, 2020) while Fe is the major constituent for a rocky planet’s core (McDonough, 2003; Wang et al., 2018), (Mg+Si)/Fe is adopted as a proxy for the potential core size of a rocky planet. Along these lines, since Eu is also a lithophile element and by following (Wang et al., 2020a) it is a preferred proxy for long-lived radionuclides 235,238U and 232Th in terrestrial-type planets, we therefore adopt Eu/(Mg+Si) as a proxy for indicating the concentration of these long-lived isotopes and the budget of the resultant radiogenic heating production over geologic timescales. A similar approach awaits formulation, however, to estimate 40K abundance (Gastis et al., 2020). Following Frank et al. (2014), we assume that the -CenA/B system has an initial value of 40K as that of the Solar System, but we also note that due to the age of the stars in the -CenA/B system (Morel, 2018; Salmon et al., 2021), 40K is considerably depleted in the modern mantle of our model -Cen-Earth (Wang et al., 2020a).
2.4 Software package and implementation
To carry out the analysis, three sets of software are employed: ExoInt (Wang et al., 2019b) for both devolatilization and first-principal interior modeling; PerpleX (Connolly, 2009) for a detailed modeling of the mantle mineralogy and interior structure; and FactSage 8.0 (Bale et al., 2016) for calculating the gas speciation from the modeled interiors. The details of the software package and its implementation for the study are presented in Appendix A.
3 Results
3.1 The chemical composition of the average AB system
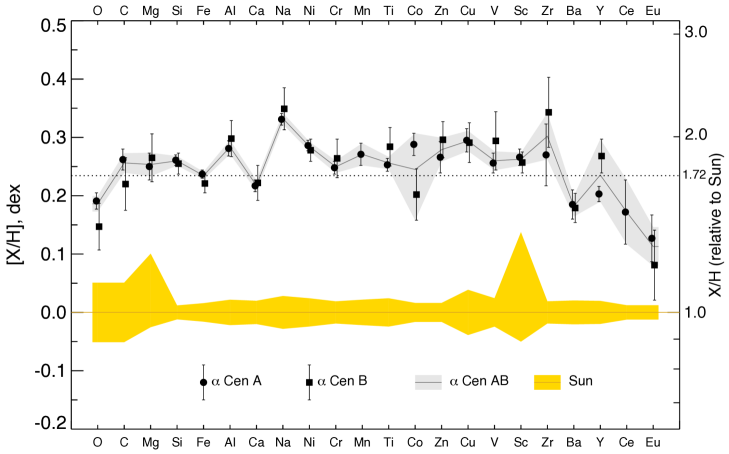
Figure 3 compares the chemical composition of the average AB system with that of the Sun. First of all, the average AB system is super-solar in metallicity ([Fe/H]), with an enrichment of iron to hydrogen by 72%. The enrichment of other elements, except O, Ba, Ce, and Eu, to hydrogen ([X/H]) are either equivalent or higher. The variation in the hydrogen-normalised enrichments for major rock-forming elements (e.g., O, Mg, Si, Fe, Al, Ca, and Na) will have a profound influence, as demonstrated later, on the geochemistry of the model -Cen-Earth.
To first order, C/O affects the availability of rock-forming elements such as Mg and Si to bond with O (e.g. Mg2SiO4) or C (e.g. SiC), while Mg/Si modulates the silicate mineral assemblages (e.g. olivine vs. pyroxene; Mg2SiO4 vs. MgSiO3). A calculation of C/O and Mg/Si in -CenA/B (Fig. 4) reveals that both of these ratios are consistent with the solar values (within uncertainties), although the C/O () of -CenA/B is closer – than that () of the Sun (Wang et al., 2019a) – to the threshold (0.8) (Bond et al., 2010; Delgado Mena et al., 2010) for forming a carbide (rather than silicate) planet. With such a relatively higher value in C/O, the -CenA/B planet is expected to develop a silicate mantle just like terrestrial planets in our system, whereas the carbon-bearing phases (e.g. graphite and diamond) in its exo-mantle may be slightly more abundant – cf. (Zhao et al., 2018). An approximately equal Mg/Si between -CenA/B and the Sun ( vs. ) suggests a mineralogy similar to that of the Earth, in accord with earlier studies (e.g. Zhao et al., 2018; Morel, 2018). We also note that the most recent solar photospheric abundances (Asplund et al., 2021) are consistent with our adopted protosolar abundances (Wang et al., 2019a) within uncertainties in terms of C/O vs. Mg/Si (Fig. 4), while a normalization to the former would lead to a relatively higher C/O that favors our suggestion of the enrichment of carbon-bearing phases in the silicates-dominated mantle of the model planet.
3.2 The chemical composition of the model -Cen-Earth
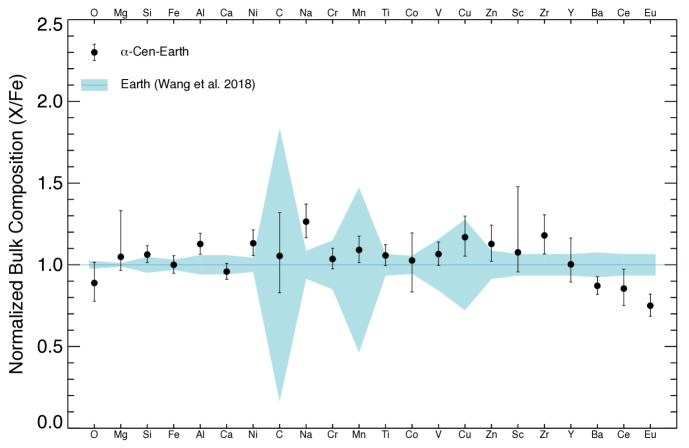
Applying the fiducial model of devolatilization (Wang et al., 2019a) to the averaged elemental abundances of the -CenA/B system provides an estimate of the bulk elemental composition of the model -Cen-Earth (Table 2). To focus the discussion on the relative abundances of individual elements in the model -Cen-Earth compared to Earth, all elemental abundances are normalized to iron, and by doing so, the 72% relative enrichment of metallicity is removed (Fig. 5). Similar to the findings shown in Fig. 3, the model -Cen-Earth has equivalent or relatively higher concentrations of most elements (relative to Fe) and lower concentrations of O, Ba, Ce, and Eu. The implications of such a bulk composition for the interior chemistry, structure and dynamics of the planet are firstly analyzed with the aforementioned key geochemical ratios, the values of which for the model planet (relative to Earth) are listed in Table 3.
| [Mg/Si] | [(Mg+Si)/Fe] | [(O-Mg-2Si)/Fe] | [Eu/(Mg+Si)] | ||||
| a [X/Y] = (X/Y) / (X/Y), where X and Y respectively denotes the numerator and denominator in any of the listed key ratios in brackets. | |||||||
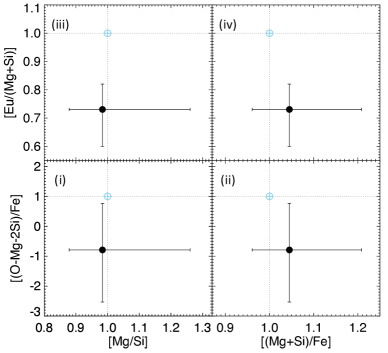
Overall, the model -Cen-Earth’s [Mg/Si] of and [(Mg+Si)/Fe] of resemble Earth’s values, whereas a [(O-Mg-2Si)/Fe] of and a [Eu/(Mg+Si)] of are relatively lower than those of Earth. Note that the uncertainties of these relative ratios include the uncertainties of these ratios in Earth. A cross-check of these key geochemical ratios, as shown in Fig. 6, helps understand better the geological properties of the model -Cen-Earth than with individual ratios. For example, in panel (i) of Fig. 6, the approximately equal [Mg/Si] reveals a silicate mantle composed of the relatively similar fractions of olivine (main formula: (Mg, Fe)2SiO4) and pyroxene (main formula: (Mg, Fe)SiO3), which in turn may be used to argue that they have similar mantle viscosity and thus convection rate (Spaargaren et al., 2020). In the [(Mg+Si)/Fe] vs. [(O-Mg-2Si)/Fe] panel, a slightly higher [(Mg+Si)/Fe] alludes to a sub-equal or smaller core for the model -Cen-Earth, whereas a lower [(O-Mg-2Si)/Fe] points to an FeO/Fe ratio that is lower, thus resulting in an increased core size (the relative importance of these competing effects are vetted by the subsequent quantitative interior modeling). In panel (iii), a significantly lower [Eu/(Mg+Si)] – a proxy for the concentration of the long-lived radionuclides – that occurs in a mantle with mineralogy similar to the Earth’s (suggested by [Mg/Si] above) implies that the mantle convection of the model -Cen-Earth may be weakened by 1/4 less intrinsic radiogenic heating over its geological history (assuming its gravitational energy to be similar to that of Earth; to be discussed further). Finally, a combination of panels (iv) and (ii) implies that the heat extraction from the Earth-sized core may be more efficient due to the potentially increased core-mantle temperature differences caused by the lower intrinsic radiogenic heating in the mantle (Wang et al., 2020a; Nimmo et al., 2020), but also subject to the tectonic regime of the planet (to be discussed later).
3.3 The interior composition and structure of the model -Cen-Earth
Table 4 shows the results of the modeling of first-order mantle and core composition as well as core mass fraction with ExoInt (Wang et al., 2019b, also see Appendix A.1). It is found that the model -Cen-Earth has a mantle composition similar to that of Earth, except for its FeO content that is significantly depleted and native carbon species (graphite/diamond) that may be relatively enriched. Some portion of carbon may be fractionated into the core, but our model is unable to constrain that yet (to be discussed later). The results are nonetheless consistent with the qualitative analysis above, respectively with [(O-Mg-2Si)/Fe] in the planet and with C/O in its host star. A further calculation of the Mg number (Mg# = MgO / (MgO + FeO), in molar ratio; converted from the weight fractions in Table 4) – an indicator for mantle chemistry and the degree of melting – for the (primitive) mantle of the model planet reveals a much higher Mg#, , compared to of the Earth’s primitive mantle (Palme & O’Neill, 2014; Wang et al., 2018)).
| Mantle composition (wt%) | ||||||||
| MgO | SiO2 | FeO | Al2O3 | CaO | Na2O | NiO | C | |
| -Cen-Earth | ||||||||
| Eartha | 37.8 | 45.0 | 8.05 | 4.45 | 3.55 | 0.36 | 0.25 | 0.01 |
| Core composition (wt%) | Core mass fraction (wt%) | |||||||
| Fe | Ni | Si | ||||||
| -Cen-Earth | ||||||||
| Earthb | ||||||||
| a Refer to the silicate Earth composition (without uncertainties) of McDonough & Sun (1995). | ||||||||
| b Refer to the core composition and core mass fraction of Wang et al. (2018); silicon composition in the core is rescaled to represent the total estimate of light elements in the core in Wang et al. (2018). | ||||||||
For the core composition of a presumed Fe-Ni-Si alloy, the model -Cen-Earth is statistically consistent with Earth. However, the model planet has a relatively higher core mass fraction ( wt%) than that of Earth ( wt%; Wang et al. 2018). It is noteworthy that, owing to the lack of sulfur abundance measurements in -Cen A and B and the model restrictions on considering other candidate light elements (e.g. C and H), we have only modeled the concentration of Si as the sole light element in the core. Hence, our modeled Si concentration ( wt%) should be seen as an upper limit of Si and of light elements, overall.
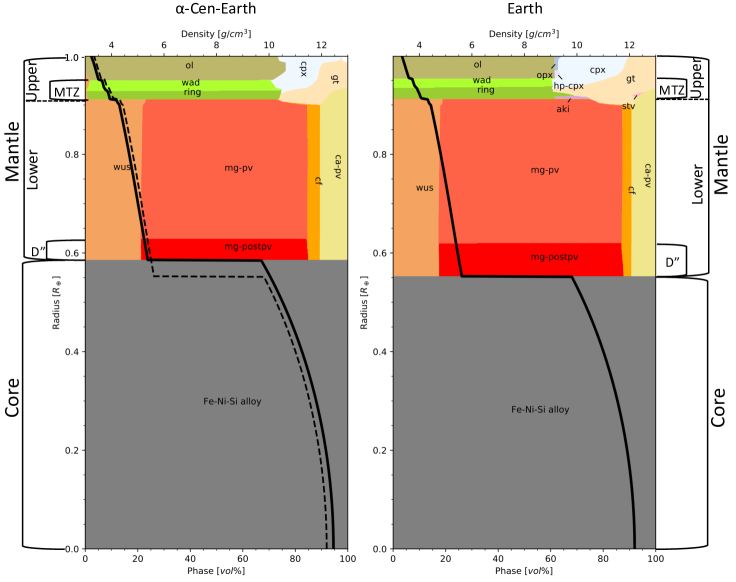
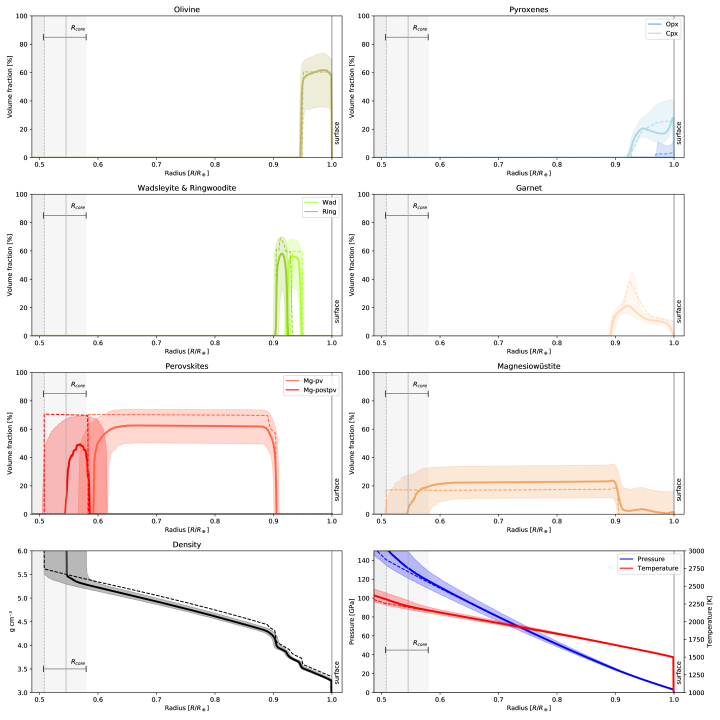
With detailed interior modeling results shown in Fig. 7, we find that the model -Cen-Earth has a broadly similar mantle mineralogy to that of the Earth. Specifically, the upper mantle is enriched in olivine (‘ol’) over pyroxene assemblages (‘cpx’, ‘opx’, etc.), with the mantle transition zone (MTZ) being dominated by wadsleyite (‘wad’) and ringwoodite (‘ring’). The lower mantle is dominated by the magnesium end-member perovskite (‘mg-pv’; (Mg,Fe)SiO3; bridgmanite), except for the lowermost mantle (so-called zone) that is dominated by the higher-pressure perovskite phase (magnesium post-perovskite, ‘mg-postpv’).
In particular, compared to Earth, the olivine/pyroxene ratio (by volume) in the upper mantle of the model -Cen-Earth is equivalent ( vs. ). This highlights the importance of Mg/Si in modulating the dominant mineral assemblages in the upper mantle. Likewise, the sum of wadsleyite and ringwoodite in the MTZ is consistent with that of Earth, while the trace phases such as akimotoite (‘aki’) and stishovite (‘stv’) vanish in this zone. However, there is a slight increase in the wadsleyite/ringwoodite ratio (by volume) in the model planet relative to Earth ( vs. ). The implications of this will be discussed later. Further, the modeled thickness of the zone in the lower mantle of the -Cen-Earth is noticeably thinner, with a decreased amount of the high-pressure ‘mg-postpv’ phase ( vs. ). This is expected from the slightly enlarged core size and thus elevated core-mantle boundary. A higher Mg# as revealed above may also suggest that the solid solution in magnesiowüstite (‘wus’) should be dominated by the periclase (MgO) endmember (instead of FeO).
Since the lower [(O-Mg-2Si)/Fe] of the planet (relative to Earth) frees a larger fraction of Fe from being oxidized in the mantle ( wt% vs. 8 wt% as for FeO; Table 4), thus segregating into the core, the mantle density is slightly but systematically lower and vice-versa for the core density. The relatively elevated core-mantle boundary implies a lower pressure at the boundary, which in turn may lead to less effective Fe2+ disproportionation at time of core formation (Frost et al., 2004).
Importantly, these results should be understood in the context of the yet-large uncertainty of the interior modeling (Fig. A1). Overall, the model -Cen-Earth has a broadly Earth-like mineralogy and structure.
4 Discussion
4.1 A reduced primitive mantle and its outgassing
The modeled mass fractions of FeO in mantle rocks and Fe in the core (Table 4), permit calculation of the model -Cen-Earth’s nominal relative to IW (IW), which presumes equilibrium between the mantle and core:
| (1) |
where and are mole fractions of FeO in mantle rocks and Fe in the core, respectively (converted from their corresponding mass fractions given in Table 4) and and are activity coefficients for these components. To facilitate comparison, we set the activity coefficient ratio () to unity, which is expected to be valid at the high-temperature conditions of the primitive mantle of Earth (Inoue et al., 2010; Doyle et al., 2019; Sossi et al., 2020). As such, IW depends largely on , which can be estimated for our model planet.
This leads to an IW value of , compared to the terrestrial IW value of -2.2 upon core formation (Frost et al., 2004). Namely, the primitive mantle of the model -Cen-Earth is logarithmic units more reduced than that of Earth. We emphasize that the calculated IW value could not be an exact reflection of the planetary fO2, which changes over the depth of the planet and also over time due to planetary internal processes (e.g. disproportionation reactions occurring at high pressures; Frost et al. 2004).
Oxygen fugacity at the planetary surface plays a critical role in determining the composition of the outgassed C-O-H species from a magma ocean prior to and during its crystallization (Hirschmann, 2012; Ortenzi et al., 2020). Such a magma ocean may have been created in the history of the model -Cen-Earth following extensive heating, presuming it also accreted partially through energetic impacts of precursor planetesimals and planetary embryos, in a manner analogous to the Earth. In order to understand the potential diversity of the early atmospheric compositions produced, its H/C ratio and are required (Sossi et al., 2020). There is no direct constraint on the H/C ratio of the model -Cen-Earth. Given a stellar nebula of [C/H] = dex (i.e. 2 times higher than the solar C/H; Column 4, Table 1) and a relatively higher C/O (Fig. 4), we deduce that H/C in a nascent -Cen-Earth should be considerably lower than that in the early Earth, and hence adopt a value of , where bulk silicate Earth (BSE)’s molar H/C is 6.8 (Hirschmann & Dasgupta, 2009; Marty, 2012). Oxygen fugacity estimates are adopted from presumed core-mantle equilibration conditions, although oxygen fugacity changes as the planet evolves, and as a function of depth (as observed on Earth). Given these caveats, we consider two end-member scenarios of atmosphere formation on the model -Cen-Earth. The first presumes the atmospheric H/C is unfractionated from the primitive mantle H/C of the model planet, and in the second, we adopt the model of Sossi et al. (2020) to calculate solubilities of individual gas species using basaltic melts as analogues for the magma ocean, presuming an Earth-like mantle mass (see Sect. A.3). We note that the importance of H/C over the gross atmospheric chemistry may be worth exploring in further (e.g. Liggins et al., 2021).
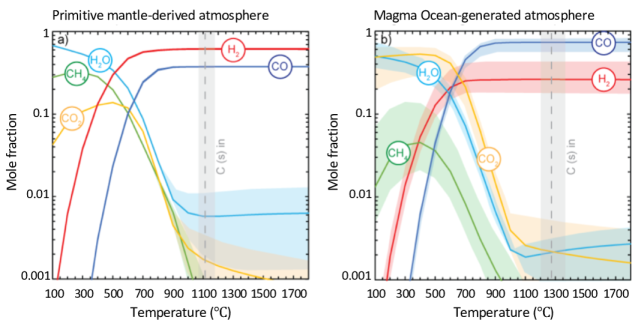
For both cases at magmatic temperatures, the reducing conditions are such that the principal gases are H2 and CO, with the former predominating in high H/C atmospheres (Fig. 8a) and vice-versa (Fig. 8b). These species are, however, not stable in a cooling atmosphere and react to form CH4 through hydrogenation below about 700 to 800 ∘C leading to an atmosphere dominated by H2O, CH4 and CO2 (Fig. 8). Carbon dioxide can be generated through graphite precipitation (H2 + 3CO CO2 + H2O + 2C) and the relative proportions of CO2 to CH4 depend on the and the H/C in the atmosphere (Sossi et al., 2020). Hence, the primitive mantle-derived case (Fig. 8a) produces more CH4 at low temperatures than does the magma ocean-derived scenario (Fig. 8b) that is expected to be richer in CO2. This behavior is a consequence of the higher solubility of H relative to C in magmatic liquids (except under extremely reducing conditions; Sossi et al. 2020; Bower et al. 2021), giving rise to complementary low H/C ratios and thus lower CH4 production rates in magma ocean-generated atmospheres. At IW = -4, about 79 % of the H budget, but only 1.5 % of the C budget, is expected to be dissolved in the magma ocean, resulting in a much thinner gaseous envelope than in the nominal ‘primitive mantle’ case in which all H is presumed to be in the atmosphere. Importantly, the fraction of H dissolved scales inversely with , it is % dissolved at IW = -3.5 but only 55 % at IW = -5.3, owing to the higher H2/H2O ratio in the gas phase and the low solubility of H2 relative to H2O (Hirschmann, 2012; Moore et al., 1998). Methane is therefore likely to be a ubiquitous gas considering the reduced nature of the model -Cen-Earth mantle. Nonetheless, in both cases, the overall CO2-CH4-H2O-dominated early atmospheres (upon cooling) resemble that of Archean Earth (Gaudi et al., 2020; Catling & Zahnle, 2020). The subsequent evolution of the Earth, especially by the rising of oxygen 2.5 Gyr ago (known as “Great Oxidation Event”; Lyons et al. 2014; Luo et al. 2016) slowly but radically reshaped Earth’s atmosphere, which eventually leads to a modern atmosphere dominated by N2 and O2. Of course, we have no argument to prescribe a ‘life-existent’ nascent -Cen-Earth, nor can we determine the atmospheric evolution pathway for the planet (beyond what we have modeled for the ’first-generation’ early atmospheres). At the extreme and by considering the preferable photolytic destruction to CH4 and H2O (Lasaga et al., 1971; Guo, 2019; Johnstone, 2020), we may suspect that a dry, CO2-dominated atmosphere is a likely evolution outcome for such a planet. We will return to this point when we are discussing the stagnant-lid regime for the model planet.
4.2 Equivalent water-storage capacity of Earth
Mantle rocks may be hydrated (if water exists) to different degrees: (i) under relevant upper mantle conditions ( GPa) pyroxene can hold up to 20 times more water in its crystalline structure than olivine (Warren & Hauri, 2014); (ii) the dominant MTZ minerals (wadsleyite & ringwoodite) can store water in their crystal structures by about one order of magnitude more than any of olivine, pyroxene, and perovskite (Fei et al., 2017; Pearson et al., 2014; Bercovici & Karato, 2003; Murakami et al., 2002; Bolfan-Casanova et al., 2000); (iii) between wadsleyite and ringwoodite, the former favors water twice as much as the latter based on water partitioning experiments (Inoue et al., 2010). Compared to Earth, the model -Cen-Earth’s equivalent amount of wadsleyite + ringwoodite as well as its consistent ratio of olivine/pyroxene dictates that this planet should have a water-storage capacity equivalent to Earth. This capacity is further strengthened by the relatively higher ratio of wadsleyite/ringwoodite ( vs. ). The model -Cen-Earth must therefore be able to store, at least, as much water as in its mantle as Earth. It is worth stressing, however, that “mantle water-storage capacity” neither implies presence of water in a particular abundance (cf. Dorn et al., 2015; Unterborn et al., 2018; Dencs & Regály, 2019; Shah et al., 2020; Acuna et al., 2021), nor does it define the source of water (cf. Hallis et al., 2015; Peslier et al., 2017; Wu et al., 2018; O’Brien et al., 2018; Lichtenberg et al., 2019). A further investigation of these aspects is important for understanding the potential hydrosphere of a rocky planet, but is beyond what can be constrained with the model bulk elemental composition only.
4.3 A Venus-like geodynamic regime?
According to Wang et al. (2020a), an -Cen-Earth with a significantly lower Eu/(Mg+Si) relative to Earth (Fig. 6) has 1/4 and 1/2 less in radiogenic heating from the decay of long-lived radionuclides than Earth at its formation and at present-day, respectively. As calculated in Sect. 4.1, the primitive mantle of this model planet is also considerably more reduced (by two orders of magnitude) than that of Earth. The former is also modeled to be relatively enriched in graphite/diamond (this should hold still even if some portion of native carbon species has been segregated into the core; Dasgupta et al. 2013; Li & Fei 2014; Fichtner et al. 2021), as shown in Table 4. Taken together, these factors preferentially impose a stagnant-lid tectonic regime (Hakim et al., 2019; Dorn et al., 2018; Noack et al., 2017; Unterborn et al., 2014).
In a stagnant-lid regime, volcanism and outgassing of the planet are generally suppressed owing to an effective thermal boundary layer and curtailed convection (Ballmer & Noack, 2021). For an Earth-sized, stagnant-lid planet, the outgassing of CO2 (up to 50 bar) is permitted, however (Dorn et al., 2015, Lena Noack, personal communication). Since Fe lowers the solidus temperature of mantle peridodite (Hirschmann, 2000), a depleted Fe content in the model -Cen-Earth’s mantle (with a significant higher Mg# of , versus for Earth) further means that partial melting (and hence volcanism) should be less prevalent on the model planet. Over much of the history of the planet, mantle convection and planetary resurfacing should have been moribund. This assessment however does not consider the role of melting in heat transport and, particularly under a stagnant lid, heat build-up (Driscoll & Bercovici, 2014). Furthermore, a transient and periodic episode of mobile lids, and thus active volcanism and surging degassing, may take place when accumulated heat beneath a stagnant lid becomes enough to cause catastrophic resurfacing via lithospheric overturn – i.e. resembling that proposed for the history of Venus: alternating active and stagnant-lid (Turcotte 1993) (cf. localized resurfacing through lava flows; Noack et al. 2012). Once the heat has been sufficiently released, however, the mantle cools down and enters into another long-duration episode of stagnant lid tectonics.
The evolution of planetary heat flux also has important implications for the presence or absence of planetary dynamos. Low radiogenic heat production is proposed to favor the generation of geodynamos due to the increased mantle-core temperature difference and thus efficient heat extraction from the core (Nimmo et al., 2020). However, the overlying stagnant-lid regime also ultimately prevents heat extraction from the surface, consequently reducing the mantle-core temperature differences – i.e. a negative feedback to the generation of geodynamos. The generation and evolution of geodynamos are also related to the planetary rotation (Zuluaga & Cuartas, 2012) and may also be mechanically stirred by stochastic impacts (Jacobson et al., 2017), all of which are beyond what we can constrain for the -Cen-Earth that is modeled based on our predicted bulk composition only. As such, in spite of a broadly Earth (and potentially Venus)-like interior composition and structure as well as a lower radiogenic heating, it remains an open question if such an -Cen planet would mirror the apparent lack of active dynamos in Venus (Schubert & Soderlund, 2011; Phillips & Russell, 1987).
5 Conclusions
Starting with the measured host stellar abundances and a fiducial model of devolatilization, we present an analysis of planetary bulk composition, interiors and (early) atmospheres for a model Earth-sized planet in the habitable zone of -Cen A/B. The detailed analysis offers a new approach of investigation to what we may expect for Earth-sized planets in the habitable zones in the solar neighborhood. Of course, the validity of our analysis and thus conclusion is subject to our principal assumption that our adopted devolatilization model (Wang et al., 2019a) may be applied to the Cen A/B system. Firstly, it is noteworthy that our findings for a HZ rocky planet around the ”Sun-like” -Cen A/B should not be extrapolated to its counterpart around Proxima Cen, which is a red dwarf and has a debated origin from the binary companions (Kervella et al., 2017; Beech et al., 2017; Feng & Jones, 2018). Second, although Cen A and B are “Sun-like” stars, their metallicities are % higher than the solar metallicity (Fig. 3). How this difference would affect the condensation/evaporation process, and thus the devolatilization scale, is the subject of ongoing work (Wang et al., 2020b). Third, we ignore any potential effect of the “binarity” of the stars on their surrounding planetary bulk chemistry during planet formation, even though we highlight that dynamically, the planetary orbits in the habitable zone around either companion are stable. Finally, we have yet to explore a larger parameter space, e.g. in mass and radius, but have only benchmarked our analysis with an Earth-sized planet, which would otherwise have an impact on the interior modeling (Unterborn et al., 2016; Dorn et al., 2018; Hinkel & Unterborn, 2018). We nonetheless envisage that such an analysis is readily replicable with different parameter settings (Wang et al. in preparation) and is informative as presented to enable such an extension.
In addition, active research continues over whether a correlation exists between stellar multiplicity on the occurrence rate of planets (Kraus et al., 2016; Savel et al., 2020); this extends to the effect of stellar metallicity and the occurrence rate of small/rocky planets (Mulders et al., 2016; Petigura et al., 2018; Lu et al., 2020; Emsenhuber et al., 2020). For the calculation of gas speciation, we presume an H/C ratio for the primitive mantle of the model -Cen-Earth by scaling from the Earth’s value with the difference in C/H between -Cen AB and Sun. This approach, however, may be oversimplified. Furthermore, we do not consider any catastrophic impact at a scale that may destabilize/remove the mantle or atmosphere of an Earth-sized planet, which may radically alter the geodynamic regimes of the planet including its mantle convection (O’Neill et al., 2017), dynamo (Jacobson et al., 2017), and even atmosphere (Lupu et al., 2014). With all of these caveats in mind, we conclude with caution in the following:
-
1.
An -Cen-Earth as modeled should have a reduced (primitive) mantle that is similarly dominated by silicates albeit likely enriched in native carbon species (e.g. graphite/diamond);
-
2.
The planet is also expected to have a slightly larger iron core, with a core mass fraction of wt% (cf. Earth’s wt%);
-
3.
The planet should have an equivalent water-storage capacity of Earth;
-
4.
Such a planet may also have a CO2-CH4-H2O-dominated early atmosphere that resembles that of Archean Earth; observationally, this may be tested with a dry, CO2-dominated atmosphere considering the preferable photolytic destruction to CH4 and H2O and the possibility that –
-
5.
the planet may be in a Venus-like stagnant-lid regime, with sluggish mantle convection and planetary resurfacing, over most of its geological history.
Appendix A Software and implementation
A.1 ExoInt
ExoInt (Wang et al., 2019b) is an open-access package for devolatilizing stellar abundances and computing the mantle composition of major end-member oxides, core composition of an Fe-Ni-Si-S alloy (other candidate light elements such as C and H are not considered yet), as well as core mass fraction. Here we employ an updated version of ExoInt (v1.2)222https://github.com/astro-seanwhy/ExoInt, in which the important updates are (i) SiO2 is moved to the end of lithophile oxides and ahead of siderophile oxides (e.g. FeO and NiO), enabling Si to partially sink into the core while the mantle is reduced; (ii) the probability of the valid output from Monte Carlo simulations is computed together with the raw estimate of the mass fraction of each entity in the mantle and core (for details see Table A1 as well as Appendix A of Wang et al. 2019b), and these probabilities are taken as the weighting factors of these raw/unconstrained mass fractions to obtain the final/constrained mantle and core compositions as reported in Table 4.
| Mantle | ||||||||
| MgO | SiO2 | FeO | Al2O3 | CaO | Na2O | NiO | C | |
| Composition (wt%) | ||||||||
| -value | 1.00 | 1.00 | 0.12 | 1.00 | 1.00 | 1.00 | 0.12 | 1.00 |
| Core | ||||||||
| Fe | Ni | Si | ||||||
| Composition (wt%) | ||||||||
| -value | 1.00 | 1.00 | 0.88 | |||||
A.2 PerPleX
PerpleX (Connolly, 2009) is a Gibbs free energy minimization package to compute the mantle mineralogy given the chemical composition and the pressure and temperature gradients. The mineral equations of state (EoS) and thermodynamic parameters of the foremost oxides (SiO2, MgO, FeO, Al2O3, CaO and Na2O) are adopted from Stixrude & Lithgow-Bertelloni (2011). Other less important oxides (e.g. NiO, SO3, and CO2) and all reduced phases (e.g. graphite/diamond and other mantle metals), which are also computable with ExoInt, are neglected for the mineralogy modeling. The liquid EoS (Anderson & Ahrens, 1994) is adopted for an Fe-Ni alloy core (with/without light elements). We adopt an adiabatic thermal gradient as commonly practiced in the literature for rocky exoplanets (Dorn et al., 2015; Unterborn et al., 2018; Lorenzo, 2018). Integration of the gradient starts at the base of the lithosphere (i.e. the top of the uppermost mantle), with an initial pressure and temperature arbitrarily set at 3 Gpa and 1450 K – similar to the conditions at Earth’s crust-mantle boundary (Anderson, 1982; Dziewonski & Anderson, 1981). Then the best-fit values of our estimates of the mantle and core compositions and core mass fraction with ExoInt for the model -Cen-Earth (Table 4), along with the assumption of 1 and , are input to PerpleX to obtain the self-consistent mineralogy and density profile as shown in Fig. 7. Monte Carlo simulations with the random values drawn from our mantle and core compositional estimates (Table 4) are carried out to obtain the uncertainties of individual minerals as shown in Fig. A1. For generating the best-fit mineralogy for Earth, the input mantle and core compositions are from Table 4 (excluding NiO and C as well as the uncertainties associated with the core compositions).
A.3 FactSage 8.0
FactSage 8.0 (Bale et al., 2016) is employed to calculate the gas speciation as a function of temperature. The composition used is set in the H-C-O system for a real gas and pure solid and liquid phases, and a nominal total pressure of 1 bar. The mole fraction of O adjusted to yield the desired relative oxygen fugacity at 2073 K. The calculations were then stepped in 100 K temperature intervals down to 373 K and the equilibrium speciation and any condensing solid or liquid phases resolved. In the magma ocean-generated cases, the primitive mantle’s H/C was subjected to partitioning between a magma ocean and its atmosphere at 2073 K, in order to calculate a new H/C ratio of the atmosphere. To do so, the H abundance was fixed at the value of Earth’s mantle (0.012 wt%) (Palme & O’Neill, 2014), and the C content increased to 0.043 wt% to yield the desired molar log(H/C) ratio (0.53; see main text). Partial pressures were then resolved according to mass balance given the mass of the mantle (assumed to be that of the Earth’s, kg) and the acceleration due to gravity. The mass balance must also satisfy the condition of redox equilibrium, meaning that the H2/H2O and CO/CO2 ratios are uniquely determined by the fixed temperature, pressure and oxygen fugacity. The partial pressure of each species was then iteratively determined by considering the solubility of H2O, H2, CO, and CO2 in basaltic melts as proxies for the magma ocean (for details see Sossi et al. 2020 and references therein).
References
- Acuña (2019) Acuña, L. 2019, Master’s thesis, Lund University. https://www.lunduniversity.lu.se/lup/publication/8976827
- Acuna et al. (2021) Acuna, L., Deleuil, M., Mousis, O., et al. 2021, Astron. Astrophys., 647, 1, doi: 10.1051/0004-6361/202039885
- Adibekyan et al. (2021) Adibekyan, V., Dorn, C., Sousa, S. G., et al. 2021, Science (80-. )., 374, 330, doi: 10.1126/science.abg8794
- Akeson et al. (2021) Akeson, R., Beichman, C., Kervella, P., Fomalont, E., & Benedict, G. F. 2021. https://arxiv.org/abs/2104.10086
- Anderson (1982) Anderson, O. 1982, Phil. Trans. R. So. Lond. A, 306, 21
- Anderson & Ahrens (1994) Anderson, W., & Ahrens, T. 1994, J. Geophys. Res., 99, 4273
- Andrade-Ines & Michtchenko (2014) Andrade-Ines, E., & Michtchenko, T. A. 2014, Mon. Not. R. Astron. Soc., 444, 2167, doi: 10.1093/mnras/stu1591
- Anglada-Escudé et al. (2016) Anglada-Escudé, G., Amado, P. J., Barnes, J., et al. 2016, Nature, 536, 437, doi: 10.1038/nature19106
- Armstrong et al. (2019) Armstrong, K., Frost, D. J., McCammon, C. A., Rubie, D. C., & Ballaran, T. B. 2019, Science (80-. )., 365, 903, doi: 10.1126/science.aax8376
- Asplund et al. (2021) Asplund, M., Amarsi, A., & Grevesse, N. 2021, Astron. Astrophys., 1, doi: 10.1051/0004-6361/202140445
- Bale et al. (2016) Bale, C. W., Bélisle, E., Chartrand, P., et al. 2016, Calphad Comput. Coupling Phase Diagrams Thermochem., 55, 1, doi: 10.1016/j.calphad.2016.07.004
- Ballhaus et al. (1990) Ballhaus, C., Berry, R. F., & Green, D. H. 1990, Nature, 348, 437, doi: 10.1038/348437a0
- Ballmer & Noack (2021) Ballmer, M. D., & Noack, L. 2021. https://arxiv.org/abs/2108.08385
- Beech (2015) Beech, M. 2015, Alpha Centauri: unveiling the secrets of our nearest stellar neighbor (Springer). https://www.springer.com/de/book/9783319093710
- Beech et al. (2017) Beech, M., McCowan, C., & Peltier, L. 2017, Am. J. Astron. Astrophys., 5, 1, doi: 10.11648/j.ajaa.20170501.11
- Beichman et al. (2020) Beichman, C., Ygouf, M., Sayson, J. L., et al. 2020, Publ. Astron. Soc. Pacific, 132, 15002, doi: 10.1088/1538-3873/ab5066
- Bercovici & Karato (2003) Bercovici, D., & Karato, S. I. 2003, Nature, 425, 39, doi: 10.1038/nature01918
- Bolfan-Casanova et al. (2000) Bolfan-Casanova, N., Keppler, H., & Rubie, D. C. 2000, Earth Planet. Sci. Lett., 182, 209, doi: 10.1016/S0012-821X(00)00244-2
- Bond et al. (2010) Bond, J. C., O’Brien, D. P., & Lauretta, D. S. 2010, Astrophys. J., 715, 1050, doi: 10.1088/0004-637X/715/2/1050
- Bowens et al. (2021) Bowens, R., Meyer, M. R., Delacroix, C., et al. 2021, Astron. Astrophys., 653, A8, doi: 10.1051/0004-6361/202141109
- Bower et al. (2021) Bower, D. J., Hakim, K., Sossi, P. A., & Sanan, P. 2021. https://arxiv.org/abs/2110.08029
- Brewer & Fischer (2016) Brewer, J. M., & Fischer, D. A. 2016, Astrophys. J., 831, 1, doi: 10.3847/0004-637X/831/1/20
- Bryson et al. (2021) Bryson, S., Kunimoto, M., Kopparapu, R. K., et al. 2021, Astron. J., 161, 36, doi: 10.3847/1538-3881/abc418
- Carlomagno (2020) Carlomagno, B. 2020, J. Astron. Telesc. Instruments, Syst., 6, 1, doi: 10.1117/1.JATIS.6.3.035005
- Carlson et al. (2014) Carlson, R. W., Garnero, E., Harrison, T. M., et al. 2014, Annu. Rev. Earth Planet. Sci., 42, 151, doi: 10.1146/annurev-earth-060313-055016
- Cassan et al. (2012) Cassan, A., Kubas, D., Beaulieu, J. P., et al. 2012, Nature, 481, 167, doi: 10.1038/nature10684
- Catling & Zahnle (2020) Catling, D. C., & Zahnle, K. J. 2020, Sci. Adv., 6, doi: 10.1126/sciadv.aax1420
- Clark et al. (2021) Clark, J. T., Clerté, M., Hinkel, N. R., et al. 2021, Mon. Not. R. Astron. Soc., 504, 4968, doi: 10.1093/mnras/stab1052
- Connolly (2009) Connolly, J. A. D. 2009, Geochemistry, Geophys. Geosystems, 10, doi: 10.1029/2009GC002540
- Cowley et al. (2021) Cowley, C. R., Bord, D. J., & Yüce, K. 2021, Astron. J., 161, 142, doi: 10.3847/1538-3881/abdf5d
- Damasso et al. (2020) Damasso, M., Sordo, F. D., Anglada-Escudé, G., et al. 2020, Sci. Adv., 6, 1, doi: 10.1126/sciadv.aax7467
- Dasgupta et al. (2013) Dasgupta, R., Chi, H., Shimizu, N., Buono, A. S., & Walker, D. 2013, Geochim. Cosmochim. Acta, 102, 191, doi: 10.1016/j.gca.2012.10.011
- Delgado Mena et al. (2010) Delgado Mena, E., Israelian, G., González Hernández, J. I., et al. 2010, Astrophys. J., 725, 2349, doi: 10.1088/0004-637X/725/2/2349
- Dencs & Regály (2019) Dencs, Z., & Regály, Z. 2019, Mon. Not. R. Astron. Soc., 487, 2191, doi: 10.1093/mnras/stz1412
- Dorn et al. (2018) Dorn, C., Bower, D. J., & Rozel, A. 2018, in Handb. Exopl. (Cham: Springer International Publishing), 1–25, doi: 10.1007/978-3-319-30648-3_66-1
- Dorn et al. (2019) Dorn, C., Harrison, J. H., Bonsor, A., & Hands, T. O. 2019, Mon. Not. R. Astron. Soc., 484, 712, doi: 10.1093/mnras/sty3435
- Dorn et al. (2015) Dorn, C., Khan, A., Heng, K., et al. 2015, Astron. Astrophys., 577, A83, doi: 10.1051/0004-6361/201424915
- Doyle et al. (2019) Doyle, A. E., Young, E. D., Klein, B., Zuckerman, B., & Schlichting, H. E. 2019, Science, 366, 356, doi: 10.1126/science.aax3901
- Driscoll & Bercovici (2014) Driscoll, P., & Bercovici, D. 2014, Phys. Earth Planet. Inter., 236, 36, doi: 10.1016/j.pepi.2014.08.004
- Dumusque et al. (2012) Dumusque, X., Pepe, F., Lovis, C., et al. 2012, Nature, 1, 4, doi: 10.1038/nature11572
- Dziewonski & Anderson (1981) Dziewonski, A. M., & Anderson, D. L. 1981, Phys. Earth Planet. Inter., 25, 297, doi: 10.1016/0031-9201(81)90046-7
- Emsenhuber et al. (2020) Emsenhuber, A., Mordasini, C., Burn, R., et al. 2020. https://arxiv.org/abs/2007.05562
- Fegley et al. (2020) Fegley, B., Lodders, K., & Jacobson, N. S. 2020, Chemie der Erde, 80, 125594, doi: 10.1016/j.chemer.2019.125594
- Fei et al. (2017) Fei, H., Yamazaki, D., Sakurai, M., et al. 2017, Sci. Adv., 3, 1, doi: 10.1126/sciadv.1603024
- Feng & Jones (2018) Feng, F., & Jones, H. R. 2018, Mon. Not. R. Astron. Soc., 473, 3185, doi: 10.1093/mnras/stx2576
- Fichtner et al. (2021) Fichtner, C. E., Schmidt, M. W., Liebske, C., Bouvier, A. S., & Baumgartner, L. P. 2021, Earth Planet. Sci. Lett., 554, 116659, doi: 10.1016/j.epsl.2020.116659
- Fortney (2012) Fortney, J. J. 2012, Astrophys. J., 747, L27, doi: 10.1088/2041-8205/747/2/L27
- Frank et al. (2014) Frank, E. a., Meyer, B. S., & Mojzsis, S. J. 2014, Icarus, 243, 274, doi: 10.1016/j.icarus.2014.08.031
- Frost et al. (2004) Frost, D. J., Liebske, C., Langenhorst, F., et al. 2004, Nature, 428, 409, doi: 10.1038/nature02413
- Gastis et al. (2020) Gastis, P., Perdikakis, G., Dissanayake, J., et al. 2020, arXiv. https://arxiv.org/abs/2001.11600
- Gaudi et al. (2020) Gaudi, B. S., Seager, S., Mennesson, B., et al. 2020, The Habitable Exoplanet Observatory (HabEx) Mission Concept Study Final Report, Tech. rep. https://arxiv.org/abs/2001.06683
- Grossman & Larimer (1974) Grossman, L., & Larimer, J. W. 1974, Rev. Geophys., 12, 71, doi: 10.1029/RG012i001p00071
- Guiglion et al. (2018) Guiglion, G., De Laverny, P., Recio-Blanco, A., & Prantzos, N. 2018, Astron. Astrophys., 619, 1, doi: 10.1051/0004-6361/201833782
- Guo (2019) Guo, J. H. 2019, Astrophys. J., 872, 99, doi: 10.3847/1538-4357/aaffd4
- Hakim et al. (2019) Hakim, K., Spaargaren, R., Grewal, D. S., et al. 2019, Astrobiology, 19, 867, doi: 10.1089/ast.2018.1930
- Hallis et al. (2015) Hallis, L. J., Huss, G. R., Nagashima, K., et al. 2015, Science (80-. )., 350, 795, doi: 10.1126/science.aac4834
- Harrison et al. (2018) Harrison, J. H., Bonsor, A., & Madhusudhan, N. 2018, Mon. Not. R. Astron. Soc., 479, 3814, doi: 10.1093/mnras/sty1700
- Harrison et al. (2021) Harrison, J. H., Shorttle, O., & Bonsor, A. 2021, Earth Planet. Sci. Lett., 554, 116694, doi: 10.1016/j.epsl.2020.116694
- Heiter et al. (2015) Heiter, U., Jofré, P., Gustafsson, B., et al. 2015, Astron. Astrophys., 582, 1, doi: 10.1051/0004-6361/201526319
- Hin et al. (2017) Hin, R. C., Coath, C. D., Carter, P. J., et al. 2017, Nature, 549, 511, doi: 10.1038/nature23899
- Hinkel & Unterborn (2018) Hinkel, N. R., & Unterborn, C. T. 2018, Astrophys. J., 853, 83, doi: 10.3847/1538-4357/aaa5b4
- Hirschmann (2000) Hirschmann, M. M. 2000, Geochemistry, Geophys. Geosystems, 1, doi: 10.1029/2000GC000070
- Hirschmann (2012) —. 2012, Earth Planet. Sci. Lett., 341-344, 48, doi: 10.1016/j.epsl.2012.06.015
- Hirschmann & Dasgupta (2009) Hirschmann, M. M., & Dasgupta, R. 2009, Chem. Geol., 262, 4, doi: 10.1016/j.chemgeo.2009.02.008
- Inoue et al. (2010) Inoue, T., Wada, T., Sasaki, R., & Yurimoto, H. 2010, Phys. Earth Planet. Inter., 183, 245, doi: 10.1016/j.pepi.2010.08.003
- Jacobson et al. (2017) Jacobson, S. A., Rubie, D. C., Hernlund, J., Morbidelli, A., & Nakajima, M. 2017, Earth Planet. Sci. Lett., 474, 375, doi: 10.1016/j.epsl.2017.06.023
- Jofré et al. (2017) Jofré, P., Das, P., Bertranpetit, J., & Foley, R. 2017, Mon. Not. R. Astron. Soc., 467, 1140, doi: 10.1093/mnras/stx075
- Johnstone (2020) Johnstone, C. P. 2020, Astrophys. J., 890, 79, doi: 10.3847/1538-4357/ab6224
- Kasper et al. (2019) Kasper, M., Arsenault, R., Zins, G., et al. 2019, The Messenger, 178, 5, doi: 10.18727/0722-6691/5163
- Kervella et al. (2017) Kervella, P., Thévenin, F., & Lovis, C. 2017, Astron. Astrophys., 598, L7, doi: 10.1051/0004-6361/201629930
- Koch & Edvardsson (2002) Koch, A., & Edvardsson, B. 2002, Astron. Astrophys., 381, 500, doi: 10.1051/0004-6361:20011578
- Koll et al. (2019) Koll, D. D., Malik, M., Mansfield, M., et al. 2019, arXiv, 140, doi: 10.3847/1538-4357/ab4c91
- Kopparapu et al. (2013) Kopparapu, R. K., Ramirez, R., Kasting, J. F., et al. 2013, Astrophys. J., 765, doi: 10.1088/0004-637X/765/2/131
- Kraus et al. (2016) Kraus, A. L., Ireland, M. J., Huber, D., Mann, A. W., & Dupuy, T. J. 2016, Astron. J., 152, 8, doi: 10.3847/0004-6256/152/1/8
- Lasaga et al. (1971) Lasaga, A. C., Holland, H. D., & Dwyer, M. J. 1971, Science (80-. )., 174, 53, doi: 10.1126/science.174.4004.53
- Li & Fei (2014) Li, J., & Fei, Y. 2014, in Treatise on Geochemistry, 2nd edn., ed. R. W. Carlson, Vol. 3 (Elsevier), 527–557, doi: 10.1016/B978-0-08-095975-7.00214-X
- Lichtenberg et al. (2019) Lichtenberg, T., Golabek, G. J., Burn, R., et al. 2019, Nat. Astron., 3, 307, doi: 10.1038/s41550-018-0688-5
- Liggins et al. (2021) Liggins, P., Jordan, S., Rimmer, P. B., & Shorttle, O. 2021, 1. https://arxiv.org/abs/2111.05161
- Lineweaver & Chopra (2012) Lineweaver, C. H., & Chopra, A. 2012, Annu. Rev. Earth Planet. Sci., 40, 597, doi: 10.1146/annurev-earth-042711-105531
- Liu et al. (2020) Liu, F., Yong, D., Asplund, M., et al. 2020, Mon. Not. R. Astron. Soc., 495, 3961, doi: 10.1093/mnras/staa1420
- Lodders (2003) Lodders, K. 2003, Astrophys. J., 591, 1220, doi: 10.1086/375492
- Lorenzo (2018) Lorenzo, A. J. 2018, Master’s thesis, Arizona State University. https://repository.asu.edu/items/51736
- Lu et al. (2020) Lu, C. X., Schlaufman, K. C., & Cheng, S. 2020, Astron. J., 160, 253, doi: 10.3847/1538-3881/abb773
- Luo et al. (2016) Luo, G., Ono, S., Beukes, N. J., et al. 2016, Sci. Adv., 2, 1, doi: 10.1126/sciadv.1600134
- Lupu et al. (2014) Lupu, R. E., Zahnle, K., Marley, M. S., et al. 2014, Astrophys. J., 784, doi: 10.1088/0004-637X/784/1/27
- Lyons et al. (2014) Lyons, T. W., Reinhard, C. T., & Planavsky, N. J. 2014, Nature, 506, 307, doi: 10.1038/nature13068
- Marty (2012) Marty, B. 2012, Earth Planet. Sci. Lett., 313-314, 56, doi: 10.1016/j.epsl.2011.10.040
- McDonough (2003) McDonough, W. 2003, in Treatise on Geochemistry, 1st edn., ed. R. W. Carlson, Vol. 2 (Elsevier), 547–568, doi: 10.1016/B0-08-043751-6/02015-6
- McDonough & Sun (1995) McDonough, W., & Sun, S.-s. 1995, Chem. Geol., 120, 223, doi: 10.1016/0009-2541(94)00140-4
- Moore et al. (1998) Moore, G., Vennemann, T., & Carmichael, I. 1998, Am. Mineral., 83, 36
- Morel (2018) Morel, T. 2018, Astron. Astrophys., 615, A172, doi: 10.1051/0004-6361/201833125
- Mulders et al. (2016) Mulders, G. D., Pascucci, I., Apai, D., Frasca, A., & Molenda-Żakowicz, J. 2016, Astron. J., 152, 187, doi: 10.3847/0004-6256/152/6/187
- Murakami et al. (2002) Murakami, M., Hirose, K., Yurimoto, H., Nakashima, S., & Takafuji, N. 2002, Science (80-. )., 295, 1885, doi: 10.1126/science.1065998
- NASA Exoplanet Archive (2022) NASA Exoplanet Archive. 2022, Planetary Systems, Version: 2022-01-16 18:00, NExScI-Caltech/IPAC, doi: 10.26133/NEA12
- Neuforge-Verheecke & Magain (1997) Neuforge-Verheecke, C., & Magain, P. 1997, Astron. Astrophys., 328, 261
- Nimmo et al. (2020) Nimmo, F., Primack, J., Faber, S. M., Ramirez-Ruiz, E., & Safarzadeh, M. 2020, Astrophys. J., 903, L37, doi: 10.3847/2041-8213/abc251
- Noack et al. (2012) Noack, L., Breuer, D., & Spohn, T. 2012, Icarus, 217, 484, doi: 10.1016/j.icarus.2011.08.026
- Noack et al. (2017) Noack, L., Rivoldini, A., & Van Hoolst, T. 2017, Phys. Earth Planet. Inter., 269, 40, doi: 10.1016/j.pepi.2017.05.010
- Norris & Wood (2017) Norris, C. A., & Wood, B. J. 2017, Nature, 549, 507, doi: 10.1038/nature23645
- O’Brien et al. (2018) O’Brien, D. P., Izidoro, A., Jacobson, S. A., Raymond, S. N., & Rubie, D. C. 2018, Space Sci. Rev., 214, doi: 10.1007/s11214-018-0475-8
- O’Neill et al. (2017) O’Neill, C., Marchi, S., Zhang, S., & Bottke, W. 2017, Nat. Geosci., 10, 793, doi: 10.1038/ngeo3029
- O’Neill (1987) O’Neill, H. 1987, Am. Mineral., 72, 67
- O’Neill et al. (2006) O’Neill, H. S. C., Berry, A. J., McCammon, C. C., et al. 2006, Am. Mineral., 91, 404, doi: 10.2138/am.2005.1929
- Ortenzi et al. (2020) Ortenzi, G., Noack, L., Sohl, F., et al. 2020, Sci. Rep., 10, 1, doi: 10.1038/s41598-020-67751-7
- Palme & O’Neill (2014) Palme, H., & O’Neill, H. 2014, in Treatise on Geochemistry, 2nd edn., ed. R. W. Carlson, Vol. 3 (Elsevier), 1–39, doi: 10.1016/B978-0-08-095975-7.00201-1
- Pearson et al. (2014) Pearson, D. G., Brenker, F. E., Nestola, F., et al. 2014, Nature, 507, 221, doi: 10.1038/nature13080
- Peslier et al. (2017) Peslier, A. H., Schönbächler, M., Busemann, H., & Karato, S. I. 2017, Space Sci. Rev., 212, 743, doi: 10.1007/s11214-017-0387-z
- Petigura et al. (2018) Petigura, E. A., Marcy, G. W., Winn, J. N., et al. 2018, Astron. J., 155, 89, doi: 10.3847/1538-3881/aaa54c
- Phillips & Russell (1987) Phillips, J. L., & Russell, C. T. 1987, Adv. Sp. Res., 7, 291, doi: 10.1016/0273-1177(87)90232-8
- Pourbaix & Boffin (2016) Pourbaix, D., & Boffin, H. M. 2016, Astron. Astrophys., 586, 4, doi: 10.1051/0004-6361/201527859
- Quanz et al. (2015) Quanz, S. P., Crossfield, I., Meyer, M. R., Schmalzl, E., & Held, J. 2015, Int. J. Astrobiol., 14, 279, doi: 10.1017/S1473550414000135
- Quanz et al. (2021) Quanz, S. P., Ottiger, M., Fontanet, E., et al. 2021. https://arxiv.org/abs/2101.07500
- Quarles et al. (2020) Quarles, B., Li, G., Kostov, V., & Haghighipour, N. 2020, Astron. J., 159, 80, doi: 10.3847/1538-3881/ab64fa
- Quarles & Lissauer (2016) Quarles, B., & Lissauer, J. J. 2016, Astron. J., 151, 111, doi: 10.3847/0004-6256/151/5/111
- Rajpaul et al. (2016) Rajpaul, V., Aigrain, S., & Roberts, S. 2016, Mon. Not. R. Astron. Soc. Lett., 456, L6, doi: 10.1093/mnrasl/slv164
- Salmon et al. (2021) Salmon, S. J., Van Grootel, V., Buldgen, G., Dupret, M. A., & Eggenberger, P. 2021, Astron. Astrophys., 646, doi: 10.1051/0004-6361/201937174
- Savel et al. (2020) Savel, A. B., Dressing, C. D., Hirsch, L. A., et al. 2020, Astron. J., 160, 287, doi: 10.3847/1538-3881/abc47d
- Schubert & Soderlund (2011) Schubert, G., & Soderlund, K. M. 2011, Phys. Earth Planet. Inter., 187, 92, doi: 10.1016/j.pepi.2011.05.013
- Schulze et al. (2021) Schulze, J. G., Wang, J., Johnson, J. A., et al. 2021, Planet. Sci. J., 2, 113, doi: 10.3847/psj/abcaa8
- Shah et al. (2020) Shah, O., Alibert, Y., Helled, R., & Mezger, K. 2020, 162. https://arxiv.org/abs/2012.06455
- Sossi et al. (2020) Sossi, P. A., Burnham, A. D., Badro, J., et al. 2020, 1
- Sossi & Fegley (2018) Sossi, P. A., & Fegley, B. 2018, Rev. Mineral. Geochemistry, 84, 393, doi: 10.2138/rmg.2018.84.11
- Sossi et al. (2019) Sossi, P. A., Klemme, S., O’Neill, H. S. C., Berndt, J., & Moynier, F. 2019, Geochim. Cosmochim. Acta, 260, 204, doi: 10.1016/j.gca.2019.06.021
- Spaargaren et al. (2020) Spaargaren, R., Wang, H., Ballmer, M., Mojzsis, S., & Tackley, P. 2020, in Eur. Sci. Congr. 2020 (https://doi.org/10.5194/epsc2020-745), doi: 10.5194/epsc2020-745
- Stixrude & Lithgow-Bertelloni (2011) Stixrude, L., & Lithgow-Bertelloni, C. 2011, Geophys. J. Int., 184, 1180, doi: 10.1111/j.1365-246X.2010.04890.x
- Suárez-Andrés et al. (2018) Suárez-Andrés, L., Israelian, G., González Hernández, J. I., et al. 2018, Astron. Astrophys., 614, A84, doi: 10.1051/0004-6361/201730743
- The LUVIOR team (2019) The LUVIOR team. 2019, LUVOIR Final Report, Tech. rep. https://arxiv.org/abs/1912.06219
- Thiabaud et al. (2014) Thiabaud, A., Marboeuf, U., Alibert, Y., et al. 2014, Astron. Astrophys., 562, A27, doi: 10.1051/0004-6361/201322208
- Thiabaud et al. (2015) Thiabaud, A., Marboeuf, U., Alibert, Y., Leya, I., & Mezger, K. 2015, Astron. Astrophys., 580, A30, doi: 10.1051/0004-6361/201525963
- Unterborn et al. (2018) Unterborn, C. T., Desch, S. J., Hinkel, N. R., & Lorenzo, A. 2018, Nat. Astron., 2, 297, doi: 10.1038/s41550-018-0411-6
- Unterborn et al. (2016) Unterborn, C. T., Dismukes, E. E., & Panero, W. R. 2016, Astrophys. J., 819, 32, doi: 10.3847/0004-637x/819/1/32
- Unterborn et al. (2014) Unterborn, C. T., Kabbes, J. E., Pigott, J. S., Reaman, D. M., & Panero, W. R. 2014, Astrophys. J., 793, 124, doi: 10.1088/0004-637X/793/2/124
- Wade & Wood (2005) Wade, J., & Wood, B. J. 2005, Earth Planet. Sci. Lett., 236, 78, doi: 10.1016/j.epsl.2005.05.017
- Wagner et al. (2021) Wagner, K., Boehle, A., Pathak, P., et al. 2021, Nat. Commun., 12, 1, doi: 10.1038/s41467-021-21176-6
- Wang (2018) Wang, H. 2018, Phd thesis, Australian National University, doi: 10.25911/5d5147caa0d1e
- Wang et al. (2020a) Wang, H., T. Morel, Quanz, S., & Mojzsis, S. 2020a, Astron. Astrophys., 19, 1, doi: 10.1051/0004-6361/202038386
- Wang et al. (2018) Wang, H. S., Lineweaver, C. H., & Ireland, T. R. 2018, Icarus, 299, 460, doi: 10.1016/j.icarus.2017.08.024
- Wang et al. (2019a) —. 2019a, Icarus, 328, 287, doi: 10.1016/j.icarus.2019.03.018
- Wang et al. (2019b) Wang, H. S., Liu, F., Ireland, T. R., et al. 2019b, Mon. Not. R. Astron. Soc., 482, 2222, doi: 10.1093/mnras/sty2749
- Wang et al. (2020b) Wang, H. S., Sossi, P. A., & Quanz, S. P. 2020b, in Eur. Sci. Congr. 2020 (online: Europlanet Science Congress 2020), EPSC2020–874, doi: 10.5194/epsc2020-874
- Warren & Hauri (2014) Warren, J. M., & Hauri, E. H. 2014, J. Geophys. Res. Solid Earth, 119, 1851, doi: 10.1002/2013JB010328
- Winn & Fabrycky (2015) Winn, J. N., & Fabrycky, D. C. 2015, Annu. Rev. Astron. Astrophys., 53, 409, doi: 10.1146/annurev-astro-082214-122246
- Wood et al. (2019) Wood, B. J., Smythe, D. J., & Harrison, T. 2019, Am. Mineral., 104, 844, doi: 10.2138/am-2019-6852CCBY
- Woodland & Koch (2003) Woodland, A. B., & Koch, M. 2003, Earth Planet. Sci. Lett., 214, 295, doi: 10.1016/S0012-821X(03)00379-0
- Wu et al. (2018) Wu, J., Desch, S. J., Schaefer, L., et al. 2018, J. Geophys. Res. Planets, 123, 2691, doi: 10.1029/2018JE005698
- Yoshizaki & McDonough (2020) Yoshizaki, T., & McDonough, W. F. 2020, Geochim. Cosmochim. Acta, 273, 137, doi: 10.1016/j.gca.2020.01.011
- Zhao et al. (2018) Zhao, L., Fischer, D. A., Brewer, J., Giguere, M., & Rojas-Ayala, B. 2018, Astron. J., 155, 24, doi: 10.3847/1538-3881/aa9bea
- Zhu & Dong (2021) Zhu, W., & Dong, S. 2021, Annu. Rev. Astron. Astrophys., 59, 291, doi: 10.1146/annurev-astro-112420-020055
- Zuluaga & Cuartas (2012) Zuluaga, J. I., & Cuartas, P. A. 2012, Icarus, 217, 88, doi: 10.1016/j.icarus.2011.10.014