77email: kisiel@ifpan.edu.pl (ZK) & belloche@mpifr-bonn.mpg.de (AB)
Millimetre-wave laboratory study of glycinamide and search for it with ALMA toward Sagittarius B2(N) ††thanks: Tables 5, 6, and 7 are only available in electronic form at the CDS via anonymous ftp to cdsarc.u-strasbg.fr (130.79.128.5) or via http://cdsweb.u-strasbg.fr/cgi-bin/qcat?J/A+A/
Abstract
Context. Glycinamide (NH2CH2C(O)NH2) is considered to be one of the possible precursors of the simplest amino acid glycine. Its only rotational spectrum reported so far has been in the cm-wave region on a laser-ablation generated supersonic expansion sample.
Aims. The aim of this work is to extend the laboratory spectrum of glycinamide into the millimetre wave region to support its searches in the interstellar medium and to perform the first check for its presence in the high-mass star forming region Sagittarius B2(N).
Methods. Glycinamide was synthesised chemically and was studied with broadband rotational spectroscopy in the 90-329 GHz region with the sample in slow flow at 50∘C. Tunneling across a low energy barrier between two symmetry equivalent configurations of the molecule resulted in splitting of each vibrational state and many perturbations in associated rotational energy levels, requiring careful coupled state fits for each vibrational doublet. We searched for emission of glycinamide in the imaging spectral line survey ReMoCA performed with the Atacama Large Millimetre/submillimetre Array toward Sgr B2(N). The astronomical spectra were analysed under the assumption of local thermodynamic equilibrium.
Results. We report the first analysis of the mm-wave rotational spectrum of glycinamide, resulting in fitting to experimental measurement accuracy of over 1200 assigned and measured transition frequencies for the ground state tunneling doublet, of many lines for tunneling doublets for two singly excited vibrational states, and determination of precise vibrational separation in each doublet. We did not detect emission from glycinamide in the hot molecular core Sgr B2(N1S). We derived a column density upper limit of cm-2, which implies that glycinamide is at least seven times less abundant than aminoacetonitrile and 1.8 times less abundant than urea in this source. A comparison with results of astrochemical kinetics models for species related to glycinamide suggests that its abundance may be at least one order of magnitude below the upper limit obtained toward Sgr B2(N1S). This means that glycinamide emission in this source likely lies well below the spectral confusion limit in the frequency range covered by the ReMoCA survey.
Conclusions. Thanks to the spectroscopic data provided by this study, the search for glycinamide in the interstellar medium can continue on a firm basis. Targetting sources with a lower level of spectral confusion, such as the Galactic Center shocked region G+0.693-0.027, may be a promising avenue.
Key Words.:
astrochemistry – ISM: molecules – line: identification – ISM: individual objects: Sagittarius B2 – astronomical databases: miscellaneous1 Introduction
The quest for the simplest amino acid glycine in the interstellar medium (ISM) became a never-ending story for researches in the fields of astrochemistry and astrophysics. Since its first interstellar hunt (Brown et al. 1979) more than forty years have passed during which glycine has been extensively searched for toward various interstellar sources in both the centimetre and the millimetre wave regions of the electromagnetic spectrum (Hollis et al. 1980; Snyder et al. 1983; Berulis et al. 1985; Guélin & Cernicharo 1989; Combes et al. 1996; Ceccarelli et al. 2000; Hollis et al. 2003; Kuan et al. 2003, 2004; Belloche et al. 2008). However, its presence in the ISM has never been confirmed (Snyder et al. 2005; Jones et al. 2007; Cunningham et al. 2007), neither in the era of ALMA. This is in spite of the fact that glycine has been discovered in meteorites (Pizzarello et al. 1991; Ehrenfreund et al. 2001b; Glavin et al. 2006), dust samples from comet Wild 2 (Elsila et al. 2009), and in the coma of comet 67P/Churyumov-Gerasimenko (Altwegg et al. 2016). In addition, several laboratory experiments demonstrated the synthesis of glycine, and other amino acids, when interstellar ice analogs were subjected to UV radiation (Bernstein et al. 2002; Caro et al. 2002; Lee et al. 2009; Zheng & Kaiser 2010; Kim & Kaiser 2011) or bombarded by energetic electrons (Holtom et al. 2005). Numerous studies were undertaken to throw light on this controversy. They focused on plausible interstellar pathways to glycine, its detectability and survival in the hostile ISM (see, e.g., Ehrenfreund et al. 2001a; Blagojevic et al. 2003; Largo et al. 2010; Pilling et al. 2011; Lattelais et al. 2011; Rimola et al. 2012; Garrod 2013; Jimenez-Serra et al. 2014; Nhlabatsi et al. 2016; Aponte et al. 2017; Suzuki et al. 2018; Xavier et al. 2019). Special emphasis has been also placed on the formation routes of possible glycine precursors (see, e.g., Basiuk 2001; Largo et al. 2004; Koch et al. 2008; Knowles et al. 2010; Barrientos et al. 2012; Redondo et al. 2015, and references therein) which are hot candidates for the observations in the ISM as well. Some of them, such as methylamine (Kaifu et al. 1974), aminoacetonitrile (Belloche et al. 2008), and hydroxylamine (Rivilla et al. 2020) have been already detected. Rotational spectroscopic studies of potential glycine precursors hydantoin (Alonso et al. 2017; Ozeki et al. 2017) and hydantoic acid (Kolesniková et al. 2019) were reported recently. Sanz-Novo et al. (2019) further computed the spectroscopic properties of glycine isomers of which methyl carbamate (Marstokk & Møllendal 1999; Bakri et al. 2002; Ilyushin et al. 2006; Groner et al. 2007) and glycolamide (Maris 2004; Sanz-Novo et al. 2020) were studied by microwave and millimetre wave spectroscopies that enabled their searches in the ISM (Sanz-Novo et al. 2020; Sahu et al. 2020).
In this work we focus on glycine precursor glycinamide (NH2CH2C(O)NH2) which is predicted to be a feasible intermediate on the hydrolytic way from aminoacetonitrile to glycine (Zhu & Ho 2004; Ugliengo et al. 2011). Keeping in mind the presence of aminoacetonitrile in Sgr B2(N) (Belloche et al. 2008), glycinamide could be considered as a good candidate for observations in the same source. Millimetre wave surveys of high-mass star-forming regions are known to present a forest of lines with a high level of line blending (see e.g. Tercero et al. 2010; Belloche et al. 2013). For this reason, the identification of a new molecule, such as glycinamide, in these sources has to be guaranteed by the detection of numerous features consistent with confident predictions of its spectrum over a broad frequency region. High-quality laboratory data and analysis are thus the first and mandatory step before any interstellar search can be conducted.
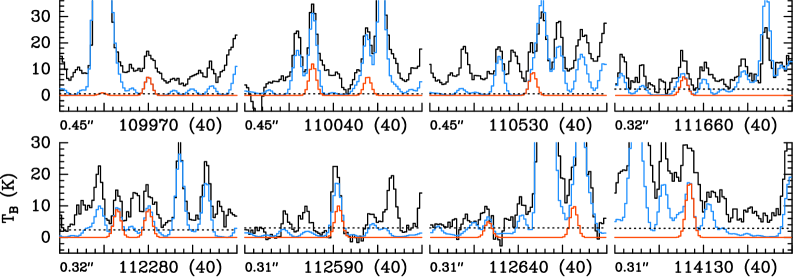
It was only recently that the rotational spectrum of glycinamide was first studied. Alonso et al. (2018) investigated its conformational landscape in supersonic expansion by Fourier transform microwave spectroscopy between 6 GHz and 16 GHz. The analysis of the spectrum revealed the existence of a single conformer whose configuration in the principal axis frame is shown in Fig. 1. In addition to this, an unexpected non-rigid behavior of this conformer has been implied by abnormal values of quartic centrifugal distortion constants. Such a behavior has been attributed to a large-amplitude motion that combines C–N bond torsion, C-C torsion, and NH2 inversion. Since this motion is governed by tunneling through the central barrier in a double minimum potential function, rotational transitions in the ground vibrational state are expected to be split into two components associated with two torsion/inversion sublevels, usually labeled and . However, due to vibrational cooling accompanying supersonic expansion, only the transitions in the lowest-lying substate were observed by Alonso et al. (2018). For interpreting the dense millimetre wave surveys from interstellar sources, the rotational transitions not only in this substate but also in the yet experimentally unobserved substate might be of critical importance. Furthermore, severe perturbations resulting from the coupling of the rotational manifolds might be manifested for higher and transitions in the millimetre wave region. This situation is actually the case for cyanamide (Read et al. 1986; Kraśnicki et al. 2011; Kisiel et al. 2013; Coutens et al. 2019) in which the large-amplitude motion involves the inversion of the NH2 group. The rotational transitions of cyanamide in the and substates could be detected towards solar-type protostars (Coutens et al. 2018) only after a successful laboratory analysis accounting for the interactions (Read et al. 1986; Kraśnicki et al. 2011; Kisiel et al. 2013). From this it turns out that common difficulties arising from extrapolations to higher frequencies are not the only problems faced by attempts to detect glycinamide in space.
In the course of the present work, the laboratory rotational spectrum of glycinamide has been measured between 90 GHz and 329 GHz. A comprehensive analysis of this millimetre wave spectrum made it possible to unambiguously assign the rotational transitions in the four lowest torsional/inversion substates , , and . In addition, rotational transitions in and substates for state were assigned and measured. Results of this work deliver first experimental information on the double minimum potential of glycinamide and provide a firm basis for its searches in space.
Section 2 describes the laboratory experiments performed to measure the rotational spectrum of glycinamide. The analysis of the laboratory spectra is presented in Section 3 and the search for glycinamide toward the hot molecular core Sgr B2(N1) with the Atacama Large Millimetre/submillimetre Array (ALMA) is reported in Section 4. Section 5 discusses the spectroscopic and astronomical results, and Section 6 summarises our conclusions.
2 Experiments
Pure glycinamide has the form of colourless crystals with a melting point of 63∘C. A vapour pressure of 5-10 mTorr that was sufficient for measurements was generated when the sample was heated to 50∘C, and signal stability was ensured by using a slow flow through the 3-metre free space absorption cell of the spectrometer. In the previous rotational spectroscopy study (Alonso et al. 2018) glycinamide was produced by laser ablation of a specially prepared hydrochloride glycinamide rod, while presently we used pure glycinamide. This was prepared from glycinamide hydrochloride, as purchased from Aldrich and used without further purification. Glycinamide hydrochloride (5.5 g, 50 mmol) and dry dichloromethane (100 mL) were introduced under nitrogen into a 250 ml three-necked flask. Dry ammonia was then bubbled through the stirred suspension for 30 min. The salt was filtered off and the solvent was removed under vacuum on a rotary evaporator and then on a vacuum pump (0.1 mbar, 2 h). Glycinamide (2.5 g, 34 mmol, 68% yield) was thus obtained. It showed long term stability when stored in the freezer (-20∘C) and there was also no discernible decomposition when heated for measurements.
Spectroscopic measurements were made in the region 90329 GHz with the broadband backward wave oscillator (BWO) based spectrometer in Warsaw, which was described in Medvedev et al. (2004). The hardware configuration was later updated and augmented below 140 GHz with a harmonic generation source (Kisiel & Kraśnicki 2010). A frequency measurement accuracy of 50 kHz was assumed.
3 Rotational spectra and analysis
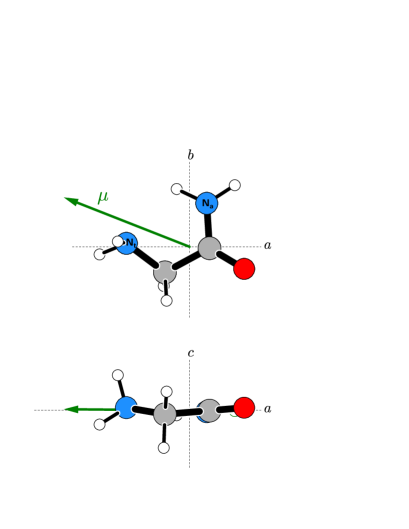
The mm-wave rotational spectrum of glycinamide posed a significant assignment challenge, which can be partly appreciated from the example shown in Fig. 2. This is a rather asymmetric molecule (asymmetry parameter ), expected to give rise to strong pure rotation -type transitions accompanied by weaker -type transitions (calculated dipole moment components are =3.8 D and =1.5 D, Alonso et al. 2018). There is, however, a significant lack of characteristic line patterns that normally aid assignment. The most useful starting point was provided by the fact that the strongest lines in the spectrum would be quadruply degenerate by resulting from overlaps of pairs of -type and -type -branch transitions for the lowest values of . Unfortunately such lines quickly proved to be poorly treatable with a single state Watson’s asymmetric rotor Hamiltonian (Watson 1977). On the other hand, several sequences of such strong lines were identified with the use of the AABS graphical assignment package (Kisiel et al. 2005, 2012). Initial rotational constants, reported by Kisiel et al. (2010), were confirmed by measurement of the lowest- ground state transitions in supersonic expansion (Alonso et al. 2018).
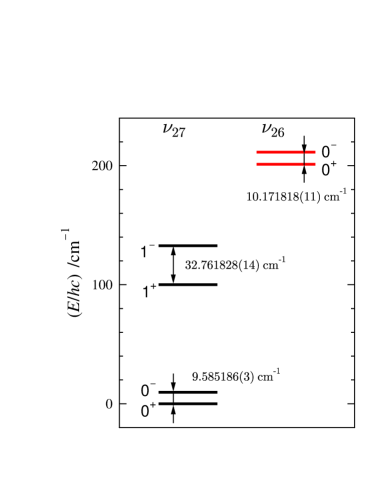
Complete assignment and analysis of the mm-wave spectrum became possible once it was realised that the observed sets of transitions belonged to coupled pairs of vibrational sublevels. As already mentioned, such pairs of levels typically arise through tunneling between two symmetry equivalent structures of the molecule that are separated by a relatively low energy barrier. Two clear boundary conditions are possible, where tunneling is equivalent to a torsional motion (as in phenol, Kolesniková et al. 2013), or to inversion (as in cyanamide, Kisiel et al. 2013). For glycinamide computations indicated that tunneling between the most stable conformation depicted in Fig. 1 and its mirror image form obtained by reflection across the inertial plane is subject to a barrier of only 100 cm-1 (Alonso et al. 2018) and that such tunneling has to involve a concerted combination of torsion and inversion. The molecule belongs to the lowest symmetry point group, , and the general labeling used for vibrational levels split by double minimum inversion has been adopted (see Fig. 25.2 of Papoušek & Aliev 1982). Accordingly, the vibrational ground state, normally labeled , splits into a pair of sublevels designated 0+ (lower) and 0- (upper). Similarly, the usual first excited state, , of the inversion motion, becomes a doublet labeled (lower) and (upper). This splitting structure is expected to be relatively unaffected by excitation of non-inverting vibrational motions. Accordingly, the first excited state of such a motion, for example labeled , will be split by an amount comparable to that in the ground state, with labeling (lower) and (upper). Quantum chemistry vibrational calculations at both harmonic (Li et al. 2003) and anharmonic (Alonso et al. 2018) levels indicated, in agreement, that glycinamide has two low frequency vibrational modes and with vibrational frequencies of near 100 and 200 cm-1, respectively. Nevertheless, unambiguous attribution as to which of these modes is responsible for the tunneling only became possible on completion of the rotational analysis, as discussed below.
The most effective treatment of pairs of vibrational substates resulting from tunneling is to use a (22) block diagonal Hamiltonian of the form:
| (4) |
| ground state | ||||||
|---|---|---|---|---|---|---|
| Parameter | ||||||
| /MHz | ||||||
| /MHz | ||||||
| /MHz | ||||||
| /kHz | ||||||
| /kHz | ||||||
| /kHz | ||||||
| /kHz | ||||||
| /kHz | ||||||
| /Hz | ||||||
| /Hz | ||||||
| /Hz | ||||||
| /Hz | ||||||
| /Hz | ||||||
| /Hz | ||||||
| /Hz | ||||||
| /MHz | ||||||
| /cm-1 | ||||||
| /MHz | ||||||
| /kHz | ||||||
| /kHz | ||||||
| /Hz | ||||||
| /Hz | ||||||
| /Hz | ||||||
| /MHz | ||||||
| /kHz | ||||||
| /kHz | ||||||
| /Hz | ||||||
| /Hz | ||||||
| /Hz | ||||||
| /kHz | ||||||
Notes.
(a), , and are rotational constants, are centrifugal distortion constants in Watson’s -reduced
asymmetric rotor Hamiltonian, is the fitted energy difference between the two levels of the tunneling doublet,
and are leading substate coupling terms in the RAS Hamiltonian, and the related superscripted versions are
parameters in their empirical centrifugal distortion expansions.
(b)Errors in parentheses are standard errors in units of the last digit.
(c)Number of fitted lines.
(d)Standard deviation of the fit.
(e)Unitless (weighted) deviation of the fit.
The two diagonal blocks, and are set up with the standard asymmetric rotor Hamiltonian (Watson 1977) for each of the two substates. The two off-diagonal blocks, , connecting the two substates are set up with the Reduced Axis System (RAS) Hamiltonian (Pickett 1972). In the case where the tunneling motion is around an axis in the inertial plane, but at some angle to the principal axes, the RAS blocks are:
| (5) | |||||
where and are the main adjustable parameters describing the interaction, each of which is further expanded empirically using centrifugal distortion type terms , , etc. Finally, is the vibrational energy difference between the two substates, . This approach was used, for example, for the singly deuterated species, HDNCN, of cyanamide (Kisiel et al. 2013). All fits and predictions were carried out with Pickett’s SPFIT/SPCAT package (Pickett 1991).
Assignment proceeded through analysis of -branch transition sequences for successively higher values of . Once these were understood for the ground state tunneling doublet, it was possible to also assign two vibrationally excited doublets. The success of the coupled state fit for each such pair of substates was critically dependent on the value of . In each case, the range of likely values had to be scanned with some care, prior to using it as an adjustable parameter of fit.
The final understanding of the spectrum is illustrated in the lower part of Fig. 2. It can be seen from the pairs of lowest transitions marked in the top of Fig. 2 that the frequency differences between the same rotational transitions in the substates are considerable, which reflects the relatively low barrier to the tunneling. Extensive relative intensity measurements allowed the energies above the ground state for the two excited vibrational states (energy differences between the lower substates) to be determined as 99(13) and 201(13) cm-1, which has been the initial basis for the and assignment marked in Fig. 2.
Spectroscopic constants resulting from the fits are summarised in Table 1 and a breakdown of statistics for individual substates is given in Table 5. Data for the substate also include hyperfine removed frequencies from supersonic expansion measurements reported in Alonso et al. (2018). For the two ground state substates some -branch transitions were also assigned and measured. In addition, nominal interstate transitions were observed. These result from strong mixing between perturbing rotational levels in two substates and are usually only identified in the final stages of the analysis.
For all of the identified substates, as well as for combined results for their pairs, it was possible to reproduce measured frequencies to within their assumed experimental accuracy of 50 kHz. The energy differences between the tunneling substates have been determined very precisely, to sub-MHz precision. When combined with results of relative intensity measurements these allow determination of the positions of lowest vibrational energy levels in glycinamide, as summarised in Fig. 3. We now have further evidence concerning the proposed vibrational assignment. Tunneling splitting is expected to increase significantly with vibrational excitation in a double minimum potential and can be successfully modeled with simple potentials, as described and carried out for cyanamide (Kisiel et al. 2013). The two splitting values in the column in Fig. 3 are consistent with a relatively low barrier so that this mode is responsible for the tunneling. On the other hand, the splitting in the tunneling pair is very close to that in the ground state, so that this appears to be a standard normal vibrational mode.
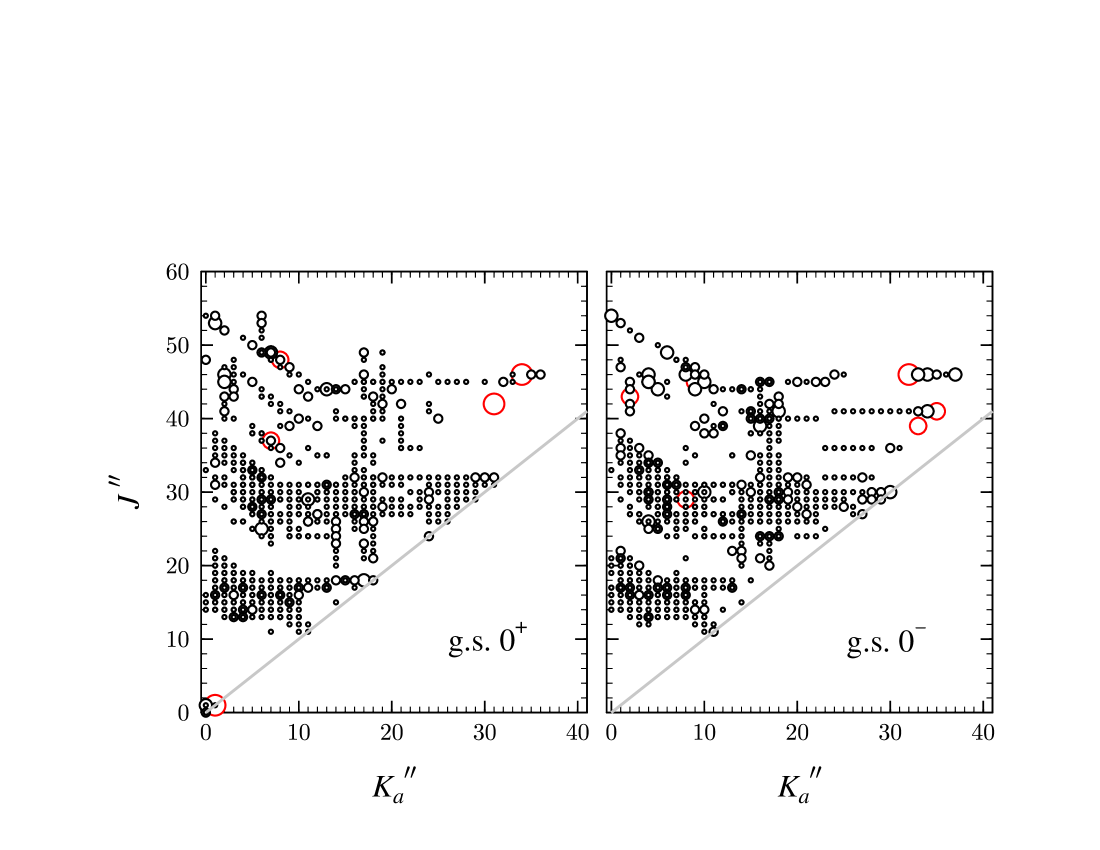
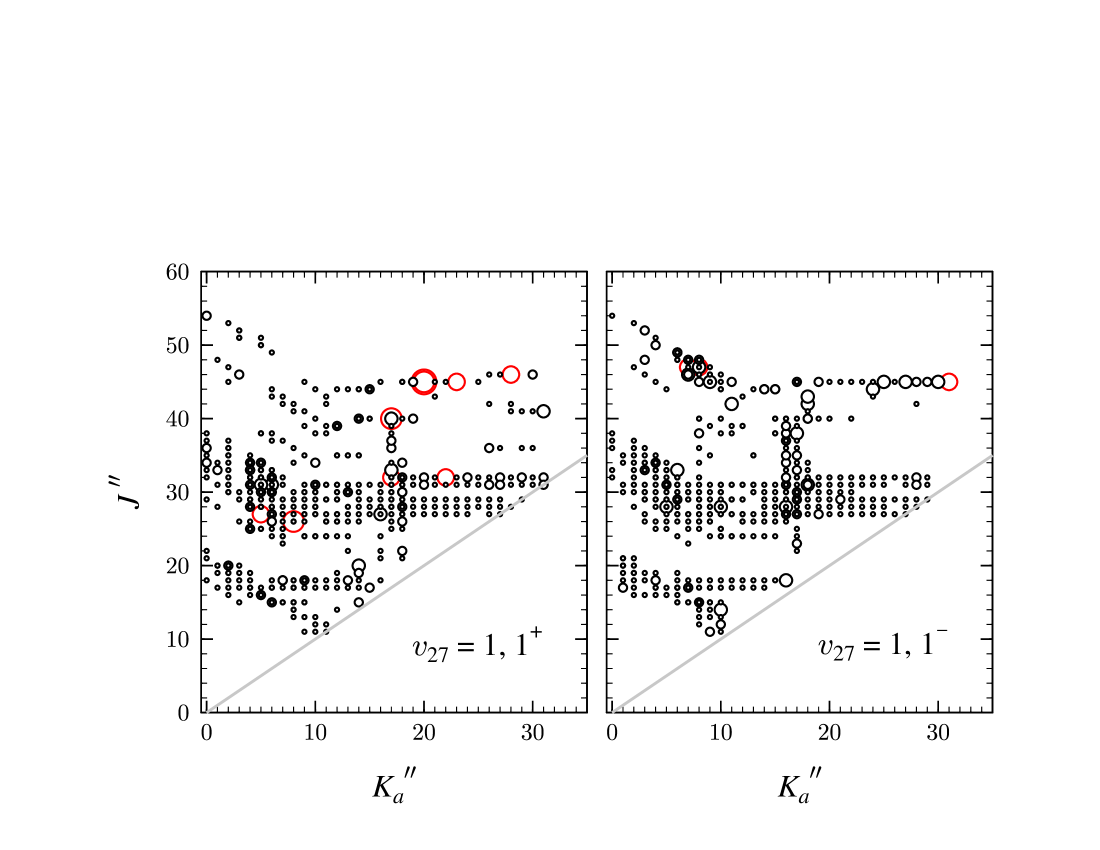
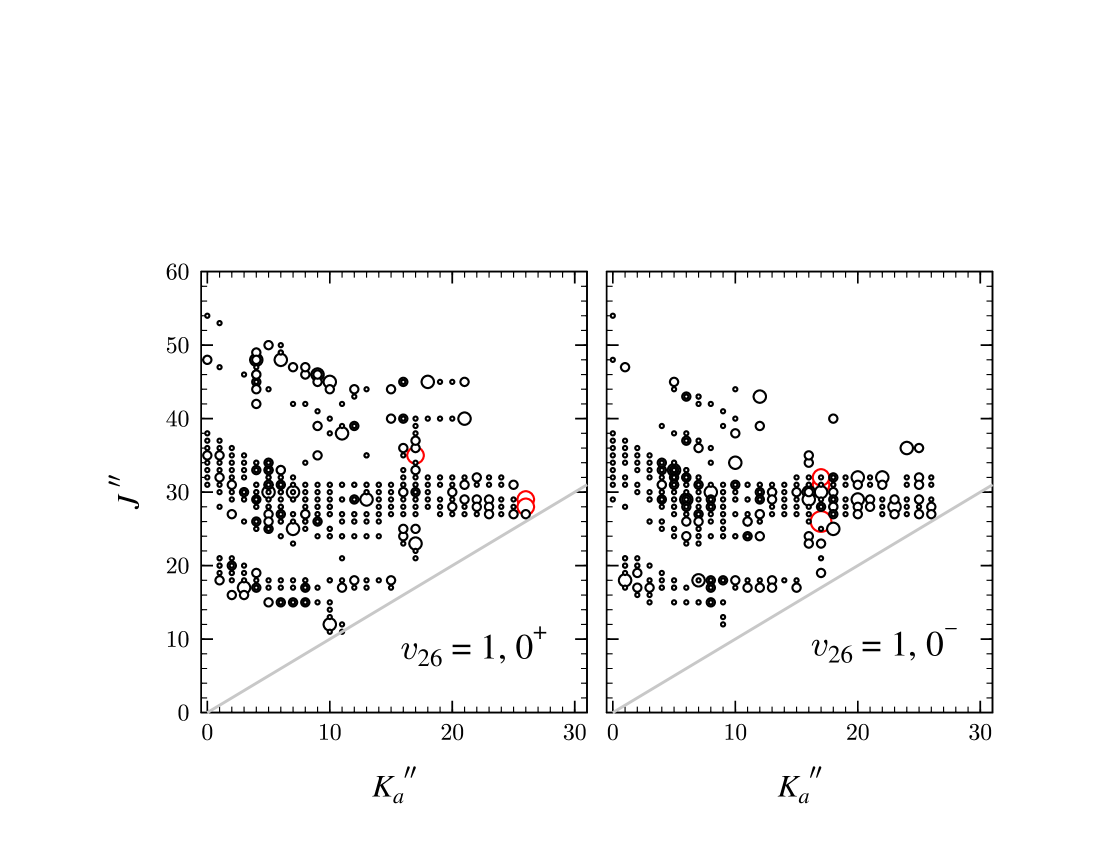
The coverage of values of rotational quantum numbers by the measured transitions is rather comprehensive and can be assessed from the data distribution plots for the three studied doublets given in Figs. 9 – 11. The values of quartic centrifugal distortion constants in the substates in each tunneling pair are generally quite close to each other, which shows that the coupling behaviour has been largely accounted for by the parameters in Eq. 5. Two significant exceptions are and for the upper substate of , suggesting that this substate may be interacting with some state outside the model, possibly of . The dominance in magnitude of the over the parameter is similar to that for HDNCN (Kisiel et al. 2013) and can accordingly be taken to be an indicator that the effective axis around which tunneling takes place is at a relatively small angle to the -inertial axis.
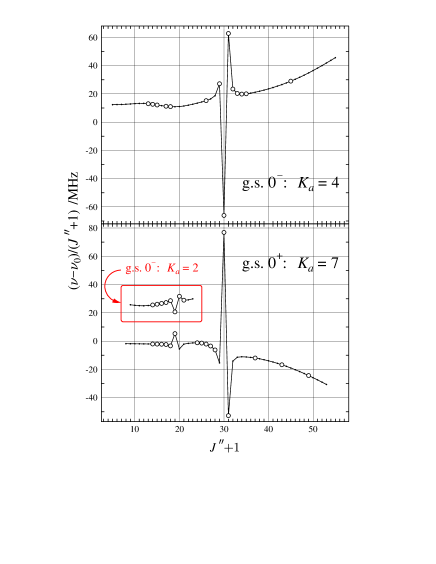
It is at this stage that the difficulties faced during the analysis and possible pitfalls in searching for a new molecule in space on the basis of incomplete fits can be appreciated. Figure 4 illustrates a typical effect of perturbations on rotational transition frequencies in the two substates. Perturbations are most efficiently followed in sequences of transitions for a given value of and an unperturbed situation is characterised by smooth, near horizontal trace behaviour in a scaled frequency difference plot as in Fig. 4. The sharp spikes are due to contributions from resonances between rotational levels in the two vibrational substates, that arise within a Hamiltonian matrix for a given value of the quantum number. A specific resonance between two rotational levels in perturbing substates will have the same magnitude but the opposite sign for the two partners. Mirror image behaviour, such as that seen in Fig. 4, confirms identification of the resonance partners and, if consistent with observed frequencies, is also indicative of the quality of the fit. It is notable that resonances can be of considerable magnitude (2.4 GHz for the maxima in this figure) and can also significantly affect transition frequencies for many values around the maximum. There are many such resonances in the data for the three pairs of substates, and even in Fig. 4 there is a second, smaller, resonance in the sequence for the substate that has its partner in the sequence for .
| /K | g.s.b | three pairsc | 412 cm-1 d |
|---|---|---|---|
| 300 | 160929 | 317605 | 544700 |
| 250 | 122291 | 225975 | 355078 |
| 200 | 87037 | 147233 | 207313 |
| 160 | 61777 | 95103 | 120650 |
| 150 | 55923 | 83734 | 103323 |
| 100 | 29786 | 37705 | 40729 |
| 75 | 18942 | 21739 | 22387 |
| 50 | 9901 | 10392 | 10444 |
| 25 | 3139 | 3147 | 3147 |
Notes.
(a)Evaluated numerically by counting all rotational states up to =100.
(b)Accounting for only the ground state , doublet.
(c)Accounting for the g.s., =1, and =1 tunneling doublets studied in this work.
(d)Accounting for 19 tunneling substates estimated to be present up to 412 cm-1 by adding predictions
from a double minimum model for the mode to vibrational energy levels for the , , and
normal modes, and assuming average ground state rotational constants for all vibrational states.
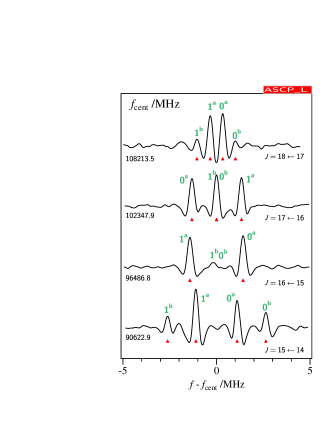
The perturbations not only affect transition frequencies, but can also significantly affect transition intensities, as visible in Fig. 5. Without perturbations the intensity pattern for the displayed quartet of lines is expected to be as in the bottom or top traces. In the present case, both the intensity pattern and quantum number labeling of the lines in the two middle plots are significantly affected.

Finally the number of low lying vibrational states has a significant effect on the value of the vibration-rotation partition function that is of relevance to column density evaluations. The vibrational effect for glycinamide is documented in Table 2. It is seen that at the lowest temperatures the often used ground state partition function is quite satisfactory. Yet at 200 K, for example, the partition function correction arising from the presence of also the =1 and =1 doublets is 1.7. Glycinamide also has two other relatively low frequency modes ( and calculated at 303 and 384 cm-1 resp., Li et al. 2003). Combination of those modes with present information on and estimates the need to account for populating a total of 19 sublevels up to 412 cm-1 corresponding to a partition function correction of 2.4 at 200 K.
4 Search for glycinamide toward Sgr B2(N1)
4.1 Observations
We used the imaging spectral line survey ReMoCA (Re-exploring Molecular Complexity with ALMA) performed with ALMA toward Sgr B2(N). The observational setup and the method used to reduce this interferometric data set were described in Belloche et al. (2019). We summarise only the main features here. The field of view of the observations was centered between Sgr B2(N1) and Sgr B2(N2), the two main hot molecular cores of Sgr B2(N), which are separated by 4.9 or 0.2 pc in projection onto the plane of the sky. The equatorial coordinates of this phase center are ()J2000= (). The survey has an angular resolution (HPBW) that varies between 0.3 and 0.8. The median angular resolution is 0.6 and corresponds to 4900 au at the distance of Sgr B2 (8.2 kpc, Reid et al. 2019). Five frequency tunings of the receivers, which we call setups S1 to S5, were used to cover the frequency range from 84.1 GHz to 114.4 GHz at a spectral resolution of 488 kHz (1.7 to 1.3 km s-1). The observations achieved a sensitivity per spectral channel between 0.35 mJy beam-1 and 1.1 mJy beam-1 (rms) depending on the setup, with a median sensitivity of 0.8 mJy beam-1.
Following Belloche et al. (2019) we selected the offset position Sgr B2(N1S) located at ()J2000= (, ) for this study. This position is about 1 to the south of the main hot core Sgr B2(N1). Its continuum emission has a lower opacity than the peak of the hot core, which allows for a deeper look into the molecular content of this source. We used here an improved version of the data reduction, as reported in Melosso et al. (2020).
We employed the software Weeds (Maret et al. 2011) to produce synthetic spectra under the assumption of local thermodynamic equilibrium (LTE). This assumption is appropriate for Sgr B2(N1S) because the regions where hot-core emission is detected in Sgr B2(N) have high densities ( cm-3, see Bonfand, M. et al. 2019). A best-fit synthetic spectrum was derived for each molecule separately, and then the contributions of all identified molecules were added together. Each species was modeled with a set of five parameters: size of the emitting region (), column density (), temperature (), linewidth (), and velocity offset () with respect to the assumed systemic velocity of the source, km s-1.
| Molecule | Statusa𝑎aa𝑎ad: detection, n: nondetection. | b𝑏bb𝑏bNumber of detected lines (conservative estimate, see Sect. 3 of Belloche et al. 2016). One line of a given species may mean a group of transitions of that species that are blended together. | c𝑐cc𝑐cSource diameter (FWHM). | d𝑑dd𝑑dRotational temperature. | e𝑒ee𝑒eTotal column density of the molecule. () means . | f𝑓ff𝑓fCorrection factor that was applied to the column density to account for the contribution of vibrationally excited states, in the cases where this contribution was not included in the partition function of the spectroscopic predictions. | g𝑔gg𝑔gLinewidth (FWHM). | hℎhhℎhVelocity offset with respect to the assumed systemic velocity of Sgr B2(N1S), km s-1. |
|---|---|---|---|---|---|---|---|---|
| (′′) | (K) | (cm-2) | (km s-1) | (km s-1) | ||||
| NH2CN | d | 3 | 2.0 | 160 | 2.6 (16) | 1.03 | 5.5 | -0.3 |
| NH2CH2CNi𝑖ii𝑖iThe parameters were derived from the ReMoCA survey by Melosso et al. (2020). | d | 23 | 2.0 | 200 | 1.1 (17) | 1.00 | 5.0 | 0.0 |
| NH2CHOj𝑗jj𝑗jThe parameters were derived from the ReMoCA survey by Belloche et al. (2019). | d | 34 | 2.0 | 160 | 2.9 (18) | 1.09 | 6.0 | 0.0 |
| NH2CH3 | d | 15 | 2.0 | 230 | 1.4 (18) | 1.25 | 5.0 | 0.0 |
| NH2C(O)NH2j𝑗jj𝑗jThe parameters were derived from the ReMoCA survey by Belloche et al. (2019). | d | 9 | 2.0 | 160 | 2.7 (16) | 1.86 | 5.0 | 0.0 |
| NH2CH2C(O)NH2 | n | 0 | 2.0 | 160 | 1.5 (16) | 1.27 | 5.0 | 0.0 |
4.2 Nondetection of glycinamide
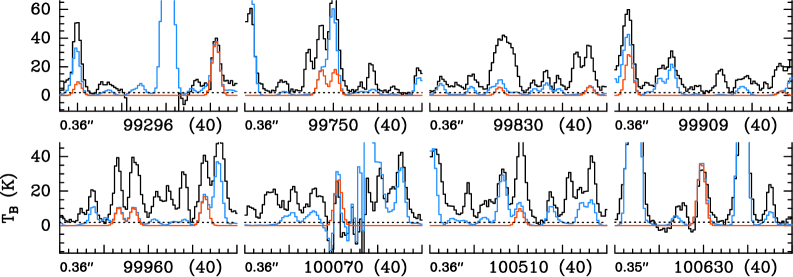
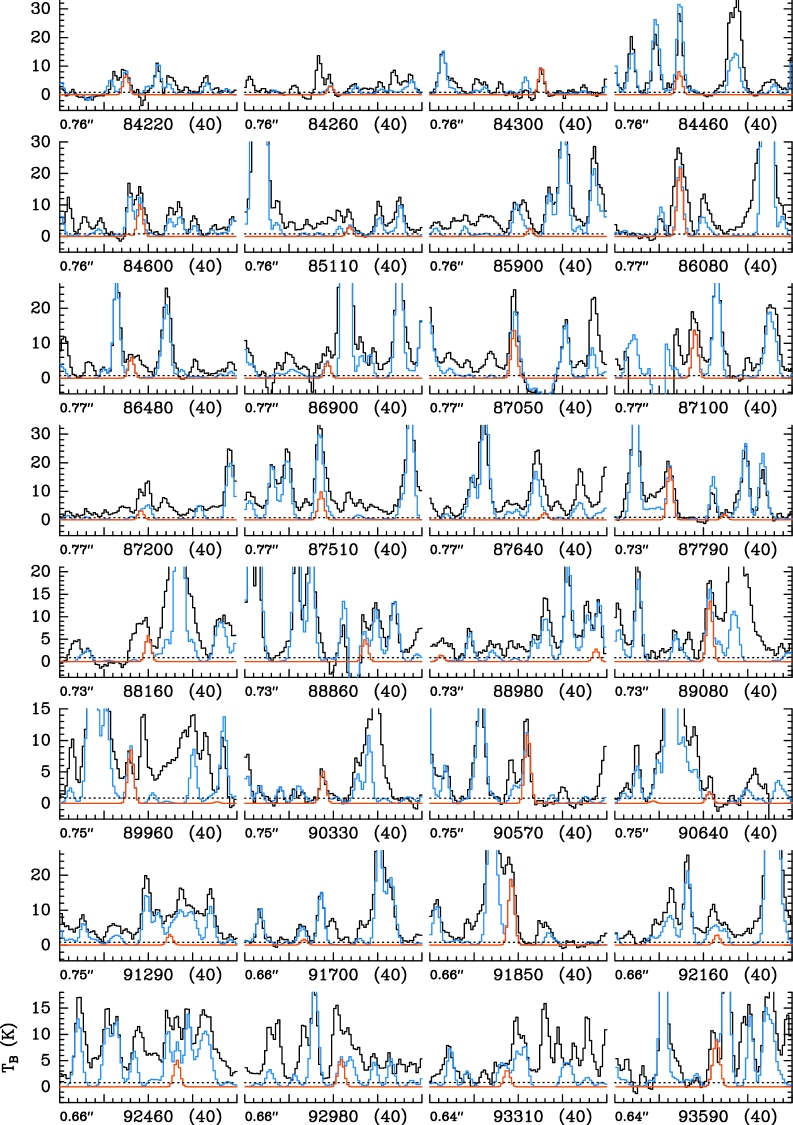
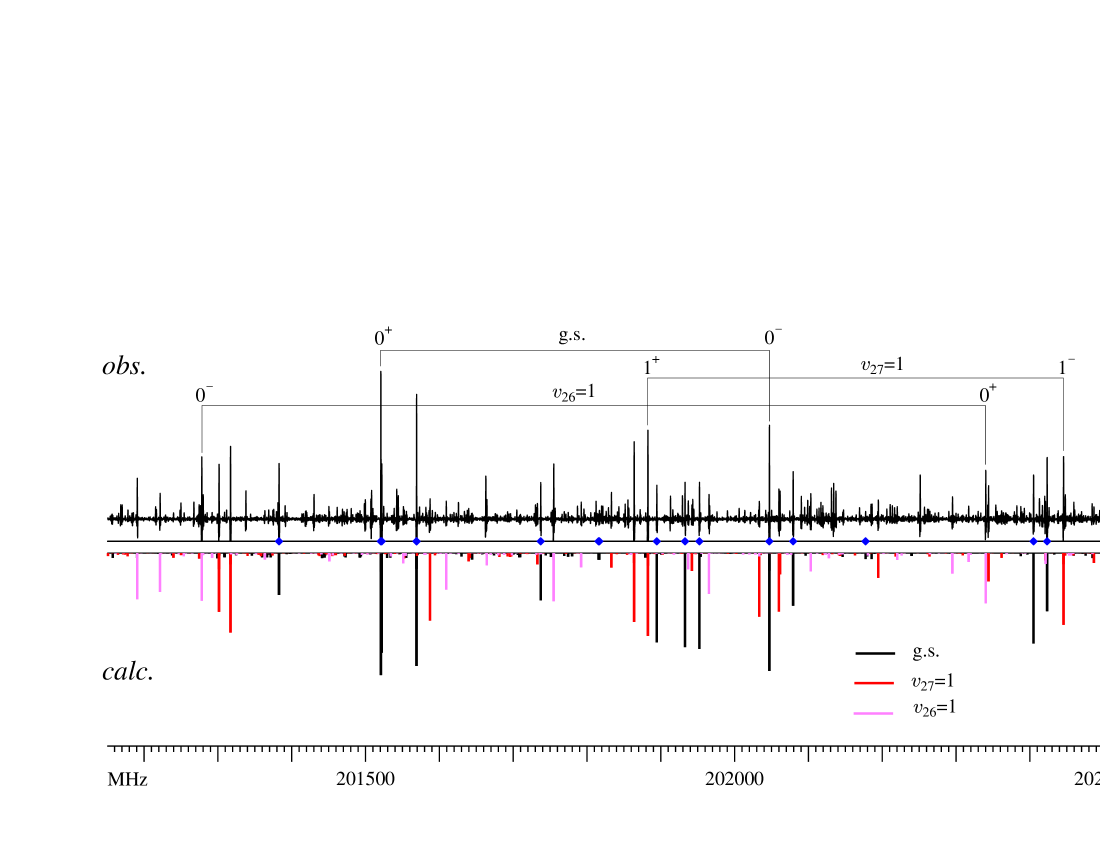
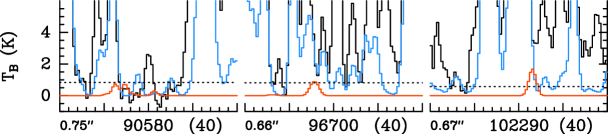
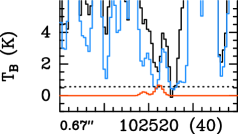
We assumed a rotational temperature of 160 K, as derived for formamide, NH2CHO, by Belloche et al. (2019), an emission size of 2, and an FWHM linewidth of 5 km s-1 to compute LTE synthetic spectra of glycinamide and search for rotational emission of this molecule toward Sgr B2(N1S). We found no evidence for emission of glycinamide toward this source. This nondetection is illustrated in Fig. 6. We also searched for rotational emission from within its vibrationally excited states and but did not detect any clear sign of it (see Figs. 7 and 8, respectively). The upper limit that we obtain for the column density of glycinamide is indicated in Table 3 along with the parameters derived by Belloche et al. (2019) for urea, NH2C(O)NH2, and formamide, NH2CHO, and by Melosso et al. (2020) for aminoacetonitrile, NH2CH2CN.
The amides NH2CH2C(O)NH2 and NH2C(O)NH2 could be seen as the partially hydrolyzed counterparts of the nitriles NH2CH2CN and NH2CN, respectively. It may thus be instructive to compare the relative abundances of these two pairs of molecules. With this in mind, we modeled the emission spectrum of cyanamide (aminomethanenitrile, NH2CN) toward Sgr B2(N1S). The cyanamide spectroscopic information was taken from the JPL catalog (Pickett et al. 1998). This JPL entry (TAG 42003 version 1) is based mostly on microwave data from Read et al. (1986) along with far-infrared data from Birk et al. (1993). A few transitions of cyanamide are clearly detected (see Fig. 12), but unfortunately not enough to derive its rotational temperature from a population diagram. Therefore, we also assumed a temperature of 160 K to compute its column density, which is given in Table 3. The cyanamide line around 100.070 GHz is contaminated by absorption from HC3N =11–10, which is not accurately accounted for by our current complete model of Sgr B2(N1S).
| Molecule | Statesa𝑎aa𝑎aVibrational states that were taken into account to fit the population diagram. | b𝑏bb𝑏bThe standard deviation of the fit is given in parentheses. As explained in Sect. 3 of Belloche et al. (2016) and in Sect. 4.4 of Belloche et al. (2019), this uncertainty is purely statistical and should be viewed with caution. It may be underestimated. |
| (K) | ||
| NH2CH3 | 223.0 (5.9) |
Radicals derived from methylamine, NH2CH3, may be involved in the formation of glycinamide. Therefore, we also report in Table 3 the parameters we derived by modelling the emission spectrum of this molecule. The methylamine spectroscopic information was taken from the JPL catalog. This catalog entry (TAG 31008 version 1) is based on the combined fit by Ilyushin et al. (2005) with data in the range of our survey mostly from that work. A dozen transitions of NH2CH3 are clearly detected toward Sgr B2(N1S), as shown in Fig. 13. There are enough transitions to build a population diagram, which is displayed in Fig. 14. We assumed a temperature of 230 K for the LTE modelling of the spectrum of NH2CH3 shown in Fig. 13, slightly higher than the formal result of the fit to the population diagram (see Table 4), but within the uncertainties.
The vibrational correction factor reported in Table 3 for glycinamide corresponds to the ratio of the values given in columns 4 and 3 of Table 2. This is because the partition function of the spectroscopic predictions used for the astronomical search included only the vibrational contribution given in column 3 of that table. In proceeding like this, we neglect the contribution of vibrational levels above 412 cm-1, which is likely below a further 10% at a temperature of 160 K.
5 Discussion
5.1 Laboratory spectroscopy of glycinamide
The present experimental investigation of the rotational spectrum covers the most useful ALMA bands for a molecule of this size. Many resonances between rotational levels in the three studied tunneling doublets have been satisfactorily fitted, allowing reliable predictions, at least when these are interpolations within the acquired data sets. At the laboratory measurement temperature of 50∘C the strongest observed lines have all been accounted for, providing a comprehensive basis for any future searches, especially at the typically significantly lower interstellar temperatures. Clearly many more outstanding lines from higher vibrational states remain to be assigned and measured in the experimental spectrum, but their analysis is expected to be even more challenging than that reported presently.
5.2 Comparison of glycinamide to related molecules in Sgr B2(N)
The nondetection of glycinamide, NH2CH2C(O)NH2, toward Sgr B2(N1S) reported in Table 3 implies that it is at least 1.8 times less abundant than urea, NH2C(O)NH2, which is markedly different from the pair of nitriles NH2CH2CN/NH2CN for which the longer molecule is a factor four more abundant than the shorter one. Said differently, NH2C(O)NH2, the partially hydrolyzed counterpart of NH2CN, has the same abundance as the latter, while NH2CH2C(O)NH2, the partially hydrolyzed counterpart of NH2CH2CN, is at least seven times less abundant than the latter. The analysis reported in Sect. 4 also shows that glycinamide is at least two orders of magnitude less abudant than its potential precursors formamide and methylamine.
5.3 Glycinamide chemistry
Glycinamide is not presently included in any astrochemical models, but the results of recent chemical simulations of hot cores may nevertheless be informative. Garrod (2013) constructed a chemical network for glycine (NH2CH2COOH), which included the related species glycinal (NH2CH2CHO). These species could be formed on interstellar dust grains through the addition of radicals produced mainly by photodissocation of simpler solid-phase molecules, driven by the enhanced surface mobility of the radicals, as the result of grain heating induced by the star-formation process. Complex organic molecules including glycine and glycinal would later sublimate entirely from the dust grains. The chemical network included mechanisms for those molecules to be subsequently destroyed in the gas phase through ion-molecule reactions.
The more recent models by Garrod et al. (2021), which incorporate the same glycine-related chemistry, allow a broader range of grain-surface and bulk-ice kinetic processes to bring together reactive radicals and thus form complex organics. This includes the possibility of radicals reacting nondiffusively on dust-grain surfaces at very low temperatures, when the icy grain mantles are still gradually building up. In this scenario, the radicals themselves need only be formed close to each other, allowing their reactions to proceed unmediated by thermal diffusion. Furthermore, the initially translucent conditions under which the dust-grain ices build up may allow some degree of UV photoprocessing of the young ices by the ambient interstellar UV field, converting a small fraction of simple solid-phase molecules into more complex organics. The Garrod et al. models indicate that a substantial fraction of glycine production may occur at this very early stage, with glycinal acting as a precursor. Although it is not included in those models, glycinamide could plausibly be produced through a similar mechanism; i.e., the photodissociation of solid-phase glycinal to produce the radical NH2CH2CO, with which NH2 would react to form NH2CH2CONH2.
If such a mechanism is active in producing solid-phase glycinamide, then the observed ratio of formamide to urea might be somewhat indicative of the expected ratio of glycinal to glycinamide, which share similar molecular structures. Toward Sgr B2(N1S), the former ratio is approximately 100. Although glycinal is thus far undetected in the interstellar medium, its search being hindered by a lack of spectroscopic predictions, the model of Garrod et al. (2021) suggests that its peak gas phase abundance should be around a factor 100 less than that of formamide. On this basis, one might therefore expect an abundance of glycinamide around 104 times lower than formamide, or 100 times lower than urea. However, it is plausible that the efficiency of the conversion of glycinal to glycinamide on the grains could be greater than the above crude comparison might suggest; in the models, glycine itself reaches a peak gas-phase abundance as great as around half that of glycinal, implying substantial conversion. This corresponds to an abundance approximately 40 times lower than that of urea produced by the model. If we were to take this abundance of glycine as the maximum possible allowed abundance for glycinamide, which assumes that glycine and glycinamide would be produced in equal amounts from glycinal, then the implied 40:1 ratio of urea to glycinamide would produce a glycinamide column density around 20 times lower than the observed upper limit. Even efficient conversion from glycinal would therefore still produce a rather smaller amount of glycinamide than might plausibly be detectable at this time.
The above production mechanism is, however, not the only possible means by which glycinamide could form through radical addition; alternatives would include the reaction of the acetamide-related radical NH2COCH2 with NH2, or the addition of NH2CH2 to NH2CO. The latter pair of radicals can be formed through cosmic ray-induced UV photodissociation of, or chemical H-atom abstraction from, solid-phase NH2CH3 and NH2CHO, both of which are detected toward Sgr B2(N1S) in the gas phase. A similar reaction between radicals NH2CH2 and COOH indeed produces a substantial quantity of glycine in the models; this process occurs much later, at around the time when water itself is beginning to desorb rapidly from the grains, releasing trapped radicals onto the surface of the warm ice, where they may react diffusively. The sizeable abundances of NH2CH3 and NH2CHO detected toward Sgr B2(N1S) suggest this could be a plausible pathway for glycinamide production.
The above reaction mechanisms nevertheless remain entirely conjectural, at least until they have been tested explicitly in the astrochemical models. The closure of the existing chemical network surrounding glycine, to incorporate glycinamide, seems a plausible goal for future investigation.
6 Conclusions
A comprehensive laboratory rotational study of glycinamide, a potential glycine precursor, has been undertaken up to 329 GHz. In total, over 2800 transition lines were assigned and measured for the ground state and two lowest-lying excited state tunneling doublets. Newly derived spectroscopic constants were used to search for spectral signatures of glycinamide in Sgr B2(N) by millimetre-wave astronomy. Lists of experimental frequencies and their obs.-calc. differences are provided in Tables 5, 6, and 7, only available in electronic form.
Glycinamide was not detected toward the hot molecular core Sgr B2(N1S) with ALMA. The upper limit derived for its column density implies that it is at least seven times less abundant than aminoacetonitrile and 1.8 times less abundant than urea toward this source.
While glycinamide has not yet been considered in any astrochemical kinetics models, comparison with model results for related species suggest that it may be a factor of 40 to 100 times less abundant than urea, corresponding to a value a factor of 20 to 50 below the upper limit toward Sgr B2(N1S). This would likely be well below the spectral confusion limit of the ReMoCA survey of Sgr B2(N). Further progress in the search for glycinamide in the interstellar medium could be made by targetting sources with a lower level of spectral confusion. The Galactic Center source G+0.693-0.027, a shocked region close to Sgr B2(N) with a rich chemical content characterized by low excitation temperatures, should be a promising target to continue the search for interstellar glycinamide.
Acknowledgements.
This paper makes use of the following ALMA data: ADS/JAO.ALMA#2016.1.00074.S. ALMA is a partnership of ESO (representing its member states), NSF (USA), and NINS (Japan), together with NRC (Canada), NSC and ASIAA (Taiwan), and KASI (Republic of Korea), in cooperation with the Republic of Chile. The Joint ALMA Observatory is operated by ESO, AUI/NRAO, and NAOJ. The interferometric data are available in the ALMA archive at https://almascience.eso.org/aq/. Part of this work has been carried out within the Collaborative Research Centre 956, sub-project B3, funded by the Deutsche Forschungsgemeinschaft (DFG) – project ID 184018867. JCG thanks the National Center for Space Studies (CNES), National Program “Physics and Chemistry of the Interstellar Medium” (PCMI) from CNRS / INSU, and PHC Polonium 14277ZC for financial support. LK and Valladolid authors acknowledge funding from the Ministerio de Ciencia e Innovación (grants PID2019-111396GB-I00, CTQ2016-76393-P), Junta de Castilla y León (grants VA244P20, VA077U16), and European Research Council under the European Union’s Seventh Framework Programme ERC-2013- SyG, Grant Agreement n. 610256 NANOCOSMOS. RTG acknowledges support from the National Science Foundation (grant No. AST 19-06489). ZK and EBJ also acknowledge the use of computational resources under the grant G61-6 from the Interdisciplinary Center of Mathematical and Computer Modelling (ICM) of Warsaw University.References
- Alonso et al. (2017) Alonso, E. R., Kolesniková, L., & Alonso, J. L. 2017, J. Chem. Phys., 147, 124312
- Alonso et al. (2018) Alonso, E. R., Kolesniková, L., Białkowska-Jaworska, E., et al. 2018, ApJ, 861, 70
- Altwegg et al. (2016) Altwegg, K., Balsiger, H., Bar-Nun, A., et al. 2016, Science Advances, 2
- Aponte et al. (2017) Aponte, J. C., Elsila, J. E., Glavin, D. P., et al. 2017, ACS Earth and Space Chemistry, 1, 3
- Bakri et al. (2002) Bakri, B., Demaison, J., Kleiner, I., et al. 2002, J. Mol. Spectrosc., 215, 312
- Barrientos et al. (2012) Barrientos, C., Redondo, P., Largo, L., Rayón, V. M., & Largo, A. 2012, ApJ, 748, 99
- Basiuk (2001) Basiuk, V. A. 2001, J. Phys. Chem. A, 105, 4252
- Belloche et al. (2019) Belloche, A., Garrod, R. T., Müller, H. S. P., et al. 2019, A&A, 628, A10
- Belloche et al. (2008) Belloche, A., Menten, K. M., Comito, C., et al. 2008, A&A, 482, 179
- Belloche et al. (2016) Belloche, A., Müller, H. S. P., Garrod, R. T., & Menten, K. M. 2016, A&A, 587, A91
- Belloche et al. (2013) Belloche, A., Müller, H. S. P., Menten, K. M., Schilke, P., & Comito, C. 2013, A&A, 559, A47
- Bernstein et al. (2002) Bernstein, M. P., Dworkin, J. P., Sandford, S. A., Cooper, G. W., & Allamandola, L. J. 2002, Nature, 416, 401
- Berulis et al. (1985) Berulis, I. I., Winnewisser, G., Krasnov, V. V., & Sorochenko, R. L. 1985, Soviet Astron. Lett., 11, 251
- Birk et al. (1993) Birk, M., Winnewisser, M., & Cohen, E. A. 1993, J. Mol. Spectrosc., 159, 69
- Blagojevic et al. (2003) Blagojevic, V., Petrie, S., & Bohme, D. K. 2003, MNRAS, 339, L7
- Bonfand, M. et al. (2019) Bonfand, M., Belloche, A., Garrod, R. T., et al. 2019, A&A, 628, A27
- Brown et al. (1979) Brown, R. D., Godfrey, P. D., Storey, J. W. V., et al. 1979, MNRAS, 186, 5P
- Caro et al. (2002) Caro, G. M., Meierhenrich, U., Schutte, W., et al. 2002, Nature, 416, 403
- Ceccarelli et al. (2000) Ceccarelli, C., Loinard, L., Castets, A., Faure, A., & Lefloch, B. 2000, A&A, 362, 1122
- Combes et al. (1996) Combes, F., Q-Rieu, N., & Wlodarczak, G. 1996, A&A, 308, 618
- Coutens et al. (2018) Coutens, A., Willis, E. R., Garrod, R. T., et al. 2018, A&A, 612, A107
- Coutens et al. (2019) Coutens, A., Zakharenko, O., Lewen, F., et al. 2019, A&A, 623, A93
- Cunningham et al. (2007) Cunningham, M. R., Jones, P. A., Godfrey, P. D., et al. 2007, MNRAS, 376, 1201
- Ehrenfreund et al. (2001a) Ehrenfreund, P., Bernstein, M. P., Dworkin, J. P., Sandford, S. A., & Allamandola, L. J. 2001a, ApJ, 550, L95
- Ehrenfreund et al. (2001b) Ehrenfreund, P., Glavin, D. P., Botta, O., Cooper, G., & Bada, J. L. 2001b, PNAS, 98, 2138
- Elsila et al. (2009) Elsila, J. E., Glavin, D. P., & Dworkin, J. P. 2009, Meteoritics & Planetary Science, 44, 1323
- Garrod (2013) Garrod, R. T. 2013, ApJ, 765, 60
- Garrod et al. (2021) Garrod, R. T., Jin, M., Matis, K., et al. 2021, submitted to ApJ
- Glavin et al. (2006) Glavin, D. P., Dworkin, J. P., Aubrey, A., et al. 2006, Meteoritics and Planetary Science, 41, 889
- Groner et al. (2007) Groner, P., Winnewisser, M., Medvedev, I. R., et al. 2007, ApJS, 169, 28
- Guélin & Cernicharo (1989) Guélin, M. & Cernicharo, J. 1989, in The Physics and Chemistry of Interstellar Molecular Clouds: mm and Sub-mm Observations in Astrophysics (Berlin, Heidelberg: Springer Berlin Heidelberg), 337–343
- Hollis et al. (2003) Hollis, J. M., Pedelty, J. A., Snyder, L. E., et al. 2003, ApJ, 588, 353
- Hollis et al. (1980) Hollis, J. M., Snyder, L. E., Suenram, R. D., & Lovas, F. J. 1980, ApJ, 241, 1001
- Holtom et al. (2005) Holtom, P. D., Bennett, C. J., Osamura, Y., Mason, N. J., & Kaiser, R. I. 2005, ApJ, 626, 940
- Ilyushin et al. (2006) Ilyushin, V., Alekseev, E., Demaison, J., & Kleiner, I. 2006, J. Mol. Spectrosc., 240, 127
- Ilyushin et al. (2005) Ilyushin, V. V., Alekseev, E. A., Dyubko, S. F., Motiyenko, R. A., & Hougen, J. T. 2005, J. Mol. Spectrosc., 229, 170
- Jimenez-Serra et al. (2014) Jimenez-Serra, I., Testi, L., Caselli, P., & Viti, S. 2014, ApJ, 787, L33
- Jones et al. (2007) Jones, P. A., Cunningham, M. R., Godfrey, P. D., & Cragg, D. M. 2007, MNRAS, 374, 579
- Kaifu et al. (1974) Kaifu, N., Morimoto, M., Nagane, K., et al. 1974, ApJ, 191, L135
- Kim & Kaiser (2011) Kim, Y. S. & Kaiser, R. I. 2011, ApJ, 729, 68
- Kisiel et al. (2010) Kisiel, Z., Białkowska-Jaworska, E., Pszczółkowski, L., & Guillemin, J. C. 2010, The 21st International Conference on High Resolution Molecular Spectroscopy, 144
- Kisiel & Kraśnicki (2010) Kisiel, Z. & Kraśnicki, A. 2010, J. Mol. Spectrosc., 262, 82
- Kisiel et al. (2013) Kisiel, Z., Kraśnicki, A., Jabs, W., et al. 2013, J. Phys. Chem. A, 117, 9889, pMID: 23514359
- Kisiel et al. (2012) Kisiel, Z., Pszczółkowski, L., Drouin, B. J., et al. 2012, J. Mol. Spectrosc., 280, 134
- Kisiel et al. (2005) Kisiel, Z., Pszczółkowski, L., Medvedev, I. R., et al. 2005, J. Mol. Spectrosc., 233, 231 , http://www.ifpan.edu.pl/kisiel/aabs/aabs.htm#aabs
- Knowles et al. (2010) Knowles, D. J., Wang, T., & Bowie, J. H. 2010, Org. Biomol. Chem., 8, 4934
- Koch et al. (2008) Koch, D. M., Toubin, C., Peslherbe, G. H., & Hynes, J. T. 2008, J. Phys. Chem. C, 112, 2972
- Kolesniková et al. (2013) Kolesniková, L., Daly, A., Alonso, J., Tercero, B., & Cernicharo, J. 2013, J. Mol. Spectrosc., 289, 13
- Kolesniková et al. (2019) Kolesniková, L., León, I., Alonso, E. R., Mata, S., & Alonso, J. L. 2019, J. Phys. Chem. Lett., 10, 1325
- Kraśnicki et al. (2011) Kraśnicki, A., Kisiel, Z., Jabs, W., Winnewisser, B. P., & Winnewisser, M. 2011, J. Mol. Spectrosc., 267, 144
- Kuan et al. (2004) Kuan, Y.-J., Charnley, S. B., Huang, H.-C., et al. 2004, Adv. Space Res., 33, 31
- Kuan et al. (2003) Kuan, Y.-J., Charnley, S. B., Huang, H.-C., Tseng, W.-L., & Kisiel, Z. 2003, ApJ, 593, 848
- Largo et al. (2004) Largo, A., Redondo, P., & Barrientos, C. 2004, Int. J. Quant. Chem., 98, 355
- Largo et al. (2010) Largo, L., Barrientos, C., Rayon, V. M., Largo, A., & Redondo, P. 2010, Int. J. Mass Spectrom., 295, 21
- Lattelais et al. (2011) Lattelais, M., Pauzat, F., Pilmé, J., Ellinger, Y., & Ceccarelli, C. 2011, A&A, 532, A39
- Lee et al. (2009) Lee, C.-W., Kim, J.-K., Moon, E.-S., Minh, Y. C., & Kang, H. 2009, ApJ, 697, 428
- Li et al. (2003) Li, P., Bu, Y., & Ai, H. 2003, J. Phys. Chem. A, 107, 6419
- Maret et al. (2011) Maret, S., Hily-Blant, P., Pety, J., Bardeau, S., & Reynier, E. 2011, A&A, 526, A47
- Maris (2004) Maris, A. 2004, Phys. Chem. Chem. Phys., 6, 2611
- Marstokk & Møllendal (1999) Marstokk, K. M. & Møllendal, H. 1999, Acta Chim. Scand., 53, 79
- Medvedev et al. (2004) Medvedev, I., Winnewisser, M., De Lucia, F. C., et al. 2004, J. Mol. Spectrosc., 228, 314
- Melosso et al. (2020) Melosso, M., Belloche, A., Martin-Drumel, M.-A., et al. 2020, A&A, 641, A160
- Nhlabatsi et al. (2016) Nhlabatsi, Z. P., Bhasi, P., & Sitha, S. 2016, Phys. Chem. Chem. Phys., 18, 20109
- Ozeki et al. (2017) Ozeki, H., Miyahara, R., Ihara, H., et al. 2017, A&A, 600, A44
- Papoušek & Aliev (1982) Papoušek, D. & Aliev, M. R. 1982, Molecular Vibrational/Rotational Spectra, Prague (Czech Republic): Academia, 323 p.
- Pickett (1972) Pickett, H. M. 1972, J. Chem. Phys., 56, 1715
- Pickett (1991) Pickett, H. M. 1991, J. Mol. Spectrosc., 148, 371
- Pickett et al. (1998) Pickett, H. M., Poynter, R. L., Cohen, E. A., et al. 1998, J. Quant. Spec. Radiat. Transf., 60, 883
- Pilling et al. (2011) Pilling, S., Baptista, L., Boechat-Roberty, H. M., & Andrade, D. P. P. 2011, Astrobiology, 11, 883, pMID: 22066498
- Pizzarello et al. (1991) Pizzarello, S., Krishnamurthy, R., Epstein, S., & Cronin, J. 1991, Geochimica et Cosmochimica Acta, 55, 905
- Read et al. (1986) Read, W., Cohen, E., & Pickett, H. 1986, J. Mol. Spectrosc., 115, 316
- Redondo et al. (2015) Redondo, P., Largo, A., & Barrientos, C. 2015, A&A, 579, A125
- Reid et al. (2019) Reid, M. J., Menten, K. M., Brunthaler, A., et al. 2019, ApJ, 885, 131
- Rimola et al. (2012) Rimola, A., Sodupe, M., & Ugliengo, P. 2012, ApJ, 754, 24
- Rivilla et al. (2020) Rivilla, V. M., Martín-Pintado, J., Jiménez-Serra, I., et al. 2020, ApJ, 899, L28
- Sahu et al. (2020) Sahu, D., Liu, S.-Y., Das, A., Garai, P., & Wakelam, V. 2020, ApJ, 899, 65
- Sanz-Novo et al. (2020) Sanz-Novo, M., Belloche, A., Alonso, J. L., et al. 2020, A&A, 639, A135
- Sanz-Novo et al. (2019) Sanz-Novo, M., Largo, A., Redondo, P., & Barrientos, C. 2019, ACS Earth and Space Chemistry, 3, 1170
- Snyder et al. (1983) Snyder, L. E., Hollis, J. M., Suenram, R. D., et al. 1983, ApJ, 268, 123
- Snyder et al. (2005) Snyder, L. E., Lovas, F. J., Hollis, J. M., et al. 2005, ApJ, 619, 914
- Suzuki et al. (2018) Suzuki, T., Majumdar, L., Ohishi, M., et al. 2018, ApJ, 863, 51
- Tercero et al. (2010) Tercero, B., Cernicharo, J., Pardo, J. R., & Goicoechea, J. R. 2010, A&A, 517, A96
- Ugliengo et al. (2011) Ugliengo, P., Rimola, A., & Sodupe, M. 2011, Rend. Fis. Acc. Lincei, 22, 137
- Watson (1977) Watson, J. K. G. 1977, in Vibrational Spectra and Structure, ed. J. R. Durig, Vol. 6 (Amsterdam: Elsevier), 1–89
- Xavier et al. (2019) Xavier, N. F., J., Baptista, L., & Bauerfeldt, G. F. 2019, MNRAS, 486, 2153
- Zheng & Kaiser (2010) Zheng, W. & Kaiser, R. I. 2010, J. Phys. Chem. A, 114, 5251
- Zhu & Ho (2004) Zhu, H.-S. & Ho, J.-J. 2004, J. Phys. Chem. A, 108, 3798
Appendix A Complementary Tables and figures
Table 5 contains subset statistics for substates in each torsional/inversion doublet, including numbers of fitted lines, ranges of the values of the key quantum numbers, and frequency ranges of the measurements.
The plots in Figs. 9, 10, 11 are distribution plots of obs.-calc. frequencies as a function of the values of and quantum numbers, illustrating the comprehensive quantum number coverage achieved in the measurements.
Figures 12 and 13 show the transitions of NH2CN and NH2CH3 that are covered by the ReMoCA survey and contribute significantly to the signal detected toward Sgr B2(N1S). Figure 14 shows the population diagram of NH2CH3 toward Sgr B2(N1S).
| Substate | a | /MHz | frequency /GHz | ||||||||
|---|---|---|---|---|---|---|---|---|---|---|---|
| min | max | min | max | min | max | ||||||
| ground state, 0+ | 635d | ||||||||||
| ground state, 0- | 602e | ||||||||||
| , 1+ | 438 | ||||||||||
| , 1- | 435 | ||||||||||
| , 0+ | 381 | ||||||||||
| , 0- | 333 | ||||||||||
Notes.
(a)Number of distinct measured frequencies.
(b)Standard deviation of the fit.
(c)Unitless (weighted) deviation of the fit.
(d)Including 18 nominal transitions.
(e)Including 15 nominal transitions.