redacted \correspondingauthorduenez@deepmind.com \reportnumber2115
Statistical Discrimination in Learning Agents
Abstract
Undesired bias afflicts both human and algorithmic decision making, and may be especially prevalent when information processing trade-offs incentivize the use of heuristics. One primary example is statistical discrimination—selecting social partners based not on their underlying attributes, but on readily perceptible characteristics that covary with their suitability for the task at hand. We present a theoretical model to examine how information processing influences statistical discrimination and test its predictions using multi-agent reinforcement learning with various agent architectures in a partner choice-based social dilemma. As predicted, statistical discrimination emerges in agent policies as a function of both the bias in the training population and of agent architecture. All agents showed substantial statistical discrimination, defaulting to using the readily available correlates instead of the outcome relevant features. We show that less discrimination emerges with agents that use recurrent neural networks, and when their training environment has less bias. However, all agent algorithms we tried still exhibited substantial bias after learning in biased training populations.
1 Introduction
Choosing good social partners is one key to successful human cooperation (Henrich, 2017), but accurately evaluating a potential partner requires acquiring, integrating and processing information across a variety of situations (Brosnan and De Waal, 2002; Schino and Aureli, 2009). Information processing trade-offs create pressure to learn and apply cheap heuristics in partner choice (Schino and Aureli, 2010). These heuristics, however, can produce undesired biases. Such biases are evident in both human behavior (Greenwald and Banaji, 1995; Devine, 1989) and machine learning algorithms (Caliskan et al., 2017; Zuiderveen Borgesius et al., 2018), and have clear negative effects on economic efficiency and human wellbeing (Bielby and Baron, 1986; Schwab, 1986; Maitzen, 1991; Ayres, 1991; Fang and Moro, 2011; Li et al., 2020). However, the process of their development has not been widely studied.
One formalism used to understand the emergence of such heuristics is statistical discrimination. Statistical discrimination occurs when a decision maker must assess an individual’s suitability as a partner but lacks immediate access to features that are causally relevant to that choice. Instead the decision maker bases its assessment on features that are readily available and, in their experience, correlate with the ones of interest (Arrow, 1972; Phelps, 1972). Statistical discrimination stands in contrast to taste-based discrimination, where decision makers have an intrinsic preference for one group over another (Guryan and Charles, 2013).
Models of statistical discrimination do not attempt to capture the full complexity of racial, gender, and other types of discrimination in human societies, which likely involve a wide range of cognitive phenomena such as in-group favoritism (Balliet et al., 2014), group entitativity (Yzerbyt et al., 1998), and more. Nonetheless, it is possible that multi-generational patterns of systematic social exclusion could be initiated and/or supported by statistical discrimination (Arrow, 1998).
Traditional statistical discrimination models assume a decision maker evaluates a referent individual in a one-shot interaction where only perceptible information is available. In reality, decision makers can improve their knowledge of the outcome-relevant characteristics of social partners in a gradual manner. For instance, even in the employment setting where statistical discrimination was originally formulated by Arrow (1972), employers in the real world refine their assessment of job applicants with successive filters and stages. Employers use résumé screening, multiple rounds of interviews, internships and other provisional employment opportunities to improve their knowledge of the applicant’s suitability for a job. In other words, real-world situations are temporally extended, require acquiring, processing and integrating information across time, and comprise a complex tapestry of uncertainty, repeated interactions, and risk management. Limits to time, information processing ability, or the reliability of signals of partner quality will therefore impact the accuracy of decision making, and produce higher bias. Yet, there currently exist no theoretical models to understand the interplay of such limits.
In this work, we introduce a new game theoretical framework for statistical discrimination which advances the state-of-the-art in three ways: (i) allows for sequential decision making; (ii) provides individuals with the ability to choose their partners; and (iii) allows for evaluation of partners based on direct or indirect experience. We then validate this model on a temporally and spatially extended multiagent reinforcement learning environment where agents with varying information processing abilities engage in repeated social interactions with partner choice.
1.1 Reinforcement learning as a model of human behavior
Recently, multiagent reinforcement learning (MARL) has emerged as a framework for the study of social interactions (Tuyls and Noeé, 2005; Kleiman-Weiner et al., 2016; Leibo et al., 2017; Peysakhovich and Lerer, 2018) by generalizing traditional models of social behaviour to more realistic scenarios in two important ways. First, it enables study of more complex environments than the ones covered by traditional game theory methods; the environments can be spatial, and temporally extended, grounding the abstract conceptions of actions and interactions in a rich world. Second, it enables the study of agents in those rich environments whose decision processes are limited by learning algorithms and information processing ability, and whose interactions are grounded by the laws of their worlds.
In contrast to many game theoretic models that assume optimal behaviour, models of bounded rationality explore the role of limited information processing ability and biases (Simon, 1957) in the dynamics and behaviors of a population. MARL offers a fresh approach to modeling bounded rationality, focusing on the learning dynamics, where the bounds are implicit to the learning process (Leibo et al., 2017; McKee et al., 2021).
MARL has been used to study a variety of social situations, including social dilemmas (Leibo et al., 2017; Lerer and Peysakhovich, 2017; Hughes et al., 2018), norm and convention formation (Lerer and Peysakhovich, 2019; Köster et al., 2020; Bakker et al., 2021), communication (Foerster et al., 2016; Lazaridou et al., 2020), and many more. A recent article explored partner choice in an abstract iterated social dilemma environment (Anastassacos et al., 2020), validating that partner choice can indeed promote cooperation in learning agents.
1.2 Partner choice in human societies
Partner choice is a critical mechanism for cooperation in nature (Noë and Hammerstein, 1994; Barclay and Willer, 2007; Fu et al., 2008), and evaluation of social partners is postulated as a major driving force in human evolution (Dunbar, 1998). Previous theoretical work has established that partner choice is a mechanism that can promote cooperation (Santos et al., 2006; Gintis et al., 2008). Ostracism has been observed to promote and maintain cooperation in cultural contexts ranging from hunter gatherers and small-scale pastoral societies (Söderberg and Fry, 2016), to ancient Athenians (Ouwerkerk et al., 2005), as well as in experimental studies of contemporary Westerners (Feinberg et al., 2014). Given its cross-cultural ubiquity, it is plausible that evolved cognitive mechanisms for partner choice contribute to systemic social exclusion (Tooby and Cosmides, 1988; Kurzban and Leary, 2001).
Due to limits of cognition and information processing, the mechanisms involved in partner choice may go beyond the (rational but undesirable) statistical discrimination and end up being applied irrationally. This is especially likely where social evaluations are rapid; humans make more mistakes when making decisions under time pressure (Rubinstein, 2013), and these results transfer to social interactions (Evans et al., 2015) including in responses to discrimination (Greenwald and Banaji, 1995; FitzGerald and Hurst, 2017). In primates, there is evidence that reciprocity is driven by relatively simple cognitive processes (Brosnan and De Waal, 2002; Schino and Aureli, 2010). In humans, implicit bias is a measurable and unconscious process that biases perception of social partners based on their perceived group membership (Greenwald and Banaji, 1995). Reduction of implicit bias is possible, but appears to require awareness of the bias, and a conscious effort to diminish it (Devine et al., 2012) (cf. (Lai et al., 2016)).
2 A model of discrimination with partner choice
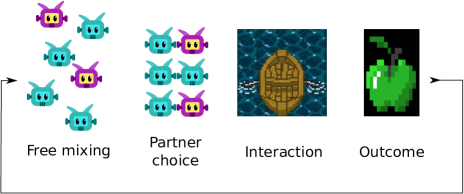
We abstract the scenario of choosing desirable social partners to engage in potentially mutually beneficial interactions as an iterated game. Each iteration consists of several phases (see Figure 1). A free mixing phase where individuals can observe some characteristics of others that might or might not correlate with actual performance. Crucially, the actual partner quality cannot be directly observed in this phase. A partner choice phase where individuals pair up, and commit to interact to the exclusion of all other possible social partners. After choosing partners, the pairs continue to the interaction phase, where the outcome relevant behaviors are expressed. The outcome phase assigns payoffs (or rewards) to each of the individuals based on how they, and their partner, behaved during the interaction phase.
Iterated social dilemmas are the dominant framework to study the dynamics of social relationships (Axelrod and Hamilton, 1981; Nowak and May, 1992). They consist of a population of individuals engaging in repeated pair-wise social interactions. We extend this framework by introducing partner choice (Stanley et al., 1993; Hauk, 2001). For simplicity, we assume that if both individuals in a pair were happy with the outcome of their previous interaction, they can and will be able to pair up again at the next partner choice phase. Individuals can choose to unilaterally end a relationship by simply choosing someone else. In addition to observing the outcome of their immediate interaction, individuals might be able to observe the outcomes of other interactions in the population. Constraining an individual’s access to their outcomes, or the outcomes of other pairs, is how we model information processing ability in our analytical model. In the reinforcement learning model, this ability to perceive and process outcomes of interactions between other individuals is grounded on the observations of the environment (see Section 3).
As is typical in iterated social dilemmas, we model interactions as a(n instantaneous) matrix game. In an interaction, each individual has access to two strategies: cooperate or defect. Individuals then simultaneously choose one strategy, and receive a payoff depending on a payoff matrix . In this work we use the payoff matrix of Stag Hunt (Rousseau, 2009; Skyrms, 2001),
| (1) |
where . An individual playing strategy interacting with one playing strategy receives payoff . So, for instance, if both individuals cooperate, both get the payoff , whereas if only the first one cooperates, they get , and their partner gets .
We chose Stag Hunt instead of the Prisoner’s Dilemma as the underlying dynamics of the social interactions because our focus here is on situations where cooperation is prevalent in the population. The emergence and maintenance of cooperation has been extensively studied elsewhere (Nowak, 2006; Fletcher and Doebeli, 2009; Henrich et al., 2010)). In contrast to the Prisoner’s Dilemma where there is always an incentive to defect, the incentive in Stag Hunt is to coordinate with your partner. Mutual cooperation is preferred over mutual defection, and once mutual cooperation has been achieved, there is no incentive to deviate. Because of these properties, Stag Hunt is regarded as better capturing the dynamics of long term cooperation (Skyrms, 2004).
Individuals have a set of perceptible attributes that may or may not correlate with the strategy they play during an interaction. We consider a focal individual living through social iterations. We assume a basic level of rationality, that is, they would not choose to defect or end a relationship when they are in a mutually cooperative partnership. We model their different levels of rationality based on their ability to react to the behaviour of their partners, the behaviours of other individuals in the population, and the specific partner sampling strategy they employ. In particular, we consider two broad types of behaviors: unconditional, which either cooperates or defects, regardless of partner, and never ends relationships; and reciprocating, which cooperates when partner cooperates, otherwise ends the relationship. We also consider two partner sampling styles: visual, which samples exclusively based on perceptible attributes; and aware, which samples first based on perceptible attributes, but observes all interactions in the population, thereafter, samples cooperators exclusively.
Intuitively, an unconditional behavior is less sophisticated than a reciprocating one. And reciprocating behaviors that rely on visual sampling are less cognitively demanding than ones with aware sampling. We also refer to an omniscient behavior which is provided as an upper-bound, representing the maximum possible payoff. An omniscient individual knows the outcome-relevant features, and ignores any other information.
We denote by the probability that, on the first interaction, the focal individual chooses a partner that cooperates. This quantity depends on a wide range of factors, including the individual’s partner choice policy, the population composition, and the correlation between perceptible features and behaviors. This quantity allows us to write the payoffs of individuals expressing different policies in a compact and intuitive way. For a full explanation of this quantity and how it maps to individuals’ information processing abilities, please refer to the Supplementary Material.
Behaviours and sampling styles are largely orthogonal, except that an unconditional aware individual would be hard to distinguish from a visual aware one. Therefore, we only consider the following four policies:
-
1.
Visual unconditional: samples partners of only one color, and unconditionally cooperates with them ().
-
2.
Visual reciprocator: samples partners of only one color, cooperates first with them, but ends the relationship if they defect ().
-
3.
Aware reciprocator: samples first a partner of a specific color and cooperates with them, if they defect, exclusively samples cooperators from then on (the individual is aware of the behaviors of others from the second iteration) ().
-
4.
Omniscient: always samples cooperators and cooperates with them ().
which stand in as our buckets for the information processing of individuals, from low to high, respectively.
The total payoff over iterations of these strategies are:
| (2) | ||||
| (3) | ||||
| (4) | ||||
| (5) |
which, for sufficiently large , imply
| (6) |
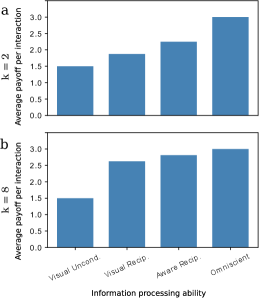
Figure 2 shows averages of these equations when the interaction is driven by the payoff matrix (1), with the chance of sampling a cooperator , for iterations and . For full derivations, please refer to the Supplementary Material.
Our model shows, via the inequalities in (6), that an individual’s payoff increases with its ability to process information about others. Less discriminatory behavior results in higher payoff. Finally, from equations (2–5), the higher the number of iterations, , the larger the potential benefit of making partner choices based on actual outcome data, rather than perceptible features (contrast Figure 2a with Figure 2b).
3 Reinforcement learning model
To test the insights from the theoretical model presented above, we create a multiagent reinforcement learning model that captures the properties of iterated interactions with partner choice. The environment is spatially and temporally extended, and information about the outcomes of interactions with partners and between third parties is perceptual.
3.1 Boat race environment
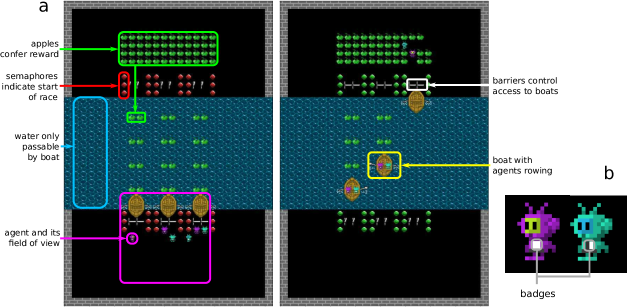
The environment is inspired by the boat rowing thought experiment posed by Hume (Hume, 2012), considered as a golden example of Stag Hunt (See Figure 3a). In our environment, 6 players engage in a back and forth series of boat races across a river to reach apples that confer a reward. Boats, however, cannot be rowed by a single player, and thus, players need to find a partner before each race and coordinate their rowing during the race to cross the river. When the players are on the boat, they can choose from two different rowing actions at each timestamp: paddle, that is efficient, but costly if not coordinated with its partner; and flail, that is inefficient, but isn’t affected by the partner’s action. When both players paddle, the boat moves one cell every timesteps. When either player flails, the boat has a probability of moving one cell, and a reward penalty of is given to its partner if that partner is currently paddling (i.e. if they have executed the paddle action within the last 3 timesteps).
Two perceptible attributes are given to distinguish players (see Figure 3b). First, every player is colored purple or teal. The color is readily observable as the players perceive their environment as an RGB image window around themselves (see Figure 3a), but is insufficient to individualize a player’s behavior. Second, a badge, is given to every player at the start of the episode, which uniquely identifies them within the episode. The badge is a pattern of dark gray or white pixels at the center of the player’s sprite. The badge is not persistent across episodes.
An episode consists of a number of discrete races of equal duration. At the beginning of each race, access to the boats is blocked by barriers. The barriers lift after a predetermined amount of time, giving the players time to move freely and approach the boat or partner of their choice (like the “free mixing” phase, see Figure 1). The topology of the environment is such that once a pair of players is behind the barriers of a boat, no other player can force themselves into that boat (this corresponds to the “partner choice” phase). If a player so wishes, however, they can back away and walk to another boat. Once a player reaches a seat, they remain seated until either they reach the other river bank, or the time allotted for the race is up, in which case they are disqualified and removed for the rest of the episode (the “interaction” phase).
In the environment there are apples that provide reward to the players that touch them. The apples are consumed in the process, but will be replenished eventually (see below). They are positioned in two different locations: along the river to encourage progress; and on the opposite river bank from the players, as a reward for finishing the race (the “outcome” phase).
The apples on the river are replenished at the start of each race. The apples on the river bank replenish at a constant rate, but disappear altogether when the race time is up (and re-appear on the opposite bank). The replenishing rate of the apples on the river bank is high enough that not even the players optimally consuming them can exhaust them. Therefore, there is a strong incentive to finish a race quickly, so as to accrue the largest reward. For full details see the Supplementary Material.
Possible policies.
The environment admits behaviors that implement the policies from the theoretical model. A visual unconditional would pair up with agents of one color, when available, or at random when not, and always paddle. A visual reciprocator would pair on the first race with an agent of one color if available. If their partner (mostly) paddled during the race, they would remember their badge and pair with them in subsequent races. If the partner (mostly) flailed, they would look for another partner of that color, if available. An aware reciprocator would pair on the first race with an agent of one color, if available. During the race, this agent would look at the badges of all the players, and infer whether they are flailing or paddling based on their rowing pattern and boat speed. From the second race, it would exclusively pair with cooperators, if available.
3.2 Environment validation
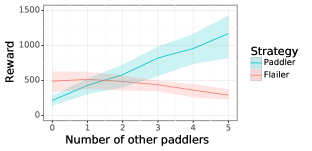
To verify that our environment has the properties of an iterated Stag Hunt, we compute in Figure 4 its Schelling diagram (Schelling, 1973; Pérolat et al., 2017). It is possible to read off various game theoretic properties from a Schelling diagram including whether a game is a social dilemma. A Schelling diagram is a plot that summarizes the incentives of a set of players who face a binary choice of a strategy to pursue. In our case the choice of strategy is either always paddle (paddler), or always flail (flailer). The way to interpret the Schelling diagram is to consider a focal individual joining an episode where there are a certain number of paddlers, and the rest are flailers (for a total of other players). This focal individual then faces a binary choice of whether to join as a paddler, and receive the payoff that paddlers receive given the group composition, or receive the payoff of flailers. For instance, if the episode has paddlers, and flailers already, the focal player joining as a paddler would receive the payoff of the paddler’s line at in Figure 4 (on average reward), and if joining as a flailer would receive the payoff of the flailer’s line at (on average ). Therefore, if there are paddlers already in the environment, there is an incentive to join as a paddler.
To obtain paddlers and flailers, we train A3C agents (Mnih et al., 2016; Espeholt et al., 2018) with a preferred rowing type. We give a pseudo-reward of for executing their preferred rowing type, and of for executing the wrong rowing type. All other rewards are left intact. We validated that paddlers overwhelmingly "paddle" when in the boat, while flailers "flail" (see Supplementary Material).
From Figure 4, we can see that when paddlers are abundant, paddling is advantageous, however, when paddlers are rare, flailing is advantageous, which correspond to a population version of Stag Hunt (as per the definition proposed in (Hughes et al., 2018)). Thus, we can refer to paddlers as cooperators and flailers as defectors.
3.3 Training and evaluation of agents
Now that we know that the boat race environment has the right incentive structure, we proceed to train and evaluate reinforcement learning agents. Like in the theoretical model case, we consider a focal agent training in a community of other agents. To form the training community of a focal agent, we freeze the parameters of the agents from the Schelling diagram, and refer to them as bots. Bots are of one of four types: purple cooperators, purple defectors, teal cooperators, or teal defectors. We will refer to the focal agent as a naive learner to differentiate them from the bots in the community. Naive learners can be of either color, and have no intrinsic preference for either type of rowing.
Training.
A training community consists of bots: purple cooperators, teal defectors, purple defectors and teal cooperators, for . Therefore, there are possible community compositions. Notice that a training community will always have cooperators (and defectors), and purple (teal) bots. What changes between compositions is the statistical association of color with strategy, and we will refer to this as the community bias. Naive learners will be assigned to a particular community, and train in episodes with bots sampled (without replacement) from their training community.
We train naive learners with four different architectures: A3C with and without an LSTM (Espeholt et al., 2018), and V-MPO with and without an LSTM (Song et al., 2019). We chose these architectures to reflect different information processing abilities: LSTM provides agents with memory which can be used to reciprocate previous partner cooperation; V-MPO is a more advanced agent than A3C and is expected to learn better. For each agent architecture we train one naive learner of each color for each of the possible community compositions. We also have two values for the number of races : and . Therefore, in total, we train () agents of each architecture. These videos (youtu.be/vweO6k6cx5E and youtu.be/nYbiQyT5Rxs) show episodes of a V-MPO naive learner with an LSTM for and races respectively. To improve interpretability, we post-process the video to highlight the naive learner in white, cooperator bots in blue, and defector bots in red.
Evaluation.
For each naive learner, we ran test episodes with a new test community that had no community bias (i.e. color and strategy are uncorrelated). This testing community was composed of held out bots that had trained in the same number of races as the naive learner but it has not interacted with at training. Therefore, any partner choice observed is due to zero-shot transfer to co-players.
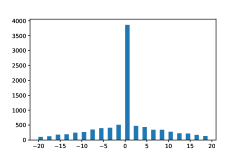
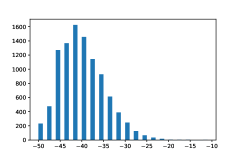
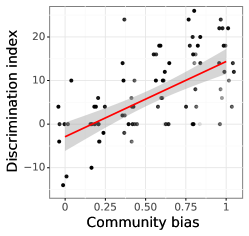
The association matrix of a naive learner is a matrix of counts where corresponds to the number of times the naive learner shared a boat with a bot with color (for purple and teal, respectively) and strategy (for cooperator and defector, respectively). For instance, corresponds to the number of times the naive learner associated with a teal defector. We define the participation of an agent as the sum of the entries in their association matrix . We define the discrimination index of a naive learner as
This index measures the difference between how much an agent is associating by color: (sum of absolute differences across rows); versus how much it is associating by behavior: (sum of absolute differences across columns). A positive value means the agent prefers to associate with bots based on their color rather than their behavior. A negative value means they prefer to associate by behavior rather than color. A value of zero means that they oversample a color, only insofar as they oversample a behavior (i.e. there isn’t a row or a column that is larger element-wise than the other, see Supplementary Material).
Estimated CO2 emissions.
Experiments were conducted using an internal GPU cluster with carbon efficiency of 0.27 kgCO2eq/kWh. A cumulative of 30,000 hours of computation was performed on Tesla P100 GPUs (TDP of 250W). Total emissions are estimated at 2025 kgCO2eq, all of which were directly offset. Estimations were conducted using the Machine Learning Impact calculator (Lacoste et al., 2019).
4 Results
To understand the policy that the naive learners are executing, we keep track of their association matrix, and what type of rowing they engage in. Naive learners overwhelmingly paddle, but when paired with a defector, they flail or do not row at all (see Supplementary Material). We also tested if the agents (both naive learners and bots) had any preference for a particular seat (left or right), or boat (left, middle, or right), but they did not (see Supplementary Material). Thus we can infer that any association between particular individuals is a result of explicit partner choice, either of themselves or others.
To understand the extent to which an agent is using information about their partners during an episode, we track the discrimination index on the first and last races. confidence intervals for the discrimination index range from for an agent with perfect information who exclusively prefers one strategy, to for an agent who exclusively prefers one color. A naive learner sampling at random has a discrimination index within with confidence (see Supplementary Material).
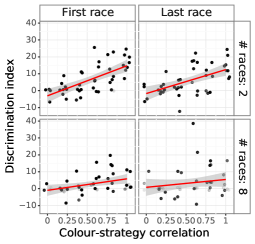
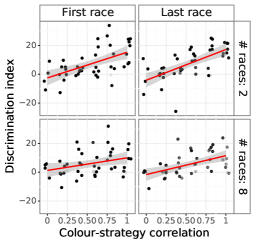
To evaluate the effect that the training community bias has on the learned behavior of naive learners, we plot the test time discrimination index, as described in Section 3.3, as a response of the training community bias that the naive learner experienced. The left panel of Figure 5 shows this plot where each point represents averages of test episodes for a single naive learner. Agents trained in an unbiased community exhibit a slight negative discrimination index in the last race, whereas agents trained in highly biased communities universally have positive discrimination.
Notice that in the case of races, in principle agents have enough opportunity to sample each of their co-players each in one race, leaving enough leeway to partner with cooperators in the last race, if any are available. In the case of races, sampling a cooperator in the last race requires either sampling a cooperator by luck on the first race, and remembering to partner with them in the last race, or, more generally, observing the behaviours of other agents and inferring their policy based on their performance. The environment allows for this type of deduction, as the information is available even though it is challenging to keep track of.
Agents trained in highly biased communities tend to exhibit high discrimination at testing time. This is unlikely only due to competition for the preferred partners since the effect changed with the training community bias, and agents were never observed to associate by behavior as much as they associate by color (their discrimination index was never very negative, see Figure 5, and the Supplementary Material).
The discrimination index of the RL agents increases roughly linearly with their training community’s bias (Figure 5, left). This is in contrast to predictions from the analytical model, where any detectable bias should be maximally exploited by reward maximizers. As a consequence, we would have expected more of a threshold response to increases in training community bias.
Only agents with an LSTM were able to have a lower discrimination index in their last race than their first one (Figure 5, right). However, none of our agents were able to robustly ignore the correlation between color and behaviour at test time, even in the most favorable case: a V-MPO agent with LSTM, in races. Importantly, this is not because agents are unable to effectively realize their partner choice preferences, since agents from highly biased communities were indeed able to associate by color effectively, and often within the confidence interval of optimal association (by color). Agents trained on races discriminated less than those trained in races (Figure 5, right). This suggests that the incentives to discriminate can be reduced through repeated interactions.
| LSTM | Race | Discr. index | |
|---|---|---|---|
| No | 2 | first | 17.838710 |
| No | 2 | last | 21.379032 |
| No | 8 | first | 8.717742 |
| No | 8 | last | 13.153226 |
| Yes | 2 | first | 17.750000 |
| Yes | 2 | last | 14.129032 |
| Yes | 8 | first | 6.798387 |
| Yes | 8 | last | 4.629032 |
5 Limitations
By design, we limit the scope of this work to that of statistical discrimination. Our work tackles one particular aspect of discrimination that we can study directly with the tools currently available because it does not require predictions or assumptions about multi-generational dynamics on human societies. In doing so, we are able to make a clear and formal contribution, but also limit the possible impact that our insights can have on the societal problems at large. Statistical discrimination is almost certainly a factor within societal discrimination, but the effect size of this factor is unknown.
The results discussed here do not, nor they attempt to, claim to solve the complex problems of racism, sexism, ableism, etc; nor of representation of specific or implied groups of people. These problems require a multi-faceted approach, and no one aspect is likely to resolve them outright. Finally, while reinforcement learning agents are a model of human behavior and learning, they are far from perfect. They are better able to capture spatial and temporally complex behaviors than traditional rational economic models and evolutionary agent-based models of behavior, but are still far from the richness of the human brain.
6 Discussion
Our theoretical model shows that agents have an incentive to statistically discriminate on the basis of perceptible features when their training environment is biased (i.e. the perceptible features are correlated with the quality of social partners). This effect intensifies if they are unable to obtain, process, or incorporate the information of which other agents are good social partners. Agents that choose partners based on their direct quality not only perform better overall, but also discriminate less. This pattern held true in the multiagent reinforcement learning model.
Past research has shown that unfair biases arising in supervised learning models can be mitigated via precautions with training data and model deployment (Mehrabi et al., 2019; Dixon et al., 2018; Zhang et al., 2018). Here, we found that reinforcement learning agents trained in a biased community were unable to avoid statistical discrimination. This was expected for agents without an LSTM, for whom reciprocating strategies are likely inaccessible. More surprisingly, it was also true for agents with an LSTM.
Agents with an LSTM are, in principle, able to remember previous social partners in an episode, and thus we expected them to engage in reciprocation, either visual reciprocation (associating by color in the first race, but then filter undesirable partners until finding a suitable partner of the preferred color), or aware reciprocation (associating by color in the first race, but paying close attention to all interactions and only associating with cooperators in any subsequent races). To our surprise, all agents, regardless of the presence or absence of an LSTM, consistently failed to pair with cooperators even in the last race, maintaining a high discrimination index. This discrimination was not due to an inability to enact partner choices, since agents trained in extremely biased communities exhibited a discrimination index at evaluation that was near the theoretical maximum.
Agents with an LSTM, while unable to fully de-bias themselves, were nonetheless able to discriminate less in the last race than in the first one. This suggests that the ability to process and incorporate information plays a central role in how individuals learn to choose a partner in a non-discriminatory way. This effect, however, was far from optimal, and all agents, with or without an LSTM, behaved closer to the theoretical prediction of visual unconditional players (Equation 2) than even visual reciprocators (Equation 3). None of them came even close to exhibiting an aware partner sampling (Equation 4), even though that information was available in their observations. Mitigating unfair biases in end-to-end reinforcement learning systems may require new safeguards designed with this in mind.
Interventions on the agent.
It might be possible to modify RL agents to explicitly ameliorate discrimination. However, such interventions would typically require privileged knowledge of the world (for example, the true causal graph of color, behavior, and its influence on reward). The goal of this work is (by choice) not to attempt to solve discrimination, but to propose a framework to study its emergence in learning agents, particularly when they do not have exhaustive mechanisms to deal with discrimination. It is unrealistic to assume that we would be able to enumerate and (manually or automatically) correct all potential sources of bias. We decided to focus on this goal as we believe that shedding light on the emergence of discrimination, an area that is still very poorly understood, is a necessary first step for devising sensible approaches to alleviating this problem.
Fairness in machine learning.
The study of undesired biases in machine learning systems is an active area of research, ranging from formalizing desiderata for system evaluation to the development of methods for mitigating undesired biases (Barocas et al., 2019; Chouldechova and Roth, 2020; Gajane and Pechenizkiy, 2017; Mehrabi et al., 2019; Mitchell et al., 2018; Verma and Rubin, 2018). These efforts have focused predominantly on static prediction settings where only the immediate impact of a decision is taken into account. However, when repeated interactions are not properly accounted for, systems that seem fair in a static sense might exacerbate harmful biases over time (Liu et al., 2018; Zhang et al., 2020). Awareness of this issue has motivated a surge of research on fairness in sequential decision making settings, including work on bandits and reinforcement learning (Jabbari et al., 2017; Joseph et al., 2016), as well as on simulation of fairness interventions and causal modelling (Creager et al., 2020; D’Amour et al., 2020).
Work on fairness in machine learning has made a distinction between group-level fairness and individual-level fairness. Group fairness ensures some form of parity (e.g. between positive outcomes, or errors) across different protected groups (split by e.g. gender). Individual fairness, in contrast, is concerned with constraints that bind on the level of an individual, for example by requiring “similar” people to receive similar outcomes (Dwork et al., 2012). Our work, framed as statistical discrimination, studies how bias emerges and persists and how this violates fairness at the level of an individual. However, while (with some exceptions e.g. (Zhang and Shah, 2014)) most of the literature is concerned with decisions made by one entity (such as e.g. a bank on an individual), this work considers decentralized interactions among peers (Chouldechova and Roth, 2020).
Insights.
Our work suggests two general ways to reduce discrimination: one is to decrease the bias in the training community; and the second is through more careful evaluation of potential partners.
In our setting, theory predicts that small decreases in community bias will have no effect in the policy learned. Individuals will still have an incentive to sample a color exclusively when available. Interestingly, our agents do not conform to that prediction. They instead respond to small reductions in community bias by learning a proportionally less discriminatory policy. We posit that this is due to the stochasticity of sampling co-players for an episode from a community, which results in a bet-hedging solution on the part of the agent. Essentially, whether an agent uses a signal depends on its reliability, and so as the signal becomes more reliable, it becomes more exploitable. This pattern is compatible with the phenomenon observed in the field of ML fairness where reducing bias in the training data has been observed to have a positive impact in the fairness metrics of classification algorithms (Kamiran and Calders, 2012). It is also compatible with the contact hypothesis which postulates that stereotype-disconfirming interactions reduce prejudice in humans (Allport et al., 1954; Paluck et al., 2019).
Our results may also be understood within a dual process framework, which posits that slow and deliberative processes may override automatic habit-like processes. Dual process models have a long history in psychology and neuroscience (reviewed in (Dayan, 2009)). For example in human vision, feedforward decision-making operates rapidly (Thorpe et al., 1996; Greenwald and Banaji, 1995) and may learn dedicated threat-related features (Chekroud et al., 2014), whereas deliberative processes such as mental rotation unfold sequentially via recurrent processing (Lamme and Roelfsema, 2000), and are consequently much slower (Shepard and Metzler, 1971). These differences parallel the contrast between our purely feedforward agents and ones with LSTM.
A related comparison arises between model-based (MB) and model-free (MF) reinforcement learning (Daw et al., 2005). Whereas MB learning can prospectively plan to achieve desired outcomes using knowledge of the likely consequences of actions, MF learning gradually updates cached values of actions retrospectively from experience (Dayan and Daw, 2008; Akam et al., 2015). When outcome values change, model-based decision-makers can rapidly change their behavior, whereas model-free decision-makers need additional repetitions (Dickinson, 1985). In the human brain, MF learning (for example, of habits and rituals) is associated with the dorsolateral striatum (Graybiel, 2008) while MB learning is associated with persistent activity in the prefrontal cortex (Daw et al., 2005; Wang et al., 2018). By allowing agents to learn relevant features from experience when the task demands it, LSTMs may offer a model for the neural mechanisms that underlie MB learning (Wang et al., 2018). In our model, agents with LSTMs benefited from incorporating individual-oriented information for partner choice, whereas feed-forward networks were incapable of this and thus continued to discriminate. These observations suggest that engaging different neurological systems may modulate the impact of statistical discrimination.
Discrimination, in all its forms, is a key societal issue. Only by disentangling the factors contributing to its emergence, establishment, and maintenance can we hope to solve this problem. This work contributes to the understanding of the emergence of bias, and serves as evidence that using reinforcement learning systems in combination with traditional analytical tools can provide insights into important societal issues.
References
- (1)
- Akam et al. (2015) Thomas Akam, Rui Costa, and Peter Dayan. 2015. Simple Plans or Sophisticated Habits? State, Transition and Learning Interactions in the Two-Step Task. PLOS Computational Biology 11, 12 (2015), 1–25.
- Allport et al. (1954) Gordon Willard Allport, Kenneth Clark, and Thomas Pettigrew. 1954. The nature of prejudice. Addison-wesley Reading, MA.
- Anastassacos et al. (2020) Nicolas Anastassacos, Stephen Hailes, and Mirco Musolesi. 2020. Partner selection for the emergence of cooperation in multi-agent systems using reinforcement learning. In Proceedings of the AAAI Conference on Artificial Intelligence, Vol. 34(05). 7047–7054.
- Arrow (1972) Kenneth J. Arrow. 1972. Some mathematical models of race discrimination in the labor market. Racial discrimination in economic life (1972), 187–204.
- Arrow (1998) Kenneth J. Arrow. 1998. What has economics to say about racial discrimination? Journal of economic perspectives 12, 2 (1998), 91–100.
- Axelrod and Hamilton (1981) Robert Axelrod and William D. Hamilton. 1981. The evolution of cooperation. Science 211, 4489 (1981), 1390–1396. https://doi.org/10.1126/science.7466396 arXiv:https://science.sciencemag.org/content/211/4489/1390.full.pdf
- Ayres (1991) Ian Ayres. 1991. Fair driving: Gender and race discrimination in retail car negotiations. Harvard Law Review (1991), 817–872.
- Bakker et al. (2021) Michiel A. Bakker, Richard Everett, Laura Weidinger, Iason Gabriel, William S. Isaac, Joel Z. Leibo, and Edward Hughes. 2021. Modelling Cooperation in Network Games with Spatio-Temporal Complexity. In Proceedings of the 20th International Conference on Autonomous Agents and MultiAgent Systems (Virtual Event, United Kingdom) (AAMAS ’21). International Foundation for Autonomous Agents and Multiagent Systems, Richland, SC, 1455–1457.
- Balliet et al. (2014) Daniel Balliet, Junhui Wu, and Carsten KW De Dreu. 2014. Ingroup favoritism in cooperation: A meta-analysis. Psychological bulletin 140, 6 (2014), 1556.
- Barclay and Willer (2007) Pat Barclay and Robb Willer. 2007. Partner choice creates competitive altruism in humans. Proceedings of the Royal Society B: Biological Sciences 274, 1610 (2007), 749–753.
- Barocas et al. (2019) Solon Barocas, Moritz Hardt, and Arvind Narayanan. 2019. Fairness and Machine Learning. fairmlbook.org. http://www.fairmlbook.org.
- Beattie et al. (2020) Charles Beattie, Thomas Köppe, Edgar A Duéñez-Guzmán, and Joel Z Leibo. 2020. DeepMind Lab2D. arXiv preprint arXiv:2011.07027 (2020).
- Bielby and Baron (1986) William T Bielby and James N Baron. 1986. Men and women at work: Sex segregation and statistical discrimination. American journal of sociology 91, 4 (1986), 759–799.
- Brosnan and De Waal (2002) Sarah F. Brosnan and Frans B. M. De Waal. 2002. A proximate perspective on reciprocal altruism. Human Nature 13, 1 (2002), 129–152.
- Caliskan et al. (2017) Aylin Caliskan, Joanna J Bryson, and Arvind Narayanan. 2017. Semantics derived automatically from language corpora contain human-like biases. Science 356, 6334 (2017), 183–186.
- Chekroud et al. (2014) Adam Mourad Chekroud, Jim A. C. Everett, Holly Bridge, and Miles Hewstone. 2014. A review of neuroimaging studies of race-related prejudice: does amygdala response reflect threat? Frontiers in Human Neuroscience 8 (2014), 179.
- Chouldechova and Roth (2020) Alexandra Chouldechova and Aaron Roth. 2020. A snapshot of the frontiers of fairness in machine learning. Commun. ACM 63, 5 (2020), 82–89.
- Creager et al. (2020) Elliot Creager, David Madras, Toniann Pitassi, and Richard Zemel. 2020. Causal modeling for fairness in dynamical systems. In International Conference on Machine Learning. PMLR, 2185–2195.
- D’Amour et al. (2020) Alexander D’Amour, Hansa Srinivasan, James Atwood, Pallavi Baljekar, D Sculley, and Yoni Halpern. 2020. Fairness is not static: deeper understanding of long term fairness via simulation studies. In Proceedings of the 2020 Conference on Fairness, Accountability, and Transparency. 525–534.
- Daw et al. (2005) Nathaniel D. Daw, Yael Niv, and Peter Dayan. 2005. Uncertainty-based competition between prefrontal and dorsolateral striatal systems for behavioral control. Nature neuroscience 8, 12 (2005), 1704–1711.
- Dayan (2009) Peter Dayan. 2009. Goal-directed control and its antipodes. Neural Networks 22, 3 (2009), 213–219.
- Dayan and Daw (2008) Peter Dayan and Nathaniel D. Daw. 2008. Decision theory, reinforcement learning, and the brain. Cognitive, Affective, & Behavioral Neuroscience 8, 4 (2008), 429–453.
- Devine (1989) Patricia G. Devine. 1989. Stereotypes and prejudice: Their automatic and controlled components. Journal of personality and social psychology 56, 1 (1989), 5.
- Devine et al. (2012) Patricia G. Devine, Patrick S. Forscher, Anthony J. Austin, and William T. L. Cox. 2012. Long-term reduction in implicit race bias: A prejudice habit-breaking intervention. Journal of experimental social psychology 48, 6 (2012), 1267–1278.
- Dickinson (1985) Anthony Dickinson. 1985. Actions and habits: the development of behavioural autonomy. Philosophical Transactions of the Royal Society of London. B, Biological Sciences 308, 1135 (1985), 67–78.
- Dixon et al. (2018) Lucas Dixon, John Li, Jeffrey Sorensen, Nithum Thain, and Lucy Vasserman. 2018. Measuring and mitigating unintended bias in text classification. In Proceedings of the 2018 AAAI/ACM Conference on AI, Ethics, and Society. 67–73.
- Dunbar (1998) Robin I. M. Dunbar. 1998. The social brain hypothesis. Evolutionary Anthropology: Issues, News, and Reviews: Issues, News, and Reviews 6, 5 (1998), 178–190.
- Dwork et al. (2012) Cynthia Dwork, Moritz Hardt, Toniann Pitassi, Omer Reingold, and Richard Zemel. 2012. Fairness through awareness. In Proceedings of the 3rd innovations in theoretical computer science conference. 214–226.
- Espeholt et al. (2018) Lasse Espeholt, Hubert Soyer, Remi Munos, Karen Simonyan, Vlad Mnih, Tom Ward, Yotam Doron, Vlad Firoiu, Tim Harley, Iain Dunning, et al. 2018. Impala: Scalable distributed deep-rl with importance weighted actor-learner architectures. In International Conference on Machine Learning. PMLR, 1407–1416.
- Evans et al. (2015) Anthony M. Evans, Kyle D. Dillon, and David G. Rand. 2015. Fast but not intuitive, slow but not reflective: Decision conflict drives reaction times in social dilemmas. Journal of Experimental Psychology: General 144, 5 (2015), 951.
- Fang and Moro (2011) Hanming Fang and Andrea Moro. 2011. Theories of statistical discrimination and affirmative action: A survey. Handbook of social economics 1 (2011), 133–200.
- Feinberg et al. (2014) Matthew Feinberg, Robb Willer, and Michael Schultz. 2014. Gossip and ostracism promote cooperation in groups. Psychological science 25, 3 (2014), 656–664.
- FitzGerald and Hurst (2017) Chloë FitzGerald and Samia Hurst. 2017. Implicit bias in healthcare professionals: a systematic review. BMC medical ethics 18, 1 (2017), 1–18.
- Fletcher and Doebeli (2009) Jeffrey A. Fletcher and Michael Doebeli. 2009. A simple and general explanation for the evolution of altruism. Proceedings of the Royal Society B: Biological Sciences 276, 1654 (7 Jan. 2009), 13–19. https://doi.org/10.1098/rspb.2008.0829
- Foerster et al. (2016) Jakob N. Foerster, Yannis M. Assael, Nando De Freitas, and Shimon Whiteson. 2016. Learning to communicate with deep multi-agent reinforcement learning. arXiv preprint arXiv:1605.06676 (2016).
- Fu et al. (2008) Feng Fu, Christoph Hauert, Martin A. Nowak, and Long Wang. 2008. Reputation-based partner choice promotes cooperation in social networks. Physical Review E 78, 2 (2008), 026117.
- Gajane and Pechenizkiy (2017) Pratik Gajane and Mykola Pechenizkiy. 2017. On formalizing fairness in prediction with machine learning. arXiv:1710.03184
- Gintis et al. (2008) Herbert Gintis, Joseph Henrich, Samuel Bowles, Robert Boyd, and Ernst Fehr. 2008. Strong reciprocity and the roots of human morality. Social Justice Research 21, 2 (2008), 241–253.
- Graybiel (2008) Ann M. Graybiel. 2008. Habits, rituals, and the evaluative brain. Annu. Rev. Neurosci. 31 (2008), 359–387.
- Greenwald and Banaji (1995) Anthony G. Greenwald and Mahzarin R. Banaji. 1995. Implicit social cognition: attitudes, self-esteem, and stereotypes. Psychological review 102, 1 (1995), 4.
- Guryan and Charles (2013) Jonathan Guryan and Kerwin Kofi Charles. 2013. Taste-based or statistical discrimination: the economics of discrimination returns to its roots. The Economic Journal 123, 572 (2013), F417–F432.
- Hauk (2001) Esther Hauk. 2001. Leaving the prison: Permitting partner choice and refusal in prisoner’s dilemma games. Computational Economics 18, 1 (2001), 65–87.
- Henrich (2017) Joseph Henrich. 2017. The secret of our success: How culture is driving human evolution, domesticating our species, and making us smarter. Princeton University Press.
- Henrich et al. (2010) Joseph Henrich, Jean Ensminger, Richard McElreath, Abigail Barr, Clark Barrett, Alexander Bolyanatz, Juan C. Cardenas, Michael Gurven, Edwins Gwako, Natalie Henrich, Carolyn Lesorogol, Frank Marlowe, David Tracer, and John Ziker. 2010. Markets, Religion, Community Size, and the Evolution of Fairness and Punishment. Science 327, 5972 (19 March 2010), 1480–1484. https://doi.org/10.1126/science.1182238
- Hessel et al. (2019) Matteo Hessel, Hubert Soyer, Lasse Espeholt, Wojciech Czarnecki, Simon Schmitt, and Hado van Hasselt. 2019. Multi-task deep reinforcement learning with popart. In Proceedings of the AAAI Conference on Artificial Intelligence, Vol. 33(01). 3796–3803.
- Hughes et al. (2018) Edward Hughes, Joel Z. Leibo, Matthew G. Phillips, Karl Tuyls, Edgar A. Duéñez-Guzmán, Antonio García Castañeda, Iain Dunning, Tina Zhu, Kevin R. McKee, and Raphael et. al. Koster. 2018. Inequity aversion improves cooperation in intertemporal social dilemmas. arXiv preprint arXiv:1803.08884 (2018).
- Hume (2012) David Hume. 1739/2012. A treatise of human nature. Courier Corporation.
- Jabbari et al. (2017) Shahin Jabbari, Matthew Joseph, Michael Kearns, Jamie Morgenstern, and Aaron Roth. 2017. Fairness in reinforcement learning. In International Conference on Machine Learning. PMLR, 1617–1626.
- Jaderberg et al. (2016) Max Jaderberg, Volodymyr Mnih, Wojciech Marian Czarnecki, Tom Schaul, Joel Z Leibo, David Silver, and Koray Kavukcuoglu. 2016. Reinforcement learning with Unsupervised Auxiliary Tasks. arXiv preprint arXiv:1611.05397 (2016).
- Joseph et al. (2016) Matthew Joseph, Michael Kearns, Jamie Morgenstern, and Aaron Roth. 2016. Fairness in learning: classic and contextual bandits. In Proceedings of the 30th International Conference on Neural Information Processing Systems. 325–333.
- Kamiran and Calders (2012) Faisal Kamiran and Toon Calders. 2012. Data preprocessing techniques for classification without discrimination. Knowledge and Information Systems 33, 1 (2012), 1–33.
- Kleiman-Weiner et al. (2016) Max Kleiman-Weiner, Mark K Ho, Joseph L Austerweil, Michael L Littman, and Joshua B Tenenbaum. 2016. Coordinate to cooperate or compete: abstract goals and joint intentions in social interaction. In CogSci.
- Köster et al. (2020) Raphael Köster, Kevin R. McKee, Richard Everett, Laura Weidinger, William S. Isaac, Edward Hughes, Edgar A. Duéñez-Guzmán, Thore Graepel, Matthew Botvinick, and Joel Z. Leibo. 2020. Model-free conventions in multi-agent reinforcement learning with heterogeneous preferences. arXiv preprint arXiv:2010.09054 (2020).
- Kurzban and Leary (2001) Robert Kurzban and Mark R. Leary. 2001. Evolutionary origins of stigmatization: the functions of social exclusion. Psychological bulletin 127, 2 (2001), 187.
- Lacoste et al. (2019) Alexandre Lacoste, Alexandra Luccioni, Victor Schmidt, and Thomas Dandres. 2019. Quantifying the Carbon Emissions of Machine Learning. arXiv preprint arXiv:1910.09700 (2019).
- Lai et al. (2016) Calvin K Lai, Allison L Skinner, Erin Cooley, Sohad Murrar, Markus Brauer, Thierry Devos, Jimmy Calanchini, Y Jenny Xiao, Christina Pedram, Christopher K Marshburn, et al. 2016. Reducing implicit racial preferences: II. Intervention effectiveness across time. Journal of Experimental Psychology: General 145, 8 (2016), 1001.
- Lamme and Roelfsema (2000) Victor A. F. Lamme and Pieter R. Roelfsema. 2000. The distinct modes of vision offered by feedforward and recurrent processing. Trends in neurosciences 23, 11 (2000), 571–579.
- Lazaridou et al. (2020) Angeliki Lazaridou, Anna Potapenko, and Olivier Tieleman. 2020. Multi-agent communication meets natural language: Synergies between functional and structural language learning. arXiv preprint arXiv:2005.07064 (2020).
- Leibo et al. (2017) Joel Z. Leibo, Vinicius Zambaldi, Marc Lanctot, Janusz Marecki, and Thore Graepel. 2017. Multi-agent Reinforcement Learning in Sequential Social Dilemmas. In Proceedings of the 16th International Conference on Autonomous Agents and Multiagent Systems (AA-MAS 2017). Sao Paulo, Brazil.
- Lerer and Peysakhovich (2017) Adam Lerer and Alexander Peysakhovich. 2017. Maintaining cooperation in complex social dilemmas using deep reinforcement learning. arXiv preprint arXiv:1707.01068 (2017).
- Lerer and Peysakhovich (2019) Adam Lerer and Alexander Peysakhovich. 2019. Learning existing social conventions via observationally augmented self-play. In Proceedings of the 2019 AAAI/ACM Conference on AI, Ethics, and Society. 107–114.
- Li et al. (2020) Danielle Li, Lindsey R. Raymond, and Peter Bergman. 2020. Hiring as Exploration. Technical Report. National Bureau of Economic Research.
- Liu et al. (2018) Lydia T. Liu, Sarah Dean, Esther Rolf, Max Simchowitz, and Moritz Hardt. 2018. Delayed Impact of Fair Machine Learning. In Proceedings of the 35th International Conference on Machine Learning. 3150–3158.
- Macy and Flache (2002) Michael W Macy and Andreas Flache. 2002. Learning dynamics in social dilemmas. Proceedings of the National Academy of Sciences 99, suppl 3 (2002), 7229–7236.
- Maitzen (1991) Stephen Maitzen. 1991. The ethics of statistical discrimination. Social Theory and Practice 17, 1 (1991), 23–45.
- McKee et al. (2021) Kevin R. McKee, Edward Hughes, Tina O. Zhu, Martin J. Chadwick, Raphael Koster, Antonio García Castaneda, Charlie Beattie, Thore Graepel, Matt Botvinick, and Joel Z. Leibo. 2021. Deep reinforcement learning models the emergent dynamics of human cooperation. arXiv preprint arXiv:2103.04982 (2021).
- Mehrabi et al. (2019) Ninareh Mehrabi, Fred Morstatter, Nripsuta Saxena, Kristina Lerman, and Aram Galstyan. 2019. A survey on bias and fairness in machine learning. arXiv preprint arXiv:1908.09635 (2019).
- Mitchell et al. (2018) Shira Mitchell, Eric Potash, Solon Barocas, Alexander D’Amour, and Kristian Lum. 2018. Prediction-based decisions and fairness: A catalogue of choices, assumptions, and definitions. arXiv:1811.07867
- Mnih et al. (2016) Volodymyr Mnih, Adria Puigdomenech Badia, Mehdi Mirza, Alex Graves, Timothy Lillicrap, Tim Harley, David Silver, and Koray Kavukcuoglu. 2016. Asynchronous methods for deep reinforcement learning. In International conference on machine learning. PMLR, 1928–1937.
- Noë and Hammerstein (1994) Ronald Noë and Peter Hammerstein. 1994. Biological markets: supply and demand determine the effect of partner choice in cooperation, mutualism and mating. Behavioral ecology and sociobiology 35, 1 (1994), 1–11.
- Nowak (2006) Martin A. Nowak. 2006. Five Rules for the Evolution of Cooperation. Science 314, 5805 (08 Dec. 2006), 1560–1563. https://doi.org/10.1126/science.1133755
- Nowak and May (1992) Martin A. Nowak and Robert M. May. 1992. Evolutionary games and spatial chaos. Nature 359, 6357 (16 Jan. 1992), 826–9. https://doi.org/10.1038/355250a0
- Oord et al. (2018) Aaron van den Oord, Yazhe Li, and Oriol Vinyals. 2018. Representation Learning with Contrastive Predictive Coding. arXiv preprint arXiv:1807.03748 (2018).
- Ouwerkerk et al. (2005) Jaap W. Ouwerkerk, Norbert L. Kerr, Marcello Gallucci, and Paul A. M. Van Lange. 2005. Avoiding the social death penalty: Ostracism and cooperation in social dilemmas. The social outcast: Ostracism, social exclusion, rejection, and bullying (2005), 321–332.
- Paluck et al. (2019) Elizabeth Levy Paluck, Seth A. Green, and Donald P. Green. 2019. The contact hypothesis re-evaluated. Behavioural Public Policy 3, 2 (2019), 129–158. https://doi.org/10.1017/bpp.2018.25
- Pérolat et al. (2017) Julien Pérolat, Joel Z. Leibo, Vinícius Flores Zambaldi, Charles Beattie, Karl Tuyls, and Thore Graepel. 2017. A multi-agent reinforcement learning model of common-pool resource appropriation. In Advances in Neural Information Processing Systems 30: Annual Conference on Neural Information Processing Systems 2017, December 4-9, 2017, Long Beach, CA, USA. 3643–3652. https://proceedings.neurips.cc/paper/2017/hash/2b0f658cbffd284984fb11d90254081f-Abstract.html
- Peysakhovich and Lerer (2018) Alexander Peysakhovich and Adam Lerer. 2018. Towards ai that can solve social dilemmas. In 2018 AAAI Spring Symposium Series.
- Phelps (1972) Edmund S. Phelps. 1972. The Statistical Theory of Racism and Sexism. The American Economic Review 62, 4 (1972), 659–661.
- Rapoport et al. (1965) Anatol Rapoport, Albert M Chammah, and Carol J Orwant. 1965. Prisoner’s dilemma: A study in conflict and cooperation. Vol. 165. University of Michigan press.
- Rousseau (2009) Jean-Jacques Rousseau. 2009. Discourse on Inequality: On the Origin and Basis of Inequality Among Men. The Floating Press.
- Rubinstein (2013) Ariel Rubinstein. 2013. Response time and decision making: An experimental study. Judgment & Decision Making 8, 5 (2013).
- Santos et al. (2006) Francisco C. Santos, Jorge M. Pacheco, and Tom Lenaerts. 2006. Cooperation prevails when individuals adjust their social ties. PLoS computational biology 2, 10 (20 Oct. 2006), e140+. https://doi.org/10.1371/journal.pcbi.0020140
- Schelling (1973) Thomas C. Schelling. 1973. Hockey helmets, concealed weapons, and daylight saving: A study of binary choices with externalities. Journal of Conflict resolution 17, 3 (1973), 381–428.
- Schino and Aureli (2009) Gabriele Schino and Filippo Aureli. 2009. Reciprocal altruism in primates: partner choice, cognition, and emotions. Advances in the Study of Behavior 39 (2009), 45–69.
- Schino and Aureli (2010) Gabriele Schino and Filippo Aureli. 2010. Primate reciprocity and its cognitive requirements. Evolutionary Anthropology: Issues, News, and Reviews 19, 4 (2010), 130–135.
- Schwab (1986) Stewart Schwab. 1986. Is statistical discrimination efficient? The American Economic Review 76, 1 (1986), 228–234.
- Shepard and Metzler (1971) Roger N. Shepard and Jacqueline Metzler. 1971. Mental rotation of three-dimensional objects. Science 171, 3972 (1971), 701–703.
- Simon (1957) Herbert A. Simon. 1957. Models of man; social and rational. Wiley.
- Skyrms (2001) Brian Skyrms. 2001. The stag hunt. In Proceedings and Addresses of the American Philosophical Association, Vol. 75. JSTOR, 31–41.
- Skyrms (2004) Brian Skyrms. 2004. The stag hunt and the evolution of social structure. Cambridge University Press.
- Söderberg and Fry (2016) Patrik Söderberg and Douglas P. Fry. 2016. Anthropological aspects of ostracism. In Ostracism, exclusion, and rejection. Routledge, 268–282.
- Song et al. (2019) H Francis Song, Abbas Abdolmaleki, Jost Tobias Springenberg, Aidan Clark, Hubert Soyer, Jack W Rae, Seb Noury, Arun Ahuja, Siqi Liu, Dhruva Tirumala, et al. 2019. V-MPO: On-policy maximum a posteriori policy optimization for discrete and continuous control. arXiv preprint arXiv:1909.12238 (2019).
- Stanley et al. (1993) E Stanley, Dan Ashlock, and Leigh Tesfatsion. 1993. Iterated prisoner’s dilemma with choice and refusal of partners. (1993).
- Thorpe et al. (1996) Simon Thorpe, Denis Fize, and Catherine Marlot. 1996. Speed of processing in the human visual system. nature 381, 6582 (1996), 520–522.
- Tooby and Cosmides (1988) John Tooby and Leda Cosmides. 1988. The evolution of war and its cognitive foundations. Institute for evolutionary studies technical report 88, 1 (1988), 1–15.
- Tuyls and Noeé (2005) Karl Tuyls and Ann Noeé. 2005. Evolutionary game theory and multi-agent reinforcement learning. The Knowledge Engineering Review 20, 1 (2005), 63–90.
- Verma and Rubin (2018) Sahil Verma and Julia Rubin. 2018. Fairness definitions explained. In IEEE/ACM International Workshop on Software Fairness.
- Wang et al. (2018) Jane X. Wang, Zeb Kurth-Nelson, Dharshan Kumaran, Dhruva Tirumala, Hubert Soyer, Joel Z. Leibo, Demis Hassabis, and Matthew Botvinick. 2018. Prefrontal cortex as a meta-reinforcement learning system. Nature neuroscience 21, 6 (2018), 860–868.
- Yzerbyt et al. (1998) Vincent Y. Yzerbyt, Anouk Rogier, and Susan T. Fiske. 1998. Group entitativity and social attribution: On translating situational constraints into stereotypes. Personality and Social Psychology Bulletin 24, 10 (1998), 1089–1103.
- Zhang et al. (2018) Brian Hu Zhang, Blake Lemoine, and Margaret Mitchell. 2018. Mitigating unwanted biases with adversarial learning. In Proceedings of the 2018 AAAI/ACM Conference on AI, Ethics, and Society. 335–340.
- Zhang and Shah (2014) Chongjie Zhang and Julie A. Shah. 2014. Fairness in Multi-Agent Sequential Decision-Making. In Advances in Neural Information Processing Systems, Vol. 27.
- Zhang et al. (2020) Xueru Zhang, Ruibo Tu, Yang Liu, Mingyan Liu, Hedvig Kjellström, Kun Zhang, and Cheng Zhang. 2020. How do fair decisions fare in long-term qualification?. In Advances in Neural Information Processing Systems.
- Zuiderveen Borgesius et al. (2018) Frederik Zuiderveen Borgesius et al. 2018. Discrimination, artificial intelligence, and algorithmic decision-making. Technical Report. Council of Europe.
7 Supplementary material
7.1 Analytical model
We assume a population of individuals that engage in pair-wise repeated interactions for up to steps. Each individual has a perceptible attribute , a partner sampling policy , and a behavior policy . We assume the set of perceptible attributes is discrete, and will be referred to as colors. Both the sampling policy and the behavior policy can depend on the perceptible attributes, the history of past interactions with a particular individual, or even on hidden information like the behavior policy of other individuals.
In each interaction, individuals play a symmetric game with two strategies and corresponding to cooperation and defection, respectively. The payoff of the game is given by a matrix with two rows ( and ) corresponding to the strategies available to the focal agent, and two columns ( and also) corresponding to the strategies of the co-interactant. The payoff matrix is given by
where represents the reward of mutual cooperation, represents the sucker’s reward, represents the temptation to defect, and is the punishment reward for mutual defection (Rapoport et al., 1965). In social dilemmas, there is an incentive to defect, either as a temptation from mutual cooperation, or as risk-avoidance from mutual defection, or both. For Stag Hunt, , which implies there is no temptation to defect once there is mutual cooperation, but there is a risk-avoidance incentive to defect. This is sometimes referred to as a lack of greed and presence of fear (Macy and Flache, 2002). Notice that the payoff matrix need not be symmetric. The term symmetric in symmetric game refers to the symmetry of player roles and strategy payoff, rather than the properties of the matrix itself.
7.1.1 Behavior policy
The behavior policy determines both if the relationship should continue or end; and the strategy to play in the next interaction. When the relationship ends, a new partner will be sampled and this interaction will not count towards the steps. Formally,
where is the set of all possible information states available to the individual, and (as discussed above) can include histories of interactions with current and past partners, revealed information about non-partners, and even hidden information about individuals. And is the set of probabilities over the two strategies and , and the termination action . We use the notation to denote the probability of playing strategy given the history and the color of the partner . In practice, we often consider deterministic policies, in which case we use the strategy itself as the output of the policy (e.g. ). The special action denotes the end of a relationship.
7.1.2 Partner sampling policy
A partner sampling policy determines the next individual to interact with. This function can represent a completely uniform sample over all individuals, or sampling exclusively individuals with a particular color, and even an oracle that always samples a cooperator. We will restrict what information can be used in a sampling function as a stand-in for an individual’s ability to process and incorporate information. So, an individual that has no memory will only have access to the color of other individuals, while an omniscient individual will have access to even the private information of other individuals from the start. There are many other possibilities in between, and we will discuss some later on.
In many cases, we will assume that every time an individual samples a new interaction partner, it is one they have never interacted with before111This simplification enables us to avoid keeping track of the histories of previous interactions inducing a more tractable model. This simplification corresponds to an extreme situation in which when once somebody you have interacted with proves themselves socially-unreliable, you don’t ever want to interact with them again.. Formally, is a function mapping populations to distributions over populations, i.e.
where is the set of all probability distributions over the discrete set . Thus, we use to denote the probability of sampling individual .
We define as the probability that a sampled individual will cooperate in the interaction. Formally, for a focal individual with information state let be the subset of the population that will cooperate in the next interaction with the focal individual. Then
Individuals don’t have access to , but it can be used to abstract out all the complexities of partner choice and express an individual’s payoff in its terms.
In practice, we will restrict ourselves to 3 different partner sampling functions:
A visual function which takes into account only the color of the individuals in the population. Always samples partners of the color with the highest probability of cooperation (i.e. for ).
A aware function that samples like the visual function on the first interaction, but on any subsequent partner samplings, it selects always a cooperator (i.e. is the same as the one for visual on the first interactions, and for all interactions after the first one). This is representing an individual who is initially unaware of the other individuals’ policies, but after one interaction with any individual, it observes the policy of all individuals. This is an extreme case of an individual that is not cheating (in the sense of having access to hidden information of other individuals), but is able to observe and infer correctly all information of all other interactions in the population at the first opportunity.
Finally, an omniscient function that always samples a cooperator (i.e. always). This is a cheating individual, and is used only to provide the upper bound on possible performance.
7.1.3 Broad behavior classes
For the purposes of this article, we will focus on assessing only two extreme classes of behaviors. Unconditional behaviors, where the information state comprises only the color (i.e. is only a function of ). And reciprocating behaviors, where the always starts with cooperation with new relationships, and ends the relationship whenever the partner defects, that is, the strategy ignores color (i.e. is only a function of the partner’s strategy in the previous interaction). Formally,
where is the strategy to play in a new interaction (i.e. one with empty history), and denotes the strategy played by the partner in the previous interaction.
7.1.4 Individual payoffs
We now focus on the payoff of a focal individual and find out under which conditions each of the broad behaviors above are favoured. Let be the payoff at step of an individual with information state , sampling policy , and behavior with a partner with information state and policies and . Often, we will omit some or all of the parameters to when they are clear from context. We can write recursively as
Unconditional behaviors.
For unconditional behaviors against partner color we have two possibilities, either unconditional defection or unconditional cooperation .
If the partner is also using an unconditional behavior using visual partner sampling, the payoffs simplify to
| (7) | ||||
| (8) |
Observe that whether cooperation or defection yields higher payoff depends solely on (and thus, indirectly on the sampling function and the color of the partner) and the payoff matrix. An individual would prefer to unconditionally cooperate whenever
which, by combining Equations (7) and (8), for unconditional behavior partners happens if and only if
This inequality has some interesting properties. The left hand side corresponds to the odds ratio of encountering a cooperator versus a defector when sampling partners. The right hand side is the ratio of payoffs associated with cooperation and defection, against an unknown strategy. This payoffs ratio is the threshold beyond which cooperation is favoured. We refer to this quantity as the stakes of interaction. For Stag Hunt, where and , the stakes are always positive. Since , there is always some value of such that the inequality is satisfied. Note that for the Prisoner’s Dilemma, the stakes are negative, which flips the direction of the inequality and makes it unsatisfiable.
Even within the family of unconditional behaviors, it would be payoff-maximising to play different strategies against different colored partners, depending on whether the odds ratio of finding a cooperation () of that color exceed the stakes of the interaction. We will denote this unconditional strategy that picks the best of or for each color as . Additionally, the payoff-maximising partner sampling function is simply to sample from the color that has the highest empirical proportion of initial cooperators .
In practice, we will just assume an unconditional cooperator, or unconditional defector policy.
Reciprocating behaviors.
From here on we assume that partnerships are never ended when agents are in mutual cooperation. This is a reasonable assumption when the dynamics of interactions are governed by a Stag Hunt payoff matrix, because mutual cooperation is both a Nash equilibrium and the collective payoff maximising outcome. Therefore, there isn’t any incentive from any partner to end the relationship. And since reciprocators end the relationship immediately upon defection of their partner, this is equivalent to having the choice of partnership ending only on the focal individual, which simplifies the derivations substantially.
If an individual is using a visual sampling function, we can expand and simplify the recursive equation into
We can simplify the coefficient of the term as follows
which yields the final equation
| (9) |
If an individual is using an aware sampling function, we simplify further as
| (10) |
And with aware sampling, we obtain the theoretical maximum payoff of
| (11) |
7.1.5 Behavioral dominance
Using the computed payoffs of a focal individual pursuing either unconditional or reciprocating behaviors, we now determine the conditions for reciprocating behaviors to dominate unconditional behaviors, as well as the optimal partner sampling policy for these behaviors.
Notice that the payoff for an omniscient reciprocator is greater than that of an aware reciprocator which in itself is greater than that of a visual reciprocator. Therefore, we only need to compare the payoff of an unconditional behavior with a visual reciprocator.
Formally, reciprocating dominates unconditional behaviors if and only if
Now, if there is at least one color with an odds ratio of cooperators above the stakes, then we need only look at the second inequality, which simplifies to
which is satisfied for sufficiently large .
7.2 Reinforcement learning model
We build an environment called boat race using DMLab2D (Beattie et al., 2020), which is a configurable and performant library for creating multi-agent 2D environments. The environment consists of objects and avatars, where each avatar is controlled by a single agent, and the avatars can be used to interact with objects. We will refer to an agent controlling an avatar as a player, and we will refer to a player’s actions or observations as they pertain to their avatar.
An episode on the environment consists of a number of races that is either or . Each race is separated in phases, a partner choice phase lasting steps, a semaphore changing phase lasting steps, and a rowing phase lasting steps. Each race runs in the opposite direction of the previous one, alternating North and South directions.
The objects in the environment are:
-
•
Apples. Players entering the same location as the apple consume the apple and receive a reward. The apple will respawn depending on its location: at the end of a race for apples above the river; and with a probability of per step for the apples on the goal river bank.
-
•
Barriers. Barriers prevent players from entering their location, and are used to gate access to the boats before the rowing phase of the race starts.
-
•
Semaphores. These are impassable objects that show a traffic-light pattern signaling the transition from the partner choice phase to the rowing phase of a race. They are colored red during partner choice, and change to yellow for the steps of the semaphore changing phase, and then to green in the rowing phase of the race.
-
•
Boat. Boats have two seats that players can enter. Once a player enters a seat, they control the oar next to it with their rowing actions. Players in a seat cannot move anymore, and all of their movement actions are no-ops. Boats can only move during the rowing phase of a race, and require two players, one on each seat to move. When a boat reaches the opposite river bank, it automatically disembarks its players into the river bank, past the barriers.
-
•
Water. Water is impassable by players on foot (i.e. not in a boat). Boats with players can travel across water.
Episodes start with boats on the South river bank, with no apples on that bank, and its barriers closed. The North bank contains apples and its barriers are open. Once the rowing phase starts, the barriers toggle with the North ones being blocked and the South ones being open. At the beginning of the next race, apples on river banks also toggle, with the South ones appearing, and the North ones disappearing.
Players have movement actions and rowing actions. The players can move in any of the cardinal directions (North, East, South or West), and can also turn degrees left or right. There are two rowing actions: paddle and flail. Rowing actions are considered no-ops when the players are not on a boat seat. Similarly, movement actions are no-ops when players are on a seat. Flailing actions can be executed at every time step, and have a probability (non-cumulative for each player) of moving the boat forward at each time step. Paddling actions have a cool down of steps, meaning the can only be executed every steps. Paddling during the cool down period are considered no-ops. Paddling by a partner during the cool down phase will result in the boat moving cell. Flailing by a partner during the cool down phase results in a reward punishment of and the paddling attempt is wasted, and progress can only be made by flailing until the cool down ends.
Players have partial observability of cells around them, with cell to each side of their position, cell behind, and in front. They perceive their environment as RGB images of size (sprites are ). Players who do not reach the other side of the river by the end of the race are disqualified and removed from the episode. The agent’s observations in this case are fully black (zeros) and all their actions are no-ops.
Agents have a persistent color across episodes, which is instantiated as an avatar of that color in the level. Avatars can be of two colors: purple (base RGB ) and teal (base RGB ). In addition, the avatar is assigned a random badge for each episode, used to uniquely identify the players, but only within that episode. The badge is a set of pixels that can be either black or white. The color of the agent is more salient than the badge.
Apples on the river banks respawned at a rate of per timestep, and confer a reward of to the player who eats them.
7.2.1 Agent details
All agent architectures had the same size convolutional net with two layers with output channels and , with a stride of pixels. The convolutional net was followed by a feedforward net with two layers, both with output units. Agents with LSTM, have a hidden state of size , using an unroll length of . Agents were trained on mini-batches of data of size . V-MPO had a pop-art layer (Hessel et al., 2019) for normalizing the value function. A3C minimized a contrastive predictive coding loss (Oord et al., 2018) in the manner of an auxiliary objective (Jaderberg et al., 2016), which in this case contrasted between nearby time points via LSTM state representations (a standard augmentation in recent work with A3C).
Agents for the training community and the production of the Schelling diagram were trained for steps, whereas naive learners were trained for steps. We used a learning rate of for A3C agents and for V-MPO agents.
Agents for the training community and Schelling diagram were incentivized to either unconditionally paddle or unconditionally flail. These agents receive a reward of for every rowing that matches their incentive, and if it didn’t. Agents overwhelmingly learned to use their incentivized rowing. Across episodes, paddlers never flailed in either races or races. Flailers paddled only twice out of over flailing actions, and only in the case of races. Community bots did not exhibit any significant preference towards a particular boat, or a particular side seat within the boat (see Figure 6).
Out of episodes used for evaluation for each architecture, we counted the number of times the naive learner paddled and flailed (see Table 1). Given that paddling has a cool down, flailing would be expected to be 3 times as frequent if agents were rowing at random. Naive learners primarily learned to paddle, with the weakest case being the A3C agent with LSTM, where the absolute flailing was greater than the absolute paddling, but only by a factor of two. We also calculated the correlation of the paddling and flailing on the first race of the naive learner with its partner. Overall, there was a positive correlation between the flailing for agents without an LSTM. The rest of the correlations were low (see Table 1).
| Architecture | # flail | # paddle | flail corr. | paddle corr. |
|---|---|---|---|---|
| A3C LSTM | 34,062 | 17,604 | 0.07 | -0.12 |
| A3C no LSTM | 19,525 | 31,217 | 0.26 | 0.03 |
| VMPO LSTM | 8,767 | 20,370 | 0.06 | 0.10 |
| VMPO no LSTM | 18,120 | 27,756 | 0.21 | -0.02 |
7.3 Discrimination index
We define the association matrix of a naive learner as a matrix of counts where corresponds to the number of times the naive learner shared a boat with a bot with color and strategy . We define the participation of an agent as the sum of the entries in their association matrix . We define the discrimination index of a naive learner as
For simplicity, let’s rename the entries of as and . Without loss of generality, , thus there are 4 cases: , , , or . Note that . Otherwise or or which is always even.
We simulated an individual sampling partners according to a particular strategy. Figures 7 and 8 show the histogram over simulations of an individual sampling uniformly at random, or sampling only based on one color, when present. We assume that the other players are of a random color and random strategy, and that the focal individual always has first choice of partner.
Figures 9 and 10 show the discrimination index as a value of the training community bias, as measured in an unbiased evaluation community. A clear pattern of higher community bias resulting in higher discrimination index is seen throughout.