A molecular perspective on induced charges on a metallic surface
Abstract
Understanding the response of the surface of metallic solids to external electric field sources is crucial to characterize electrode-electrolyte interfaces. Continuum electrostatics offer a simple description of the induced charge density at the electrode surface. However, such a simple description does not take into account features related to the atomic structure of the solid and to the molecular nature of the solvent and of the dissolved ions. In order to illustrate such effects and assess the ability of continuum electrostatics to describe the induced charge distribution, we investigate the behaviour of a gold electrode interacting with sodium or chloride ions fixed at various positions, in vacuum or in water, using all-atom constant-potential classical molecular dynamics simulations. Our analysis highlights important similarities between the two approaches, especially in vacuum conditions and when the ion is sufficiently far from the surface, as well as some limitations of the continuum description, namely neglecting the charges induced by the adsorbed solvent molecules and the screening effect of the solvent when the ion is close to the surface. While the detailed features of the charge distribution are system-specific, we expect some of our generic conclusions on the induced charge density to hold for other ions, solvents and electrode surfaces. Beyond this particular case, the present study also illustrates the relevance of such molecular simulations to serve as a reference for the design of improved implicit solvent models of electrode-electrolyte interfaces.
I Introduction
The properties of metal/electrolyte interfaces result from the interplay between, on the one hand, the electronic response of the metal to the charge distribution arising from the solvent molecules and dissolved ions and, on the other hand, the reorganization of the latter in response to the charge distribution at the surface of the metal. From a classical point of view, in perfect metals there is no polarization charge or electric field within the material and the excess or default of electronic density in the presence of an external perturbation is localized only at the surface of the metal. On the electrolyte side, under the effect of thermal fluctuations, the ionic charges are also screened by polar solvents, as well as the ionic cloud formed by the other ions.
In the continuum picture, the charge density induced at the surface of a perfect metal by a point charge in a semi-infinite medium characterized by a relative permittivity ( for vacuum) is given by [1]
| (1) |
with the distance of the ion from the metallic surface and the radial distance from the ion along the surface. This surface charge distribution corresponds to the electric field at the interface between the dielectric medium and the metal, which is identical, outside of the solid, to the field arising when the metal is replaced by a medium with permittivity and a so-called “image charge” placed symmetrically to the ion with respect to the interface. The effect of the solvent is thus limited to decreasing the induced charge by a factor . Such a description neglects many features of real interfaces, including the atomic and electronic structure of the metallic solid as well as the molecular nature of the solvent and ions of the electrolyte.
Importantly, the presence of an interface modifies the dielectric response of a polar solvent [2, 3] and classical molecular simulations allowed to compute permittivity profiles for interfacial and confined water. This in turn modifies other interfacial properties, such as the capacitance or electrokinetic effects [4, 5, 6, 7, 8, 9, 10, 11]. In addition, the response of the electronic distribution of the metal to an external perturbation, in particular the fact that its interface with vacuum is not infinitely sharp has been considered within Density Functional Theory (DFT), already in early studies in a simplified 1D geometry [12] and nowadays with more advanced functionals and atomically resolved surfaces [13, 14].
In order to investigate the interface between electrodes and electrolytes taking into account atomic and molecular features, it is possible to resort to DFT-based ab initio molecular simulations [15, 16, 17, 18, 19]. The computational cost associated with such studies, which accurately describe the electronic density on both the metal and electrolyte sides, renders the sampling of the configurations of the latter difficult, especially for large systems. Several strategies have been introduced to capture the electronic response of the metal in classical molecular simulations (see Ref. 20 for a recent review). Such methods include descriptions based on fluctuating charges [21, 22, 23, 24, 25, 26], core-shell models [27, 28], explicit image charges [29], induced charges on surfaces [30, 31] or Green functions [32].
Such simulations allowed in particular to study the effect of the polarization of the metal on the interfacial structure, dynamics and capacitance, the adsorption of ions and biomolecules, or solid-liquid friction, for a variety of electrodes such as gold, platinum or graphite and liquids, from pure water and solutions of simple salts to water-in-salt electrolytes, polyelectrolytes and biomolecules in solution and ionic liquids[33, 34, 35, 28, 36, 37, 38]. They also emphasized the combined role of the atomic structure of the metal and molecular nature of water in the overall hydrophilic/phobic behaviour of the interface [39, 40]. From a more fundamental point of view, the fluctuations of the charge of the electrode in constant-potential simulations reflect the statistics of the microscopic configurations in the corresponding thermodynamic ensemble. In particular, fluctuation-dissipation relation linking the variance of the charge distribution to the differential capacitance of the system has already been considered in DFT-based ab initio molecular dynamics simulations [41], classical Monte Carlo [42] and molecular dynamics [43, 44, 45, 46] simulations, and more recently in Brownian Dynamics with an implicit solvent [47].
In the present work, we investigate the charge distribution induced on an atomically resolved metallic surface by a single ion in vacuum or in the presence of a molecular solvent. Using classical molecular simulations, we consider the Na+ cation and the Cl- anion in water, at various distances from a (100) surface of a model gold electrode. This particular example allows us to highlight some expected limitations of the continuum picture and simultaneously illustrates how such simulations can provide a reference for improved implicit-solvent models of these interfaces. After describing the system and methods in Section II, we present the molecular simulation results for the charge distribution induced by an ion in vacuum and in water in Section III. We then compare these results with the predictions of continuum electrostatics in Section IV.
II Methods
II.1 Simulation details
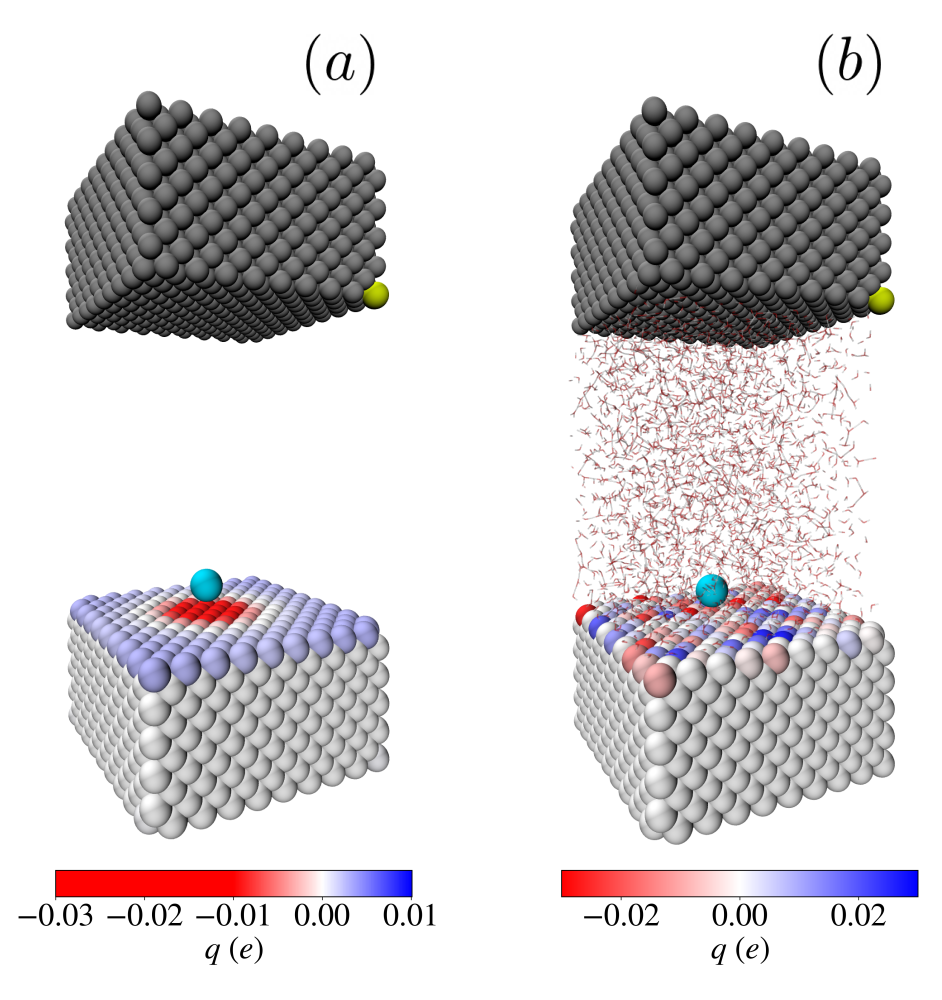
In order to investigate the charges induced by an external charge in a metallic surface and the effect of the solvent, we considered the two systems illustrated in Fig. 1. Each system embeds two confining walls, separated by a distance Å. Each wall consists of 1620 atoms on an FCC lattice ( unit cells with lattice parameter Å corresponding to gold), arranged in 10 atomic planes perpendicular to the direction and facing the inner part of the system with a plane. Only one wall is treated as metallic, using the fluctuating charge model in which each (electrode) atom is equipped with a Gaussian charge of width Å, with magnitude determined for each configuration of the ion and solvent molecules in order to impose a constraint of constant potential (we considered without loss of generality a value of 0 V) and the constraint of overall electroneutrality [21, 22, 46]. Specifically, each electrode atom at position contributes to the total charge density as:
| (2) |
The opposite wall has the same structure but the atoms are treated as neutral.
The simulation box has dimensions Å and Å and periodic boundary conditions (PBC) were applied in the and directions only. The ion (Na+ or Cl-) is fixed at a position , where is expressed relative to the top electrode plane, which sets the reference . This corresponds to a site. Specifically, we consider , , , and Å. This set is based on the density profile of Na+ ions in the proximity of the gold electrode surface, reported in Fig. 4a in Ref. 48 for a 1M NaCl aqueous solution using the same description of the gold electrodes, water molecules and ions as in the present work. In particular, the first position corresponds to an ion in direct contact with the surface, the next three to maxima of the density profile (which decrease in intensity as the distance from the surface increases), while the last one represents a typical position in the ‘bulk’ of the solution. In order to enforce the electroneutrality of the charge distribution outside the metal, a counterion is placed on the surface of the opposite wall at . For the simulations in the presence of solvent, illustrated in Fig. 1b, the system also includes 2160 water molecules.
The atoms interact via electrostatic interactions, computed using a 2D Ewald summation method taking into account the Gaussian distributions of the electrode atoms [22, 49], and truncated and shifted Lennard Jones (LJ) potentials. Water molecules are modeled with the SPC/E force field [50] and the LJ parameters for the Na+ and Cl- ions are taken from Ref. 51 and those for the gold atoms from Ref. 52, with the Lorentz–Berthelot mixing rules. All simulations are performed using the molecular dynamics code Metalwalls [53], and the charge on the electrode is determined at each time step using the matrix inversion method [46]. For the ion in vacuum, a single step is sufficient to determine the charge on the wall atoms. For the ions in water, we performed simulations in the ensemble, using a Nosé-Hoover chain thermostat [54] with a time constant of 1 ps to enforce a temperature K; these simulations were run for at least 2 ns (after prior equilibration) using a time step of 2 fs. For the analysis detailed below, electrode charges and solvent configurations were sampled every 100 steps (0.2 ps) and every 1000 steps (2 ps), respectively. The uncertainties on the average atomic charges were estimated as the standard error for each electrode atom. These values were used to construct the upper and lower bounds of the induced charge densities (see Section II.2) by simply considering instead of the average values.
II.2 Data analysis
In order to analyze the charge induced within the metal, we reconstruct the 3D charge distribution from the atomic contributions (see Eq. 2),
| (3) |
where the sum runs over all electrode atoms (in the following, we consider sums per atomic plane or over all planes) and denotes an average in the canonical ensemble (such an average is not necessary for the ion in vacuum). Furthermore, in order to visualize the lateral distribution of the induced charge, we integrate over the direction to obtain the 2D charge density:
| (4) |
and also consider the radial average, to obtain:
| (5) |
as a function of the radial distance with respect to the ion. Finally, we also analyze the solvation of the ion close to the surface by computing the charge distribution arising from the solvent molecules as
| (6) |
where the sum runs over solvent atoms with partial charge and position expressed in cylindrical coordinates.
III Induced charge distribution
III.1 Ion in vacuum
Fig. 2 shows the 2D distribution, (see Eq. 4), of the charge induced in the gold electrode by a Na+ ion in vacuum for three distances of the ion to the top electrode plane. More precisely, panels 2a, 2b and 2c correspond to the charge induced in the first atomic plane, while panels 2d, 2e and 2f correspond to the charge induced in the second atomic plane. The charge induced in the other electrode planes is negligible (see appendix A), as observed previously [55]. In line with the continuum prediction Eq. 1, in the first plane the induced charge is negative (red color) close to the positive ion and its absolute value gradually decreases laterally away from the ion and as the distance of the ion from the surface increases. However, several features differ from this prediction.
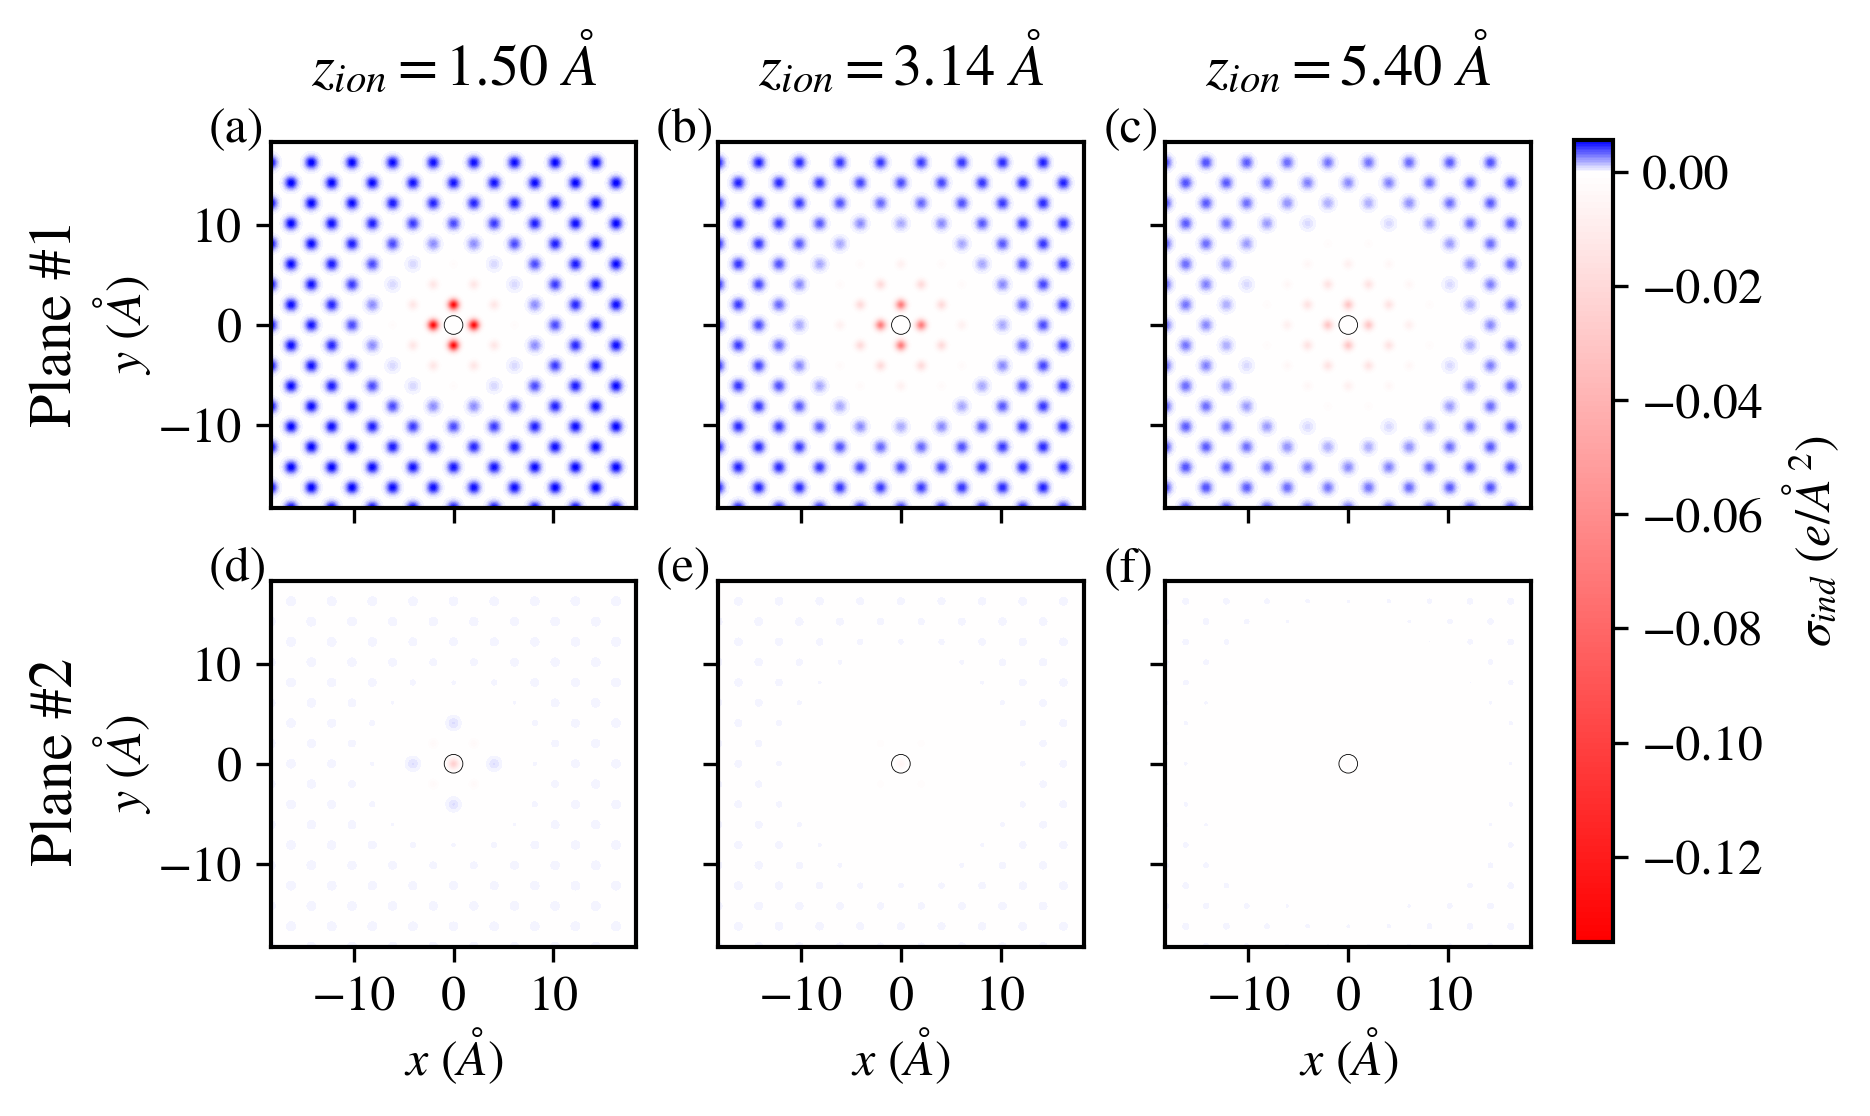
Firstly, the induced charges becomes positive (blue color) far from the ion, owing to the presence of the counterion and the resulting net electroneutrality of the electrode. Compared to the negative charge induced by the Na+ ion close to the surface, this positive charge induced by the counterion is approximately homogeneous, due to the relatively large distance of this ion from the surface and the PBC in the and directions (the effect of PBC will be discussed below). In fact, considering a homogeneous counter-charge distribution instead of a single counterion yielded almost the same results (see appendix B).
Secondly, we observe a square pattern reflecting the atomic lattice. The position of the ion, indicated by the central circle, is above an atom belonging to the second plane, where the magnitude of the induced charge is smaller than in the first, as expected. For the closest ion position (panels 2a and 2d), we note the presence of an additional positive charge in the second plane in the vicinity of the ion, probably resulting from the very large negative charge induced on the atoms of the first plane. Such an oscillatory behaviour is reminiscent of Friedel oscillations, even though the description is purely classical in the present case.
III.2 Ion in water
We now turn to the case of a Na+ ion in water, shown for the same ionic positions in Fig. 3. Unlike the previous case where a single charge calculation was necessary, the results are now averaged over equilibrium configurations of the solvent. The distribution of the induced charge is qualitatively similar to the vacuum case and the two features related to the presence of the counterion and to the atomic lattice of the electrode are also visible in the presence of the solvent. The main effect is an overall decrease in the magnitude of the induced charge (note the different scale with respect to Fig. 2), consistently with the idea of screening of the ionic charge by the polar solvent. However, the extent of this screening depends on the position of the ion with respect to the surface, as discussed below.
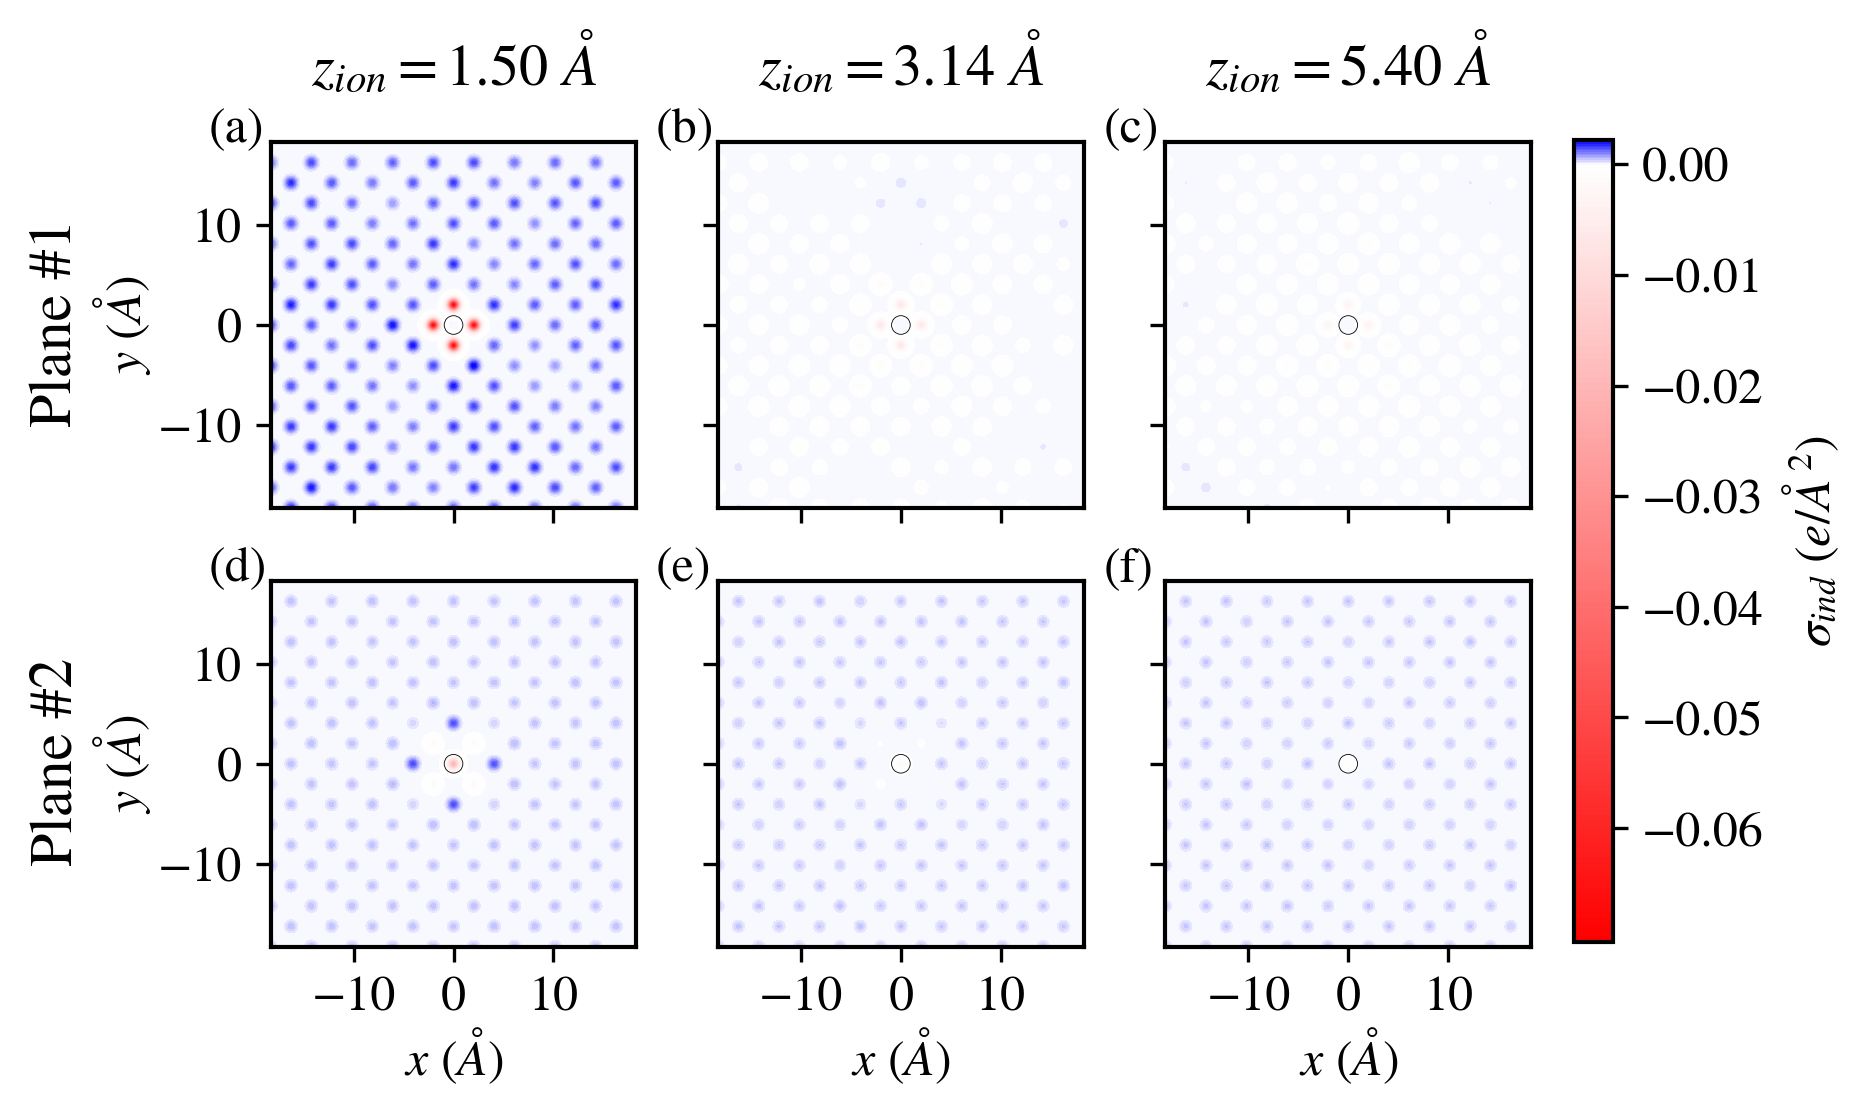
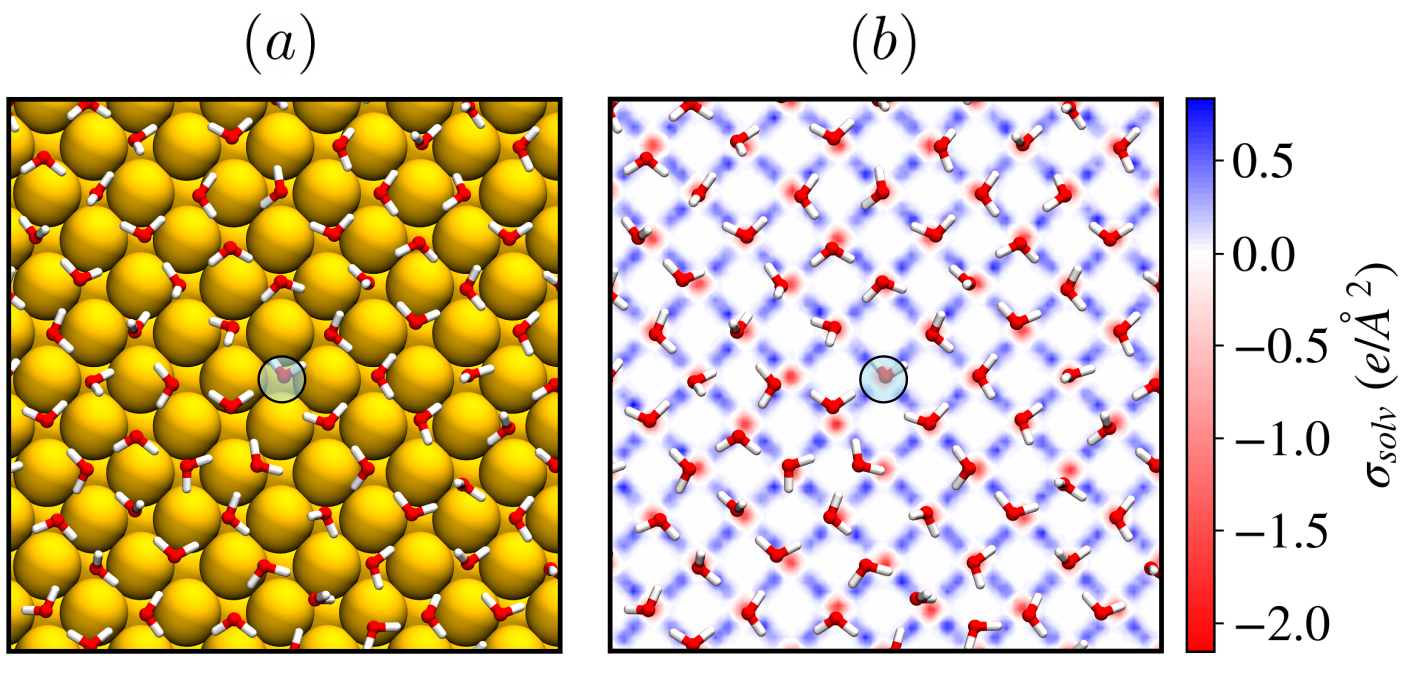
Beyond the mere screening of the ionic charge, we also note an important difference with the vacuum case, pertaining to the relative charge density of the first and second planes, most strikingly far from the ion. Indeed, in this region the charge density on the atoms of the second plane is more positive than on the first plane. Such an observation is inconsistent with the continuum picture and arises from the discreteness of water molecules. Indeed, in the first adsorbed layer molecules are located in the cavities formed by four gold atoms in the first plane and one atom in the second plane and form a network of (mainly in-plane) hydrogen bonds as shown for an instantaneous configuration in Fig 4a. The same water configuration is also shown in Fig. 4b together with the average charge density due to molecules in the adlayer (computed from O and H atoms at a distance smaller than 3.6 Å from the first atomic plane, which corresponds to the first minimum of the water density profile). The charge density map indicates the localization of hydrogen atoms between the oxygen basins, i.e. a relatively tight H-bond network. This organization of the adsorbed water layer is in turn reflected in the charge induced within the electrode of Fig. 3c (for the position of the ion corresponding to the configuration of Fig 4): While atoms in the first electrode plane are close to both O and H atoms, those of the second electrode layer are closer to the O atoms. The negative partial charge of these O atoms results in a positive charge induced on the atoms of the second plane over the whole surface, except possibly close to the ion.
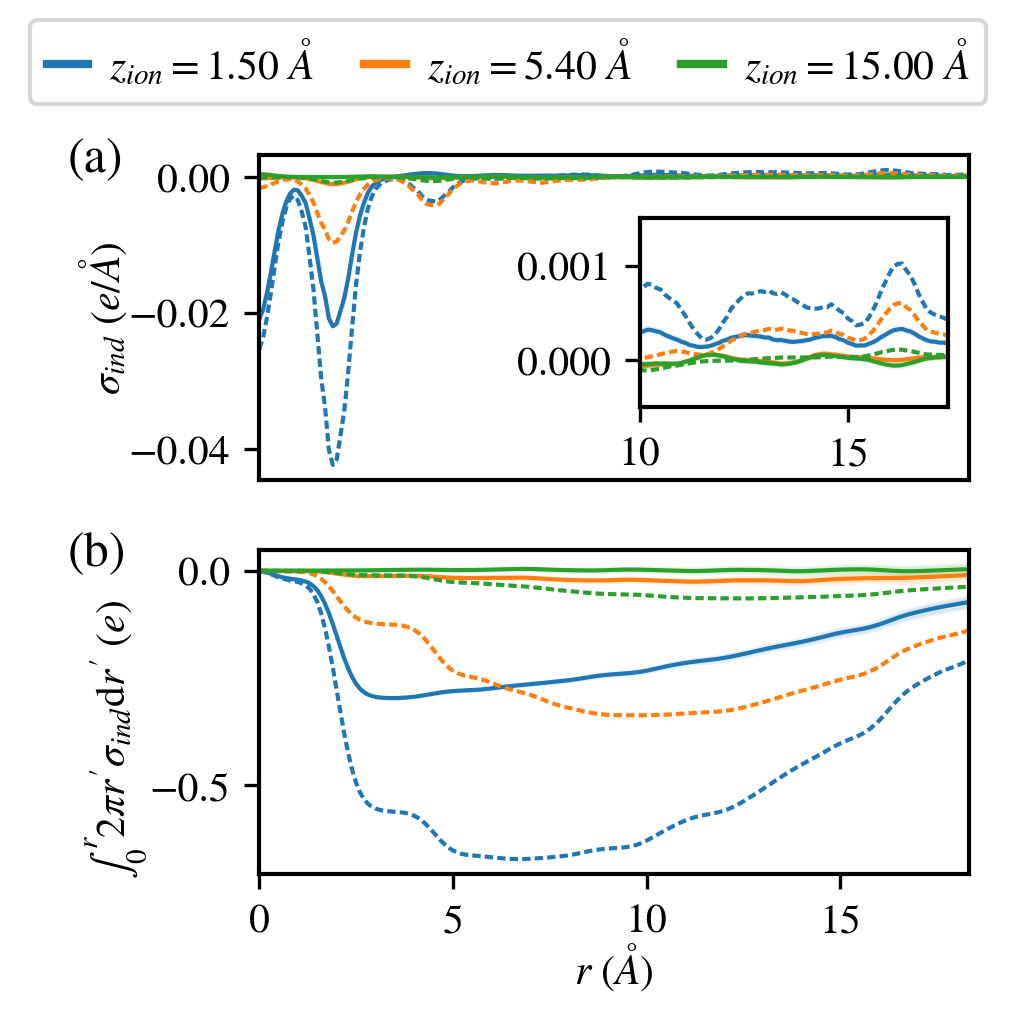
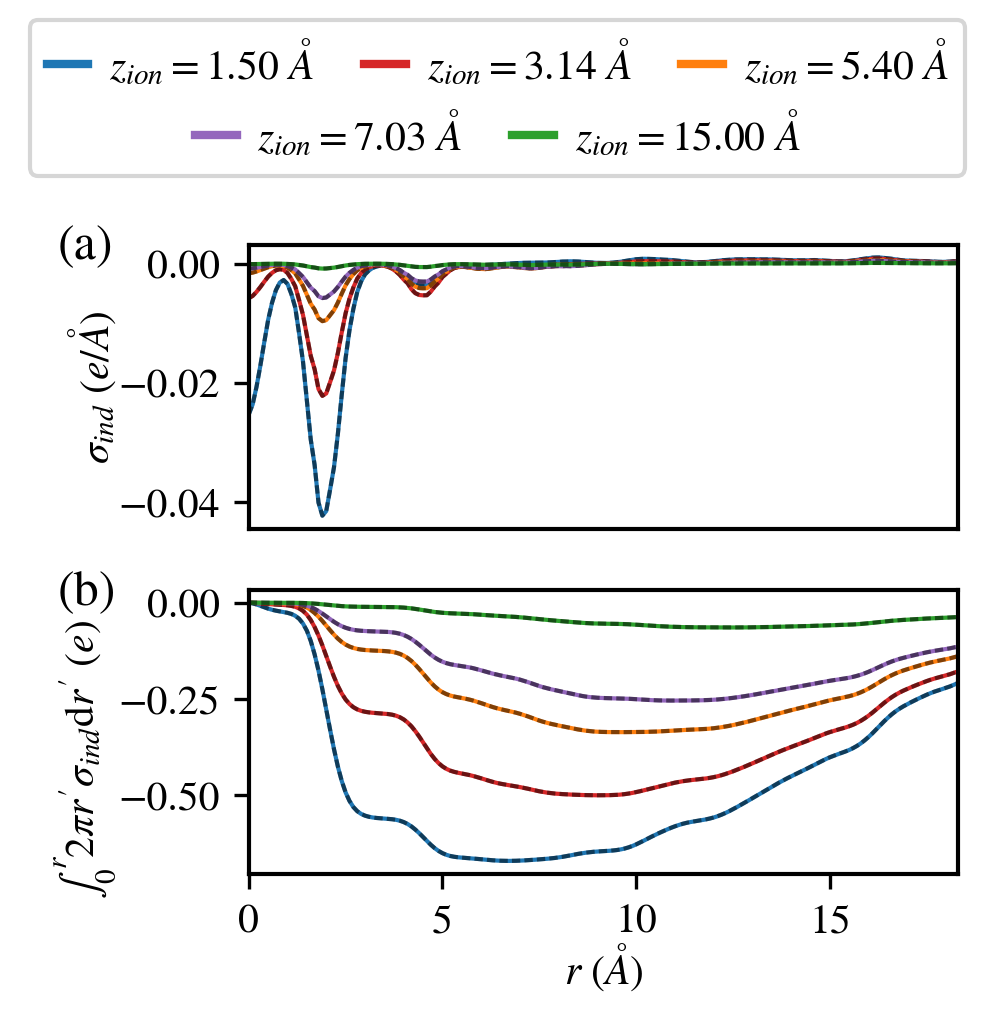
The screening effect of the solvent is even clearer when considering the radial charge density profiles, depicted in Fig. 5. The results are computed from Eq. 5 using the total charge distribution, i.e. summing over all electrode planes (only the first two planes contribute significantly, see appendix A), for three distances of the ion from the surface (, and Å). The oscillations of in panel 5a reflect the position of the electrode atoms: the negative minimum at corresponds to the Gaussian centered on the atom below the ion in the second plane, while the next minimum correspond to the nearest neighbours in the first plane. The comparison between the vacuum (dashed lines) and water (solid lines) cases shows the reduction of the induced charge density in the presence of the solvent, which is not identical for all the positions of the ion. In particular, for the closest position, Å, there is no water between the ion and the nearest electrode atoms, so that the charge distribution near the atom below in the second plane is hardly changed and the reduction for the nearest neighbours in the first plane is only reduced by a factor of . The decrease in with respect to the vacuum case is more pronounced when the ion is farther from the surface. The role of the water structure will be further examined in Section IV.3.
Fig. 5b further illustrates the integrated charge density, which provides a convenient way to analyze the behaviour far from the ion (shown in the inset of Fig. 5a). This representation clearly shows the radial distance at which the radially averaged density changes sign (this corresponds to the minimum of the integrated charge density). This distance systematically shifts towards larger values when the ion is farther from the surface, consistently with the increase in the spread of the charge distribution induced by the ion (see also Figs. 2 and 3). The integrated charge densities also better show that the overall screening effect is less pronounced when the ion is very close to the surface. In order to go beyond such a qualitative statement, we now compare these molecular simulation results with the predictions of continuum electrostatics.
IV Comparison with continuum electrostatics
IV.1 Ion in vacuum
Fig. 6 compares the atomistic results (solid lines) with the continuum prediction, Eq. 1, for a Na+ ion in vacuum () and three distances from the top electrode plane. The direct application of Eq. 1, i.e. considering only the ion in the simulation box and the corresponding counterion (dotted lines), fails to reproduce the oscillations of the induced charge density profiles, as described above, but its integral coincides reasonably well with the numerical results at short distance. However, it significantly deviates beyond Å. This observation is not due to the precise location of the counterion (which is much further from the surface than the ion of interest), as we obtain almost identical results placing it in one corner of the simulation box, aligned with the ion in the center of the box, or replacing it by four charges at the corners or the box (not shown).
Rather, the discrepancy is essentially due to the fact that the simulated system is periodic in the and directions, so that the ionic distribution corresponds in fact to a 2D-periodic array of ions and counterions. The necessity to take periodic images into account to compare with the analytical prediction was already pointed out by Reed et al. [22]. We do this numerically by considering 4141 ion/counterions, i.e. the central ones and 20 images in all directions, which is sufficient to converge the sum. The prediction of Eq. 1 for the integrated charged density (panel 6b) is then in good agreement with the atomistic results over the whole range of considered distances, except for the oscillations at short distance due to the atomic structure of the electrode, as expected. In the following, we therefore compare with the continuum prediction in the presence of water only taking into account the periodic boundary conditions.
IV.2 Ion in water
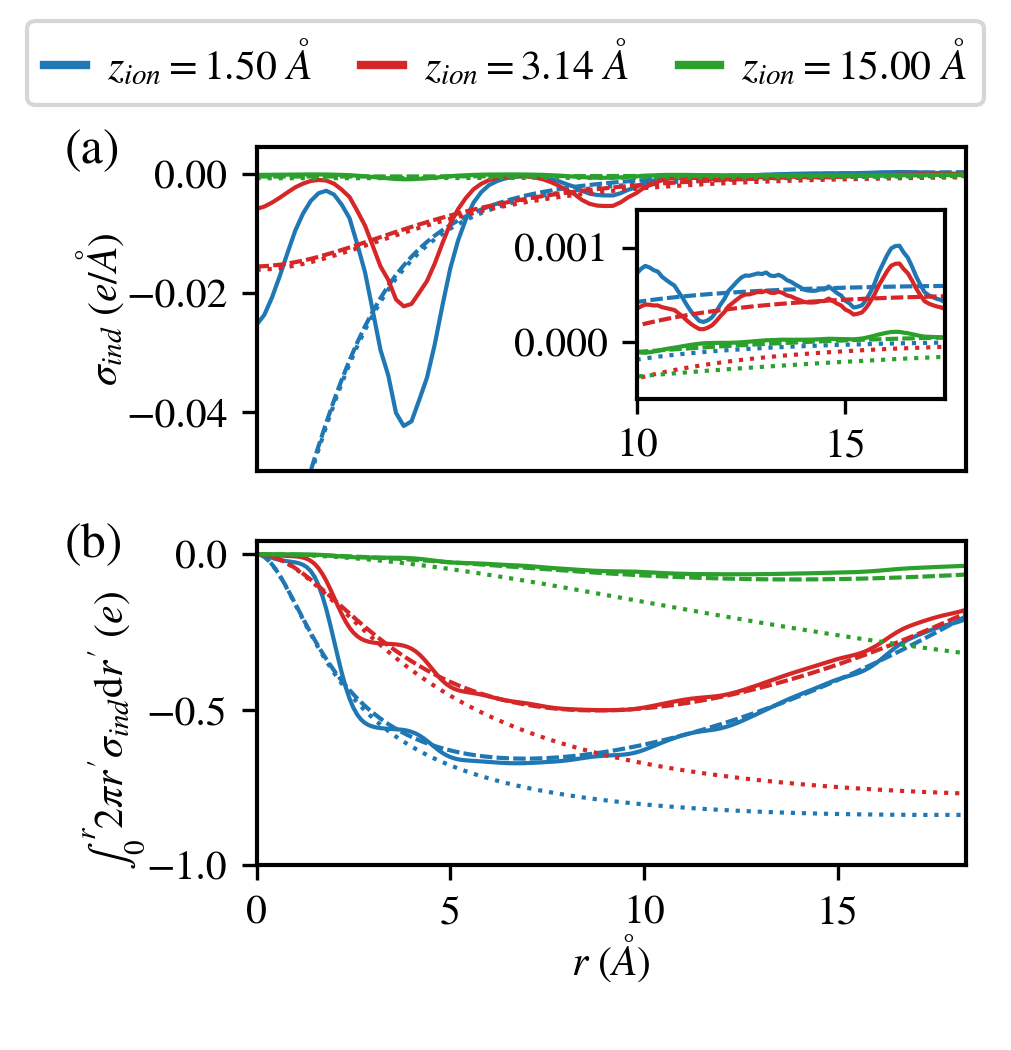
We now turn to the case of a Na+ ion in water, illustrated in Fig. 7 where the molecular simulation results (solid lines) are compared to Eq. 1 (with the above-mentioned sum over periodic images) using the relative permittivity of the SPC/E water model[56], namely (dotted lines). These predictions are actually difficult to see on the same scale as the MD results, indicating that they excessively underestimate the charge density – or equivalently overestimate the screening of the charge by the solvent.
Such a poor prediction is not unexpected, since it is now well established that the dielectric properties of water (and other polar liquids) are drastically modified at interfaces. The response of the polarization to an applied field becomes in principle non-local and tensorial, but it is possible to introduce a local permittivity tensor, whose components parallel and perpendicular to the walls are related to the equilibrium fluctuations of the polarization [2]. These fluctuations can be sampled in molecular simulations to determine how these components depend on the position with respect to the interface and/or on the width of the fluid slab, for confined fluids) [3, 4, 57, 5, 7, 9, 58]. The general picture emerging from these studies is a reduction of the permittivity in the vicinity of solid walls, consistently with experimental observations on confined water [59], even though the microscopic origin of this reduction is not to be found in the molecular structure of interfacial water but rather in the frustration of collective long-range fluctuations [11].
The implications of a decrease in permittivity on other interfacial properties such as the capacitance or the electrokinetic response has also been investigated, in particular in the framework of suitably parameterized slab models [4, 57, 5, 7]. In the present case of the charge induced by a single ion, the translational invariance along the surfaces is broken and a continuum description should in principle involve a spatial dependence of the permittivity tensor. As a first step toward a simpler implicit-solvent description, we follow instead an effective approach by considering the relative permittivity in Eq. 1 as a fitting parameter (see appendix C) for each distance of the ion from the surface. The radial density profiles resulting from this procedure (dashed lines) are compared with the MD simulation results in Fig. 7. The agreement is now comparable with that observed in the vacuum case, i.e. going through the oscillations due to the atomic structure of the electrode (especially at short distance) and following closely the integrated charge density at larger distances. The values resulting from this fitting procedure are , 14.4, 15.1, 21.4 and 68.0, for and Å, respectively. Such a decrease in the effective permittivity as the ion approaches the surface reflects a reduced screening of the ionic charge by the solvent. We emphasize however that, even though this crude approximation seems sufficient to account empirically for the numerical observations, a physically better motivated description of the dielectric response is of course desirable.
IV.3 Cation vs anion
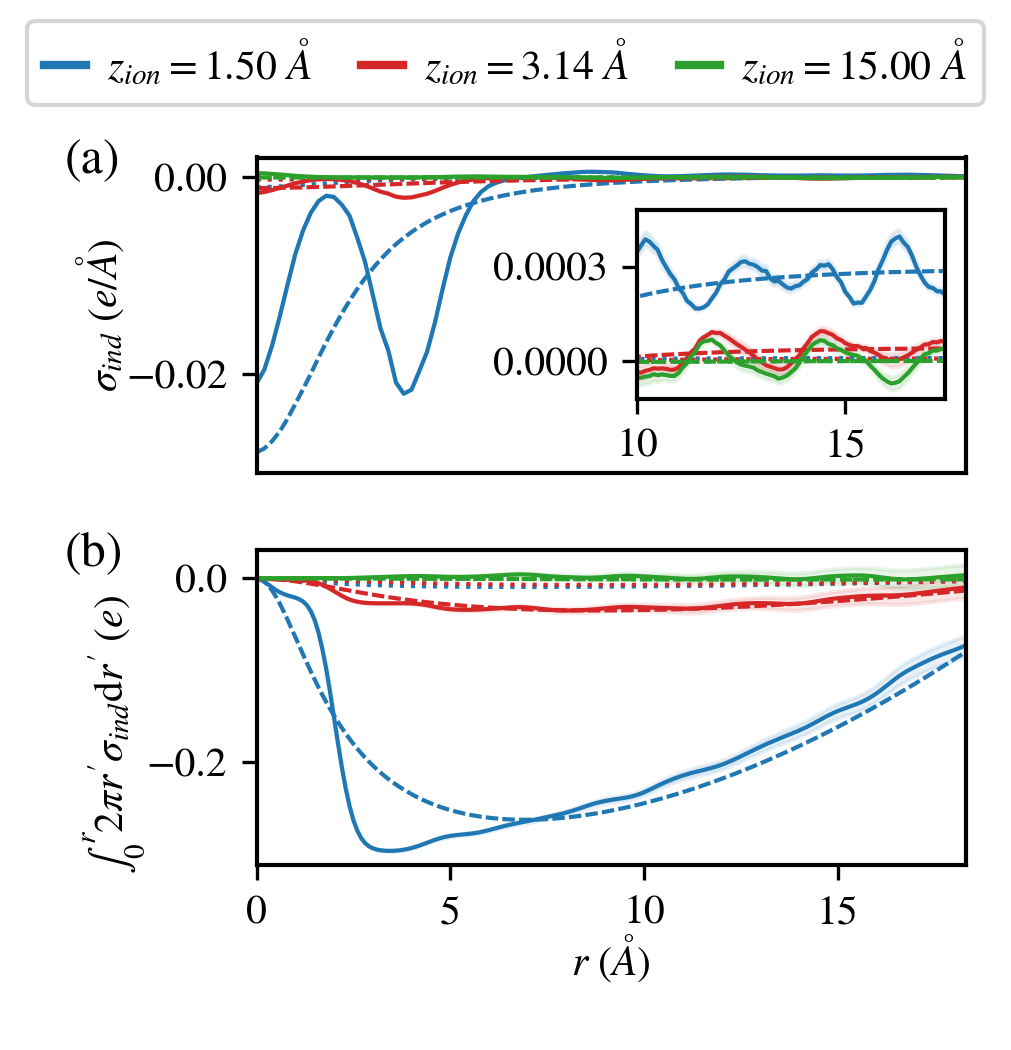
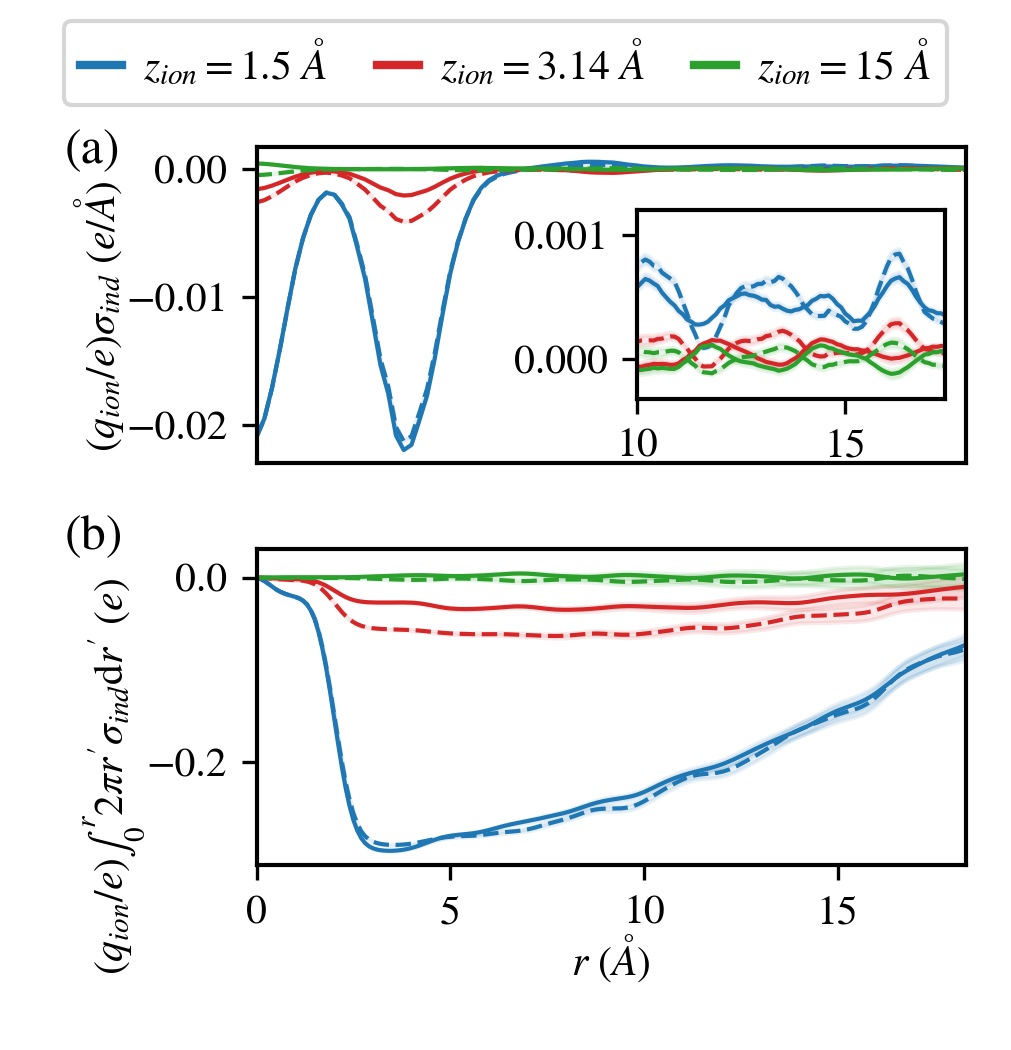
Another important prediction of Eq. 1 is that the charge induced on the metallic surface should be opposite when the sign of the ionic charge is changed. This is indeed the case with an atomically resolved constant-potential electrode when the ion is in vacuum (not shown). In order to compare the molecular simulation results obtained with a Na+ cation or a Cl- anion in water, the radial charge distribution is shown multiplied by the valency of the ion, , in Fig. 8 for three ion distances from the first electrode plane. The results for the closest and farthest ion positions ( and Å, respectively) are consistent with the predicted charge inversion over the whole range of radial distance , despite the differences between the MD and continuum results discussed above. In contrast, the radial charge distribution induced by Na+ or Cl- at the intermediate distance Å (red lines) differ by more than a sign inversion.
Such a difference originates from the well known asymmetric solvation of ions by water, since water molecules are not simple point dipoles [60, 61]. This asymmetry is clearly visible in Fig. 9, which shows the average charge density due to O and H atoms from water molecules in the plane, for Na+ and Cl- ions at three distances from the first atomic plane of the electrode. For ions far from the surface (panels 9e and 9f for Na+ and Cl-, respectively), the charge density is spherically symmetric around the ion, but the alternating signs of the charge density shells reflect the different typical orientation of water molecules around the ions, with the O atom closer to the Na+ cation and a H-bond donated by water to the Cl- anion. However, this asymmetry manifests itself only in the close vicinity of the ion, so that the difference between Na+ and Cl- in Fig. 8 for Å is the mere change of sign of the induced charge density.
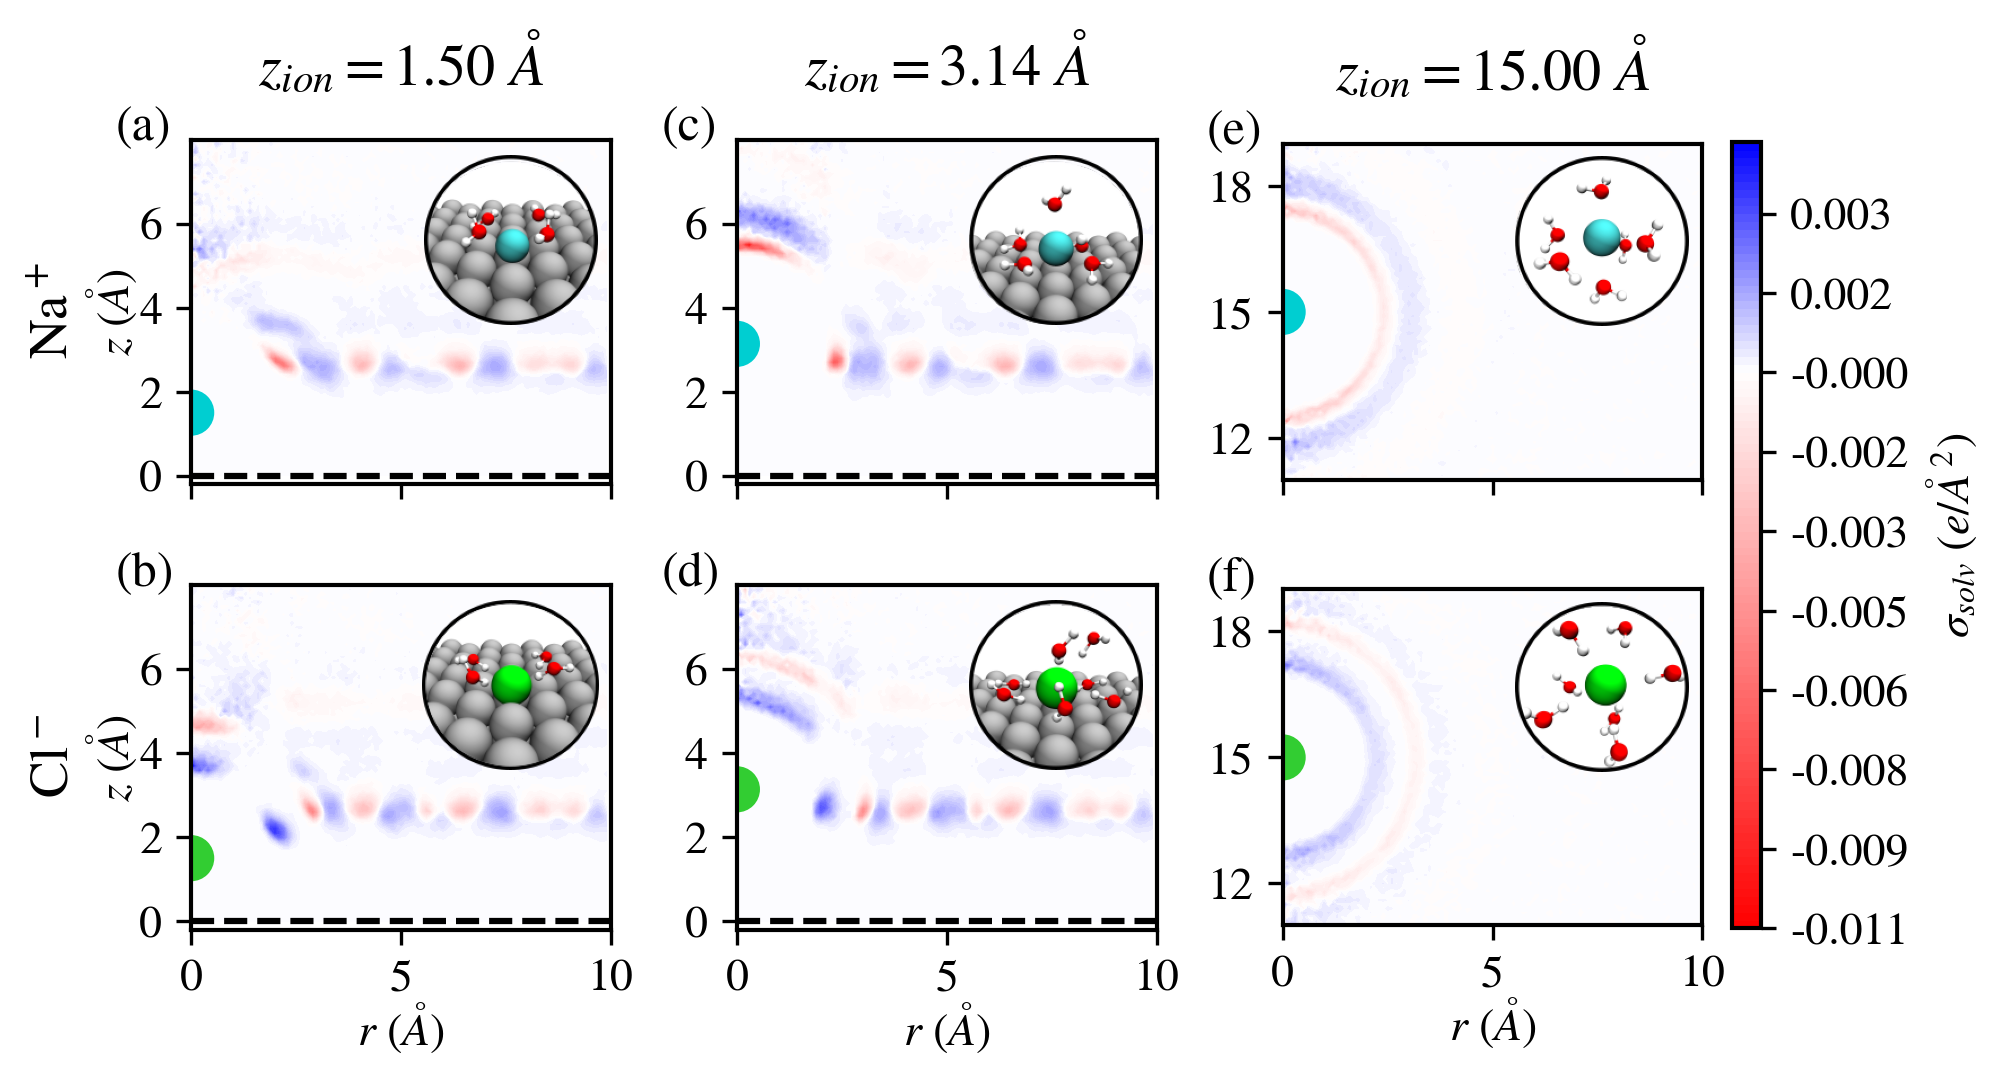
The H-bond pattern of water in the first adsorbed layer (see Fig. 4) is also visible in the plane, for molecules sufficiently far from the ion, as the alternating positive and negative charge density basins in panels 9a to 9d (the same structure is also present near the surface when the ion is far from the surface, but the corresponding range of is not visible in panels 9e and 9f). These panels further show that the ion solvation shell interferes with the network of surface water as the ion approaches the surface. This interplay explains why the charge induced by a Cl- anion is not simply the opposite of that induced by a Na+ cation, at least for the intermediate distance Å of panels 9c and 9d. Even though such an asymmetry is still present for Å in panels 9a and 9b, at such a short distance the ion is closer from the surface than the water molecules in its first solvation shell. The charge induced by the “bare” ion then dominates the polarization of the electrode, so that the leading effect is again a simple charge inversion when changing the sign of the ionic charge.
V Conclusion
Using molecular simulations, we investigated the charges induced on an atomically resolved metallic surface by a single ion in vacuum or in the presence of a molecular solvent. Specifically, we considered the Na+ cation and the Cl- anion in water, at various distances from a (100) surface of a model gold electrode. The charge distribution within the electrode qualitatively follows the predictions of continuum electrostatics, in particular (i) the induced charge density decreases with the radial distance from the ion or with an increase of the distance of the ion from the surface; (ii) the induced charged density decreases in the presence of the polar solvent, consistently with the idea of screening by the latter; (iii) the main difference between the cation and anion cases is the reversal of the induced charge density.
However, the present molecular simulation study also highlights several expected limitations of the continuum picture: (i) the induced charge density oscillates following the atomic lattice of the electrode, even in the absence of solvent; (ii) the induced charge density reflects the structure of the first adsorbed water layer, even far from the ion; (iii) the bulk permittivity of the solvent is not sufficient to capture the screening of the ionic charge as the ion approaches the surface; (iv) the asymmetry in the solvation shell of cations and anions results in effects beyond the mere sign reversal of the induced charge when the ion approaches the interface (even though, as it approaches even further, this leading effect is recovered due to partial desolvation).
The detailed features of the charge distribution are system-specific (even for a given metal and solvent, the interfacial liquid structure crucially depends on the considered crystal face, see e.g. Ref. 39 for water on Pt) and depend to some extent on the details of how the metallic character is described in these classical constant-potential simulations (in particular, on the width of Gaussian charge distribution on atoms [55] or a screening length inside the metal [48]). Nevertheless, we expect the above generic conclusions on the induced charge density to hold for other ions, solvents and electrode surfaces than the ones considered here. In addition, we have considered here a single metallic surface and another natural step is to investigate the effect of voltage between two electrodes on the induced charge distribution, since it will also modify the organization of the interface. Finally, such molecular simulations studies provide a useful reference to design improved implicit solvent models, beyond the bulk (or ad hoc distance-dependent) permittivity. First steps in this direction could for example include continuum electrostatics for an interfacial slab model [6], molecular density functional theory [62, 63, 64] or field theories [65, 66, 67] based on molecular models.
Acknowledgements
The authors are grateful to Mathieu Salanne for many discussions on this and related topics. This project has received funding from the European Research Council under the European Union’s Horizon 2020 research and innovation programme (grant agreement No. 863473). This work was supported by the French National Research Agency (Labex STORE-EX, Grant ANR-10-LABX-0076).
Data availability
The data that support the findings of this study are available from the corresponding author upon reasonable request.
Appendix A Charge distribution across the electrode planes
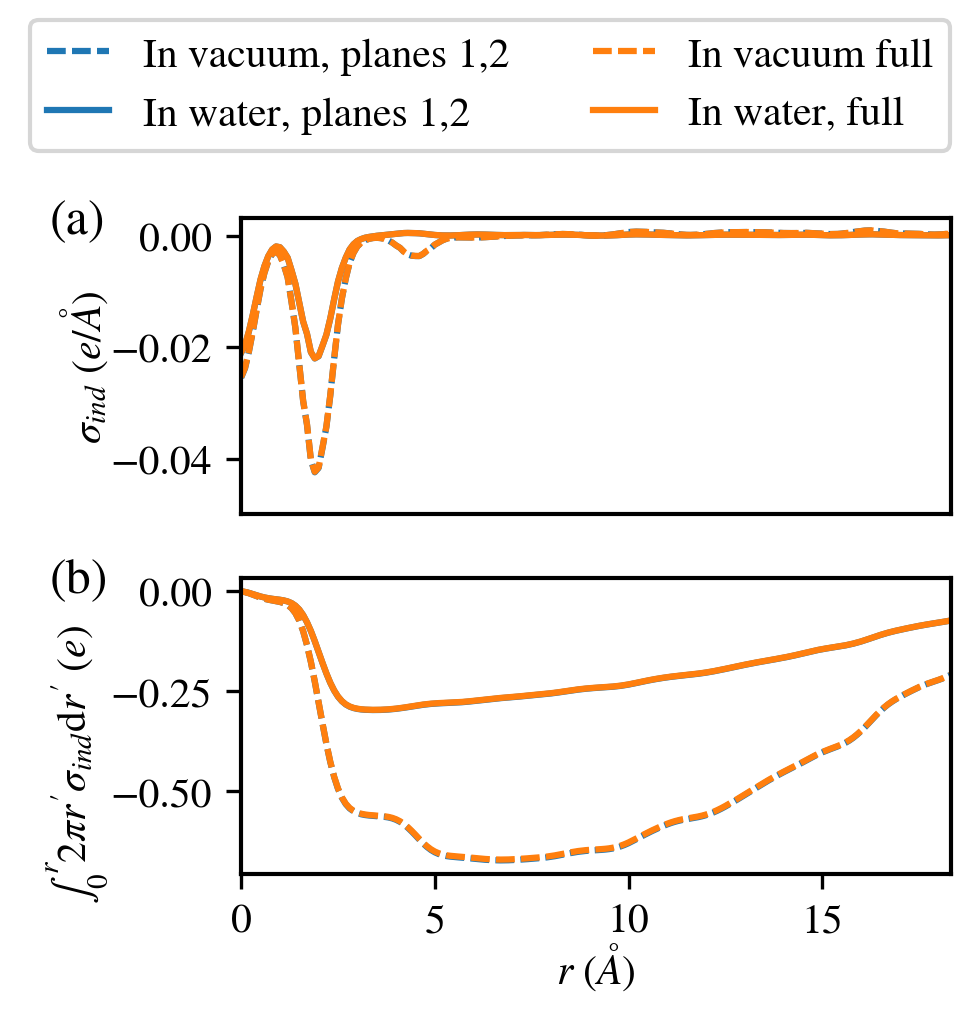
As discussed in the main text, most of the induced charge is localized in the first two electrode planes. This can be easily observed by comparing the radial charge density profiles, , when taking into account either only the first two atomic planes or the whole electrode, as shown in Fig. 10. The agreement between the two data sets is almost perfect.
Appendix B Influence of the distribution of the counter-charge
To test the influence of the localization of the counterion charge, we also performed calculations in vacuum where the counterion is replaced by a uniform charge distribution among the atoms belonging to the first plane of the upper confining wall. The comparison represented in Fig. 11 shows that this choice causes negligible differences in terms of induced charge profiles.
Appendix C Optimization of effective relative permittivity
The effective permittivity is determined for each distance of the ion from the first atomic plane of the electrode by employing a simple parametric sweep optimization scheme. For each , we fit the radial integral of charge density profiles, , obtained with molecular dynamics simulations by tuning the relative permittivity values in the continuum prediction Eq. 1. For this purpose, we introduce the following loss function:
| (7) |
and define the effective permittivity as . Note that for the continuum prediction, we include the effect of periodic boundary conditions by summing over periodic images to estimate the 2D density before performing the radial average to compute hence . From Eq. 1, it follows that this calculation can be performed once for and the radially averaged result scaled by .
References
- [1] John David Jackson. Classical electrodynamics; 2nd ed. Wiley, New York, NY, 1975.
- [2] V. Ballenegger and J.-P. Hansen. Local dielectric permittivity near an interface. EPL (Europhysics Letters), 63(3):381, August 2003.
- [3] V. Ballenegger and J.-P. Hansen. Dielectric permittivity profiles of confined polar fluids. The Journal of Chemical Physics, 122(11):114711, March 2005. Publisher: American Institute of Physics.
- [4] D. J. Bonthuis, S. Gekle, and R. R. Netz. Dielectric profile of interfacial water and its effect on double-layer capacitance. Physical Review Letters, 107(16):166102, 2011.
- [5] Alexander Schlaich, Ernst W. Knapp, and Roland R. Netz. Water Dielectric Effects in Planar Confinement. Physical Review Letters, 117(4):048001, July 2016.
- [6] Philip Loche, Cihan Ayaz, Alexander Schlaich, Douwe Jan Bonthuis, and Roland R. Netz. Breakdown of Linear Dielectric Theory for the Interaction between Hydrated Ions and Graphene. The Journal of Physical Chemistry Letters, 9:6463–6468, October 2018.
- [7] Philip Loche, Cihan Ayaz, Amanuel Wolde-Kidan, Alexander Schlaich, and Roland R. Netz. Universal and Nonuniversal Aspects of Electrostatics in Aqueous Nanoconfinement. The Journal of Physical Chemistry B, 124(21):4365–4371, May 2020. Publisher: American Chemical Society.
- [8] Alexandre P. dos Santos, Yuki Uematsu, Alexander Rathert, Philip Loche, and Roland R. Netz. Consistent description of ion-specificity in bulk and at interfaces by solvent implicit simulations and mean-field theory. The Journal of Chemical Physics, 153(3):034103, July 2020. Publisher: AIP Publishing LLCAIP Publishing.
- [9] Mohammad H. Motevaselian and Narayana R. Aluru. Universal Reduction in Dielectric Response of Confined Fluids. ACS Nano, 14(10):12761–12770, October 2020. Publisher: American Chemical Society.
- [10] Felipe Jiménez-Ángeles, Katherine J. Harmon, Trung Dac Nguyen, Paul Fenter, and Monica Olvera de la Cruz. Nonreciprocal interactions induced by water in confinement. Physical Review Research, 2(4):043244, November 2020.
- [11] Jean-François Olivieri, James T. Hynes, and Damien Laage. Confined Water’s Dielectric Constant Reduction Is Due to the Surrounding Low Dielectric Media and Not to Interfacial Molecular Ordering. The Journal of Physical Chemistry Letters, 12(17):4319–4326, May 2021. Publisher: American Chemical Society.
- [12] N. D. Lang and W. Kohn. Theory of metal surfaces: induced surface charge and image potential. Phys. Rev. B, 7:3541–3550, 1973.
- [13] J Jung, J E Alvarellos, E Chacón, and P García-González. Self-consistent density functional calculation of the image potential at a metal surface. 19(26):266008, jun 2007.
- [14] E. K. Yu, D. A. Stewart, and S. Tiwari. Ab initio study of polarizability and induced charge densities in multilayer graphene films. Phys. Rev. B, 77:195406, May 2008.
- [15] Sung Sakong and Axel Groß. The electric double layer at metal-water interfaces revisited based on a charge polarization scheme. J. Chem. Phys., 149(8):084705, August 2018.
- [16] Kathleen Schwarz and Ravishankar Sundararaman. The electrochemical interface in first-principles calculations. Surface Science Reports, 75(2):100492, May 2020.
- [17] Sung Sakong and Axel Groß. Water structures on a Pt(111) electrode from ab initio molecular dynamic simulations for a variety of electrochemical conditions. Physical Chemistry Chemical Physics, 22(19):10431–10437, May 2020.
- [18] Jia-Bo Le, Ao Chen, Lang Li, Jing-Fang Xiong, Jinggang Lan, Yun-Pei Liu, Marcella Iannuzzi, and Jun Cheng. Modeling Electrified Pt(111)-Had/Water Interfaces from Ab Initio Molecular Dynamics. JACS Au, 1(5):569–577, May 2021.
- [19] Jia-Bo Le and Jun Cheng. Modeling electrified metal/water interfaces from ab initio molecular dynamics: Structure and Helmholtz capacitance. Current Opinion in Electrochemistry, 27:100693, June 2021.
- [20] Laura Scalfi, Mathieu Salanne, and Benjamin Rotenberg. Molecular Simulation of Electrode-Solution Interfaces. Annual Review of Physical Chemistry, 72(1):189, April 2021.
- [21] J. Ilja Siepmann and Michiel Sprik. Influence of surface topology and electrostatic potential on water/electrode systems. J. Chem. Phys., 102(1):511–524, January 1995.
- [22] Stewart K. Reed, Oliver J. Lanning, and Paul A. Madden. Electrochemical interface between an ionic liquid and a model metallic electrode. J. Chem. Phys., 126(8):084704, February 2007. Publisher: American Institute of Physics.
- [23] A. P. Willard, S. K. Reed, P. A. Madden, and D. Chandler. Water at an electrochemical interface - a simulation study. Faraday Discuss., 141:423–441, 2009.
- [24] L. Pastewka, T. T. Järvi, L. Mayrhofer, and M. Moseler. Charge-transfer model for carbonaceous electrodes in polar environments. Phys. Rev. B, 83(16):165418, 2011.
- [25] Nicolas Onofrio and Alejandro Strachan. Voltage equilibration for reactive atomistic simulations of electrochemical processes. J. Chem. Phys., 143(5):054109, August 2015. Publisher: American Institute of Physics.
- [26] Hiroshi Nakano and Hirofumi Sato. A chemical potential equalization approach to constant potential polarizable electrodes for electrochemical-cell simulations. J. Chem. Phys., 151(16):164123, October 2019.
- [27] F. Iori and S. Corni. Including image charge effects in the molecular dynamics simulations of molecules on metal surfaces. J. Comput. Chem., 29(10):1656–1666, July 2008.
- [28] Isidro Lorenzo Geada, Hadi Ramezani-Dakhel, Tariq Jamil, Marialore Sulpizi, and Hendrik Heinz. Insight into induced charges at metal surfaces and biointerfaces using a polarizable Lennard–Jones potential. Nat. Commun., 9(1):716, December 2018.
- [29] K. Breitsprecher, K. Szuttor, and C. Holm. Electrode models for ionic liquid-based capacitors. J. Phys. Chem. C, 119:22445–22451, 2015.
- [30] Dezsö Boda, Dirk Gillespie, Wolfgang Nonner, Douglas Henderson, and Bob Eisenberg. Computing induced charges in inhomogeneous dielectric media: Application in a Monte Carlo simulation of complex ionic systems. Phys. Rev. E, 69(4):046702, April 2004.
- [31] Sandeep Tyagi, Mehmet Süzen, Marcello Sega, Marcia Barbosa, Sofia S. Kantorovich, and Christian Holm. An iterative, fast, linear-scaling method for computing induced charges on arbitrary dielectric boundaries. J. Chem. Phys., 132(15):154112, April 2010.
- [32] Matheus Girotto, Alexandre P. dos Santos, and Yan Levin. Simulations of ionic liquids confined by metal electrodes using periodic Green functions. J. Chem. Phys., 147(7):074109, August 2017.
- [33] C. Merlet, C. Péan, B. Rotenberg, P. A. Madden, P. Simon, and M. Salanne. Simulating supercapacitors: Can we model electrodes as constant charge surfaces? J. Phys. Chem. Lett., 4:264–268, 2013.
- [34] Betul Uralcan, Ilhan A. Aksay, Pablo G. Debenedetti, and David T. Limmer. Concentration Fluctuations and Capacitive Response in Dense Ionic Solutions. J. Phys. Chem. Letters, 7(13):2333–2338, July 2016.
- [35] Zhujie Li, Guillaume Jeanmairet, Trinidad Mendez-Morales, Benjamin Rotenberg, and Mathieu Salanne. Capacitive Performance of Water-in-Salt Electrolytes in Supercapacitors: A Simulation Study. J. Phys. Chem. C, 122(42):23917–23924, 2018.
- [36] Samuel Ntim and Marialore Sulpizi. Role of image charges in ionic liquid confined between metallic interfaces. Phys. Chem. Chem. Phys., 22(19):10786–10791, 2020.
- [37] Debarshee Bagchi, Trung Dac Nguyen, and Monica Olvera de la Cruz. Surface polarization effects in confined polyelectrolyte solutions. Proceedings of the National Academy of Sciences, 117(33):19677–19684, August 2020.
- [38] Chang Yun Son and Zhen-Gang Wang. Image-charge effects on ion adsorption near aqueous interfaces. Proceedings of the National Academy of Sciences, 118(19):e2020615118, May 2021.
- [39] David T. Limmer, Adam P. Willard, Paul Madden, and David Chandler. Hydration of metal surfaces can be dynamically heterogeneous and hydrophobic. Proc. Natl. Acad. Sci. U.S.A., 110(11):4200–4205, March 2013.
- [40] Alessandra Serva, Mathieu Salanne, Martina Havenith, and Simone Pezzotti. Size dependence of hydrophobic hydration at electrified gold/water interfaces. Proceedings of the National Academy of Sciences, 118(15), April 2021.
- [41] N. Bonnet, T. Morishita, O. Sugino, and M. Otani. First-principles molecular dynamics at a constant electrode potential. Phys. Rev. Lett., 109:266101, 2012.
- [42] K. Kiyohara and K. Asaka. Monte carlo simulation of porous electrodes in the constant voltage ensemble. J. Phys. Chem., 111:15903–15909, 2007.
- [43] D. T. Limmer, C. Merlet, M. Salanne, D. Chandler, P. A. Madden, R. van Roij, and B. Rotenberg. Charge fluctuations in nanoscale capacitors. Phys. Rev. Lett., 111:106102, 2013.
- [44] C. Merlet, D. T. Limmer, M. Salanne, R. van Roij, P. A. Madden, D. Chandler, and B. Rotenberg. The electric double layer has a life of its own. J. Phys. Chem. C, 118:18291–18298, 2014.
- [45] Justin B. Haskins and John W. Lawson. Evaluation of molecular dynamics simulation methods for ionic liquid electric double layers. J. Chem. Phys., 144(18):184707, May 2016.
- [46] L. Scalfi, D. T. Limmer, A. Coretti, S. Bonella, P. A. Madden, M. Salanne, and B. Rotenberg. Charge fluctuations from molecular simulations in the constant-potential ensemble. Phys. Chem. Chem. Phys., 22:10480–10489, 2020.
- [47] Peter Cats, Ranisha S. Sitlapersad, Wouter K. den Otter, Anthony R. Thornton, and René van Roij. Capacitance and Structure of Electric Double Layers: Comparing Brownian Dynamics and Classical Density Functional Theory. Journal of Solution Chemistry, July 2021.
- [48] Laura Scalfi, Thomas Dufils, Kyle G. Reeves, Benjamin Rotenberg, and Mathieu Salanne. A semiclassical Thomas–Fermi model to tune the metallicity of electrodes in molecular simulations. The Journal of Chemical Physics, 153(17):174704, November 2020.
- [49] Todd R. Gingrich and Mark Wilson. On the Ewald summation of Gaussian charges for the simulation of metallic surfaces. Chem. Phys. Lett., 500(1):178–183, November 2010.
- [50] H. J. C. Berendsen, J. R. Grigera, and T. P. Straatsma. The Missing Term in Effective Pair Potentials. J. Phys. Chem., 91:6269–6271, 1987.
- [51] Liem X. Dang. Mechanism and Thermodynamics of Ion Selectivity in Aqueous Solutions of 18-Crown-6 Ether: A Molecular Dynamics Study. J. Am. Chem. Soc., 117:6954–6960, July 1995.
- [52] Andrej Berg, Christine Peter, and Karen Johnston. Evaluation and Optimization of Interface Force Fields for Water on Gold Surfaces. Journal of Chemical Theory and Computation, 13(11):5610–5623, November 2017.
- [53] Abel Marin-Laflèche, Matthieu Haefele, Laura Scalfi, Alessandro Coretti, Thomas Dufils, Guillaume Jeanmairet, Stewart K. Reed, Alessandra Serva, Roxanne Berthin, Camille Bacon, Sara Bonella, Benjamin Rotenberg, Paul A. Madden, and Mathieu Salanne. MetalWalls: A classical molecular dynamics software dedicated to the simulation of electrochemical systems. Journal of Open Source Software, 5(53):2373, September 2020.
- [54] G. J. Martyna, M. L. Klein, and M. E. Tuckerman. Nosé-hoover chains: the canonical ensemble via continuous dynamics. J. Chem. Phys., 97:2635–2643, 1992.
- [55] Alessandra Serva, Laura Scalfi, Benjamin Rotenberg, and Mathieu Salanne. Effect of the metallicity on the capacitance of gold–aqueous sodium chloride interfaces. The Journal of Chemical Physics, 155(4):044703, July 2021. Publisher: American Institute of Physics.
- [56] M. Rami Reddy and M. Berkowitz. The dielectric constant of spc/e water. Chemical Physics Letters, 155(2):173–176, 1989.
- [57] Douwe Jan Bonthuis, Stephan Gekle, and Roland R. Netz. Profile of the Static Permittivity Tensor of Water at Interfaces: Consequences for Capacitance, Hydration Interaction and Ion Adsorption. Langmuir, 28(20):7679–7694, 2012.
- [58] F. Deißenbeck, C. Freysoldt, M. Todorova, J. Neugebauer, and S. Wippermann. Dielectric Properties of Nanoconfined Water: A Canonical Thermopotentiostat Approach. Physical Review Letters, 126(13):136803, April 2021.
- [59] L. Fumagalli, A. Esfandiar, R. Fabregas, S. Hu, P. Ares, A. Janardanan, Q. Yang, B. Radha, T. Taniguchi, K. Watanabe, G. Gomila, K. S. Novoselov, and A. K. Geim. Anomalously low dielectric constant of confined water. Science, 360(6395):1339–1342, June 2018.
- [60] Alan Grossfield. Dependence of ion hydration on the sign of the ion’s charge. The Journal of Chemical Physics, 122(2):024506, 2005.
- [61] Abhishek Mukhopadhyay, Andrew T. Fenley, Igor S. Tolokh, and Alexey V. Onufriev. Charge hydration asymmetry: The basic principle and how to use it to test and improve water models. The Journal of Physical Chemistry B, 116(32):9776–9783, 2012. PMID: 22762271.
- [62] Lu Ding, Maximilien Levesque, Daniel Borgis, and Luc Belloni. Efficient molecular density functional theory using generalized spherical harmonics expansions. The Journal of Chemical Physics, 147(9):094107, September 2017.
- [63] G. Jeanmairet, B. Rotenberg, M. Levesque, D. Borgis, and M. Salanne. A molecular density functional theory approach to electron transfer reactions. Chem. Sci., 10:2130–2143, 2019.
- [64] Guillaume Jeanmairet, Benjamin Rotenberg, Daniel Borgis, and Mathieu Salanne. Study of a water-graphene capacitor with molecular density functional theory. J. Chem. Phys., 151(12):124111, September 2019.
- [65] H. Berthoumieux. Gaussian field model for polar fluids as a function of density and polarization: Toward a model for water. The Journal of Chemical Physics, 148(10):104504, March 2018.
- [66] H. Berthoumieux and F. Paillusson. Dielectric response in the vicinity of an ion: A nonlocal and nonlinear model of the dielectric properties of water. The Journal of Chemical Physics, 150(9):094507, March 2019.
- [67] M. Vatin, A. Porro, N. Sator, J.-F. Dufrêche, and H. Berthoumieux. Electrostatic interactions in water: a nonlocal electrostatic approach. Molecular Physics, 119(5):e1825849, March 2021.