Morphological transition of the compact radio lobe in 3C84 via the strong jet-cloud collision
Abstract
We report multi-epoch Very Long Baseline Interferometric (VLBI) observations of the compact radio lobe in the radio galaxy 3C84 (NGC1275) during 2016 - 2020. The image sequence of 3C84 reveals that the hotspot in the radio lobe showed the one-year long frustration in 2017 within a compact region of about 0.07 parsec, suggesting a strong collision between the jet and a compact dense cloud with the estimated average density about . Although the hotspot and the radio lobe began to move south again after its breakout, the radio lobe showed a morphological transition from FR II- to FR I-class radio lobe and its radio flux became fainter. This is the first detection of the dynamical feedback from the cloud to the jet where the cloud located on the jet axis significantly interferes with the jet propagation and evolution at the central one-parsec region in active galactic nucleus.
1 Introduction
Radio jets in active galactic nuclei (AGNs) are considered to be one of the major drivers of galaxy evolution and understanding how jets carry energy from the central nucleus to large scales is one of the most fundamental questions (e.g., Fabian, 2012; Kormendy & Ho, 2013, for review). Radio lobes associated with the jets are key structures reflecting the history of the jet propagation and its radio-mode feedback to the surrounding matter (e.g., Croton et al., 2006; Wagner et al., 2012). The radio lobes are classified into two classes. While Fanaroff-Riley class I (FR I) are core-brightened with fainter outer edge of the radio lobes, Fanaroff-Riley class II (FR II) are edge-brightened with bright hotspots at the ends of their lobes (Fanaroff & Riley, 1974). There are two scenarios for the origin of the FR I/FR II divide. One is due to a different nature of the central engine that drives the jet (e.g., Rawlings & Saunders, 1991; Baum et al., 1995; Meier et al., 1997; Ghisellini & Celotti, 2001), while the other is due to a different degree of deceleration caused by intergalactic matter (e.g., Kawakatu et al., 2008; Kharb et al., 2012; Laing & Bridle, 2014). The purpose of this study is to explore energy transport by radio lobes on parsec scale that has yet to be studied sufficiently.
The nearby radio galaxy 3C84 () at the center of the Perseus cluster, harboring a supermassive black hole with its mass of (Scharwächter et al., 2013; Giovannini et al., 2018) is an excellent laboratory for exploring the physics of energy transport by radio lobes at parsec scale. The C3 component in 3C84 is known as a newborn radio lobe component associated with the radio outburst that started in 2005 and it propagates southward and becomes brighter (Nagai et al., 2010; Hiura et al., 2018). The brightness peak in the C3 component is identified as the hotspot, which is a termination shock at the tip of the jet. The peculiar structure of C3 suggests interactions between the jet and the surrounding medium (Giovannini et al., 2018) and a recent VLBI observation found a positional flip of the hotspot in 2015 September that indicated the jet and cloud interaction (Kino et al., 2018). VLBA data also showed an enhancement of linearly polarized flux which also supports the jet-cloud interaction (Nagai et al., 2017). In this Letter, we report continuous VLBI monitoring observations of 3C84 that reveals further strong jet-cloud collision that accompanying morphological transition of the radio lobe. With the cosmology parameters of , , and (Komatsu et al., 2009) the angular scale of 1 mas corresponds to a linear distance of 0.35 parsec for 3C84.
2 Observations and data reductions
We have conducted the high-cadence monitoring observations of 3C84 with the KaVA array at 43 GHz during 2016 - 2018. Imaging capabilities of KaVA are summarized in (Niinuma et al., 2014). The typical size of the original beam of KaVA at 43 GHz is 0.6-0.7 mas (see also Kino et al., 2018; Wajima et al., 2020). At 22 GHz, we have conducted another high-cadence monitoring observation with the VERA array in the framework of the GENJI programme (Gamma-ray Emitting Notable AGN Monitoring with Japanese VLBI). Data reduction was performed using the National Radio Astronomy Observatory (NRAO) Astronomical Imaging Processing System (AIPS) in the same way described in GENJI programme (Nagai et al., 2013; Hiura et al., 2018). A priori amplitude calibration was applied using the measured system noise temperature and the elevation-gain curve of each antenna. We calibrated the bandpass characteristics of phase and amplitude at each station using the auto-correlation data. Following the amplitude calibration, fringe-fitting was performed to calibrate the visibility phases. Finally, the data were averaged over each intermediate frequency band. The imaging and self-calibration were performed in the Difmap software in the usual manner. We also included VLBA 43GHz archived data obtained in the blazar monitoring program led by Boston University group (https://www.bu.edu/blazars/). To determine the brightness peak position of the C3 component, we performed two-dimensional Gaussian fit to the visibility data by using Difmap task modelfit. In the process, we trimmed off VLBA visibility data on the baselines longer than to align with KaVA’s -coverage. For better understanding of the light curve behavior, we included the Submillimeter Array (SMA) monitoring data at 1.3 mm. Detailed explanations for the monitoring program are described in the literature (Gurwell et al., 2007).
3 Results
3.1 Discovery of the frustrated hotspot
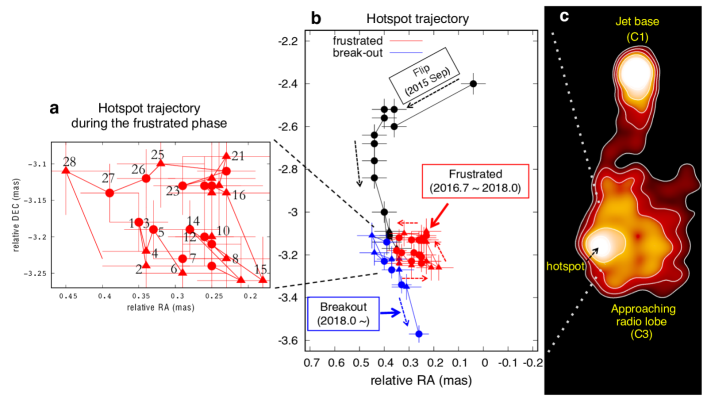
In Figure 1, we present the time sequence of the positional change of the hotspot obtained from more than 50 epochs of images observed with KaVA and VLBA at 43 GHz. One can readily see new important findings as follows: (1) As shown in the panel b of Figure 1, the position of the hotspot was frustrated during the period from 2016.7 to 2018.0. The location of the hotspot during the frustrated phase was confined within a compact region with its angular size about mas, which is equivalent to about 0.07 pc in the projected physical scale. (2) The trajectory of the hotspot during the frustrated phase was not random but rather smoothly connected between neighboring epochs and it showed an apparent counter-clockwise rotating motion on the sky plane (shown in the panel a of Figure 1). The trajectory of the hotspot may remind us of a similarity with the dentist-drill model proposed by Scheuer (1982) where hotspots show vivid wobbling. (3) After 2018.0, it broke out and began to move south again. These frustration and breakout of the hotspot cannot be explained by a global change of the entire jet direction due to the precession of the jet base (Hiura et al., 2018), while a strong collision between the jet and a compact dense cloud at this local site can naturally account for them.
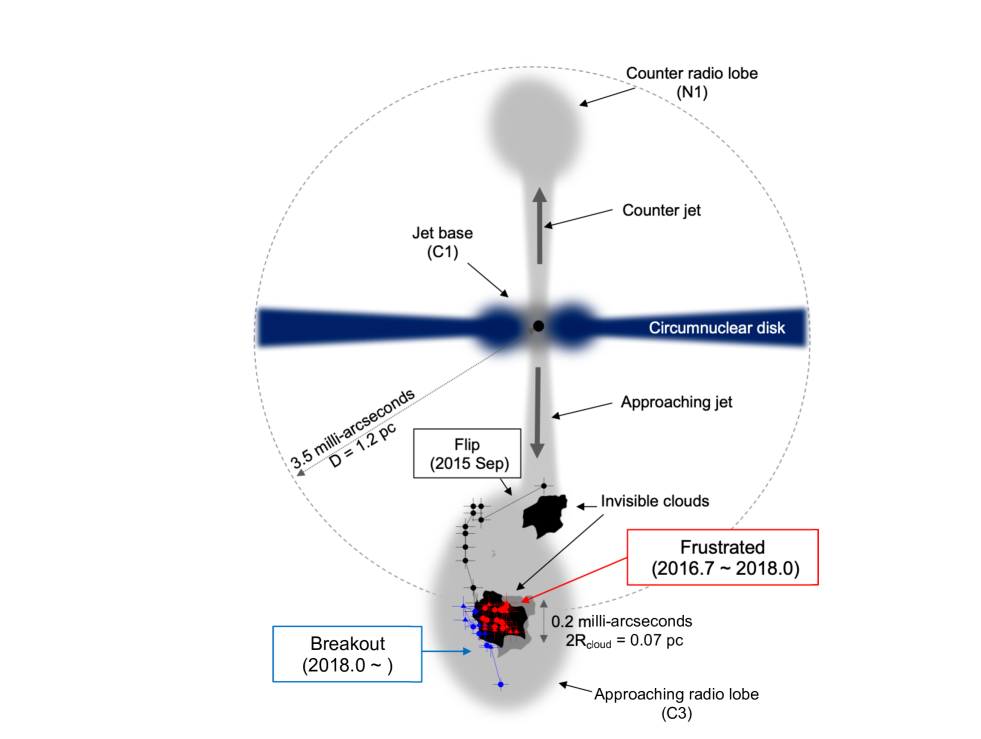
In Figure 2, we summarize the overall picture of the hotspot trajectory relative to the peak position of the jet base (hereafter C1). The projected distance from the jet base (C1) to C3 was about one-parsec scale during our observational period. One can see the overall trajectory of the hotspot toward the south. In the beginning, the abrupt large flip of the hotspot position was found in 2015 August-September and it was explained an off-axis collision between the jet and a dense cloud (Kino et al., 2018) . After the flip in 2015, the hotspot propagated towards south until the middle of 2016. Then, the hotspot suddenly stopped its propagation over the period from 2016.7 (4th epoch in the red dot data) to 2018.0 (i.e., years). Such a phenomenon has never been found in AGN jets. The strong head-on collision releases the bulk kinetic energy of the 3C84 jet into other forms of energy. The amount of the released energy by the collision is one of the most interesting quantities, and it can be estimated as . Since the duration of the frustration and the size of the cloud are directly determined from the kinematics of the hotspot, we obtain where the value of the total jet kinetic power of 3C84 is suggested by the dynamics of X-ray cavity in the Perseus cluster inflated by the jet kinetic power (Heinz et al., 1998; Churazov et al., 2000). In § 4, we will discuss possible usages of .
3.2 Light curves
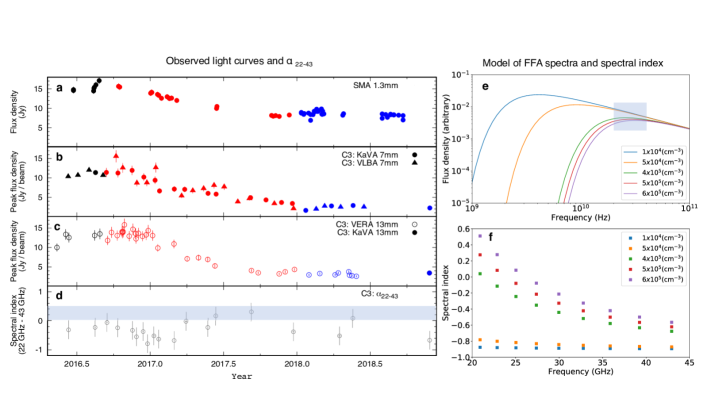
In the left panel of Figure 3, we show the light curves of the C3 component during 2016-2018. As will be explained below, the light curve data also agrees well with the prediction of the jet-cloud collision. The radio flux densities at 22 GHz, 43 GHz and 230 GHz deceased during the frustrated phase (red-colored dots). These decreases stopped when they entered the breakeout phase (blue-colored dots). The synchronization of the period of frustration with that of flux density decrease (red-colored dots) among 22 GHz, 43 GHz and 230 GHz suggests an absorption phenomenon. Since the hotspot is expected to be buried in the cloud during the collision, the radio emission from the hotspot is considered to be partially absorbed by the cloud. The faster decrease of the radio flux at 22 GHz than that of 43 GHz supports the free-free absorption (FFA) absorption that is seen against the counter radio lobe component (e.g., Walker et al., 2000; Fujita & Nagai, 2017; Wajima et al., 2020) (see N1 in Figure 2). Since the degree of FFA depends on the number density of the cloud (), we can constrain on . In the past, the C3 component had a optically-thin spectrum between 22-43 GHz (), which showed in 2008 (e.g., Suzuki et al., 2012). During the frustrated phase, it increased and it maximally reached to . Below, we constrain on based on this value. It is known that the FFA opacity is given by where , and are the temperature and the path-length of the dense cloud, respectively (e.g., Levinson et al., 1995; Fujita & Nagai, 2017). The observed synchrotron flux density becomes smaller than the intrinsic flux density by the factor of . In the right panel of Figure 3, we show the dependence of the FFA synchrotron flux densities. To realize the inverted spectra with (light-blue shaded range in the panel ), (or even higher one) is required. The estimated is somewhat larger than the values of the dynamically estimated density (Nagai et al., 2017; Kino et al., 2018) and the density estimated by absorption lines detected by ALMA (Nagai et al., 2019). It may indicate that the cloud has an internal structure and a denser portion may be responsible for the flattening of . Another intriguing feature seen in Figure 3 is the rise of the spectral index reaching to in mid-2018 again. This may be caused by the FFA due to another foreground dense cloud floating around C3.
3.3 Morphological transition of the radio lobe after the collision
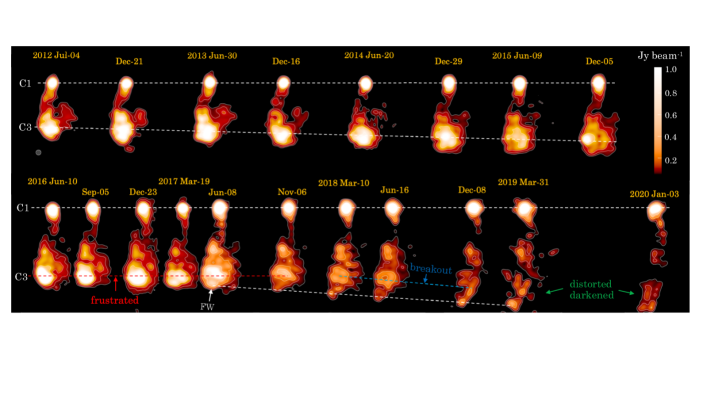
In Figure 4, we have shown the sequence of VLBA images of 3C84 at 43GHz from 2012 July to 2020 January. The emergence of this C3 was around 2003, which means that C3 is only about 15 years old and it has been well known that the shape of C3 is similar to that of the so-called FR II class radio lobes (Nagai et al., 2010). As shown in the top row of Figure 4, C3 continued to propagate southward by mid-2016. As is in the top row of Figure 4, during the mid-2016 to late 2017 period, the hotspot of the luminosity peak within C3 showed a frustrating trajectory of motion (see Figure 1) and a corresponding decrease in luminosity (see Figure 3). The most important finding in the Figure 4 is the morphological transition of the overall structure of C3 after the breakout. A series of images taken after 2018 clearly show that the shape of the radio lobe has distorted, losing the characteristics of FR II class radio lobes and changing to have the characteristics of the so-called FR I class radio lobe without a clear hotspot feature. Such a rapid change of the radio lobe morphology have not been yet recognized. What should be emphasized here is that the jet received energy from the cloud and strongly influenced its evolution. This is opposite to the so-called radio-mode feedback where the energy is fed back from jet to the surrounding matter (e.g., Fabian, 2012).
As is also shown in Figure 4, we discovered another interesting feature: i.e., a new component moving forward in C3 (we denote it as FW). Interestingly, such behaviors are sometimes seen in numerical simulations of jet-cloud interactions (e.g., de Gouveia Dal Pino, 1999; Wagner et al., 2012) and thus the FW might be understood as a circumventing portion of the propagating jet during the collision.
4 Discussions
4.1 Possible Origin of the dense cloud
Since matter cannot maintain a balance of forces on the axis because there is no centrifugal force acting on ambient matter, the region along the jet axis is considered to be essentially free of gas clouds (Ramos Almeida & Ricci, 2017). Then, how can the cloud we have discovered exist in that region? One possible scenario might be a failed clumpy wind ejected by a different mechanism. A recent study proposes that radiation feedback drives a ”fountain,” that is, a vertical circulation of clumpy gas (Wada, 2012). Since this is not a centrifugal-driven wind but radiation-driven one, the driven gas fountain can occasionally come into the polar region. Another possible scenario might be a cold chaotic accretion (CCA) onto supermassive black holes (Gaspari et al., 2013). In the CCA scenario, subsequent recurrent collisions and tidal forces between clouds, filaments promote angular momentum cancellation, and it boosts accretion onto the central black hole. On sub-pc scales the clouds are channeled to the center via a funnel region. Perseus cluster is an archetypal example of a cool-core cluster containing plenty of cold gas about (Salomé et al., 2006) and the observed complex morphology of the CO filaments (e.g., Lim et al., 2008; Nagai et al., 2019) on kpc scale seems to agree with the CCA scenario. H images of the central region of NGC1275 show features in the stellar body of NGC 1275 and identify outer stellar regions containing blue, probably young, star clusters, which can be also interpreted as recent accretion of a gas-rich system (Conselice et al., 2001), which may support CCA scenario.
4.2 New pathway for FR I/FR II divide
As mentioned in the Introduction, two scenarios have been proposed for the origin of FR I/FR II divide: (i) it is caused by intrinsic properties of a central engine that drives a jet, and (ii) it is caused by jet deceleration by surrounding ambient matter. Within the scenario (ii), our observational finding adds a new pathway where the progenitor of a FR II radio lobe can turn into the FR I one when it strongly collides with a dense cloud on parsec scale. Although it is quite interesting to see how often such transitions occur via strong deceleration, this is the first example and little is known about it so far. Observational studies of cold gas properties at central parsec scale of radio galaxies using ALMA would be useful in the future.
The evolution model where compact radio lobes expand and become large FR Is and FR IIs are well consistent with radio observational data (e.g., Kawakatu et al., 2008; Kunert-Bajraszewska et al., 2010; O’Dea & Saikia, 2020). Kawakatu et al. (2008) studied the properties of more than 100 radio lobes and by comparing the hot spot advancing speed with the sound speed of the ambient medium, they indicated that only compact symmetric objects whose initial advance speed is faster than about can evolve into FR II class. Based on the momentum balance between the jet thrust and the ram pressure by the surrounding ambient matter, Kawakatu et al. (2009) further derived a criterion value of that divides the evolutionary path to FRI- and FRII-class. Applying this criterion, we find that can easily make the jet frustrated. The obtained is roughly comparable to the one that caused the jet flip (Kino et al., 2018), so what could have caused such difference? It could be interpreted that the flip event was an off-axis collision with a small single cloud, while the frustration event was a head-on collision with a sort of multiple clouds assembly.
Since the cloud is of finite size, the jet breaks out of the cloud in a finite time. After the jet breakout, the deposited would be spent for energy-driven expansion of the radio lobes. By approximating the expansion as -driven Sedov-Taylor one (e.g., Ostriker & McKee, 1988), the predicted expansion velocity can be estimated as that shows a reasonable agreement with the C3 advancing speed seen in Figure 4. 222 The advancing speed of C3 with 5 mas averaged over 17 years corresponds to the apparent speed as . Together with the jet viewing angle , a relatively fast speed of is estimated. Further VLBI monitoring observations of 3C84 in the future will update this rough-cut order estimation of .
What would it be expected if such a strong a jet-cloud collision generally happens and influences of FR I/II divide? Then, FR I/II divide would reflect information on the dense gas along the jet axis. For instance, the archetypal FR II class Cygnus A may be free from strong collisions with cold dense gas at its central region, since Cygnus A has a classical double radio lobes. The central cooling time of the Cygnus A cluster is about 10 times longer than Perseus cluster (Fabian, 1994) and the longer cooling time may realize CCA free environment. On the other hand, the Perseus cluster indeed contains filamentary cold molecular gas at its center (e.g., Salomé et al., 2006; Lim et al., 2008). It is also known that there are multiple radio bubbles on various directions (Pedlar et al., 1990). One may guess that such radio bubbles could be remnants whose progenitors are young bubbles that underwent strong CCA-jet collisions. We further point out the case of 4C31.04, a source with an FR II morphology on parsec scales and a luminosity that is predicted to evolve in an FR I large size object (Giroletti et al., 2003): similarly to 3C84, the hot-spots of 4C31.04 are known to produce feedback on the surrounding gas (Zovaro et al., 2019). However, differently from 3C84, there is no direct evidence for any morphological transition in that source, perhaps due to the lack of high cadence observations or perhaps because of a different mechanism, not involving jet-CCA interactions.
Asymmetries in young radio lobes also suggest interactions between radio jets and environment (Saikia & Gupta, 2003). Interestingly, it is found that a fairly large fraction ( %) of asymmetric compact radio lobes have the brighter lobes closer to the nucleus that can be understood as jet-cloud interactions (Dallacasa et al., 2013; Orienti, 2016). It is curious that a hotspot can be both brightened and diminished by a collision. It may imply that behavior of the radio flux densities of those hotspots highly depends on positional relationships between the jet and clouds. In some cases, clouds may cover up the hotspot like the present case of 3C84 while in other cases, they may be exposed and without being obscured (Dallacasa et al., 2013; Orienti, 2016). Aside from the need for further researches on the curious behavior of radio flux densities, the existence of young asymmetric radio lobes also suggests that jet-cloud interaction on parsec scale is ubiquitous.
Acknowledgment
This work is mainly based on KaVA observations, which is operated by the Korea Astronomy and Space Science Institute (KASI) and the National Astronomical Observatory of Japan (NAOJ). This work is partially supported by JSPS/MEXT KAKENHI (grants JP18K03656, JP18H03721, JP18K03709, JP21H01137, 19K03918) and by the Korea’s National Research Council of Science and Technology (NST) granted by the International joint research project (EU-16-001). We thank A. Hirano for her cooperation of VERA 22GHz data analysis. This study makes use of 43 GHz VLBA data from the VLBA-BU Blazar Monitoring Program (VLBA-BU-BLAZAR; http://www.bu.edu/blazars/), funded by NASA through the Fermi Guest Investigator Program. VLBA is an instrument of the Long Baseline Observatory. The Long Baseline Observatory is a facility of the National Science Foundation operated by Associated Universities, Inc. The Submillimeter Array is a joint project between the Smithsonian Astrophysical Observatory and the Academia Sinica Institute of Astronomy and Astrophysics and is funded by the Smithsonian Institution and the Academia Sinica.
References
- Baum et al. (1995) Baum, S. A., Zirbel, E. L., & O’Dea, C. P. 1995, ApJ, 451, 88
- Churazov et al. (2000) Churazov, E., Forman, W., Jones, C., & Böhringer, H. 2000, A&A, 356, 788
- Conselice et al. (2001) Conselice, C. J., Gallagher, John S., I., & Wyse, R. F. G. 2001, AJ, 122, 2281
- Croton et al. (2006) Croton, D. J., Springel, V., White, S. D. M., et al. 2006, Mon. Not. R. Astron. Soc., 365, 11
- Dallacasa et al. (2013) Dallacasa, D., Orienti, M., Fanti, C., Fanti, R., & Stanghellini, C. 2013, Mon. Not. R. Astron. Soc., 433, 147
- de Gouveia Dal Pino (1999) de Gouveia Dal Pino, E. M. 1999, Astrophys. J., 526, 862
- Fabian (1994) Fabian, A. C. 1994, ARA&A, 32, 277
- Fabian (2012) —. 2012, Ann.Rev.Astron.Astrophys., 50, 455
- Fanaroff & Riley (1974) Fanaroff, B. L., & Riley, J. M. 1974, MNRAS, 167, 31P
- Fujita & Nagai (2017) Fujita, Y., & Nagai, H. 2017, MNRAS, 465, L94
- Gaspari et al. (2013) Gaspari, M., Ruszkowski, M., & Oh, S. P. 2013, Mon. Not. R. Astron. Soc., 432, 3401
- Ghisellini & Celotti (2001) Ghisellini, G., & Celotti, A. 2001, A&A, 379, L1
- Giovannini et al. (2018) Giovannini, G., Savolainen, T., Orienti, M., et al. 2018, Nature Astronomy, 2, 472
- Giroletti et al. (2003) Giroletti, M., Giovannini, G., Taylor, G. B., et al. 2003, A&A, 399, 889
- Gurwell et al. (2007) Gurwell, M. A., Peck, A. B., Hostler, S. R., Darrah, M. R., & Katz, C. A. 2007, in Astronomical Society of the Pacific Conference Series, Vol. 375, From Z-Machines to ALMA: (Sub)Millimeter Spectroscopy of Galaxies, ed. A. J. Baker, J. Glenn, A. I. Harris, J. G. Mangum, & M. S. Yun, 234
- Heinz et al. (1998) Heinz, S., Reynolds, C. S., & Begelman, M. C. 1998, Astrophys. J., 501, 126
- Hiura et al. (2018) Hiura, K., Nagai, H., Kino, M., et al. 2018, Publ. Astron. Soc. Japan, 70, 83
- Kawakatu et al. (2009) Kawakatu, N., Kino, M., & Nagai, H. 2009, ApJ, 697, L173
- Kawakatu et al. (2008) Kawakatu, N., Nagai, H., & Kino, M. 2008, Astrophys. J., 687, 141
- Kharb et al. (2012) Kharb, P., O’Dea, C. P., Tilak, A., et al. 2012, ApJ, 754, 1
- Kino et al. (2018) Kino, M., Wajima, K., Kawakatu, N., et al. 2018, Astrophys. J., 864, 118
- Komatsu et al. (2009) Komatsu, E., Dunkley, J., Nolta, M. R., et al. 2009, ApJS, 180, 330
- Kormendy & Ho (2013) Kormendy, J., & Ho, L. C. 2013, ARA&A, 51, 511
- Kunert-Bajraszewska et al. (2010) Kunert-Bajraszewska, M., Gawroński, M. P., Labiano, A., & Siemiginowska, A. 2010, Mon. Not. R. Astron. Soc., 408, 2261
- Laing & Bridle (2014) Laing, R. A., & Bridle, A. H. 2014, MNRAS, 437, 3405
- Levinson et al. (1995) Levinson, A., Laor, A., & Vermeulen, R. C. 1995, Astrophys. J., 448, 589
- Lim et al. (2008) Lim, J., Ao, Y., & Dinh-V-Trung. 2008, ApJ, 672, 252
- Meier et al. (1997) Meier, D. L., Edgington, S., Godon, P., Payne, D. G., & Lind, K. R. 1997, Nature, 388, 350
- Morganti et al. (2013) Morganti, R., Fogasy, J., Paragi, Z., Oosterloo, T., & Orienti, M. 2013, Science, 341, 1082
- Nagai et al. (2017) Nagai, H., Fujita, Y., Nakamura, M., et al. 2017, Astrophys. J., 849, 52
- Nagai et al. (2010) Nagai, H., Suzuki, K., Asada, K., et al. 2010, Publ. Astron. Soc. Japan, 62, L11
- Nagai et al. (2013) Nagai, H., Kino, M., Niinuma, K., et al. 2013, Publ. Astron. Soc. Japan, 65, 24
- Nagai et al. (2019) Nagai, H., Onishi, K., Kawakatu, N., et al. 2019, Astrophys. J., 883, 193
- Niinuma et al. (2014) Niinuma, K., Lee, S.-S., Kino, M., et al. 2014, Publ. Astron. Soc. Japan, 66, 103
- O’Dea & Saikia (2020) O’Dea, C. P., & Saikia, D. J. 2020, arXiv e-prints, arXiv:2009.02750
- Orienti (2016) Orienti, M. 2016, Astronomische Nachrichten, 337, 9
- Ostriker & McKee (1988) Ostriker, J. P., & McKee, C. F. 1988, Reviews of Modern Physics, 60, 1
- Pedlar et al. (1990) Pedlar, A., Ghataure, H. S., Davies, R. D., et al. 1990, MNRAS, 246, 477
- Ramos Almeida & Ricci (2017) Ramos Almeida, C., & Ricci, C. 2017, Nature Astronomy, 1, 679
- Rawlings & Saunders (1991) Rawlings, S., & Saunders, R. 1991, Nature, 349, 138
- Saikia & Gupta (2003) Saikia, D. J., & Gupta, N. 2003, Astron. Astrophys., 405, 499
- Salomé et al. (2006) Salomé, P., Combes, F., Edge, A. C., et al. 2006, A&A, 454, 437
- Scharwächter et al. (2013) Scharwächter, J., McGregor, P. J., Dopita, M. A., & Beck, T. L. 2013, MNRAS, 429, 2315
- Scheuer (1982) Scheuer, P. A. G. 1982, in Extragalactic Radio Sources, ed. D. S. Heeschen & C. M. Wade, Vol. 97, 163
- Suzuki et al. (2012) Suzuki, K., Nagai, H., Kino, M., et al. 2012, ApJ, 746, 140
- Wada (2012) Wada, K. 2012, Astrophys. J., 758, 66
- Wagner et al. (2012) Wagner, A. Y., Bicknell, G. V., & Umemura, M. 2012, Astrophys. J., 757, 136
- Wajima et al. (2020) Wajima, K., Kino, M., & Kawakatu, N. 2020, Astrophys. J., 895, 35
- Walker et al. (2000) Walker, R. C., Dhawan, V., Romney, J. D., Kellermann, K. I., & Vermeulen, R. C. 2000, Astrophys. J., 530, 233
- Zovaro et al. (2019) Zovaro, H. R. M., Sharp, R., Nesvadba, N. P. H., et al. 2019, MNRAS, 484, 3393