The thermoelectric conversion efficiency problem: Insights from the electron gas thermodynamics close to a phase transition
Ilia Khomchenko1,2,3, Alexander Ryzhov1, Franziska Maculewicz4, Fritz Kurth5, Ruben Hühne5, Alexander Golombek6, Marika Schleberger6, Christophe Goupil7, Philippe Lecoeur8, Anna Böhmer9, Giuliano Benenti2,3,10, Gabi Schierning11 and Henni Ouerdane1
1 Center for Digital Engineering Skolkovo Institute of Science and Technology, 30 Bolshoy Boulevard, bld. 1, 121205 Moscow, Russia
2 Center for Nonlinear and Complex Systems, Dipartimento di Scienza e Alta Tecnologia, Università degli Studi dell’Insubria, via Valleggio 11, 22100 Como, Italy
3 Istituto Nazionale di Fisica Nucleare, Sezione di Milano, via Celoria 16, 20133 Milano, Italy
4 Faculty of Engineering and CENIDE, University of Duisburg-Essen, Duisburg, Germany
5 Leibniz-IFW Dresden, Institute for Metallic Materials, 01069 Dresden, Germany
6 Department of Physics and CENIDE, University of Duisburg-Essen, Duisburg, Germany
7 Laboratoire Interdisciplinaire des Energies de Demain(LIED), CNRS UMR 8236, Université de Paris, 5 Rue Thomas Mann, F-75013 Paris, France
8 Center for Nanoscience and Nanotechnology (C2N), CNRS, Université Paris-Saclay, 91120 Palaiseau, France
9 Institute for Experimental Physics IV, Ruhr-Universität Bochum, Bochum, Germany
10 NEST, Istituto Nanoscienze-CNR, I-56126 Pisa, Italy
11 Department of Physics, Experimental Physics, Bielefeld University, Bielefeld, Germany
⋆ h.ouerdane@skoltech.ru
Abstract
The bottleneck in modern thermoelectric power generation and cooling is the low energy conversion efficiency of thermoelectric materials. The detrimental effects of lattice phonons on performance can be mitigated, but achieving a high thermoelectric power factor remains a major problem because the Seebeck coefficient and electrical conductivity cannot be jointly increased. The conducting electron gas in thermoelectric materials is the actual working fluid that performs the energy conversion, so its properties determine the maximum efficiency that can theoretically be achieved. By relating the thermoelastic properties of the electronic working fluid to its transport properties (considering noninteracting electron systems), we show why the performance of conventional semiconductor materials is doomed to remain low. Analyzing the temperature dependence of the power factor theoretically in 2D systems and experimentally in a thin film, we find that in the fluctuation regimes of an electronic phase transition, the thermoelectric power factor can significantly increase owing to the increased compressibility of the electron gas. We also calculate the ideal thermoelectric conversion efficiency in noninteracting electron systems across a wide temperature range neglecting phonon effects and dissipative coupling to the heat source and sink. Our results show that driving the electronic system to the vicinity of a phase transition can indeed be an innovative route to strong performance enhancement, but at the cost of an extremely narrow temperature range for the use of such materials, which in turn precludes potential development for the desired wide range of thermoelectric energy conversion applications.
1 Introduction
The growth of the semiconductor industry more than 60 years ago enabled significant advances in many solid-state device applications, including lasers, photovoltaics, signal amplification, and thermoelectricity [1]. These applications are now used commercially, but not all to the same extent. A comparison between thermoelectricity and photovoltaics shows the following: Their exploration began in the first half of the 19th century; both technologies benefited from the development of semiconductor physics and technology over several decades; and although both can be considered equivalent in terms of maturity, thermoelectricity is not as widely used and integrated into power systems as photovoltaics [2, 3]. Thermoelectricity is often seen as a promising solution for power generation using the vast waste heat reservoir, but so far it has not proven to be efficient or scalable to fulfill this promise [4].
Both thermoelectric and photovoltaic technologies rely on the ability of electrons to perform energy conversion [6, 5], but the latter proves to be much more efficient than the former. From a thermodynamic perspective, one explanation for this difference lies in the nature of the boundary conditions to which the electronic working fluid is subjected to produce work. If energy from an external source is supplied to the electron system at temperature , the change in internal energy is , where is the electric potential difference across the system, is the change in electric charge, and is the entropy change of the system. Since thermoelectric generators require a fixed temperature difference (thermal potential) to operate, while photovoltaic converters operate under a photonic flux and isothermal conditions, the electron gas response is necessarily different.
In photovoltaic converters, most of the high-grade photon energy is used to activate the valence band electrons into conduction states, since the photon energy coincides with the energy gap, and comparatively little is used for heating. In thermoelectric converters, much of the low-grade thermal energy supplied to the working fluid is dissipated to the individual degrees of freedom of the electron gas, heating it, while little is used for the collective response, i.e., electronic convective heat transport [7]. Therefore, the efficiency is low. One way to increase thermoelectric conversion efficiency is to subject the electron gas to suitable working conditions to enhance thermoelectric coupling, either by band structure engineering [8] or by preparation in a particular thermodynamic state such as a phase transition, either structurally [10, 11, 12, 9, 13], or electronically, as in [14, 15]. In the electronic phase transition, the focus is on the locus of energy conversion - the electronic working medium. In this way, more input energy is allocated to the collective response and the fraction of entropy that can be reversibly transported during the conversion process is maximized.
In thermoelectrics, performance is evaluated by the dimensionless ratio , which includes only the linear transport properties of materials at temperature [16]:
| (1) |
where denotes the Seebeck coefficient, the electrical conductivity, and the thermal conductivity. Since both the electron gas and the lattice conduct heat, the total thermal conductivity is ; and is the Lorenz number. Ideally, one aims to minimize heat transport by conduction, i.e., both and , while maximizing the Peltier term associated with heat transport by convection [7]. This useful heat transport mode can be characterized by the conductivity at zero electrochemical potential gradient , which is related to as follows: [17]. While efforts are made to increase [18] or to optimize working conditions [19], the question of whether there is an upper bound on is usually neglected. High values of , e.g., , were considered difficult to achieve more than 20 years ago [20], and still are today. A would potentially have a maximum efficiency equivalent to about half the Carnot efficiency [21]. Only then could thermoelectric devices roughly match heat engines in terms of performance [4].
Since phonon effects cannot be completely suppressed, in this paper we look for ways to maximize the power factor. This would pave the way to a significant increase in conversion efficiency. Usually, an increase in results in a decrease in . The reason is that the entropy per charge carrier can normally increase only by decreasing the concentration of conduction electrons; therefore, the maximum power factor is reached at charge carrier concentrations of heavily doped semiconductors [23]. Interestingly, it has been shown theoretically [24] and experimentally [25] that in quantum wells and in thin films, the Seebeck coefficient can increase without decreasing the electrical conductivity if the well width or film thickness can be reduced to dimensions smaller than the electron de Broglie wavelength. In addition, several works have shown that in strongly correlated materials, the Wiedemann-Franz law does not constrain the interrelation of Seebeck coefficients and electrical conductivity as much as in normal degenerate semiconductors and metals. In single crystal oxides [26, 27] and Kondo lattice materials [28, 29], the strong electron-electron interactions as well as the spin and orbital degrees of freedom have been found to promote improved thermoelectric properties.
In addition to strong correlations, other phenomena such as thermally induced phase transitions in electron systems can influence the thermoelectric transport parameters. Experiments with different families of superconducting compounds shows that the temperature dependence of the Seebeck coefficient has a maximum near the critical temperature after a significant increase, while the electrical resistance decreases [30, 31, 32]. Depending on the material, the change can be either abrupt or gradual. The detailed mechanisms underlying phase transitions in high-temperature superconductors are not yet fully understood. Therefore, modeling of experimental results relies heavily on phenomenological approaches to account for the peculiarities of the nonconventional superconducting materials, which include cuprates and pnictides. In particular, ferropnictides exhibit a rich phase diagram with different types of orders, e.g., orbital, magnetic, or structural, which in turn leads to an interplay between phases [33, 34]. Of great interest is the nematic order (electronic state that breaks the lattice rotational symmetry) in pnictides, since it is still unclear whether unconventional superconductivity and nematicity are due to the same underlying microscopic mechanisms [35]. Furthermore, nematicity has been shown to significantly affect the thermopower [36].
The present work serves three aims: 1. to better understand the influence of the thermoelastic properties of the conduction electron gas on the coupled heat and charge transport properties; 2. to explore non-conventional ways to increase the power factor by tuning the working conditions; 3. to estimate the penalties that this increase in energy conversion efficiency entails.
Aim 1 highlights the thermodynamics of thermoelectricity, where we restrict ourselves to analytically tractable models. Discussion of phenomenological models, such as those used for nematic fluctuations, are beyond the scope of this work. Aim 2 focuses on phase transitions as a possible means of achieving large power factors. This is treated theoretically using an analytical two-dimensional model of fluctuating Cooper pairs, as a tractable model system for our approach. Further, we show experimental measurements of a thin superconducting film of an iron pnictide in which nematic fluctuations are characteristic of the phase transition, for which comparably tractable analytical models are currently lacking. However, this experimental model system has the advantage that the Seebeck coefficient signature associated with the phase transition is extremely strong. Aim 3 relies on thermodynamic calculations to provide a discussion of the trade-off between performance improvement and what the conditions that allow performance improvement implies for the use of efficient thermoelectric devices.
We focus on the conducting electron gas as an idealization of thermoelectric systems in the sense that we are interested in the conditions that enhance the performance of the working fluid that performs the energy conversion in a heat engine. We thus establish a link between the thermoelastic properties of the electronic working fluid and its transport properties. For the theoretical analysis, we consider two-dimensional electron systems (electron gas and fluctuating Cooper pairs). Our numerical results show that the closer to the superconducting phase transition, the larger the power factor can be when increases, while does not decrease due to the transport properties of the 2D fluctuating Cooper pairs.
In this work, we also show experimental results obtained on a 100-nm Ba(Fe1-xCox)2As2 thin film. This experimental model system is characterized by a large nematic susceptibility related to strong nematic fluctuations. The nematic phase transition has been shown to be electronically driven [37]; it generates strong (nematic) fluctuations in the system of electrons as well as strong resistivity anisotropy [38]. This phase transition is therefore ideally suited to experimentally demonstrate the effects of electronic fluctuations on the Seebeck coefficient. We discuss our basic results from our theoretical study in light of these findings on nematic fluctuations in pnictide superconductors.
To complement our analysis, we calculate the maximum theoretical thermoelectric conversion efficiency of various electronic model systems: ideal 0-, 1-, 2- and 3-dimensional electron gases, and 2D fluctuating Cooper pairs. It is found that the efficiency goes into saturation rather quickly for all systems. The only exception is actually systems that undergo a purely electronic phase transition.
Details of the experimental data we use for the discussion, as well as formulas and calculations not shown in the main text, are included in a series of appendices.
2 Theory
Conduction electrons form a working fluid which has thermoelastic properties [15, 39]. A dimensionless thermodynamic figure of merit , which is directly related to the isentropic expansion factor, has been introduced as a combination of thermoelastic coefficients in Ref. [15]. The quantity is a measure of the energy conversion capability of the electronic working fluid from the thermostatics viewpoint; therefore, it should not be confused with the thermoelectric figure of merit determined by the transport coefficients as in Eq. (1). In the following, using a Carnot-type approach, we focus only on the working fluid and assume that everything else is ideal. This means that we ignore all other sources of dissipation that negatively affect performance, such as heat leaks across the lattice and coupling with the reservoirs. While phonon effects must be taken into account in the calculations of and overall energy conversion efficiency, we disregard them in our thermodynamic analysis of the electronic working fluid; here we want to see what maximum efficiency the electron gas can theoretically achieve and how it compares to the Carnot efficiency of ideal heat engines. So, as the heat transfer by conduction is reduced to the electronic contribution only, (and for the 2D fluctuating Cooper pairs – 2D FCP; see further below), the figure of merit of the electronic working fluid alone reads:
| (2) |
and of course .
2.1 Fundamental relations
From the thermodynamic point of view, the conduction electron gas, which transports both electric charge and energy, can be characterized by three extensive variables: internal energy , entropy and charge carrier number . The relationship between these variables is given by the definition of the internal energy of the system:
| (3) |
where the intensive conjugate variables of and , are the temperature and electrochemical potential . For an infinitesimal transformation between two equilibrium states, the fundamental relation (3) assumes the following differential form:
| (4) |
thus yielding:
| (5) |
The sequence (3) (4) (5) is important: from the assumption of extensivity of the internal energy (3) comes the Gibbs relation (4), followed by the Gibbs-Duhem relation (5), which shows how heat and electricity are coupled via the intensive variables and , and thus how thermoelectricity is deeply rooted in thermodynamics: A temperature gradient across the electron system generates a variation of its electrochemical potential with a proportionality coefficient equal to the entropy per carrier [40], , which in turn produces an electromotive force. If the temperature gradient is maintained, the nonequilibrium system reaches a steady state; if not, the system experiences transient dynamics and relaxes towards a new equilibrium state.
2.2 Thermoelastic coefficients and thermoelectric coupling
2.2.1 Definitions
The following set of equations summarizes the definitions that can be found in [15, 41]. In analogy with the classical gas, using the correspondence: and , we define the thermoelastic coefficients of a system of electrically charged particles:
| analogue to thermal dilatation coefficient | ||||
| analogue to isothermal compressibility | ||||
| analogue to isentropic compressibility | ||||
| analogue to specific heat at constant pressure | ||||
| analogue to specific heat at constant volume |
Physically, the isothermal compressibility , which is a measure of the variation of the system’s volume as the applied pressure changes, can be viewed here as a capacitance in circuit theory: with the correspondence and , we see that provides a measure of the ability of the system to store electric charges under an applied voltage, so that is a capacitance (in F). The application of Maxwell’s relations yields the following connection between the thermal dilatation coefficient and the isothermal compressibility :
| (11) |
where the notion of entropy per particle appears clearly as the ratio . One may also see how it relates to the coupling of and and how a thermostatic definition of thermoelectric coupling, , may hence be given:
| (12) |
as a measure of the average capacity per charged particle to transport both its electric charge and a share of the thermal energy . In this work, for an electron and for a 2D fluctuating Cooper pair, with being the elementary charge.
2.2.2 Conduction electron gas
The thermoelastic coefficients of the noninteracting electron gas can be computed as follows [15, 41]:
| (13) | |||||
| (14) | |||||
| (15) |
where is the Fermi-Dirac energy distribution function and the system’s density of state. The coefficient can be deduced from the previous three as shown with the calculation of the isentropic expansion factor shown further below.
2.2.3 Fluctuating Cooper pairs
Fluctuating Cooper pairs, are bosonic quasi-particles that exist in the metal phase when the pairing mechanism that binds two conduction electrons is maintained above the critical temperature of the superconducting phase transition [42]. A fluctuating Cooper pair typical size can reach the to Å range, while their size is in a more limited range in iron-based systems such as Co-doped BaFe2As2 single crystals, i.e. 10 to 100 Å[43]. While in bulk clean metals pairing due to thermal fluctuations above is possible only over a very small temperature range, pairing can occur well above in thin films as dimensionality and disorder also play a role in the pairing mechanism [44, 45]. The analysis of the working fluid constituted of 2D FCP thus necessitates a different approach as they do not form a non-interacting Fermi gas. In the theoretical part of the present work, we focus on the effect of 2D fluctuating Cooper pairs on the thermoelectric power factor close to .
The chemical potential of a system with pairs is derived from the free energy [42]:
| (16) | |||||
| (17) |
where , is the coherence length, the Boltzmann constant, and is the surface area of the 2D system. From Eqs. (16) and (17), we can obtain the following quantities:
The thermostatic definition of the 2D FCP thermoelectric coupling [46]:
| (18) |
The coefficient :
| (19) |
And the coefficient :
| (20) |
The coefficient can be deduced from the previous three as shown with the calculation of the isentropic expansion factor shown further below.
2.3 Isentropic expansion factor and thermodynamic figure of merit
In classical thermodynamics, the isentropic expansion factor is a measure of the ability of a working fluid to convert heat into work. The larger is in relation to , the more heat is converted into mechanical work at constant pressure: The working fluid expands when it receives thermal energy, whereas it cannot expand at constant volume, in which case the thermal energy only heats up the system. The correspondence between the conjugate thermodynamic variables of a classical working fluid, the volume and the pressure , and the variables relevant to a conduction electron gas, the number of electrons and the electrochemical potential : and , gives the thermoelectric heat capacity ratio at temperature [15, 39]:
| (21) |
Equation (21) is the definition of the thermodynamic figure of merit . The quantity is the thermostatic counterpart of Lorenz number in coupled transport; while the latter measures the ability of the system to conduct thermal energy relative to its ability to conduct electricity, the former measures the ability of the system to store thermal energy relative to its ability to gain conduction electrons [15]. Thus, in the context of thermoelectricity, should be small so that the electron gas tends to minimize heat transfer by conduction, while should be high so that the Peltier contribution to heat flow or heat transfer by convection [7, 15], i.e., electric charge transport, is maximized. Furthermore, if conditions are found where reaches high values or even diverges (such as near a phase transition [15, 39]), the system would tend to behave like an ideal working fluid with high efficiency in converting heat into work. In this work, we numerically calculate the isentropic expansion factor for the noninteracting electron gases (0D, 1D, 2D, and 3D) using the formulas (13) – (15).
The same analysis applies to the case of a fluctuating 2D Cooper pair gas. Using Eqs. (18)–(20) an analytical formula can be established: , and an expression of the thermodynamic figure of merit of the 2D FCP gas follows:
| (22) |
2.4 Transport coefficients near the superconducting phase transition
We now turn to the 2DEG just above the critical temperature and its thermoelectric properties driven by the 2D fluctuating Cooper pairs [42]. The existence of fluctuating Cooper pairs above gives rise to paraconductivity, which is a pair contribution that enhances the electrical conductivity [42, 47]. The thermal conductivity of fluctuating Cooper pairs, with a dimensionless parameter in the Ginzburg-Landau free energy functional, can be calculated as the response to an applied temperature gradient [42, 48]. The Seebeck coefficient reads [49, 50]. The thermoelectric figure of merit of the 2D FCP in the fluctuating regime near thus reads:
| (23) |
which is diverging the closer the electron system gets to the critical temperature, i.e. as .
It is interesting to note that in the limit , while may remain finite, but this does not pose any problem in terms of performance of the ideal 2D FCP system, as the system tends to become an “electron crystal” and this fact contributes to make larger. Including in the calculation of full figure of merit would negatively impact on the performance, but here we see that without heat leaks, the conversion efficiency can tend to the Carnot efficiency of an ideal heat engine in the limit .
It is also instructive to calculate the Lorenz number for the 2D fluctuating Cooper pairs :
| (24) |
As the system’s temperature tends to , , which clearly deviates from the standard Lorenz number: . In this case, the power factor shows a diverging behavior in the limit . The thermoelectric working fluid in the fluctuating region near thus acquires the desired properties for higher conversion efficiency.
3 Results
3.1 Correlations between thermoelectric figure of merit and thermodynamic figure of merit
Ideally, thermoelectric conversion should be isentropic: all the thermal energy supplied to the conduction electron gas should serve for convective heat transport [7]. The relation [17] is similar to in Eq. (21) and thus defines an isentropic expansion factor in the context of electron transport: . In this way, the thermodynamic figure of merit of the conduction electronic gas, which is directly related to the isentropic expansion factor , connects the thermodynamic and transport properties of the electronic working fluid at temperature .
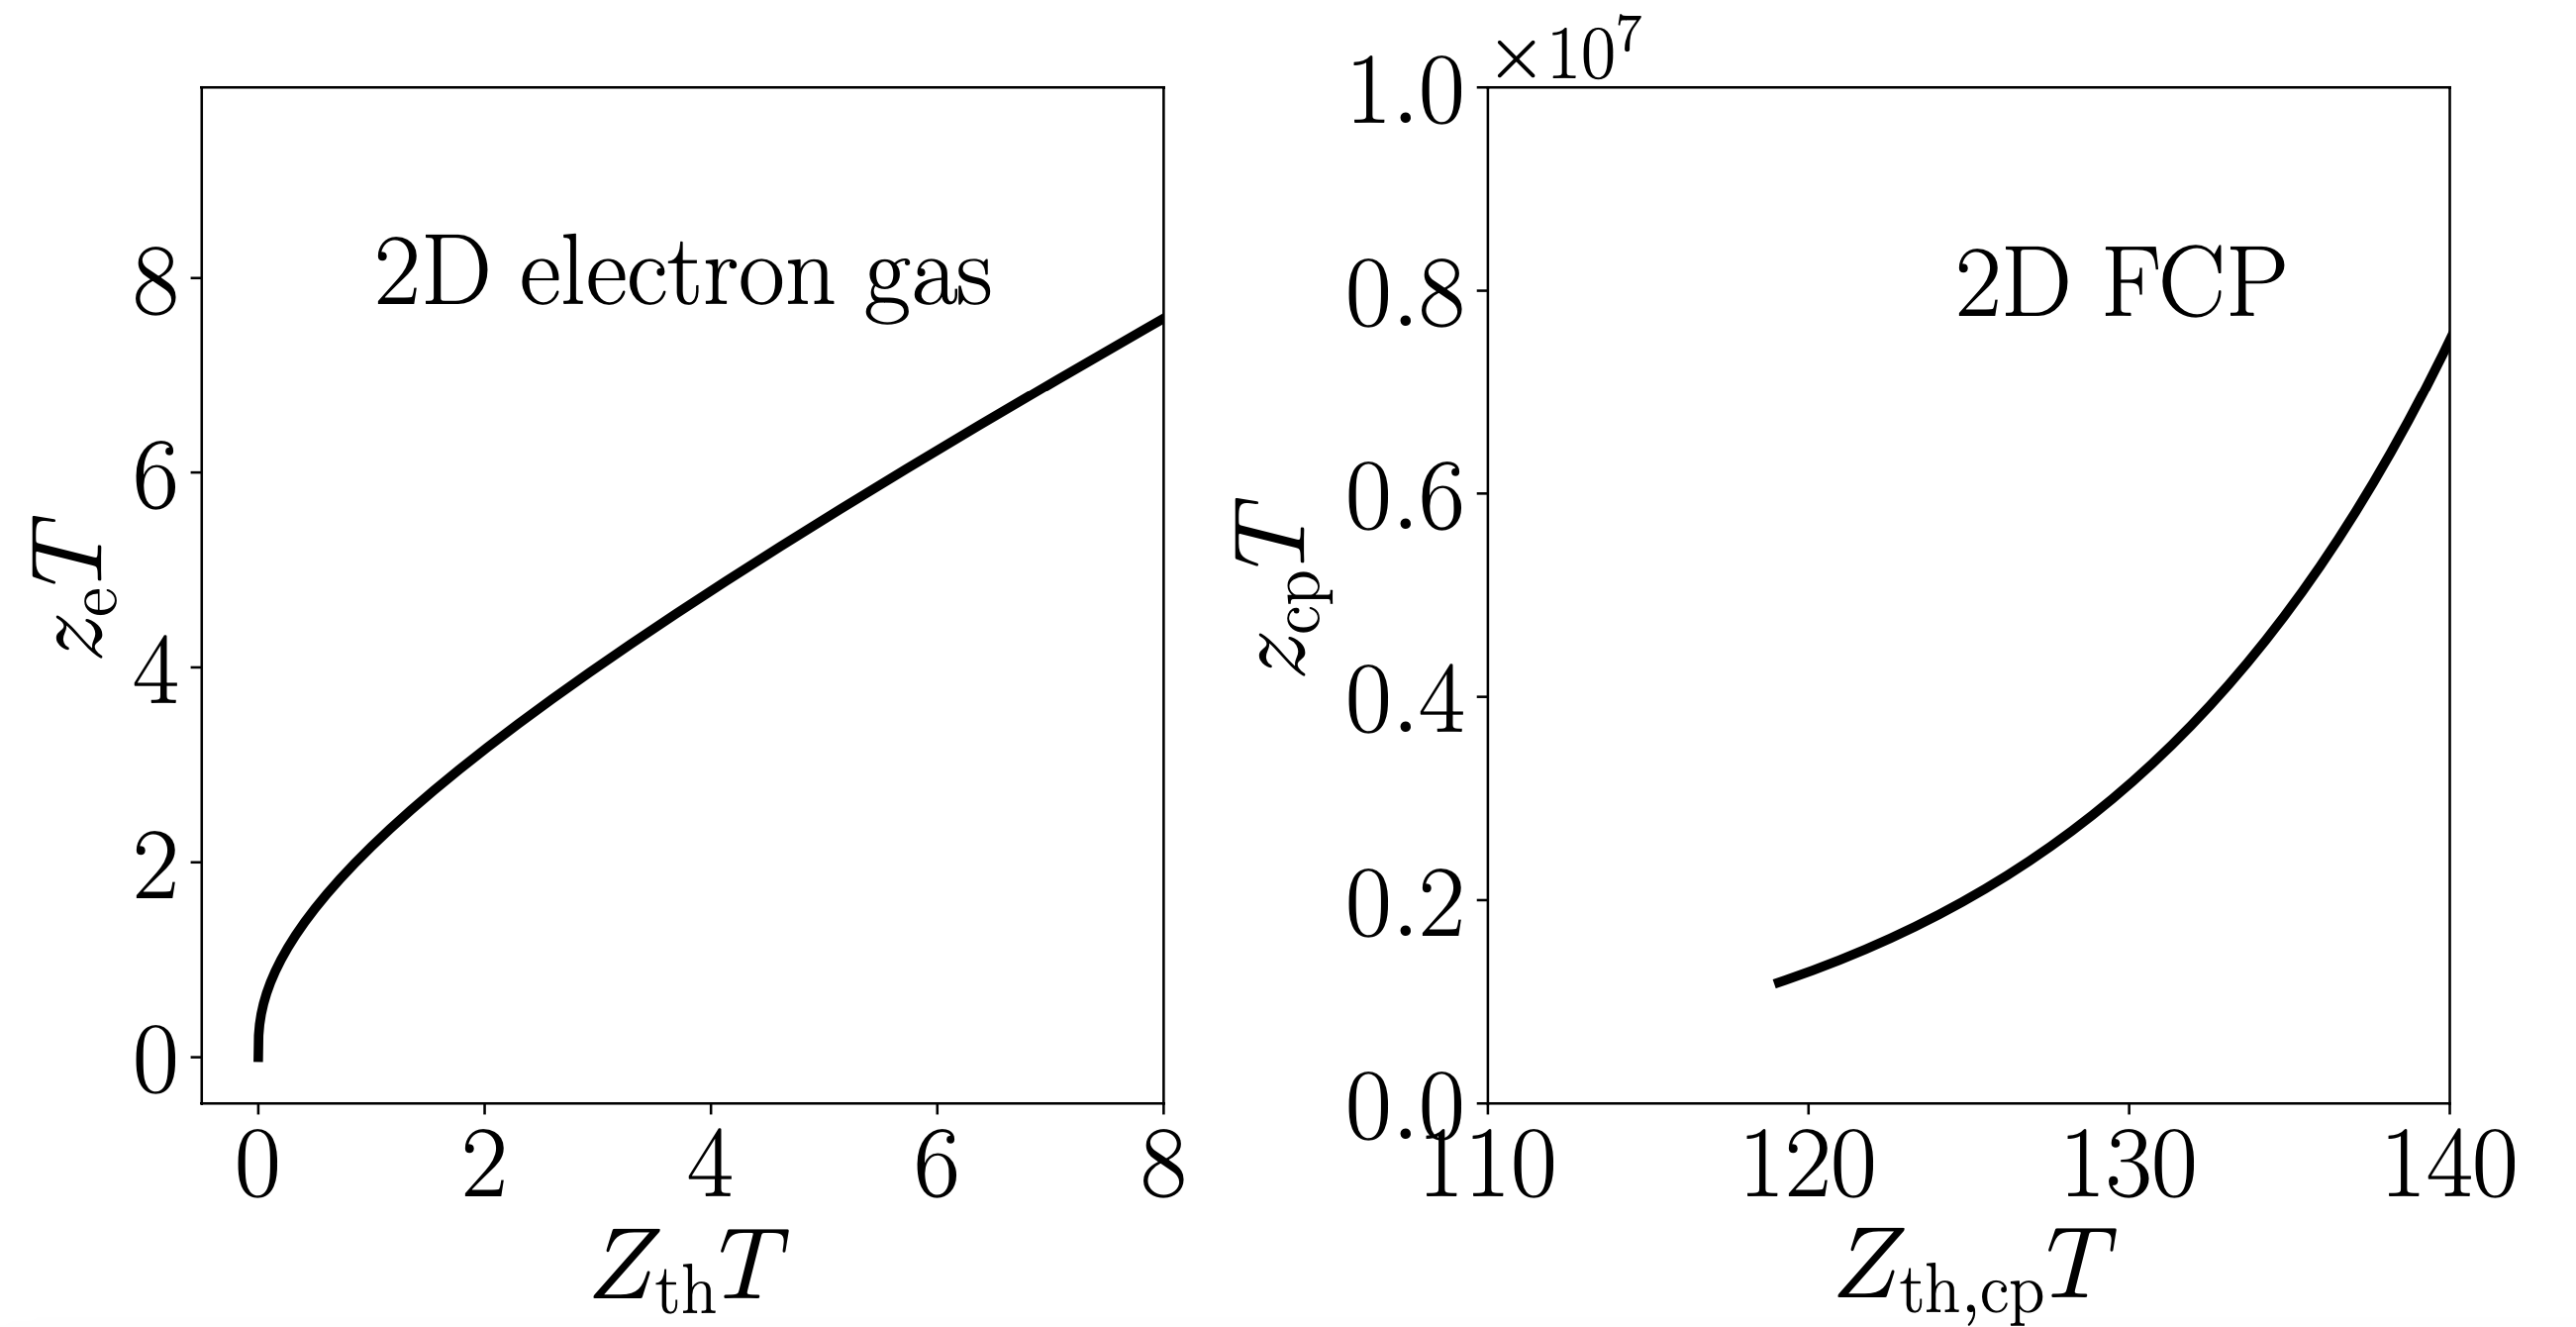
In Fig. 1, the correlations between and , and between and , give the deviation of from the standard in thermostatics, in both the normal thermodynamic regime and the fluctuating regime in the 2D systems. The curves show a monotonic increase of against . Note the different magnitudes between the case where a phase transition occurs and the one where it does not (see also the additional curves for 0D, 1D, and 3D systems in the appendix C). This clearly shows that the power factor can reach extremely high values if suitable boundary conditions are imposed on the electron gas. It is instructive to see how this theoretical result can be related to experiments close to , in the vicinity of a phase transition.
3.2 Measured Seebeck coefficient and electrical conductivity in a
Ba(Fe0.90Co0.10)2As2 thin film
The experimental data used in this study are from an epitaxially grown 100-nm thick pnictide Ba(Fe0.90Co0.10)2As2 thin film on a CaF2 substrate, which exhibits extremely good structural and compositional quality. The superconducting properties of comparable samples were previously described in Ref. [51]. After characterizing the transport properties, we introduced defects into the thin film by ion bombardment with 10 keV argon ions. The same but degraded sample was then characterized again. Details are given in Appendix D.
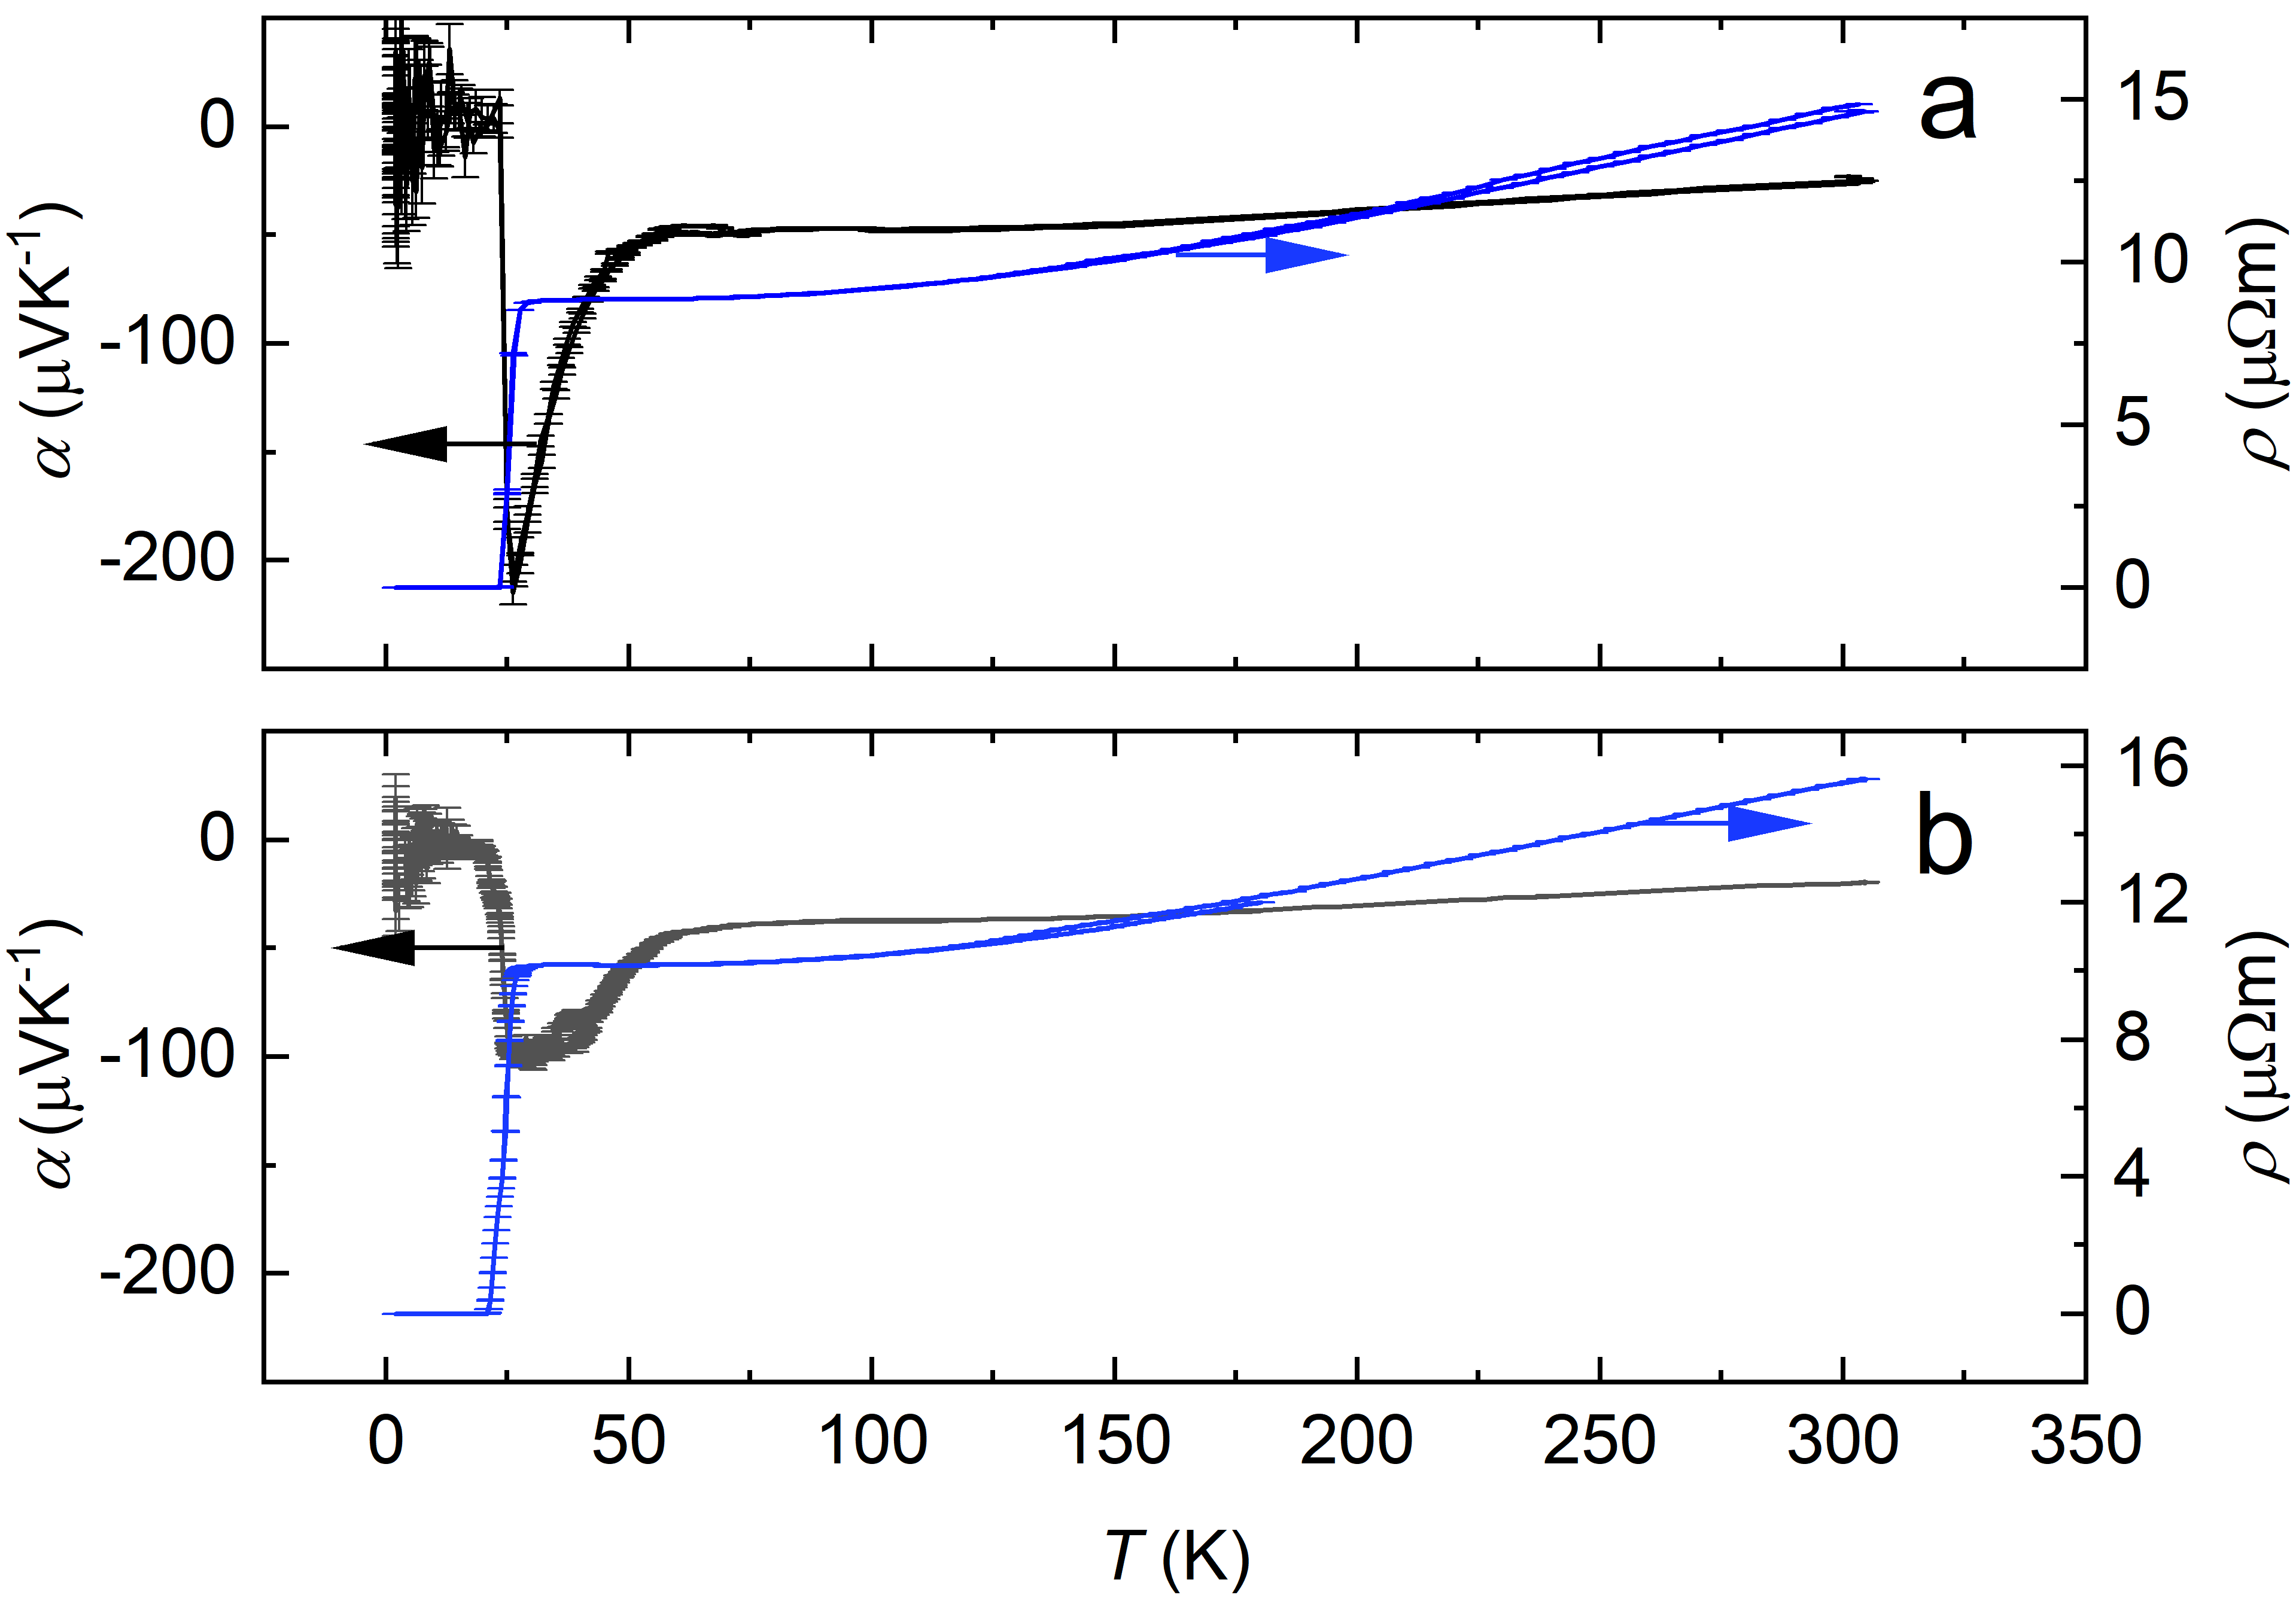
Figure 2 shows the Seebeck coefficient and electrical resistivity of the thin film. The measurements shown in the upper panel were performed on a sample with high structural quality, while the lower panel shows data from the same sample with low structural quality after ion bombardment. The Seebeck coefficient clearly shows the onset of nematic fluctuations. For a sample of this composition, one would expect the strong enhancement of nematic fluctuations below 50 K [38, 52]. It is obvious that these fluctuations have little effect on the electrical resistance. The transition from an electron system without fluctuations to an electron system with fluctuations is not evident in . However, this can be understood qualitatively by considering the influence of a fluctuation regime near a phase transition on the Seebeck coefficient. Small fluctuations that are not noticeable in resistivity can already have significant effects on the Seebeck coefficient. In other words, from the thermodynamic viewpoint, electronic fluctuations modify the thermostatic properties of the electron gas in such a way that the thermoelectric coupling or entropy per electron increases, while electrical conductivity is not as much influenced. Note that the traditional descriptions of the Seebeck coefficient, e.g., in the Boltzmann model, which often argue with the change in conductivity, cannot help in interpreting the data here.
Structural quality has a limited effect on both the Seebeck coefficient and electrical resistivity away from the superconducting phase transition region and above the onset for nematic fluctuations, here above 50 K. At lower temperatures, however, it has a strong effect on the Seebeck coefficient, as shown by the dramatic reduction in the magnitude of , which contrasts strongly with the temperature dependence shown in the upper panel. While defects strongly impact superconducting fluctuations, this remains unclear when it comes to nematic fluctuations. We note however, that the nematic transition temperature does not change dramatically with irradiation. Physical interpretation of these observations necessitate a model of the influence of structural defects and disorder on the thermostatics of the electron gas in the fluctuation regime, which is beyond the scope of the present work.
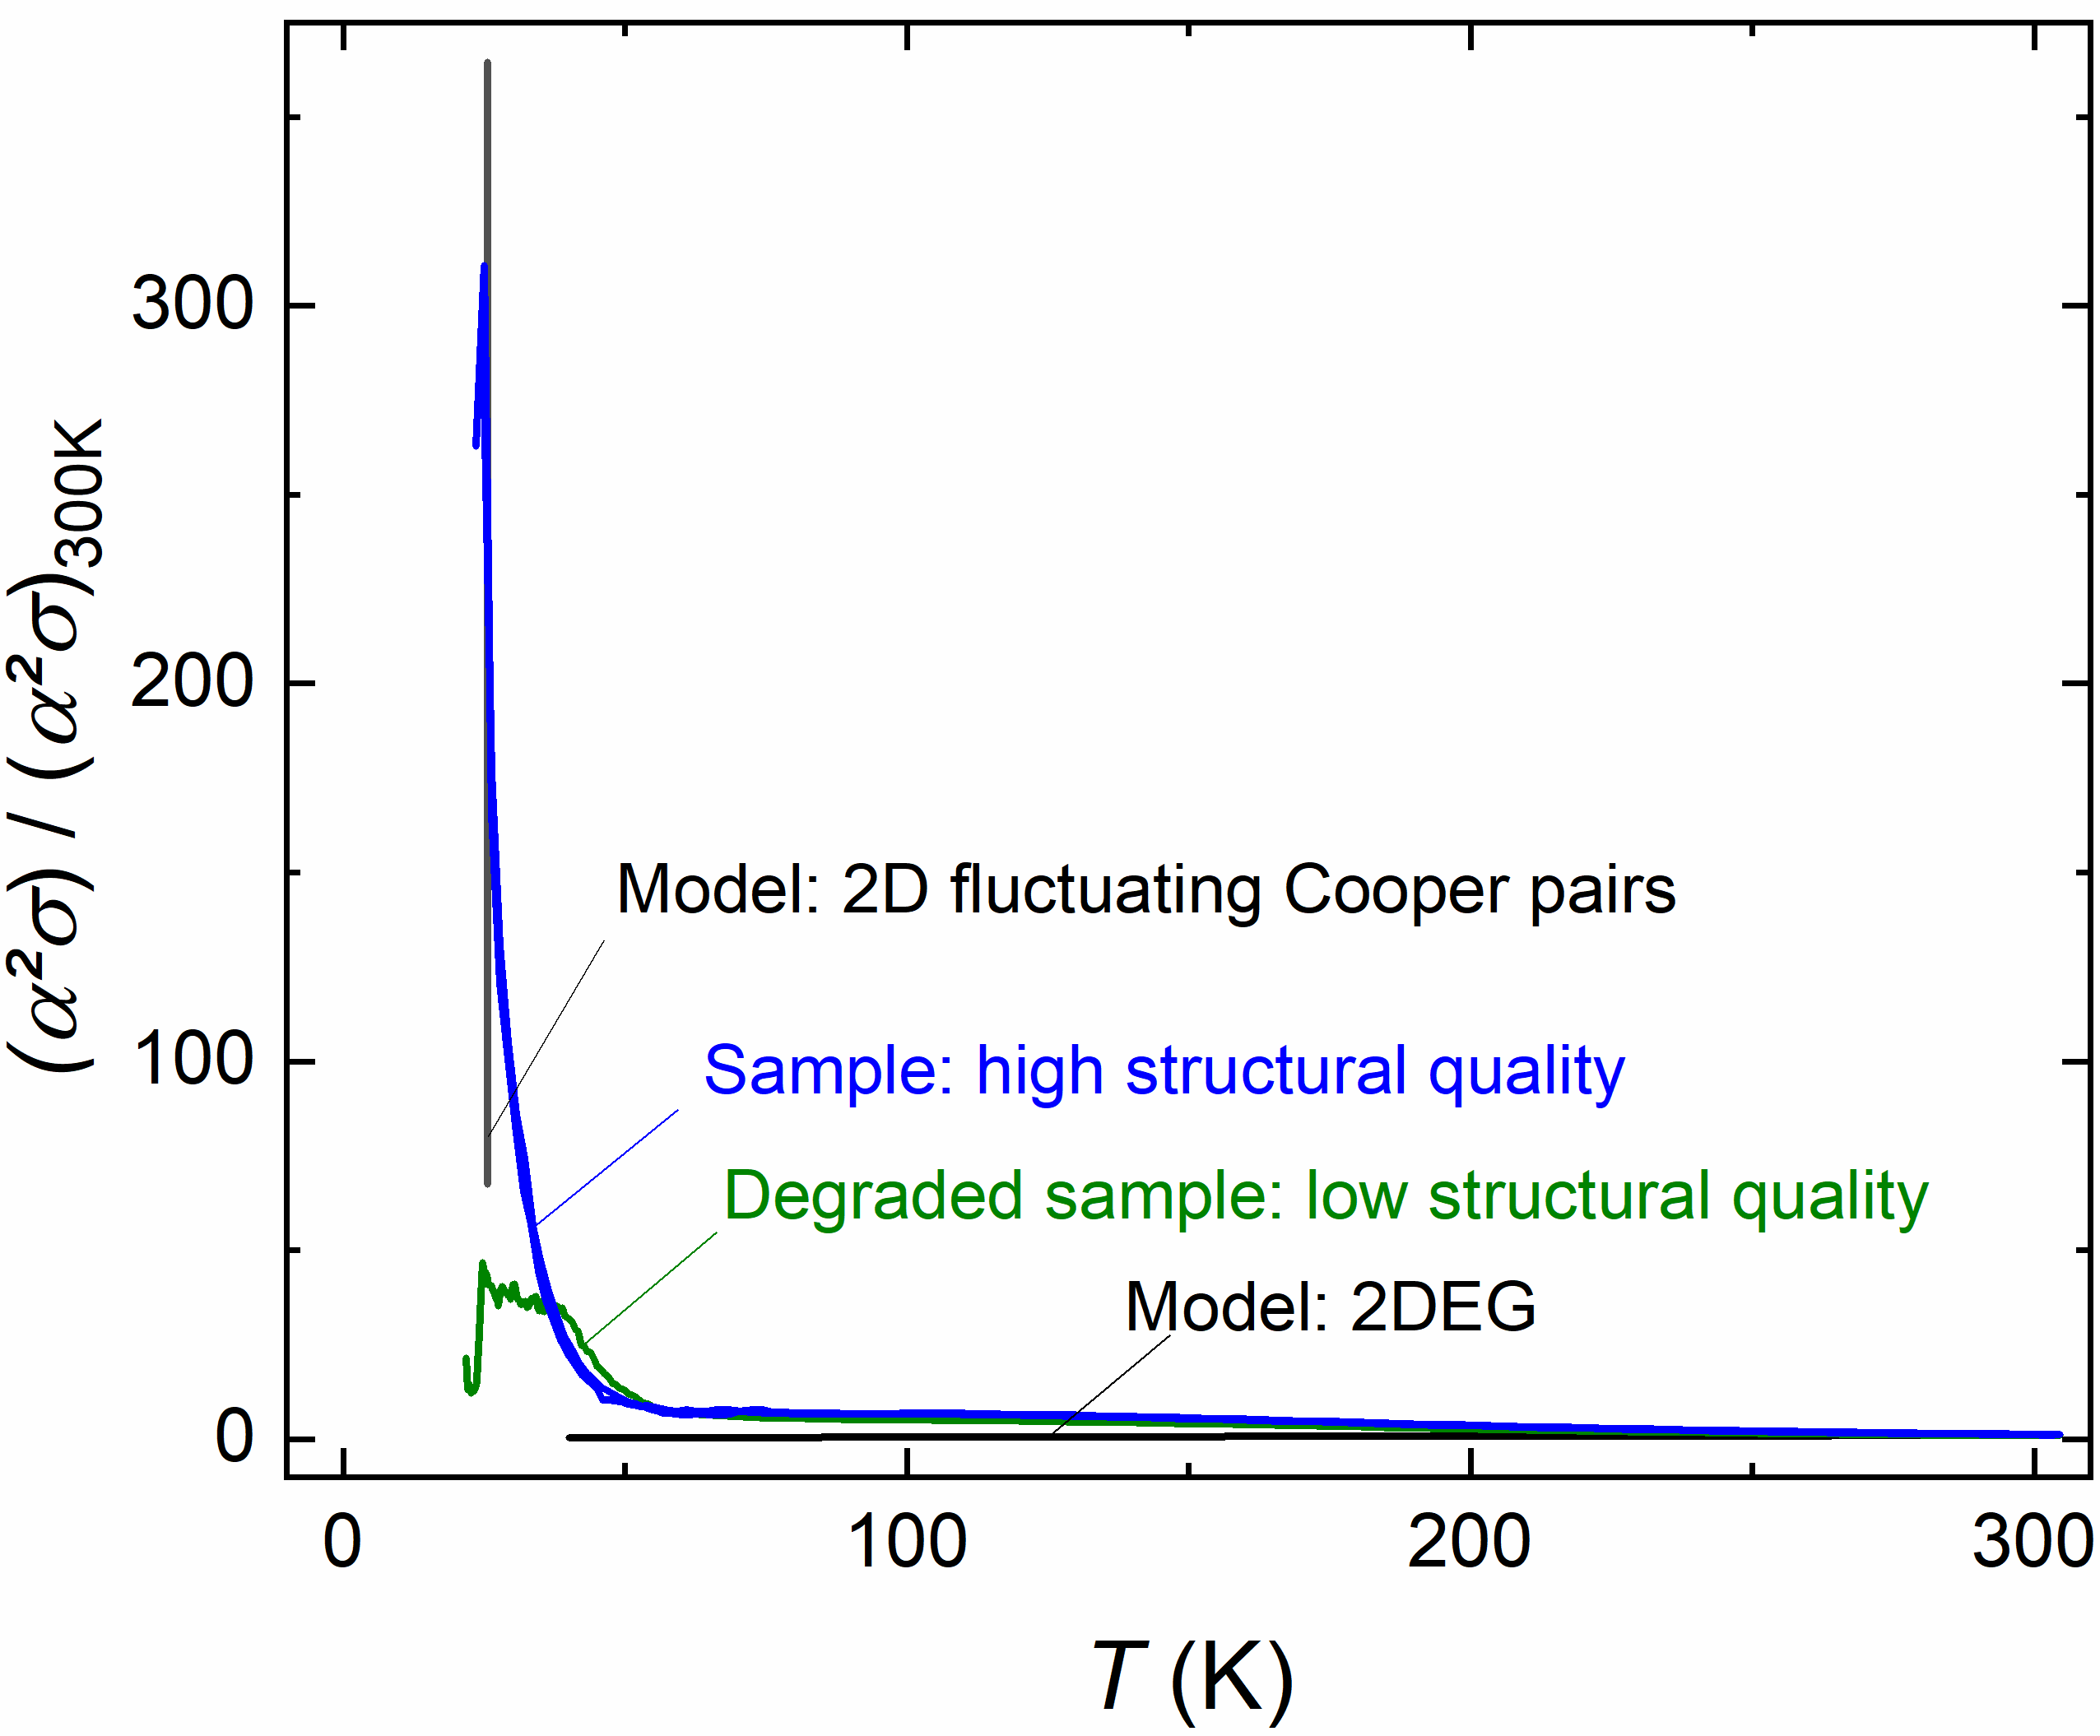
In Fig. 3, the power factor (normalized to its value at K) calculated using the transport coefficients of the 2DEG and 2D FCP is shown and compared with experimental data obtained with the high and then low structure quality samples (after ion bombardment). These 2D models are of course highly idealized, however the 2D FCP, though based on restrictive assumptions, may support the idea that a strongly fluctuating regime in the close vicinity of a critical point fosters the enhancement of the Seebeck coefficient. More realistic numerical data would at least require, for example, a density of states modified by a thickness-dependent form factor and electronic correlations to be taken into account.
4 Discussion
4.1 Experimental data interpretation
An increase in the absolute value of the Seebeck coefficient before entering the superconducting region has been reported in the literature. Fairly sharp peaks of the Seebeck coefficient, comparable to our experimental results, were measured in nearly ideal electron-doped La2-xCexCuO4 thin films. Both sharp and broadened Seebeck peaks were detected for SmFeAsO1-xFx and Fe1+yTe1-xSex [32]. In [30], a strong increase in the Seebeck coefficient of a series of pnictides was shown in which the Sm lattice position was replaced by Nd and La. This increase was accompanied by a strong improvement in the power factor. Broadened peaks of the Seebeck coefficient were found in different pnictide compositions [53, 54] as well as in cuprates [55].
A steep increase in the Seebeck coefficient before entering the superconducting state is also known for elementary superconductors, e.g., Pb and Nb superconductors [56, 57]. This effect is traditionally explained by the phonon resistance effect [58, 59]. In this study, we have shown that even in the absence of phonons, a sharp increase in the Seebeck coefficient would be possible, which would have its origin in fluctuations of the electron system. Our models focus only on the thermodynamics of the ideal electronic systems, and as shown in Fig. 3, they do not take into account the structural quality of the thin films, which affects the behavior of the Seebeck coefficient when the temperature varies and leads the system from the normal regime to the fluctuating regime.
Modeling our experimental data beyond the superconducting fluctuating region is a task that would require a full separate work. Detailed knowledge of the band structure and phonon spectrum, taking into account the effects at the film/substrate interface, would then be required. The experimental data show that the dependence of the Seebeck coefficient on temperature after degradation of the sample by ion bombardment does not vary greatly as the temperature drops because of other processes such as the scattering of phonons by defects that suppress phonon drag effects, on the one hand, and the defects that prevent fluctuations from occurring, on the other hand. A study of the phonon drag effect in thin films in the normal regime shows that the Debye temperature of the substrate influences the position and magnitude of the phonon drag peak as the drag effect varies with temperature [60]. Interestingly, it was also shown that the phonon drag effect is strongly suppressed with film thickness. Since the film thickness in our sample is 100 nm, we can assume that the phonon drag effect plays a role but is not dominant near . This is acceptable for the analysis of the behavior of the Seebeck coefficient and the power factor near the critical temperature .
While this was not studied in further detail within the scope of this work, we suggest that the variation of the peak shape of the Seebeck coefficient, i.e. sharp or broadened, is a result of structural or compositional inhomogeneities in these samples. With a quite good structural and compositional integrity of our sample, the data here presented serves as a model system to underline the influence of fluctuations. Close to the critical temperature, the Seebeck coefficient and the electrical conductivity evolve differently; Eq. (23) shows clearly the resulting temperature dependence of close to the superconducting phase transition. This illustrates the difference between the transport of charges characterized by , which is proportional to the carrier concentration, and the transport of entropy characterized by , which varies logarithmically with the concentration. Being close to favors a more rapid variation of . That said, more work is required to develop a model dedicated to the influence of nematic fluctuations on the transport coefficients to adequately describe the observed rise of the power factor from around 50 K as the temperature decreases. We suggest here that the clear and distinct increase of the Seebeck coefficient observed in our experiment is a consequence of driving the subsystem of conduction electrons to fluctuating regimes.
4.2 Ideal maximum efficiency
We end the discussion with an evaluation of the maximum thermoelectric conversion efficiency, , that the electronic working fluid can boast in a thermoelectric generator in (ideal) thermal contact with a heat source at temperature , and a heat sink at temperature . is related to the heat capacity ratio as follows [61, 62]:
| (25) |
where is the Carnot efficiency. Owing to the relationship between and , Eq. (25) confirms the well-known result that for a given set of boundary conditions, the larger the larger .
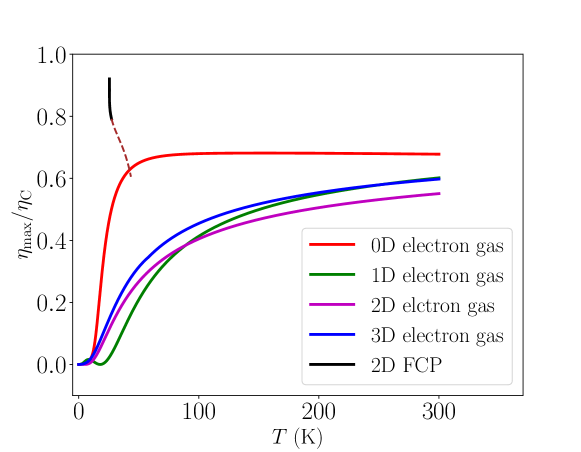
The maximum efficiency scaled to the Carnot efficiency calculated for all model systems considered in this work, is reported in Fig. 4. The curves demonstrate that though ideal cases are considered (the focus being on the working fluid only, and a situation with no dissipative coupling between the generator and the thermal energy reservoirs), the Carnot efficiency cannot be reached; for this to occur, the isentropic expansion factor of the conduction gas would have to diverge, implying that it would have the capability to convert almost all of the thermal energy it receives into work, or convective heat transport [7]. We saw in light of our thermodynamic analysis and experimental data, that bringing the electron gas close to a phase transition enhances the system’s power factor ; hence by increasing both the thermoelectric coupling and electrical conductivity, thus favoring convective transport, the conversion of heat into work can be significantly boosted, albeit in a very limited temperature range in our study. Figure 4 also shows that while increasing the temperature of the electron systems that do not undergo a phase transition, yields an increase of , their maximum efficiencies grow slowly and seem to saturate. For the system in the vicinity of a phase transition, the efficiency may tend to that of the ideal Carnot efficiency. Importantly, as we focused on the electronic working fluid only, the existence of an upper bound to accounting for the lattice thermal conductivity is demonstrated: for each system considered, the upper bound corresponds to that shown in Fig. 4.
5 Conclusion
The thermoelastic properties of the electron gas in the normal phase are such that even in an ideal situation, notwithstanding detrimental phonon effects and other external causes of heat leaks and dissipation, only up to about half of the thermal energy fed to the electrons can be used for their collective response, i.e. electrical current. A path forward may lie in finding very specific working conditions such as placing the electron gas in the vicinity of a phase transition that favorably modifies the heat capacity ratio, and in turn the electronic transport properties as shown by the substantial increase of the power factor. The theory and experiment reported in this paper describe different thermodynamic conditions but tend to independently show that efforts are to be invested in the control of the electronic transport properties close to a phase transition: the 2D fluctuating Cooper pairs close to and the nematic fluctuations over a wider temperature range foster the desired transport properties, resulting in a strong enhancement of the power factor. As already hinted in [15], the more compressible a working fluid is, the larger the heat capacity ratio is; so, our conclusion on the benefits that fluctuating regimes (here superconducting or nematic) can bring is consistent with the fluctuation-compressibility theorem [63, 64] in the context of thermoelectricity: the larger the electronic fluctuations are, the larger the isothermal compressibility is.
On the flip side, phase transitions impose that a thermoelectric generator operates only extremely close to the transition temperature and with a corresponding very small temperature bias. We thus see with the 2D fluctuating Cooper pairs that close to , the conversion efficiency can theoretically tend to the Carnot efficiency, but at the cost of narrowing down the applicability of efficient thermoelectric solutions for waste heat conversion. From the thermodynamic viewpoint this amounts to stating that the minimization of entropy production during the thermoelectric energy conversion necessitates strong constraints that preclude its use for power production beyond niche applications. Depending on the degree of control of the working conditions, a high power factor obtained close to a phase transition might rather prove more useful for pumping heat.
We finally emphasize the need to develop new experiments to further explore the physics of thermoelectricity in fluctuating regimes to bring new data and stimulate more theoretical research along the lines developed here, notably to develop more realistic models based on less restrictive assumptions than those used in the present work. Unconventional superconductors and strongly correlated systems offer a challenging yet rich field of play for that purpose.
Appendix A Transport coefficients in the relaxation time approximation
The transport coefficients for a variety of systems including low-temperature [65] and interacting systems [66, 67] can be calculated using the Boltzmann equation. The simplest assumption is that of the relaxation time approximation for the electrons [68, 69], in which case Onsager’s kinetic coefficients can be calculated as follows:
| (26) | |||
| (27) | |||
| (28) |
where is the system’s dimension, is the transport distribution function with being the relaxation time, the velocity, and the density of states [70]; and the transport coefficients read [17]:
| (29) | |||||
| (31) | |||||
where is the isothermal electrical conductivity, is the Seebeck coefficient, and is the thermal conductivity under zero electric current.
The relaxation time depends on various scattering processes, involving electron-electron interaction, electron-phonon interaction, ionized impurity scattering, and several others. These processes influence the electron mobility, which is given by . In the present work, we consider the electronic working fluid only, and the easiest approach for numerical calculations, is to make the additional approximation of constant relaxation time based on typical values of the electronic mobility. Choosing the values of the electron mobility as cm2/V s [71] for the electron gas in a bulk system, cm2/V s for the electron gas in a quantum well [72], and cm2/V s [73] for the electron gas in a nanowire, we thus use the following relaxation times: ps, ps, and fs, for our numerical results.
Appendix B Transport coefficients in the Landauer-Büttiker approach
In mesoscopic systems, the Landauer-Büttiker approach provides a means to calculate the transport coefficients accounting for the presence of scatterers [74, 68]. The application of the Landauer-Büttiker approach leads to expressions similar to Eqs. (29)(31) but with the electrical and thermal conductances, and respectively, instead of electrical and thermal conductivities, and [75]. The transmission function for two-terminal systems, coupled to two reservoirs, left (L) and right (R), is defined as
| (32) |
where are the level width functions, describing the broadening of energy levels, and is the “elastic lifetime”, i.e., the time between two collisions, with being the self-energy operators and and are the advanced and retarded Green functions respectively [68].
Appendix C Additional vs. curves
Here we show, the curves not shown in the main text, i.e. for the 0D, 1D and 3D electron gases. The 2D and 2D FCP cases are shown in Fig. 1. The thermoelastic coefficients and the transport coefficients for all systems can be computed from the formulas given above and combined as shown in Eqs. (1) and Eq. (21) in the main text, to obtain and (with ). As discussed in the main text, the parametric plot of against shows a clear correlation between the isentropic expansion factor and the thermoelectric figure of merit: the larger the former, the larger the latter.

All the curves depicted in fig. 5 show a monotonic behavior. It is interesting to note that for the 0D and 1D systems, the correlation is linear implying that the isentropic expansion factor in the transport regime does not deviate from the heat capacity ratio at equilibrium, while it does for the small values of and for finite-dimension systems. This originates in the energy dependence of the transport distribution functions and of the density of states in particular.
Appendix D Experimental
The Ba(Fe0.90Co0.10)2As2 thin film composition corresponds to the close-to-ideal doping case for these epitaxial growth conditions [76], reflected by a high transition temperature of 25.6 K. The thin film was prepared by pulsed laser deposition method in ultra-high vacuum of 10-9 mbar utilizing a KrF excimer laser. The pnictide thin film was grown with a frequency of 7 Hz at 700 ∘C, while its thickness was controlled by the number of pulses. Similar pnictide thin films were studied in detail in Refs. [51, 76, 77].
The thermoelectric properties of the sample were characterized by a Physical Property Measurement System of the Quantum Design DynaCool series (9 T), equipped with a thermal transport option. Utilizing the thermal transport option, the experimental parameters Seebeck coefficient and electrical resistivity were measured simulteanously and continously as a function of temperature. Hereby, the sample was subjected to a thermal pulse, and its temperature and voltage responses were recorded. The Seebeck coefficient was extracted from these data, and the resistivity was characterized subsequently. Electrical contacts were made by a conducting silver-particle based two component epoxy glue that is recommended from Quantum Design for the thermal transport option. Note that both Seebeck coefficient and electrical resistivity could only be characterized in the normally conducting state of the sample, since and in the superconducting state. The thermal transport option of the DynaCool, in principle, also provides thermal conductivity data. But for this thin film sample, these data were completely dominated by the thermal conductivity of the CaF2 substrate, and are therefore not shown here.
D.1 X-ray diffraction characterization
The structure of the grown film was studied using X-ray diffraction (XRD) using a Bruker D8 Advance diffractometer with Co-Kα radiation for standard measurements and a Panalytical X’Pert system with Cu-Kα radiation for texture measurements.
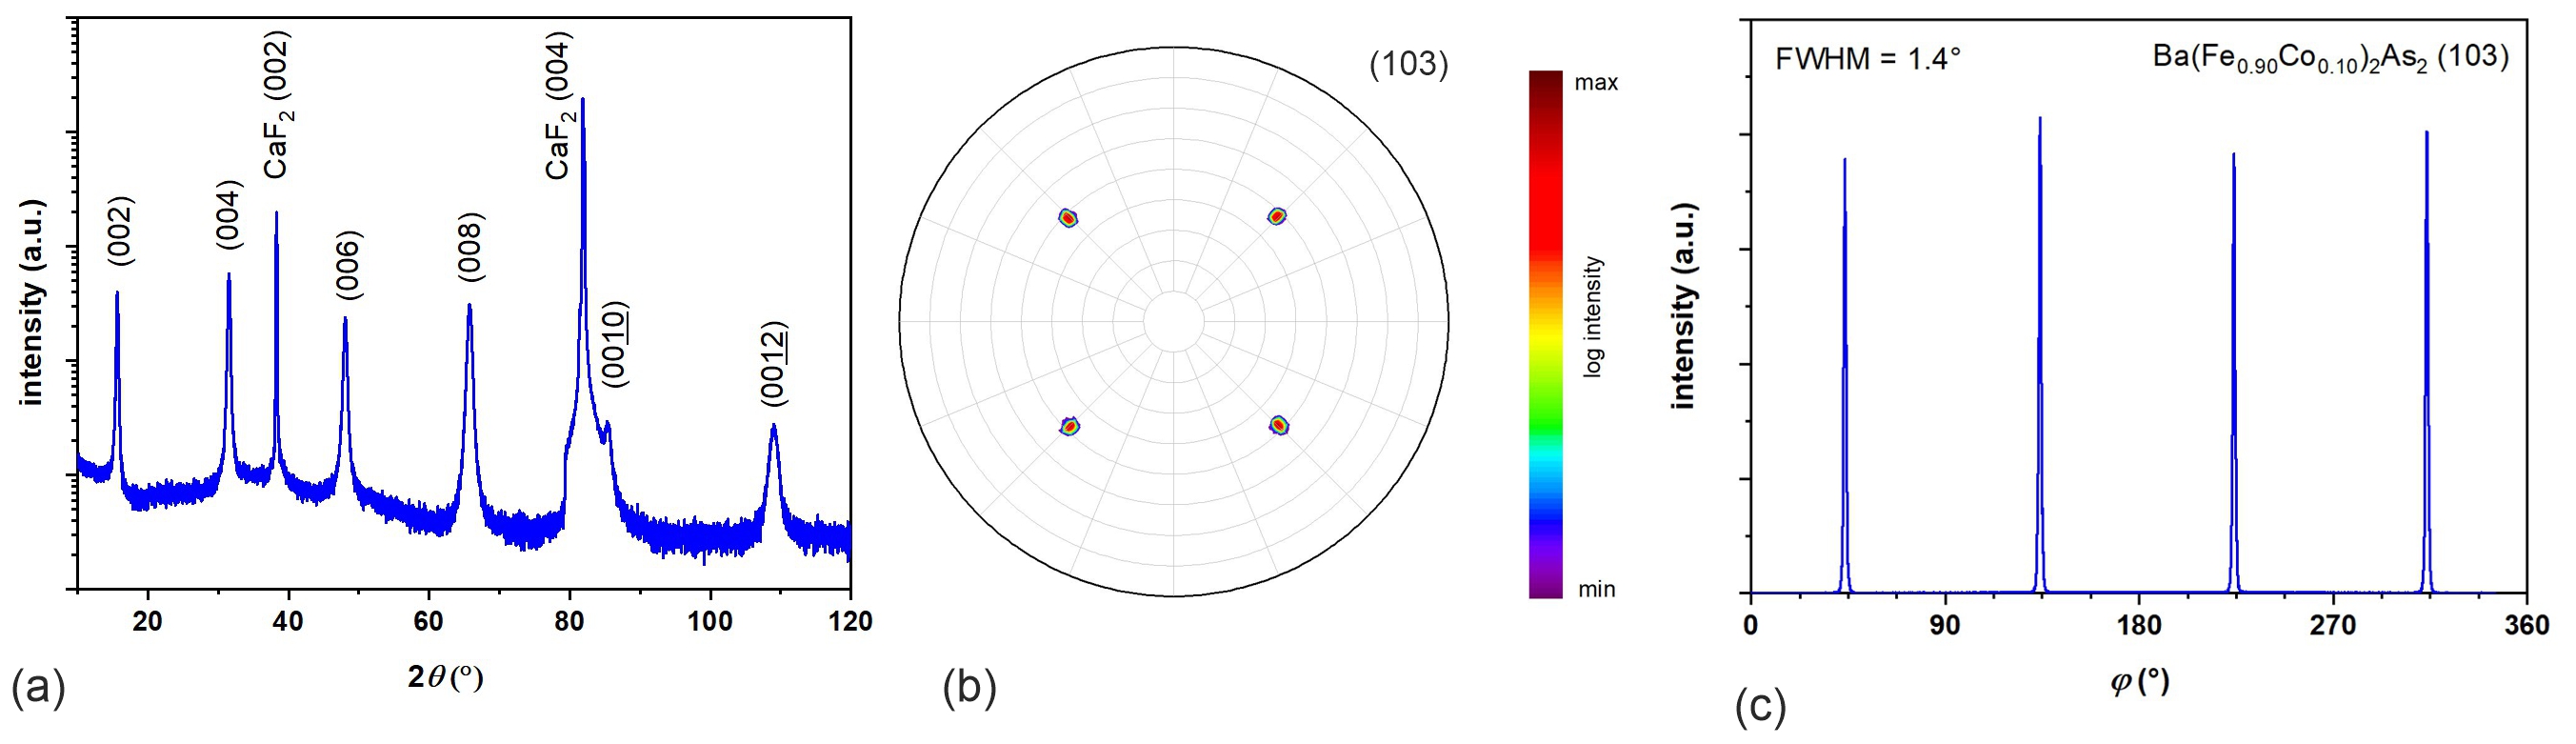
XRD studies showed only (00) peaks in the scans indicating a clear c-axis orientation of the film (Fig. 6(a)). The c-axis lattice parameter was determined to 1.319 nm. Texture measurements revealed an epitaxial growth with a sharp in-plane alignment having a full width at half maximum (FWHM) value of 1.4∘ (Fig. 6(b,c)). The results are almost identical to data published previously on Ba(Fe0.90Co0.10)2As2 films prepared under similar deposition conditions [51]. Therefore, we assume also a similar clean microstructure with a small reaction layer towards the substrate as shown by high resolution transmission electron microscopy in this work.
D.2 Ion bombardment
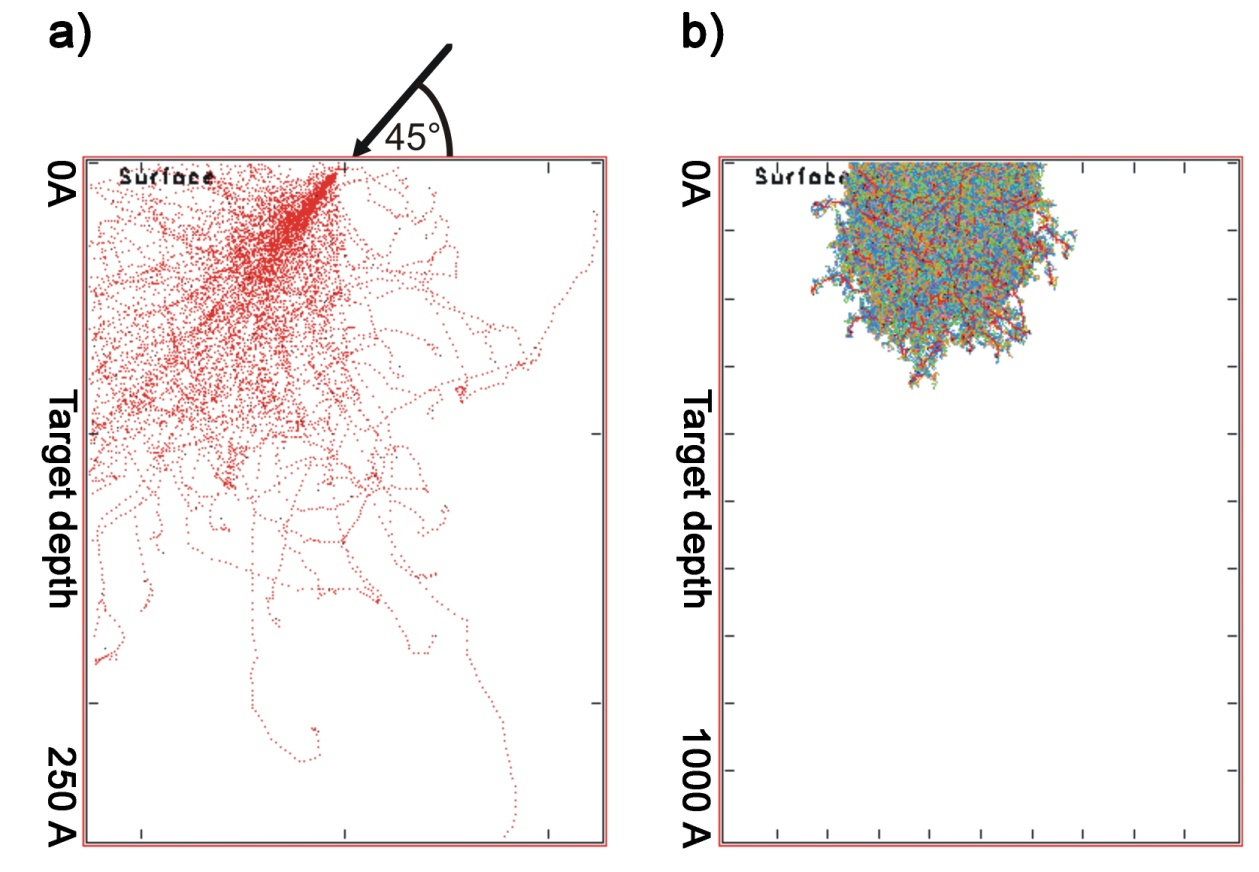
To introduce defects into the 100-nm-thick Ba(Fe0.90Co0.10)2As2 thin film deposited on the CaF2 substrate, it bombarded with argon ions with a kinetic energy of 10 keV and with a fluence of 8.51012 ions per cm2 hitting the sample under an angle of incidence of 45∘. In this energy regime, the damage is almost exclusively due to nuclear stopping, i.e. binary collisions between atoms. The resulting collisional cascades of ions (see Fig. 7a) and recoil atoms (see Fig. 7b) lead to the creation of a defective zone with an extension on the order of typically a few ten nanometers. To estimate the extent of ion-induced damage for the samples studied here we ran model calculations with the software package “Stopping and Range of Ions in Matter” (SRIM-2008) [78] which computes the interactions of energetic ions with amorphous targets using a Monte Carlo approach. As input parameters, we used the above mentioned ion beam parameters, a density of 6.47 gcm-3 and the stoichiometry of the sample, in combination with generic values for the otherwise unknown lattice binding (3 eV) and displacement (25 eV) energies for all target elements, and the respective elementary surface binding energies (Ba: 1.84 eV, Fe: 4.34 eV, Co: 4.43 eV, As: 1.26 eV) provided by SRIM-2008. We used the full cascade mode, in which the collisional damage to the target is analyzed by following every recoil atom until its energy drops below the lowest displacement energy of any of the target atoms. From these calculations, one may infer the extension of the defective zone into the film. Figure 7 shows that the bombardment of the film has led to a defective zone of 30 nm thickness. According to the simulations, the sputter yield for this system is 12 atoms per ion, i.e. in total one tenth of a monolayer is removed by the ion bombardment.
References
- [1] E. Braun and S. MacDonald, Revolution in Miniature: The History and Impact of Semiconductor Electronics (Cambridge University Press, UK, 1978).
- [2] M. M. Begovic, I. Kim, D. Novosel, J. Romero Aguero, A. Rohatgi, Integration of photovoltaic distributed generation in the power distribution grid, 45th Hawaii International Conference on System Sciences 2012, doi: 10.1109/HICSS.2012.335.
- [3] S. Ruiz-Romero, A. Colmenar-Santos, F. Mur-Pérez, A. López-Rey, Integration of distributed generation in the power distribution network: The need for smart grid control systems, communication and equipment for a smart city – Use cases, Renew. Sustain. Energy. Rev. 38, 223 (2014), doi: 10.1016/j.rser.2014.05.082.
- [4] C. B. Vining, An inconvenient truth about thermoelectrics, Nat. Mater. 8, 83 (2009), doi: 10.1038/nmat2361.
- [5] C. Goupil, H. Ouerdane, K. Zabrocki, W. Seifert, N. F. Hinsche, and E. Müller, Thermodynamics and Thermoelectricity, in Continuum Theory and Modeling of Thermoelectric Elements, edited by C. Goupil (Wiley VCH, Weinheim, 2016), p. 1, doi: 10.1002/9783527338405.ch1.
- [6] A. De Vos, Thermodynamics of Photovoltaics, in Thermodynamics of Energy Conversion and Transport, edited by S. Sieniutycz and A. De Vos (Springer, New York, 2000), p. 49, doi: 10.1007/978-1-4612-1286-7_3.
- [7] Y. Apertet, H. Ouerdane, C. Goupil, P. Lecoeur, Internal convection in thermoelectric generator models, J. Phys.: Conf. Ser. 395, 012103 (2012), doi: 10.1088/1742-6596/395/1/012103.
- [8] Thermoelectric Nanomaterials, Springer Series in Materials Science, Vol. 182, edited by K. Koumoto and T. Mori (Springer, Berlin, 2013); doi: 10.1007/978-3-642-37537-8.
- [9] R. Ang et al, Atomistic origin of an ordered superstructure induced superconductivity in layered chalcogenides, Nat. Commun. 6, 6091 (2015), doi: 10.1038/ncomms7091.
- [10] D. Emin, Enhanced Seebeck coefficient from carrier-induced vibrational softening, Phys. Rev. B 59, 6205 (1999), doi: 10.1103/PhysRevB.59.6205.
- [11] H. Liu, et al., Structure-transformation-induced abnormal thermoelectric properties in semiconductor copper selenide, Mater. Lett. 93, 121 (2013), doi: 10.1016/j.matlet.2012.11.058.
- [12] D. R. Brown, T. Day, K. A. Borup, S. Christensen, B. B. Iversen, and G. J. Snyder, Phase transition enhanced thermoelectric figure-of-merit in copper chalcogenides, APL Mat. 1, 052107 (2013), doi: 10.1063/1.4827595.
- [13] M. H. Lee et al, Synergetic enhancement of thermoelectric performance by selective charge Anderson localization–delocalization transition in n-type Bi-doped PbTe/Ag2Te nanocomposite, ACS Nano 13, 3806 (2019), doi: 10.1021/acsnano.8b08579.
- [14] C. Vining, The thermoelectric process, Mater. Res. Soc. Symp. Proc. 478, 3 (1997), doi: 10.1557/PROC-478-3.
- [15] H. Ouerdane, A. A. Varlamov, A. V. Kavokin, C. Goupil, and C. B. Vining, Enhanced thermoelectric coupling near electronic phase transition: the role of fluctuation Cooper pairs, Phys. Rev. B 91, 100501(R) (2015), doi: 10.1103/PhysRevB.91.100501.
- [16] A. F. Ioffe, Semiconductor thermoelements and thermoelectric cooling (Infosearch, ltd., London, UK, 1957).
- [17] C. Goupil, W. Seifert, K. Zabrocki, E. Müller, and G. J. Snyder, Thermodynamics of thermoelectric phenomena and applications, Entropy 13, 1481 (2011), doi: 10.3390/e13081481.
- [18] R. Venkatasubramanian, E. Siivola, T. Colpitts, and B. O’Quinn, Thin-film thermoelectric devices with high room-temperature figures of merit, Nature 413, 597 (2000), doi: 10.1038/35098012.
- [19] Y. Apertet, H. Ouerdane, C. Goupil, and Ph. Lecoeur, Influence of thermal environment on optimal working conditions of thermoelectric generators, J. Appl. Phys. 116, 144901 (2014), doi: 10.1063/1.4897350.
- [20] F. J. DiSalvo, Thermoelectric cooling and power generation, Science 285, 703 (1999), doi: 10.1126/science.285.5428.703.
- [21] Taking as the maximal thermoelectric efficiency, and assuming and a large temperature gap to maximize the efficiency, we get .
- [22] A. Mehdizadeh Dehkordi, M. Zebarjadi, J. He, T.M. Tritt, Thermoelectric power factor: enhancement mechanisms and strategies for higher performance thermoelectric materials, Mater. Sci. Eng. R Reports 97, 1 (2015), doi: 10.1016/j.mser.2015.08.001.
- [23] C. Wood, Materials for thermoelectric energy conversion, Rep. Prog. Phys. 51, 459 (1988), doi: 10.1088/0034-4885/51/4/001.
- [24] L. D. Hicks and M. S. Dresselhaus, Effect of quantum well structures on the thermoelectric figure of merit, Phys. Rev. B 47, 12727 (1993), doi: 10.1103/PhysRevB.47.12727.
- [25] Y. Zhang et al., Double thermoelectric power factor of a 2D electron system, Nat. Commun. 9, 2224 (2018), doi: 10.1038/s41467-018-04660-4.
- [26] I. Terasaki, Y. Sasago, K. Uchinokura, Large thermoelectric power in single crystals, Phys. Rev. B 56, R12685 (1997), doi: 10.1103/PhysRevB.56.R12685.
- [27] Y. Wang, N.S. Rogado, R.J. Cava, N.P. Ong, Spin entropy as the likely source of enhanced thermopower in , Nature 423, 425 (2003), doi: 10.1038/nature01639.
- [28] A. Bentien, S. Johnsen, G. K. H. Madsen, B. B. Iversen, and F. Steglich, Colossal Seebeck coefficient in strongly correlated semiconductor , EPL 80, 17008 (2003), doi: 10.1209/0295-5075/80/17008.
- [29] S. Hong, P. Ghaemi, J. E. Moore, and P. W. Phillips, Phys. Rev. B 88, 075118 (2013), doi: 10.1103/PhysRevB.88.075118.
- [30] L. Pinsard-Gaudart, D. Bérardan, J. Bobroff, N. Dragoe, Large Seebeck coefficients in iron-oxypnictides: a new route towards n-type thermoelectric materials, physica status solidi (RRL) 2, 185 (2008), doi: 10.1002/pssr.200802125.
- [31] L. Zhao and G. D. Liu, Thermopower study of electron-doped La2-xCexCuO4 films, Supercond. Sci. Technol. 23, 042001 (2010), doi: 10.1088/0953-2048/23/4/042001.
- [32] M. Tropeano et al, Transport and superconducting properties of Fe-based superconductors: a comparison between SmFeAsO1-xFx and Fe1+yTe1-xSex, Supercond. Sci. Technol. 23, 054001 (2010), doi: 10.1088/0953-2048/23/5/054001.
- [33] I. Pallecchi, F. Caglieris and M. Putti, Thermoelectric properties of iron-based superconductors and parent compounds, Supercond. Sci. Technol. 29, 073002 (2016), doi: 10.1088/0953-2048/29/7/073002
- [34] A. E. Böhmer and A. Kreisel, Nematicity, magnetism and superconductivity in FeSe, J. Phys.: Condens. Matter 30, 023001 (2018), doi: 10.1088/1361-648X/aa9caa.
- [35] R. M. Fernandes, A. V. Chubukov, and J. Schmalian, What drives nematic order in iron-based superconductors?, Nature Phys. 10, 97 (2014), doi: 10.1038/nphys2877.
- [36] S. Jiang, H. S. Jeevan, J. Dong, and P. Gegenwart, Thermopower as sensitive probe of electronic nematicity in iron pnictides, Phys. Rev. Lett. 110, 067001 (2013), doi: 10.1103/PhysRevLett.110.067001.
- [37] J. H. Chu, H. H. Kuo, J. G. Analytis and I. R. Fisher, Divergent nematic susceptibility in an iron arsenide superconductor, Science 337, 710 (2012), doi: 10.1126/science.1221713
- [38] A. Böhmer and C. Meingast, Electronic nematic susceptibility of iron-based superconductors, C. R. Physique 17, 90 (2016), doi: 10.1016/j.crhy.2015.07.001
- [39] G. Benenti, H. Ouerdane, and C. Goupil, The thermoelectric working fluid: Thermodynamics and transport, C. R. Physique 17, 1072 (2016), doi: 10.1016/j.crhy.2016.08.004.
- [40] H. B. Callen, The application of Onsager’s reciprocal relations to thermoelectric, thermomagnetic, and galvanomagnetic effects, Phys. Rev. 73, 1349 (1948), doi: 10.1103/PhysRev.73.1349.
- [41] J.-Ph. Brantut et al, A thermoelectric heat engine with ultracold atoms, Science 342, 713 (2013); and Supplementary Materials, doi: 10.1126/Science.1242308.
- [42] A. Larkin and A. Varlamov, Theory of fluctuations in superconductors (Clarendon Press, Oxford, 2005), doi: 10.1093/acprof:oso/9780198528159.001.0001.
- [43] M. Kano, Y. Kohama, D. Graf, F. Balakirev, A. S. Sefat, M. A. Mcguire, B. C. Sales, D. Mandrus, and S. W. Tozer, Anisotropy of the upper critical field in a Co-doped BaFe2As2 single crystal, J. Phys. Soc. Jpn. 78, 084719 (2009), doi: 10.1143/JPSJ.78.084719
- [44] B. D. Faeth, S.-L. Yang, J. K. Kawasaki, J. N. Nelson, P. Mishra, C. T. Parzyck, C. Li, D. G. Schlom, and K. M. Shen, Incoherent Cooper pairing and pseudogap behavior in single-layer FeSe/SrTiO3, Phys. Rev. X 11, 021054 (2021), doi: 10.1103/PhysRevX.11.021054.
- [45] Yu He, Su-Di Chen, Zi-Xiang Li, Dan Zhao, Dongjoon Song, Yoshiyuki Yoshida, Hiroshi Eisaki, Tao Wu, Xian-Hui Chen, Dong-Hui Lu, Christoph Meingast, Thomas P. Devereaux, Robert J. Birgeneau, Makoto Hashimoto, Dung-Hai Lee, and Zhi-Xun Shen, Superconducting fluctuations in overdoped Bi2Sr2CaCu2O8+δ, Phys. Rev. X 11, 031068 (2021), doi: 10.1103/PhysRevX.11.031068.
- [46] A. A. Varlamov and A. V. Kavokin, Prediction of thermomagnetic and thermoelectric properties for novel materials and systems, EPL 103, 47005 (2013), doi: 10.1209/0295-5075/103/470.
- [47] L. Aslamasov and A. Larkin, The influence of fluctuation pairing of electrons on the conductivity of normal metal, Phys. Lett. A 26, 238 (1968), doi: 10.1016/0375-9601(68)90623-3.
- [48] D. R. Niven and R. A. Smith, Absence of singular superconducting fluctuation corrections to thermal conductivity, Phys. Rev. B 66, 214505 (2002), doi: 10.1103/PhysRevB.66.214505.
- [49] A. V. Kavokin and A. A. Varlamov, Magnetization currents of fluctuating Cooper pairs, Phys. Rev. B 92, 020514(R) (2015), doi: 10.1103/PhysRevB.92.020514.
- [50] Y. Apertet, H. Ouerdane, C. Goupil, and Ph. Lecoeur, A note on the electrochemical nature of thermoelectric power, Eur. Phys. J. Plus 131, 76 (2016), doi: 10.1140/epjp/i2016-16076-8.
- [51] F. Kurth, E. Reich, J. Hänisch, A. Ichinose, I. Tsukuda, R. Hühne, S. Trommler, J. Engelmann, L. Schultz, B. Holzapfel, K. Iida, Versatile fluoride substrates for Fe-based superconducting thin films, Appl. Phys. Lett. 102, 142601 (2013), doi: 10.1063/1.4801312.
- [52] F. Weber, D. Parshall, L. Pintschovius, J.-P. Castellan, M. Kauth, M. Merz, Th. Wolf, M. Schütt, J. Schmalian, R. M. Fernandes, and D. Reznik, Soft phonons reveal the nematic correlation length in Ba(Fe0.94Co0.06)2As2, Phys. Rev. B 98, 014516 (2018), doi: 10.1103/PhysRevB.98.014516
- [53] A. S. Sefat, M. A. McGuire, B. C. Sales, R. Jin, J. Y. Howe, and D. Mandrus, Electronic correlations in the superconductor LaFeAsO0.89F0.11 with low carrier density, Phys. Rev. B 77, 174503 (2008), doi: 10.1103/PhysRevB.77.174503.
- [54] J. Prakash, S. J. Singh, S. Patnaik, A. K. Ganguli, Upper critical field, superconducting energy gaps and the Seebeck coefficient in La0.8ThFeAsO, J. Phys.: Condens. Matter 21, 175705 (2009), doi: 10.1088/0953-8984/21/17/175705.
- [55] M. V. Elizarova, and V. É. Gasumyants, Superconductivity, Seebeck coefficient, and band structure transformation in Y1-xCaxBa2Cu3-xCoxOy (=0-0.3), Phys. Solid State 41, 1248 (1999), doi: 10.1134/1.1130976.
- [56] H. H. Potter, Electrical resistance and thermoelectric power of the transition metals, Proc. Phys. Soc. 53, 695 (1941), doi: 10.1088/0959-5309/53/6/308.
- [57] R. B. Roberts, The absolute scale of thermoelectricity, Phil. Mag. 36, 91 (1977), doi: 10.1080/00318087708244450.
- [58] H. P. R. Frederikse, Thermoelectric power of germanium below room temperature, Phys. Rev. 92, 248 (1953), doi: 10.1103/PhysRev.92.248.
- [59] Yu. G. Gurevich and O. L. Mashkevich, The electron-phonon drag and transport phenomena in semiconductors, Phys. Rep. 181, 327 (1989), doi: 10.1016/0370-1573(89)90011-2.
- [60] G. Wang, L. Endicott, H. Chi, P. Lošt’ák, and C. Uher, Tuning the temperature domain of phonon drag in thin films by the choice of substrate, Phys. Rev. Lett. 111, 046803 (2013), doi: 10.1103/PhysRevLett.111.046803.
- [61] O. Kedem and S. R. Caplan, Degree of coupling and its relation to efficiency of energy conversion, Trans. Faraday Soc. 61, 1897 (1965), doi: 10.1039/TF9656101897.
- [62] C. Goupil and E. Herbert, Adapted or adaptable: How to manage entropy production?, Entropy 22, 29 (2020), doi: 10.3390/e22010029.
- [63] R. Kubo, Statistical Mechanics (North Holland-Interscience-Wiley, New York, 1965), pp. 398–399.
- [64] K. Huang, Statistical Mechanics, 2nd ed. (Wiley, New York, 1986), pp. 152–153.
- [65] A. Rançon, C. Chin, and K. Levin, Bosonic thermoelectric transport and breakdown of universality, New Journal of Physics 16, 113072 (2014), doi: 10.1088/1367-2630/16/11/113072.
- [66] H. Kontani, General formula for the thermoelectric transport phenomena based on Fermi liquid theory: Thermoelectric power, Nernst coefficient, and thermal conductivity, Physical Review B 67, 014408 (2003), doi: 10.1103/PhysRevB.67.014408.
- [67] P. A. Markowich and C. Schmeiser, Relaxation time approximation for electron-phonon interaction in semiconductors, Mathematical Models and Methods in Applied Sciences 5, 519 (1995), doi: 10.1142/S0218202595000309.
- [68] M. Di Ventra, Electrical transport in nanoscale systems (Cambridge, UK: Cambridge University Press, 2008).
- [69] H. Goldstein, C. Poole, and J. Safko, Classical mechanics (Addison-Wesley, 2002).
- [70] G. Mahan and J. O. Sofo, The best thermoelectric, PNAS 93, 7436 (1996), doi: 10.1073/pnas.93.15.7436.
- [71] D.C Look and J. R. Sizelove, Predicted maximum mobility in bulk GaN, Appl. Phys. Lett. 79, 13 592 (1992), doi: 10.1063/1.1394954.
- [72] H. Morkoç, R. Cingolani, and B. Gil, Polarization effects in nitride semiconductor device structures and performance of modulation doped field effect transistors, Solid-State Electron. 43, 1909 (1999), doi: 10.1016/S0038-1101(99)00146-X.
- [73] I. Bejenari and V. Kantser, Thermoelectric properties of bismuth telluride nanowires in the constant relaxation-time approximation, Phys. Rev. B 78, 115322 (2008), doi: 10.1103/PhysRevB.78.115322.
- [74] R. Landauer, Spatial variation of currents and fields du to localized scatterers in metallic conduction, IBM Journal of Research and Development 32, 306 (1988), doi: 10.1147/rd.323.0306.
- [75] G. Benenti, G. Casati, K. Saito, and R. S. Whitney, Fundamental aspects of steady-state conversion of heat to work at the nanoscale, Physics Reports 694, 1 (2017), doi: 10.1016/j.physrep.2017.05.008.
- [76] K. Iida et al., Hall-plot of the phase diagram for Ba(Fe1-xCox)2As2, Sci. Rep. 6, 28390 (2016), doi: 10.1038/srep28390.
- [77] J. Hänisch, K. Iida, R. Hühne and C. Tarantini, Fe-based superconducting thin films – preparation and tuning of superconducting properties, Supercond. Sci. Technol. 32 093001 (2019), doi: 10.1088/1361-6668/ab1c00.
- [78] J. F. Ziegler, M. D. Ziegler, and J. P. Biersack, SRIM – The stopping and range of ions in matter Nucl. Instr. Meth. Phys. B, 268, 1818 (2010), doi: 10.1016/j.nimb.2010.02.091.