K. É. GABÁNYI et al
*Krisztina É. Gabányi
Department of Astronomy, Eötvös Loránd University, Pázmány Péter sétány 1/A, H-1117 Budapest, Hungary
A small radio galaxy at
Abstract
Less than radio-loud active galactic nuclei (AGN) are known above redshift . Around of them have been observed at milliarcsecond (mas) scale resolution with very long baseline interferometry (VLBI) technique. Some of them are unresolved, compact, relativistically beamed objects, blazars with jets pointing at small angles to the observer’s line of sight. But there are also objects with no sign of relativistic beaming possibly having larger jet inclination angles. In a couple of cases, X-ray observations indicate the presence of relativistic beaming in contrary to the VLBI measurements made with the European VLBI Network (EVN). J14201205 is a prominent example, where our mas-scale enhanced Multi Element Remotely Linked Interferometer Network (e-MERLIN) radio observations revealed a rich structure reminiscent of a small radio galaxy. It shows a bright hotspot which might be related to the denser interstellar medium around a young galaxy at an early cosmological epoch.
keywords:
galaxies: high-redshift, galaxies: active, radio continuum: galaxies, galaxies: individual: J1420+1205, , , (\cyear2021), \ctitleA small radio galaxy at , \cjournalAstron. Nachr., \cvol.
1 Introduction
High-redshift () AGN play an important role in the study of the early Universe and the evolution of AGN. The mere existence of powerful quasars at or above redshift already places constraints on the growth of supermassive black holes, accretion processes and the possible seed black holes (e.g., Sbarrato, \APACyear2021, and references therein). Roughly % of AGN are radio-loud (Ivezić \BOthers., \APACyear2002), these can be studied at pc-scale resolution even at high redshifts thanks to the VLBI radio observation technique.
The radio-loud AGN whose jet points at a small angle to the line sight (the viewing angle is typically ) are called blazars. In other words, blazars are radio-emitting AGN where relativistic effects significantly alter the observable features of the jets. For this to happen, the jet viewing angle has to be inside the beaming angle, thus , where is the bulk Lorentz factor of the jet. The blazar nature of a radio-emitting AGN can be verified through fitting the spectral energy distributions (SEDs), or via VLBI imaging observations. In the latter case, the detection of a compact radio emitting feature with brightness temperature exceeding the equipartition limit ( K, Readhead, \APACyear1994) indicates relativistic effects. Additionally, rapid variability, and high optical polarization could also be signs of the blazar nature.
Several objects have been identified, which were classified as blazar candidates via their SED-fitting (for details see e.g., Sbarrato \BOthers., \APACyear2015). However, VLBI observations failed to reveal a compact high-brightness temperature feature in two of them (J14201205, J22200025). They rather showed widely-separated double structures (Cao \BOthers., \APACyear2017). Similar features were detected by Coppejans \BOthers. (\APACyear2016) in another source, J15483335, which was recently measured by Chandra to have the highest X-ray luminosity in a sample of radio-AGN at redshifts (Snios \BOthers., \APACyear2020). We conducted radio interferometric observations of these three sources with e-MERLIN to map their intermediate-scale radio-emitting structures. Preliminary results of the observations were published in Gabányi \BOthers. (\APACyear2018).
Here, we focus on J14201205 located at a redshift of (Pâris \BOthers., \APACyear2018)111We note that a slightly different value, , was reported previously in Schneider \BOthers. (\APACyear2010) and used by us in Gabányi \BOthers. (\APACyear2018).. In the following, we use a CDM cosmological model with , and . We define the radio spectral index as , where is the flux density and is the observing frequency.
2 Observations, data analysis and results
J14201205 was observed with e-MERLIN on 2017.07.15 and 2017.06.30 at GHz, and on 2017.05.13 and 2017.06.27 at GHz. For further details of the observations and data analysis, we refer to Gabányi \BOthers. (\APACyear2018).
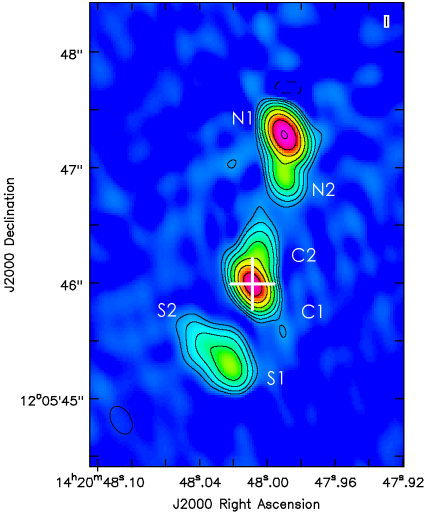
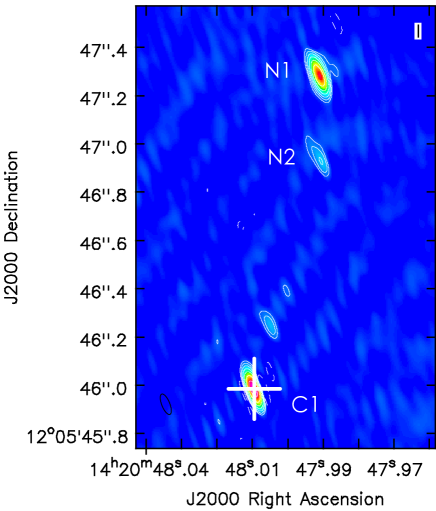
At GHz, we detected three main radio-emitting regions, designated as N, C, and S in Figure 1 left. The total extent of the radio source is , corresponding to a projected linear size of kpc in the redshift of the source. The brightest pixel is located in region N, while according to the Gaia EDR3 (Gaia Collaboration \BOthers., \APACyear2021, \APACyear2016) optical coordinates (shown by white crosses at Figure 1), the optical emission originates from region C. At GHz, only the two regions N and C could be detected (see Figure 1 right).
We used the difmap software (Shepherd, \APACyear1997) to describe the brightness distribution by fitting the calibrated visibility data with circular Gaussian model components in each spectral window independently. The spectral windows of the -GHz data can be consistently fitted with model components, using two components in each region. At GHz, three Gaussian components were needed to describe the data of the two lower of the spectral windows (central frequencies GHz and GHz), two for region N and one for region C. These components are positionally coincident with N1, N2, and C1 identified at GHz. To adequately fit the data of the two upper spectral windows (central frequencies GHz and GHz), components, N1 and C1 were sufficient. The component designations are depicted in Figure 1. The errors of the component parameters were calculated according to Fomalont (\APACyear1999).
We calculated the in-band spectral indices for the components which were detected at least in three spectral windows within one band. Additionally, we calculated the spectral indices for the positionally coincident components through the combined frequency range (Table 1).
| ID | |||
|---|---|---|---|
| C1 | |||
| C2 | – | – | |
| N1 | |||
| N2 | –\tnote | -\tnote | |
| S1 | – | – | |
| S2 | – | – |
N2 could only be fitted in two spectral windows of the -GHz band, thus the spectral index is not well constrained.
N2 could not be fitted at the two upper spectral windows, this spectral index is calculated between GHz and GHz.
3 Discussion and Summary
J14201205 has been detected in the Faint Images of the Radio Sky at Twenty-Centimeters survey (FIRST, Helfand \BOthers., \APACyear2015) with a flux density of mJy as an unresolved object. In our e-MERLIN observation, the sum of the flux densities of the fitted model components in the spectral window closest to the FIRST frequency (at GHz), is mJy, agreeing within the errors with the FIRST value. At mas resolution, -GHz EVN observations in 2015 Oct detected two features corresponding to C1 and N1 with a total flux density of mJy (Cao \BOthers., \APACyear2017). The total flux density detected by the e-MERLIN at the closest frequency, GHz is mJy. The difference is mainly due to the additional features (C2, N2, S1, and S2) revealed by the lower resolution observation, while the flux densities of C1 and N1 agree roughly within the errors.
At GHz, only component C1 with a brightness temperature of K is detected with the EVN, hinting the steeper spectral index and/or possibly more extended nature of component N1. Our e-MERLIN spectral indices confirm the former, across the two bands N1 has a steep spectrum, with , while C1 has a flatter spectrum with (Table 1). The flux density of C1 in the 5-GHz EVN observation is significantly lower, mJy compared to the one measured by e-MERLIN, mJy. In principle, this can be due to resolution effect and/or source variability. The lack of variability seen at GHz makes the latter rather unlikely. It is more probable that, similarly to N1, the VLBI observation resolved out significant flux density which, however, could be recovered by e-MERLIN.
The Gaia optical point source coincides with C1 (and its coordinates agree with the more precise EVN localization of the compact feature), thus it is most probably the position of the AGN core, and the radio emission is related to the jet base. Regions N and S probably correspond to the lobe emissions. The reason for the much brighter northern arm may arise due to asymmetric structure in the interstellar medium of the host galaxy or due to light-travel time effect (Taylor \BBA Vermeulen, \APACyear1997; Longair \BBA Riley, \APACyear1979). In the latter case, the advancing, thus brighter lobe is seen farther away from the central region in the sky, thus the arm-length ratio of the brighter to fainter lobe exceeds unity. According to this picture, region N is on the advancing side of J14201205.
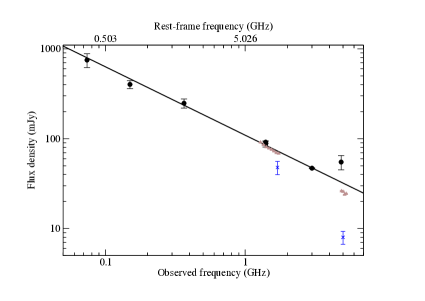
We calculated the -GHz radio power of J14201205 from the flux density measured at GHz with e-MERLIN, assuming a spectral index of based on the radio flux density data collected from the literature, covering a wide frequency range (Figure 2). The obtained value, together with the linear extent, kpc measured in the e-MERLIN image indicate that the source is a high-power compact steep-spectrum source and can be regarded as a young (and smaller) version of a Fanaroff–Riley type 2 radio galaxy according to An \BBA Baan (\APACyear2012).
Based upon X-ray and UV measurements obtained with the Swift satellite, Sbarrato \BOthers. (\APACyear2015) concluded that the SED of J14201205 can be best described as of a beamed blazar source. Wu \BOthers. (\APACyear2013) analysed the multi-wavelength properties of radio-loud AGN, including J14201205, for which Chandra snapshot observations were obtained. They found an X-ray emission enhancement compared to similar radio-loud quasars at lower redshifts. They showed that this cannot be explained by the inverse Compton upscattering of the Cosmic Microwave Background photons (as that would produce even more X-ray enhancement).
Our radio interferometric observations showed that J14201205 is not a blazar but more likely a young radio galaxy. This is in tension with previous X-ray measurements of the source where the X-ray emission was explained as being related to the relativistically beamed jet. The X-ray emission may originate either from a region where the jet viewing angle is much lower than that was deduced from our radio observations, or (partly) created through the interaction between the jet and the surrounding medium in the lobes. However, in the latter case no bright radio emission is expected (Ghisellini \BOthers., \APACyear2014). In the future, higher resolution X-ray observation better constraining the location of the emission may discriminate between these scenarios.
Acknowledgments
The e-MERLIN is a National Facility operated by the University of Manchester at Jodrell Bank Observatory on behalf of STFC. Scientific results presented in this publication are derived from the e-MERLIN project code: CY5211. This work has received funding from the European Union’s Horizon 2020 research and innovation programme under grant agreement No 730562 (RadioNet), and the NKFIH (OTKA K134213 and 2018-2.1.14-TÉT-CN-2018-00001). We thank for the usage of the ELKH Cloud (previously known as MTA Cloud).
References
- An \BBA Baan (\APACyear2012) \APACinsertmetastarAnBaan{APACrefauthors}An, T.\BCBT \BBA Baan, W\BPBIA. \APACrefYearMonthDay2012, \APACjournalVolNumPagesApJ76077. \PrintBackRefs\CurrentBib
- Becker \BOthers. (\APACyear1991) \APACinsertmetastarnewcat{APACrefauthors}Becker, R\BPBIH., White, R\BPBIL.\BCBL \BBA Edwards, A\BPBIL. \APACrefYearMonthDay1991, \APACjournalVolNumPagesApJS751. \PrintBackRefs\CurrentBib
- Cao \BOthers. (\APACyear2017) \APACinsertmetastarCao2017{APACrefauthors}Cao, H\BHBIM., Frey, S., Gabányi, K\BPBIÉ. et al. \APACrefYearMonthDay2017, \APACjournalVolNumPagesMNRAS467950-960. \PrintBackRefs\CurrentBib
- Cohen \BOthers. (\APACyear2007) \APACinsertmetastarvlss{APACrefauthors}Cohen, A\BPBIS., Lane, W\BPBIM., Cotton, W\BPBID. et al. \APACrefYearMonthDay2007, \APACjournalVolNumPagesAJ13431245-1262. \PrintBackRefs\CurrentBib
- Condon \BOthers. (\APACyear1998) \APACinsertmetastarnvss{APACrefauthors}Condon, J\BPBIJ., Cotton, W\BPBID., Greisen, E\BPBIW., Yin, Q\BPBIF., Perley, R\BPBIA., Taylor, G\BPBIB.\BCBL \BBA Broderick, J\BPBIJ. \APACrefYearMonthDay1998, \APACjournalVolNumPagesAJ11551693-1716. \PrintBackRefs\CurrentBib
- Coppejans \BOthers. (\APACyear2016) \APACinsertmetastarCoppejans2016{APACrefauthors}Coppejans, R., Frey, S., Cseh, D. et al. \APACrefYearMonthDay2016, \APACjournalVolNumPagesMNRAS4633260-3275. \PrintBackRefs\CurrentBib
- Douglas \BOthers. (\APACyear1996) \APACinsertmetastartexas{APACrefauthors}Douglas, J\BPBIN., Bash, F\BPBIN., Bozyan, F\BPBIA., Torrence, G\BPBIW.\BCBL \BBA Wolfe, C. \APACrefYearMonthDay1996, \APACjournalVolNumPagesAJ1111945. \PrintBackRefs\CurrentBib
- Fomalont (\APACyear1999) \APACinsertmetastarerror{APACrefauthors}Fomalont, E\BPBIB. \APACrefYearMonthDay1999, \BBOQ\APACrefatitleImage Analysis Image Analysis.\BBCQ \BIn G\BPBIB. Taylor, C\BPBIL. Carilli\BCBL \BBA R\BPBIA. Perley (\BEDS), \APACrefbtitleSynthesis Imaging in Radio Astronomy II Synthesis Imaging in Radio Astronomy II \BVOL 180, \BPG 301. \PrintBackRefs\CurrentBib
- Gabányi \BOthers. (\APACyear2018) \APACinsertmetastarEVN2018{APACrefauthors}Gabányi, K., Frey, S., Paragi, Z. et al. \APACrefYearMonthDay2018, \BBOQ\APACrefatitleThree little radio galaxies in the early Universe Three little radio galaxies in the early Universe.\BBCQ \BIn \APACrefbtitle14th European VLBI Network Symposium & Users Meeting (EVN 2018) 14th European VLBI Network Symposium & Users Meeting (EVN 2018) \BPG 31. \PrintBackRefs\CurrentBib
- Gaia Collaboration \BOthers. (\APACyear2021) \APACinsertmetastarGaia_EDR3{APACrefauthors}Gaia Collaboration, Brown, A\BPBIG\BPBIA., Vallenari, A. et al. \APACrefYearMonthDay2021, \APACjournalVolNumPagesA&A649A1. \PrintBackRefs\CurrentBib
- Gaia Collaboration \BOthers. (\APACyear2016) \APACinsertmetastargaia_mission{APACrefauthors}Gaia Collaboration, Prusti, T., de Bruijne, J\BPBIH\BPBIJ. et al. \APACrefYearMonthDay2016, \APACjournalVolNumPagesA&A595A1. \PrintBackRefs\CurrentBib
- Ghisellini \BOthers. (\APACyear2014) \APACinsertmetastarGhisellini_2014{APACrefauthors}Ghisellini, G., Celotti, A., Tavecchio, F., Haardt, F.\BCBL \BBA Sbarrato, T. \APACrefYearMonthDay2014, \APACjournalVolNumPagesMNRAS43832694-2700. \PrintBackRefs\CurrentBib
- Gregory \BBA Condon (\APACyear1991) \APACinsertmetastargb6{APACrefauthors}Gregory, P\BPBIC.\BCBT \BBA Condon, J\BPBIJ. \APACrefYearMonthDay1991, \APACjournalVolNumPagesApJS751011. \PrintBackRefs\CurrentBib
- Helfand \BOthers. (\APACyear2015) \APACinsertmetastarFIRST_cat{APACrefauthors}Helfand, D\BPBIJ., White, R\BPBIL.\BCBL \BBA Becker, R\BPBIH. \APACrefYearMonthDay2015, \APACjournalVolNumPagesApJ80126. \PrintBackRefs\CurrentBib
- Intema \BOthers. (\APACyear2017) \APACinsertmetastargmrt{APACrefauthors}Intema, H\BPBIT., Jagannathan, P., Mooley, K\BPBIP.\BCBL \BBA Frail, D\BPBIA. \APACrefYearMonthDay2017, \APACjournalVolNumPagesA&A598A78. \PrintBackRefs\CurrentBib
- Ivezić \BOthers. (\APACyear2002) \APACinsertmetastarrl_fraction{APACrefauthors}Ivezić, Ž., Menou, K., Knapp, G\BPBIR. et al. \APACrefYearMonthDay2002, \APACjournalVolNumPagesAJ12452364-2400. \PrintBackRefs\CurrentBib
- Lacy \BOthers. (\APACyear2020) \APACinsertmetastarvlass{APACrefauthors}Lacy, M., Baum, S\BPBIA., Chandler, C\BPBIJ. et al. \APACrefYearMonthDay2020, \APACjournalVolNumPagesPASP1321009035001. \PrintBackRefs\CurrentBib
- Longair \BBA Riley (\APACyear1979) \APACinsertmetastararm-length{APACrefauthors}Longair, M\BPBIS.\BCBT \BBA Riley, J\BPBIM. \APACrefYearMonthDay1979, \APACjournalVolNumPagesMNRAS188625-635. \PrintBackRefs\CurrentBib
- Pâris \BOthers. (\APACyear2018) \APACinsertmetastarsdss_dr14{APACrefauthors}Pâris, I., Petitjean, P., Aubourg, É. et al. \APACrefYearMonthDay2018, \APACjournalVolNumPagesA&A613A51. {APACrefDOI} 10.1051/0004-6361/201732445 \PrintBackRefs\CurrentBib
- Readhead (\APACyear1994) \APACinsertmetastarequipartition{APACrefauthors}Readhead, A\BPBIC\BPBIS. \APACrefYearMonthDay1994, \APACjournalVolNumPagesApJ42651-59. \PrintBackRefs\CurrentBib
- Sbarrato (\APACyear2021) \APACinsertmetastarTS_2021{APACrefauthors}Sbarrato, T. \APACrefYearMonthDay2021, \APACjournalVolNumPagesGalaxies9223. \PrintBackRefs\CurrentBib
- Sbarrato \BOthers. (\APACyear2015) \APACinsertmetastarSwift_J1420{APACrefauthors}Sbarrato, T., Ghisellini, G., Tagliaferri, G., Foschini, L., Nardini, M., Tavecchio, F.\BCBL \BBA Gehrels, N. \APACrefYearMonthDay2015, \APACjournalVolNumPagesMNRAS44632483-2489. {APACrefDOI} 10.1093/mnras/stu2269 \PrintBackRefs\CurrentBib
- Schneider \BOthers. (\APACyear2010) \APACinsertmetastarsdss_dr7{APACrefauthors}Schneider, D\BPBIP., Richards, G\BPBIT., Hall, P\BPBIB. et al. \APACrefYearMonthDay2010, \APACjournalVolNumPagesAJ1392360. \PrintBackRefs\CurrentBib
- Shepherd (\APACyear1997) \APACinsertmetastardifmap{APACrefauthors}Shepherd, M\BPBIC. \APACrefYearMonthDay1997, \BBOQ\APACrefatitleDifmap: an Interactive Program for Synthesis Imaging Difmap: an Interactive Program for Synthesis Imaging.\BBCQ \BIn G. Hunt \BBA H. Payne (\BEDS), \APACrefbtitleAstronomical Data Analysis Software and Systems VI Astronomical Data Analysis Software and Systems VI \BVOL 125, \BPG 77. \PrintBackRefs\CurrentBib
- Snios \BOthers. (\APACyear2020) \APACinsertmetastarSnios2020{APACrefauthors}Snios, B., Siemiginowska, A., Sobolewska, M. et al. \APACrefYearMonthDay2020, \APACjournalVolNumPagesApJ8992127. \PrintBackRefs\CurrentBib
- Taylor \BBA Vermeulen (\APACyear1997) \APACinsertmetastarflux_ratio{APACrefauthors}Taylor, G\BPBIB.\BCBT \BBA Vermeulen, R\BPBIC. \APACrefYearMonthDay1997\APACmonth08, \APACjournalVolNumPagesApJ4851L9-L12. {APACrefDOI} 10.1086/310800 \PrintBackRefs\CurrentBib
- Wu \BOthers. (\APACyear2013) \APACinsertmetastarChandra_obs{APACrefauthors}Wu, J., Brandt, W\BPBIN., Miller, B\BPBIP., Garmire, G\BPBIP., Schneider, D\BPBIP.\BCBL \BBA Vignali, C. \APACrefYearMonthDay2013, \APACjournalVolNumPagesApJ7632109. \PrintBackRefs\CurrentBib
Author Biography
K. É. Gabányi. Adjunct lecturer at the ELTE University (Budapest, Hungary). Her main research interests are radio interferometric studies of dual or recoiling and high-redshift AGN.