planets and satellites: detection — planets and satellites: individual (TOI-2285b) — planets and satellites: interiors — techniques: photometric — techniques: radial velocities
\LETTERLABELTOI-2285b: A 1.7 Earth-radius Planet Near the Habitable Zone around a Nearby M Dwarf
Abstract
We report the discovery of TOI-2285b, a sub-Neptune-sized planet transiting a nearby (42 pc) M dwarf with a period of 27.3 days. We identified the transit signal from the Transiting Exoplanet Survey Satellite photometric data, which we confirmed with ground-based photometric observations using the multiband imagers MuSCAT2 and MuSCAT3. Combining these data with other follow-up observations including high resolution spectroscopy with the Tillinghast Reflector Echelle Spectrograph, high resolution imaging with the SPeckle Polarimeter, and radial velocity (RV) measurements with the InfraRed Doppler instrument, we find that the planet has a radius of , a mass of 19.5 (95% c.l.), and an insolation flux of times that of the Earth. Although the planet resides just outside the habitable zone for a rocky planet, if the planet harbors an H2O layer under a hydrogen-rich atmosphere, then liquid water could exist on the surface of the H2O layer depending on the planetary mass and water mass fraction. The bright host star in the near infrared () makes this planet an excellent target for further RV and atmospheric observations to improve our understanding on the composition, formation, and habitability of sub-Neptune-sized planets.
1 Introduction
The Kepler space mission has revealed that planets with sizes between the Earth and Neptune (hereafter “sub-Neptune-sized planets”) are abundant in close-in orbits around stars other than the Sun (e.g., Borucki et al., 2011). Precise radius measurements for these planets have found that the “hot” ( , where is insolation flux) sub-Neptune-sized planets are classified into two populations; one is of hotter and smaller planets and the other is of cooler and larger planets (e.g., Fulton et al., 2017), which are often referred to as super-Earths and mini-Neptunes, respectively. Atmospheric evolution models predict that the super-Earths have rocky compositions, where any hydrogen-rich atmosphere has been stripped away by the photoevaporation and/or core-powered mass loss mechanisms, while the mini-Neptunes still retain primordial hydrogen atmospheres (e.g., Owen & Wu, 2017; Ginzburg et al., 2018). This scenario has been supported by mass and/or atmospheric measurements for a subset of these systems (e.g., Lopez & Fortney, 2013; Ehrenreich et al., 2015). On the other hand, less has been known about the compositions of “cooler” sub-Neptune-sized planets ( ) due to the smaller number of discoveries, in particular around bright host stars that allow for various follow-up observations including mass measurements and atmospheric observations. Increasing the sample of such planets is important to construct a comprehensive picture of the compositions and formation histories of sub-Neptune-sized planets.
Cooler sub-Neptune-sized planets also have the exciting possibility that they may retain liquid water under a hydrogen atmosphere, even if they reside outside of the habitable zone for rocky planets (Nixon & Madhusudhan, 2021; Madhusudhan et al., 2021). If the planets have an H2O layer beneath the hydrogen atmosphere like Neptune and Uranus, then the hydrogen-H2O boundary could have the right conditions for H2O to be liquid. Although it is not clear if life can exist on such planets, because their atmospheres are easier to observe compared to Earth-like planets thanks to the larger planetary size and larger atmospheric scale height (lower mean-molecular weight), they could potentially be realistic targets for biomarker searches in the next decades (Seager et al., 2013; Madhusudhan et al., 2021).
Here we report the discovery of a new temperate sub-Neptune transiting a nearby M dwarf from the Transiting Exoplanet Survey Satellite (TESS) photometric survey (Ricker et al., 2015) and ground-based follow-up observations.
2 Observations
2.1 TESS photometry
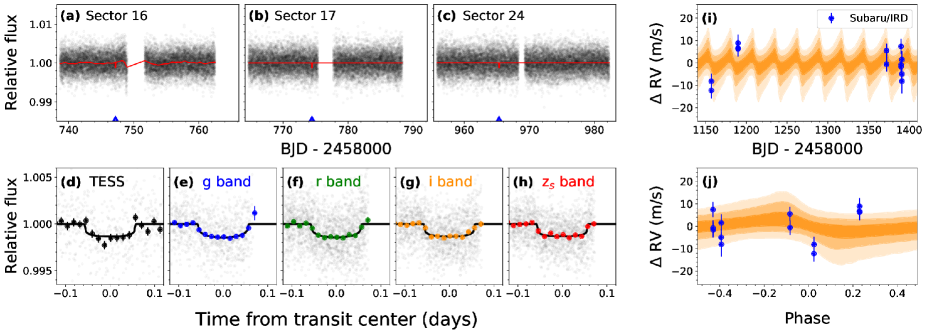
TOI-2285 (TIC 329148988) is an M dwarf located at a distance of 42 pc (Stassun et al., 2017) with astrometric properties and magnitudes listed in table 1. This star was observed by TESS with 2 min cadences in Sectors 16, 17, and 24, each of which lasted for 25–27 days between 2019 September 12 and 2020 May 12 UT. The collected data were processed with a pipeline developed by the TESS Science Processing Operations Center (SPOC) at NASA Ames Research Center (Jenkins et al., 2016), from which a transit signal with an orbital period of 27.270 d was identified using dedicated pipelines (Jenkins et al., 2010; Twicken et al., 2018). This planetary candidate was released as TOI-2285.01 (hereafter TOI-2285b) on 2020 September 30 UT by TESS Science Office at Massachusetts Institute of Technology (Guerrero et al., 2021). We downloaded the Presearch Data Conditioning Simple Aperture Photometry (PDC-SAP) (Stumpe et al., 2014, and references therein) from the Mikulski Archive for Space Telescopes (MAST) at the Space Telescope Science Institute. The normalized PDC-SAP light curves are shown in figure 1.
| Parameter | Value | Reference∗*∗*footnotemark: |
| Astrometric and kinematic parameters | ||
| (epoch J2016.0) | 22:10:15.185 | (1) |
| (epoch J2016.0) | +58:42:21.93 | (1) |
| cos (mas yr-1) | (1) | |
| (mas yr-1) | (1) | |
| Distance (pc) | (2) | |
| RV (km s-1) | This work | |
| (km s-1) | 4.45 0.12 | This work |
| (km s-1) | -23.48 0.50 | This work |
| (km s-1) | -6.78 0.02 | This work |
| Magnitudes | ||
| (2) | ||
| TESS | (2) | |
| (3) | ||
| (3) | ||
| (3) | ||
| Physical parameters | ||
| Mass () | This work | |
| Radius () | This work | |
| Luminosity () | This work | |
| (K) | This work | |
| Fe/H (dex) | This work | |
2.2 Speckle imaging with SAI 2.5m/SPP
TOI-2285 was observed on 2020 December 21 UT with the SPeckle Polarimeter (SPP; Safonov et al., 2017) on the 2.5 m telescope at the Caucasian Observatory of Sternberg Astronomical Institute (SAI) of Lomonosov Moscow State University. SPP uses Electron Multiplying CCD Andor iXon 897 as a detector. The atmospheric dispersion compensator allowed observation of this relatively faint target through the wide-band filter. The power spectrum was estimated from 4000 frames with 30 ms exposure. The detector has a pixel scale of 20.6 mas pixel-1, and the angular resolution was 89 mas. We did not detect any stellar companions brighter than 2.7 and 4.2 at 0\farcs25 and 0\farcs5, respectively.
2.3 High-resolution spectroscopy with TRES
We obtained reconnaissance spectra of TOI-2285 on 2020 October 11 and 25 UT using the Tillinghast Reflector Echelle Spectrograph (TRES; Fűrész et al., 2008) on the 1.5 m Tillinghast telescope at the Fred Lawrence Whipple Observatory (FLWO) in Arizona. TRES has a resolving power of and a wavelength coverage of 385–910 nm. The spectra were extracted as described in Buchhave et al. (2010). No rotational broadening was detected in the spectra. The systemic radial velocity (RV) was derived to be km s-1 following methods described by Winters et al. (2018) using cross correlation against an observed template spectrum of Barnard’s Star, for which a barycentric RV of km s-1 was adopted.
2.4 Transit photometry with MuSCATs
We observed two full transits of TOI-2285b on 2020 October 6 UT and 2021 July 5 UT with the multiband imagers MuSCAT3 (Narita et al., 2020) on the 2 m FTN telescope of Las Cumbres Observatory at the Haleakala observatory, Hawaii and MuSCAT2 (Narita et al., 2019) on the 1.52m Telescopio Carlos Sánchez (TCS) at the Teide observatory, Spain, respectively. Both instruments have four channels for the , , , and bands, and each channel of MuSCAT3 (MuSCAT2) is equipped with a 2k 2k (1k 1k) CCD camera with a pixel scale of 0\farcs266 pixel-1 (0\farcs435 pixel-1). Both observations were slightly defocused to avoid saturation, with exposure times ranging from 10 to 30 s depending on the band and instrument. After calibrating the obtained images for dark and flat fields, we extracted light curves by aperture photometry using a custom pipeline (Fukui et al., 2011) with aperture radii of 4′′–6′′. The resultant photometric dispersion per exposure ranges from 0.22% to 0.32% depending on the band and instrument.
2.5 Radial velocity measurements with Subaru/IRD
We obtained high-resolution spectra of TOI-2285 using the InfraRed Doppler (IRD) instrument on the 8.2m Subaru telescope (Tamura et al., 2012; Kotani et al., 2018) on seven nights between 2020 October 30 to 2021 June 25 UT, under the Subaru-IRD TESS intensive follow-up program (ID: S20B-088I). IRD is a fiber-fed spectrograph covering the near infrared wavelengths from 930 nm to 1740 nm with a spectral resolution of . The integration time per exposure was set to 600–1200 s depending on the observing condition. We also observed at least one telluric standard star (A0 or A1 star) on each night to correct for the telluric lines in extracting the template spectrum for the RV analysis. Raw IRD data were reduced by the procedure described in Hirano et al. (2020), where wavelengths were calibrated by spectra of a laser-frequency comb. The reduced one-dimensional spectra have a typical signal-to-noise ratio (SNR) of 50–90 per pixel at 1000 nm. We discarded the data with very low SNR (20), which could be affected by detector persistence. We extracted RV for each frame following the procedure of Hirano et al. (2020), as shown in panel (i) of figure 1. The typical RV internal errors are 3–4 m s-1.
3 Analysis and Results
3.1 Stellar properties
The physical parameters of the host star were derived as follows. First, from the TRES spectra, we empirically derived the stellar radius and iron abundance to be and [Fe/H] dex, respectively, using SpecMatch-Emp (Yee et al., 2017). Next, we performed an analysis of the broadband spectral energy distribution (SED) of the star, together with the Gaia EDR3 parallax and the [Fe/H] value derived above, following Stassun, Collins, and Gaudi (2017). We estimated the stellar bolometric luminosity and effective temperature to be and K, respectively. These two parameters provide an independent estimate on of via the Stefan-Boltzmann law. We also independently obtained using the empirical absolute--metallicity-radius relation of Mann et al. (2015). We took a weighted mean of the above three estimations of for its final value, while conservatively adopting the maximum uncertainty among the three for the uncertainty of the final value taking into account possible systematic errors, leading to . The value was then self-consistently updated to be K using and the final value. Finally, we determined the stellar mass to be using the empirical absolute--metallicity-mass relation of Mann et al. (2019).
We also investigated the activity and age of the host star. We found an absorption (not emission) line of in the TRES spectrum with an equivalent width of Å, indicating that the star is inactive and not young. We searched for photometric variabilities originated from stellar rotation in the TESS data, ASAS-SN public light curves111https://asas-sn.osu.edu/, and ZTF public light curves222https://irsa.ipac.caltech.edu/Missions/ztf.html, but found no significant periodic variability in any of these data, confirming the inactiveness of the star. The sky coordinates and proper motion of the star do not match with any stellar moving groups. On the other hand, the Galactic space velocities of the star calculated from the Gaia’s astrometric measurements and systemic RV derived by the TRES spectra, as listed in table 1, are consistent with a member of the Galactic thin disk. In summary, the host star is not a very young or old, but is a typical field star with no significant chromospheric activity.
| Parameter | Value |
|---|---|
| Fitted parameters | |
| Orbital period, (d) | |
| Transit epoch, (BJD) | |
| Impact parameter, | |
| Radius ratio, (%) | |
| Eccentricity parameter, | |
| Eccentricity parameter, | |
| RV semi-amplitude, (m s-1) | 7.5††{\dagger}††{\dagger}footnotemark: |
| RV jitter, (m s-1) | |
| Derived parameters | |
| Scaled semi-major axis, | |
| Orbital inclination, (∘) | |
| Eccentricity, | |
| Arg. of periastron, (∘) | |
| Radius, () | |
| Mass, () | 19.5††{\dagger}††{\dagger}footnotemark: |
| Semi-major axis, (au) | |
| Insolation flux, () | |
| Equilibrium temp.∗*∗*footnotemark: , (K) | |
Bond albedo of 0.3 and uniform surface temperature are assumed.
††{\dagger}††{\dagger}footnotemark: The value indicates a 95% confidence upper limit.
3.2 Planet validation and light-curve + RV joint modeling
We found no significant variations in the IRD data, excluding a false positive scenario that the transiting object is a stellar companion to TOI-2285. We also measured the full-to-total duration ratio of the transit signal to be , which sets an upper limit of 4.5% (4) on the true eclipse depth (Seager & Mallén-Ornelas, 2003). This, combined with the SPP speckle observation, excludes any eclipsing binary outside of 0\farcs5 from TOI-2285 as the source of the transit signal. The remaining false positive scenario is that the transit signal is caused by an eclipsing binary within 0\farcs5, the probability of which is calculated to be only by vespa (Morton, 2015).
To derive the physical parameters of the now-validated planet, we fit a transit+RV model simultaneously to the transit light curves and RV data. For the transit model, we used a Mandel–Agol model implemented by PyTransit (Parviainen, 2015). The fitting parameters include impact parameter , planet-to-star radius ratio , orbital period , reference transit time , RV semi-amplitude , RV zero point , RV jitter , stellar mass , stellar radius , and two eccentricity components and , where and are the eccentricity and argument of periastron, respectively. For stellar limb-darkening, we applied a quadratic limb-darkening law with two coefficients and , which we fixed to theoretical values calculated by LDTk (Parviainen & Aigrain, 2015) for a star with parameters listed in table 1.
Simultaneously with the transit model, we also modeled time-correlated noise in the TESS and ground-based data following the procedure described in Fukui et al. (2021). In short, time-correlated noise in the TESS light curve was modeled by a Gaussian process (GP) implemented in celerite (Foreman-Mackey et al., 2017) with a kernel function of stochastically-driven, damped simple harmonic oscillator (SHO), where the model parameters are the frequency of undamped oscillation , the scale factor to the amplitude of the kernel function , and quality factor . We fit and for each sector and fix to unity for all sectors. The time-correlated noise in the ground-based light curves was modeled by a combination of a linear function of the stellar displacements on the detector and a GP model as a function of time with an approximated Matérn 3/2 kernel implemented in celerite. The model parameters include two coefficients of the linear function and , the signal standard deviation of the GP kernel function , and the length scale of the GP kernel function . We let , , and be free for each light curve, while is shared within all bands for each transit.
The posterior probabilities of the parameters were sampled by an Markov Chain Monte Carlo (MCMC) method implemented in emcee (Foreman-Mackey et al., 2013). We applied uniform priors for all parameters but and , for which we applied Gaussian priors with values listed in table 1. Because and cannot be uniquely constrained due to the lack of planetary signal in the RV data, we restrict the values of and such that , which is an empirical upper limit on the eccentricity of super-Earths and Neptunes around M dwarfs (Mayor et al., 2011). The derived median values and 1 uncertainties are reported in table 2, and phase-folded transit light curves and RV data are shown in figure 1. From this analysis, we derived the planetary radius, eccentricity, and 95% confidence upper limit on the mass to be , , and , respectively.
4 Discussion and Summary
We have validated a temperate 1.7 planet transiting the nearby M dwarf TOI-2285 from the TESS photometric survey and ground-based followup observations. Figure 2 shows the location of this planet in the insolation-flux vs. planetary-radius plane333Data in figure 2 are taken from the NASA Exoplanet Archive https://exoplanetarchive.ipac.caltech.edu/.. TOI-2285b is located right in the radius valley found in the Kepler’s sample (1.5–2.0 , Fulton et al., 2017), while its insolation flux, , is much lower than the majority of this sample. TOI-2285b is one of only a handful of low-insolation ( ) sub-Neptune-sized planets transiting bright host stars (), among which LHS1140b (Dittmann et al., 2017) and TOI-1266c (Demory et al., 2020) have similar sizes to TOI-2285b (see figure 2) with measured masses. Despite their similarity in size and irradiation flux, these two planets probably have different compositions; LHS1140b ( , Lillo-Box et al., 2020) and TOI-1266c (2.2 , Demory et al., 2020) are likely rocky and volatile- or gas-rich planets, respectively. TOI-2285b will thus be an important sample for a comparative study on the compositions of this class of planets.
With only the upper limit on the mass ( 19.5 ), however, there are various possibilities for the bulk composition of this planet. If the true planetary mass is more massive than , then the planet is expected to be a rocky planet without any hydrogen-rich atmosphere, according to the model of Zeng et al. (2019). In this case, the planet is probably too hot for water to exist globally as liquid on the surface,444Liquid water might still locally exist on the boundary between day-side and night-side; detailed studies of planetary climate with General Circulation Models (GCMs) are required to explore this possibility. given that the inner edge of the habitable zone for a tidally-locked, rocky planet around a star with K is estimated to be (Haqq-Misra et al., 2018).
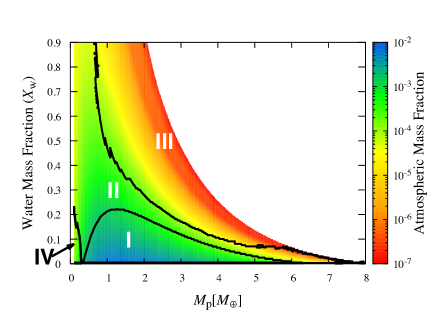
On the other hand, if the planet is less massive than 8 , then it could have an H2O layer on top of a rocky core. If so, and the planet is covered by a hydrogen-rich atmosphere, then the surface of the H2O layer could be in liquid phase depending on the pressure and temperature at the hydrogen-H2O boundary. To investigate this possibility, we numerically integrate a radially-1D hydrostatic-equilibrium structure of the planet that consists of a hydrogen-helium atmosphere on top of a H2O layer on top of a rock central core. We find solutions in which the calculated radius at 10 mbar is equal to 1.74 . We determine the pressure-temperature profile in the same way as Kurosaki and Ikoma (2017) with the radiative equilibrium temperature of 300 K and the intrinsic luminosity of erg s-1 (see Guillot et al., 1995). The H2O layer and the rocky core are assumed to be fully convective (or iso-entropic). We use the tabulated data from Chabrier, Mazevet, and Soubiran (2019) and Haldemann et al. (2020) for the equations of state (EOSs) of H-He and H2O, respectively. Instead of integrating the rocky core structure, we use the data of the mass-radius relationship calculated by Fortney, Marley, and Barne (2007). The input parameters include the planet’s total mass , which is defined as the sum of the H2O layer mass () and the rocky core mass (), and the H2O mass fraction (= ).
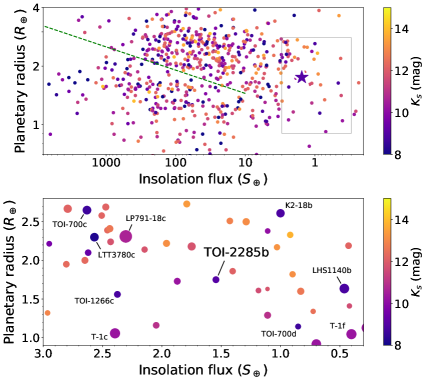
Figure 3 shows the contour map of the atmospheric mass fraction as a function of and . For a given , the atmospheric mass is found to decrease with increasing , because the radius of the H2O layer becomes large, except for a small- range ( 1.0 ) where the gravitational compressibility of the atmosphere is significantly effective. For a given , the atmospheric mass is found to decrease with increasing , because the radius of the H2O layer increases. The amount of atmospheric gas determines the temperature and pressure at the interface between the atmosphere and the H2O layer, and thus the phase of H2O in the interior. As indicated in the figure, the solutions are categorized into four regions in the plane: (I) the entire H2O layer consists of super critical water; (II) a liquid water layer exists on top of a super critical water layer; (III) a liquid water layer exists on top of a high-pressure-ice layer; (IV) the entire H2O layer consists of liquid water, or partially vaporized. For liquid water to exist in the interior (i.e., II–IV), the atmospheric mass fraction must be small enough ( 0.5%). Note that, however, even if the planet still retains such a small amount of hydrogen atmosphere, it could be lost in Gyr via photoevaporation (e.g., Owen & Wu, 2017).
To constrain the bulk composition of the planet further, first, it is critical to constrain the planetary mass from additional RV observations further. The RV semi-amplitude of TOI-2285 is expected to be m s-1, which is within the reach of the current facilities as demonstrated by the achieved RV precision in this work (3–4 m s-1). Besides, because the mass and radius alone are still not enough to solve completely for the bulk composition, atmospheric investigations through transmission spectroscopy will be key to look into the planetary composition and potential habitability further. Using Equation (1) of Kempton et al. (2018), the transit spectroscopic metric (TSM) is estimated to be , which makes such observations feasible with current and upcoming facilities like HST, JWST, and Ariel.
Funding for the TESS mission is provided by NASA’s Science Mission Directorate. We acknowledge the use of public TESS data from pipelines at the TESS Science Office and at the TESS SPOC. Resources supporting this work were provided by the NASA High-End Computing (HEC) Program through the NASA Advanced Supercomputing (NAS) Division at Ames Research Center for the production of the SPOC data products. This paper includes data that are publicly available from the MAST. This research has made use of the Exoplanet Follow-up Observation Program website, which is operated by the California Institute of Technology, under contract with the NASA under the Exoplanet Exploration Program. This work makes use of observations from the LCO global telescope network. This paper is based on observations made with the MuSCAT3 instrument, developed by the Astrobiology Center (ABC) and under financial supports by JSPS KAKENHI (JP18H05439) and JST PRESTO (JPMJPR1775), at FTN on Maui, HI, operated by the LCO, and observations made with the MuSCAT2 instrument, developed by ABC, at TCS operated on the island of Tenerife by the IAC in the Spanish Observatorio del Teide. This paper is partially based on observations made at the CMO SAI MSU with the support by M.V. Lomonosov Moscow State University Program of Development. This work is partly supported by JSPS KAKENHI Grant Numbers 22000005, JP15H02063, JP17H04574, JP18H05439, JP18H05442, JP20K14518, Grant-in-Aid for JSPS Fellows Grant Number JP20J21872, JST PRESTO Grant Number JPMJPR1775, and the ABC of National Institutes of Natural Sciences (Grant Number AB031010). This work is partly financed by the Spanish Ministry of Economics and Competitiveness through grants PGC2018-098153-B-C31 and PID2019-109522GB-C53. A.A.B., B.S.S. and I.A.S. acknowledge the support of Ministry of Science and Higher Education of the Russian Federation under the grant 075-15-2020-780 (N13.1902.21.0039). N.C.B. and G.M. acknowledge the funding from the European Research Council under the European Union’s Horizon 2020 research and innovation program under grant agreement No 694513 and under the Marie Skłodowska-Curie grant agreement No. 895525, respectively. J.K. acknowledges the support of the Swedish National Space Agency (SNSA; DNR 2020-00104). R.L. acknowledges financial support from the Spanish Ministerio de Ciencia e Innovación, through project PID2019-109522GB-C52/AEI/10.13039/501100011033, and the Centre of Excellence “Severo Ochoa” award to the Instituto de Astrofísica de Andalucía (SEV-2017-0709).
References
- Borucki et al. (2011) Borucki, W. J., et al. 2011, ApJ, 736, 19
- Buchhave et al. (2010) Buchhave, L. A., et al. 2010, ApJ, 720, 1118
- Chabrier, Mazevet, and Soubiran (2019) Chabrier, G., Mazevet, S., & Soubiran, F. 2019, ApJ, 872, 51
- Demory et al. (2020) Demory, B. -O., et al. 2020, A&A, 642, A49
- Dittmann et al. (2017) Dittmann, J. A., et al. 2017, Nature, 544, 333
- Ehrenreich et al. (2015) Ehrenreich, D., et al. 2015, Nature, 522, 459
- Fűrész et al. (2008) Fűrész, G., Szentgyorgyi, A. H., & Meibom, S. 2008, in Precision Spectroscopy in Astrophysics, ed. N. C. Santos, L. Pasquini, A. C. M. Correia, & M. Romaniello, 287–290
- Foreman-Mackey et al. (2017) Foreman-Mackey, D., Agol, E., Ambikasaran, S., & Angus, R. 2017, AJ, 154, 220
- Foreman-Mackey et al. (2013) Foreman-Mackey, D., Hogg, D. W., Lang, D., & Goodman, J. 2013, PASP, 125, 306
- Fortney, Marley, and Barne (2007) Fortney, J. J., Marley, M. S., & Barnes, J. W. 2007, ApJ, 659, 1661
- Fukui et al. (2011) Fukui, A., et al. 2011, PASJ, 63, 287
- Fukui et al. (2021) Fukui, A., et al. 2021, AJ, 162, 167
- Fulton et al. (2017) Fulton, B. J., et al. 2017, AJ, 154, 109
- Gaia Collaboration et al. (2021) Gaia Collaboration, et al. 2021, A&A, 649, 1
- Ginzburg et al. (2018) Ginzburg, S., Schlichting, H. E., & Sari, R. 2018, MNRAS, 476, 759
- Guerrero et al. (2021) Guerrero, N. M., et al. 2021, ApJS, 254, 39
- Guillot et al. (1995) Guillot, T., Chabrier, G., Gautier, D., & Morel, P. 1995, ApJ, 450, 463
- Haldemann et al. (2020) Haldemann, J., Alibert, Y., Mordasini, C., & Benz, W. 2020, A&A, 643, A105
- Haqq-Misra et al. (2018) Haqq-Misra, J., Wolf, E. T., Joshi, M., Zhang, X., & Kopparapu, R. K. 2018, ApJ, 852, 67
- Hirano et al. (2020) Hirano, T., et al. 2020, PASJ, 72, 93
- Jenkins et al. (2010) Jenkins, J. M., et al. 2010, Proc. SPIE, Vol. 7740, 77400D
- Jenkins et al. (2016) Jenkins, J. M., et al. 2016, Proc. SPIE, Vol. 9913, 99133E
- Kempton et al. (2018) Kempton, E. M. -R., et al. 2018, PASP, 130, 4401
- Kotani et al. (2018) Kotani, T., et al. 2018, Proc. SPIE, Vol. 10702, 1070211
- Kurosaki and Ikoma (2017) Kurosaki, K., & Ikoma, M. 2017, AJ, 153, 260
- Lillo-Box et al. (2020) Lillo-Box, J., et al. 2020, A&A, 642, A121
- Lopez & Fortney (2013) Lopez, E. D., & Fortney, J. J. 2013, ApJ, 776, 2
- Madhusudhan et al. (2021) Madhusudhan, N., Piette, A A. A., & Constantinou, S. 2021, ApJ, 918, 1
- Mann et al. (2015) Mann, A. W., Feiden, G. A., Gaidos, E., Boyajian, T., & von Braun, K. 2015, ApJ, 804, 64
- Mann et al. (2019) Mann, A. W., et al. 2019, ApJ, 871, 63
- Mayor et al. (2011) Mayor, M., et al. 2011, arXiv:1109.2497
- Martinez et al. (2019) Martinez, C. F., Cunha, K., Ghezzi, L., & Smith, V. V. 2019, ApJ, 875, 29
- Morton (2015) Morton, T. D. 2015, Astrophysics Source Code Library, record ascl:1503.011
- Narita et al. (2019) Narita, N., et al. 2019, J. Astron. Telesc. Instrum. Syst., 5, 015001
- Narita et al. (2020) Narita, N., et al. 2020, Proc. SPIE, Vol. 11447, 114475K
- Nixon & Madhusudhan (2021) Nixon, M. C., & Madhusudhan, N. 2021, MNRAS, 505, 3414
- Owen & Wu (2017) Owen, J. E., & Wu, Y. 2017, ApJ, 847, 29
- Parviainen (2015) Parviainen, H. 2015, MNRAS, 450, 3233
- Parviainen & Aigrain (2015) Parviainen, H., & Aigrain, S. 2015, MNRAS, 453, 3821
- Ricker et al. (2015) Ricker, G. R., et al. 2015, J. Astron. Telesc. Instrum. Syst., 1, 014003
- Safonov et al. (2017) Safonov, B. S., Lysenko, P. A., & Dodin, A. V. 2017, Astronomy Letters, 43, 344
- Seager & Mallén-Ornelas (2003) Seager, S. & Mallén-Ornelas, G. 2003, ApJ, 585, 1038
- Seager et al. (2013) Seager, S., Bains, W., & Hu, R. 2013, ApJ, 777, 95
- Skrutskie et al. (2006) Skrutskie, M. F., et al. 2006, AJ, 131, 1163
- Stassun, Collins, and Gaudi (2017) Stassun, K. G., Collins, K. A., & Gaudi, B. S. 2017, AJ, 153, 136
- Stassun et al. (2017) Stassun, K. G., et al. 2019, AJ, 153, 138
- Stumpe et al. (2014) Stumpe, M. C., Smith, J. C., Catanzarite, J. H., Van Cleve, J. E., Jenkins, J. M., Twicken, J. D., & Girouard, F. R. 2014, PASP, 126, 100
- Tamura et al. (2012) Tamura, M., et al. 2012, Proc. SPIE, Vol. 8446, 84461T
- Twicken et al. (2018) Twicken, J. D., et al. 2018, PASP, 130, 064502
- Winters et al. (2018) Winters, J. G., et al. 2018, AJ, 155, 125
- Yee et al. (2017) Yee, S. W., Petigura, E. A., & von Braun, K. 2017, ApJ, 836, 77
- Zeng et al. (2019) Zeng, L., et al. 2019, Proc. Natl. Acad. Sciences, 116, 20 116, 20