Thermal Waves and Heat Transfer Efficiency Enhancement in Harmonically Modulated Turbulent Thermal Convection
Abstract
We study turbulent Rayleigh-Bénard convection over four decades of Rayleigh numbers , while harmonically modulating the temperatures of the plates of our cylindrical cell. We probe the flow by temperature sensors placed in the cell interior and embedded in the highly conducting copper plates and detect thermal waves propagating at modulation frequency in the bulk of the convective flow. We confirm the recent numerical prediction [PRL 125, 154502 (2020)] of the significant enhancement of Nusselt number and report its dependence on the frequency and amplitude of the temperature modulation of plates.
Our everyday life is continuously affected by a plethora of natural and industrial turbulent flows, driven by time-dependent forcing. They include tidal ocean currents driven by the periodic gravitational attraction of the Moon, the flows of the Earth’s atmosphere due to the heat of the Sun, piston and combustion-generated flows in engines of cars and ships, or blood flow in our veins in tandem to the beating of our hearts. Still, periodically-driven turbulent flows have so far attracted much less attention than their statistically-steady counterparts, which is especially true for the class of buoyancy-driven flows. Here the paradigm is the turbulent Rayleigh-Bénard convection (RBC) [1, 2], occurring within a layer of Oberbeck-Boussinesq (OB) fluid between two horizontal, ideally conducting and laterally infinite plates separated by the distance in a gravitational field (acceleration due to gravity ). Confined turbulent RBC, a very useful laboratory tool, belongs to the family of most frequently studied turbulent flows, however, studies of confined RBC driven by steady temperature difference with a weak superimposed sinusoidal temperature perturbation [3, 4, 5] up to the case of fully periodic thermal drive [6], periodically forced [7] or kicked thermal turbulence [8] are scarce.
In this Letter, we present an experimental study of periodically modulated thermal convection in a cylindrical cell [9], capable of reaching, under OB conditions, turbulent RBC flows over a wide range of Rayleigh numbers in a single experiment [10, 11, 12, 13]. For harmonic modulation of the the mean temperature difference between the bottom and top plates, , we map the relative depth and the phase of the observed dimensionless temperature modulation at various positions in the cell. For we test the heat transfer efficiency by measuring the enhancement of Nusselt number, Nu, in dependence on and at either plate at various Ra, defined as . Here , and are, respectively, the thermal expansion, kinematic viscosity, thermal diffusivity, thermal conductivity, density and specific heat at constant pressure of our working fluid, cryogenic helium gas [14].
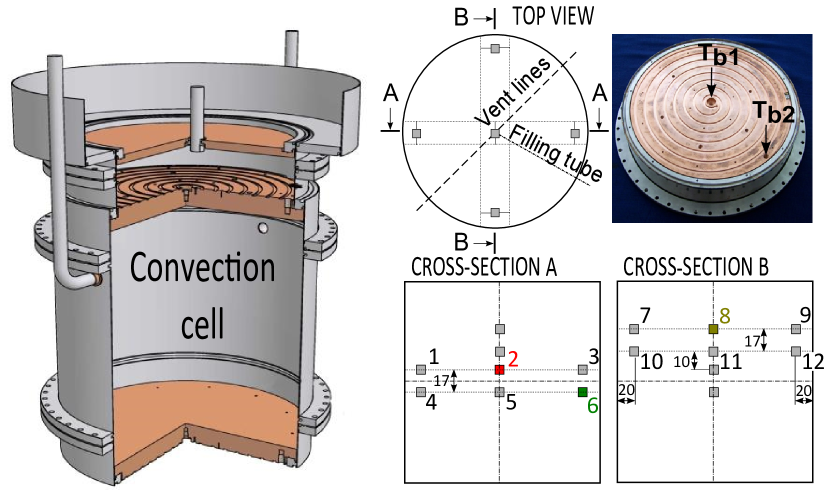
The RBC cell [9] is schematically shown in Fig. 1. Cryogenic conditions are essential, as the cell must be “fast” in order to faithfully and uniformly follow temperature modulations imposed to its plates; for detailed discussion see [15]. The harmonic modulation is achieved by applying suitable time-dependent heat fluxes and , using a home-made PID control scheme in such a way that the time-averaged temperature difference remains constant. The dimensionless efficiency of the heat transport, Nu, is defined via the mean value of the heat delivered to the bottom plate: .
One of motivations for this study was to verify and extend the work of Niemela and Sreenivasan [3], performed in a similar RBC cell, who used a small Ge sensor at the half-height of the cell and measured the temperature signal which followed the harmonically modulated temperature of the bottom plate. For moderate , the modulation of the vertically propagating thermal wave agreed with the form
| (1) |
where denotes the Stokes layer thickness based on effective thermal diffusivity, characteristic of the turbulent working fluid, . For it was, however, not the case: significantly larger amplitude was observed. The authors explained their observations by suggesting a “superconducting core” in the bulk, across which the thermal wave propagates without attenuation [3, 4, 5].
Our cell allows for a more detailed investigation of modulated turbulent RBC flow, as we can measure the temperature signal in multiple positions, as detailed in Fig. 1. As a result of harmonic temperature oscillations imposed on either plate, we indeed observe thermal waves propagating from the plates into the bulk of the turbulent flow. The situation is, however, more complex and cannot be described solely by Eq. 1, as we illustrate in Fig. 2. The readings from sensors No 8, 2 and 6, placed at increasing vertical distances from the top plate, temperature of which is modulated, are within experimental resolution identical in both amplitudes and phase shifts. This remarkable feature is observed for signals from any sensor in the bulk (see Fig. 1), over the entire range of investigated Ra [16]. A similar but upside down outcome is observed when is modulated instead of .
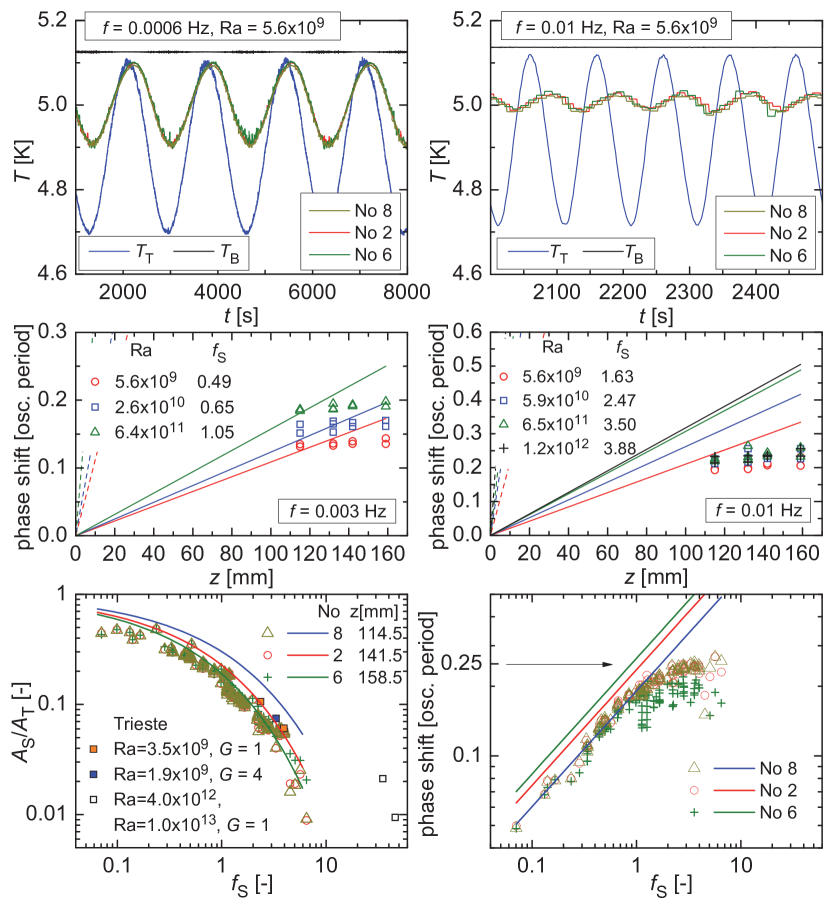
We therefore extend the model of propagating thermal waves leading to Eq. 1, by considering the vertical structure of the high Ra turbulent convective flow, namely the existence of thermal and kinetic boundary layers (BL). For cryogenic He gas of the situation is simpler in that both BL are of similar thicknesses: . In accord with the dimensional reasoning of Priestley [17] and marginal stability arguments of Malkus [18], the high Ra turbulent convective flow consists of (almost) isothermal bulk and two laminar BLs adjacent to plates, over which most of the temperature difference drops. With increasing Ra, decreases and the temperature profile near the plates becomes steeper. Within the BL, the application of Eq. 1 is justified, with . The initial slope of lines (plots of Eq. 1) shown in the middle panels of Fig. 2 therefore must be times steeper (dashed lines). In order to appreciably affect the bulk, the thermal wave has to pass the BL, where its amplitude decreases exponentially with characteristic distance . As soon as the thermal wave passes the BL, it is expected to propagate in the bulk according to Eq. 1, where , where is the local Nusselt number. Experimental observations just described suggest that in the bulk must be very large (consistent with the suggestion of a “superconducting core” [3]), in accord with simulations of high Ra RBC with periodic boundary conditions (i.e., effectivelly excluding BLs) [19].
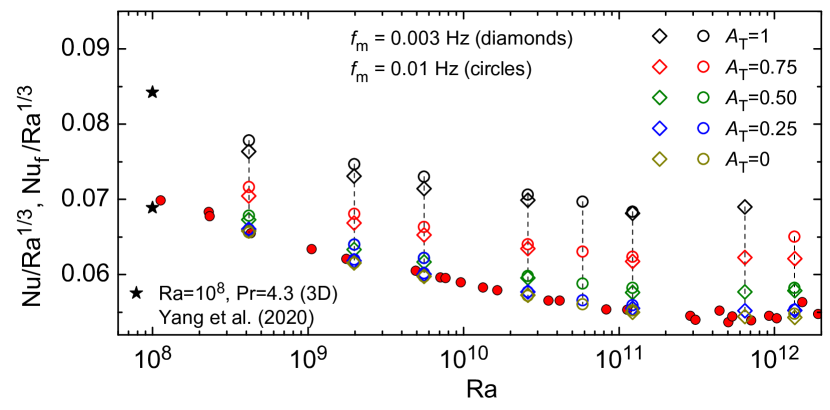
These considerations allow to find a characteristic frequency, emerging from the condition of equal Stokes layer and BL thicknesses: , yielding for our cell Hz over the investigated range of Ra. A significant attenuation of temperature wave within the BL therefore should occur at these frequencies, which are much higher than those used in our experiment: Hz. Consequently, anticipating only a weak effect of BL on the temperature wave, we confront our experimental results with Eq. 1. For each , we introduce a nondimensional scaling frequency . Assuming validity of Eq. 1, the data on a phase shift or amplitude attenuation of temperature wave measured at a distance from the plate should collapse on a universal dependence on . Specifically, we introduce via the ratio of the cell double-height and the wavelength of the wave in Eq. 1; i.e., as . Further, over the investigated range of Ra, the experimentally established scaling reads , where is a numerical factor weakly decreasing with Ra, being about 0.07 at , 0.06 at and about 0.055 at [10, 9], see Fig 5. By using relations for free fall time, and , we arrive at:
| (2) |
with nondimensional .
The bottom panels of Fig. 2 show the attenuated amplitudes and phase shifts measured by sensors in the bulk at various , and , versus . Plotted this way, the data points measured over three decades of and four decades of Ra, collapse on a single frequency dependence. In parallel, up to the (remember the choice of factor 2 in the definition of ) the data follow qualitatively Eq. 1 with Stokes thickness characterizing the thermal wave in the bulk. According to Eq. 1 the wavelength equals at and its phase at the mid-height of the cell reaches . Contrary to Eq. 1, the measured phase shift saturates to this value for (as marked by an arrow in the bottom right panel of Fig. 2). As already mentioned, another disagreement is that the differences between individual sensor’s readings do not depend (at least for the sensors on the cell axis [16]) on their position. Specifically, mutual differences in amplitudes and phases are at least by an order of magnitude smaller than those predicted by Eq. 1. On the whole, our results on detection and propagation of the thermal wave in modulated turbulent convective flow agree with measurements of Refs. [3, 4] at the middle-height of their and cells for moderate of order ; these data can be semi-quantitatively described by Eq. 1. On the other hand, this model is too crude for general description of the thermal wave in RBC, especially at higher , and cannot accurately describe all observed details.
Another motivation for our study was that while the experiments [3, 4] do not report any enhancement of the heat transfer efficiency by harmonically modulated turbulent RBC flow, another experimental study, of kicked thermal turbulence, does. Specifically, Jin and Xia [8] report a resonant Nu enhancement of up to 7%, found when the input pulse period was synchronized with half of the large-scale circulation (LSC) turnover time . Moreover, the recent numerical 2D study (backed up by a 3D study for ) of periodically modulated thermal convection by Yang et al. [6] predicts, for moderate Ra in the range , an appreciable enhancement of Nu, of up to about 25%, occurring over a wide range of modulation frequencies lower or of order . We therefore decided to perform experiments aiming at bridging these apparently contradictory findings.
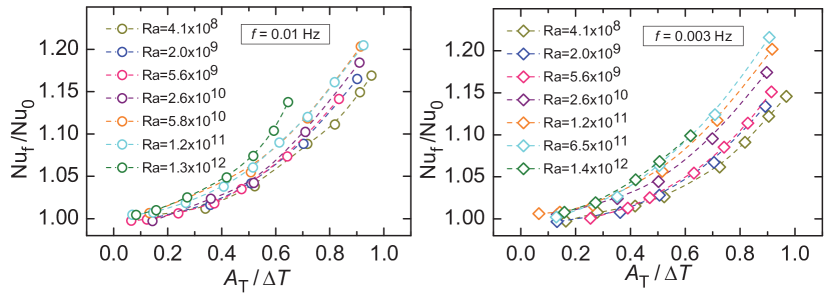
Fig. 3 shows examples of the relative enhancement of the heat transfer efficiency, , measured over four decades of Ra, plotted as a function of dimensionless harmonic temperature modulation , applied at frequencies 0.003 Hz and 0.01 Hz to the top plate. The enhancement grows slightly steeper with increasing Ra, roughly with ; this perhaps explains why no enhancement was noticed for rather low values of used in [3, 4]. We observe similar behavior of when the same temperature modulation is applied to either the top or bottom plate. From an experimental point of view, however, it is easier to apply the temperature modulation to the top plate. Delivering the additional heat flux needed for fast enough harmonic heating of either plate by using our home-made PID control is relatively easy, as our plates are “thermally fast” [15]. That said, the bottom plate is cooled only via the convective heat flow in the cell, while the thermal connection of the top plate to the liquid helium bath above it via the heat exchange chamber is more efficient and can be set as needed [9]. As a result, the top plate faithfully follows a harmonic temperature modulation up to higher [20].
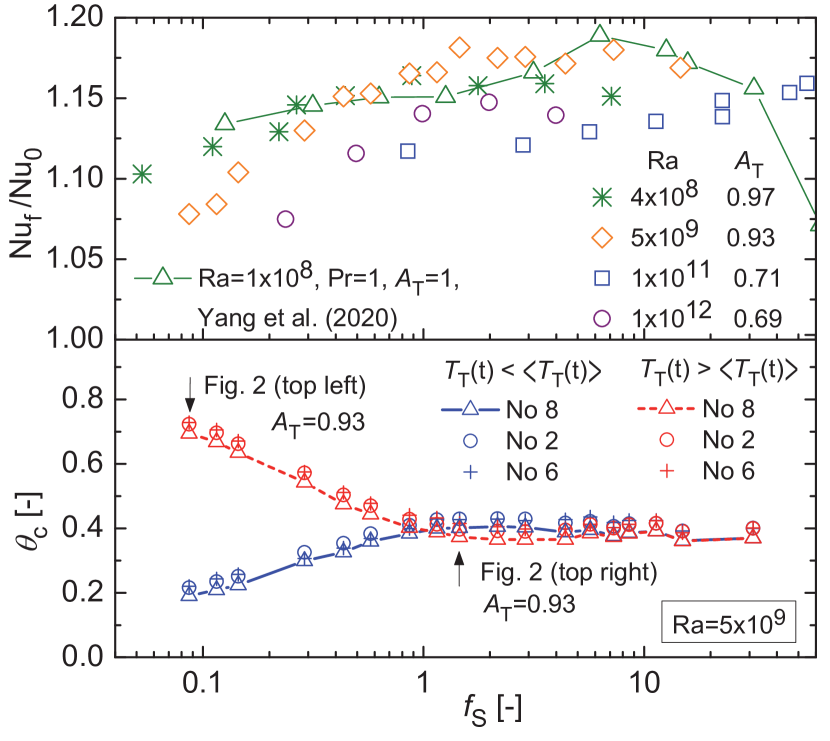
The top panel of Fig. 4 displays as a function of . In contrast with the resonant enhancement synchronized with half of the LSC turnover time found for the kicked turbulent convection [8], the enhancement of the heat transfer efficiency in harmonically modulated turbulent convective flow occurs over several decades of , in fair agreement with numerical prediction of Yang et al. [6] for and .
The bottom panel of Fig. 4 shows the typical phase-averaged dimensionless bulk temperature . For and as indicated it is defined via the bulk temperature measured by sensors No 2, 6 and 8 as: , where denotes averaging over the half period of modulation when is maximal (minimal). All the data series of this kind, measured at various and and phase-averaged over the top and bottom half-periods of the modulation, split around the maximum of the observed (where and the phase shift saturates to ) and display “forks”, in qualitative agreement with numerical prediction – see Fig. 2f and relevant discussion in Ref. [6]. Again, for cryogenic helium gas of the situation is simpler thanks to the fact that thermal and kinetic BLs are of similar thicknesses.
Fig. 5 illustrates the main result of our study: significant enhancement of heat transfer efficiency in harmonically-modulated convection ( and applied to the top plate as indicated) in comparison with the steady-state RBC. We emphasize that all data were measured under identical experimental conditions and the very same basic corrections [13], due to adiabatic gradient and parasitic heat leak, have been applied. A key result is that the enhancement of compensated is robust, occurring over broad ranges of governing flow parameters such as , and .
We believe that our results will stimulate further work on the class of periodic buoyancy-driven turbulent convective flows. This would lead to deeper understanding of important natural flows such as Sun-driven planetary weather formation, especially on Earth, including ocean and tidal flows or ice melting with direct relevance to global warming. There is also a practical aspect of our results – their potential use in the design of more effective heat exchangers for various technical applications.
The authors thank M. Macek and K.R. Sreenivasan for stimulating discussions. This research is funded by the Czech Science Foundation under GAČR 20-00918S.
References
- [1] G. Ahlers, S. Grossmann, and D. Lohse, Heat transfer and large-scale dynamics in turbulent Rayleigh-Bénard convection, Rev. Mod. Phys. 81 (2009) 503.
- [2] F. Chilla, and J. Schumacher, New perspectives in turbulent Rayleigh-Bénard convection, Eur. Phys. J. E 35 (2012) 58.
- [3] J. J. Niemela, and K. R. Sreenivasan, Formation of the “superconducting” core in turbulent thermal convection, Phys. Rev. Lett. 100, 184502 (2008).
- [4] J. J. Niemela, Static and dynamic measurements of the Nusselt number in turbulent convection, Physica Scripta T155, 014059 (2013).
- [5] M. Kuqali, S. Babuin, and J. J. Niemela, Effect of periodic bottom plate heating on large scale flow in turbulent Rayleigh-Bénard convection, J. of Applied Fluid Mech. 8, 483 (2015).
- [6] R. Yang, K. L. Chong, Q. Wang, R. Verzicco, O. Shishkina, and D. Lohse, Periodically modulated thermal convection, Phys. Rev. Lett. 125, 154502 (2020).
- [7] S. Sterl, H.-M. Li, and J.-Q. Zhong, Dynamical and statistical phenomena of circulation and heat transfer in periodically forced rotating turbulent Rayleigh-Bénard convection, Phys. Rev. Fluids 1, 084401 (2016).
- [8] X. L. Jin, and K. Q. Xia, An experimental study of kicked thermal turbulence, J. Fluid Mech. 606, 133 (2008).
- [9] P. Urban, P. Hanzelka, T. Králík, V. Musilová, L. Skrbek, and A. Srnka, Helium cryostat for experimental study of natural turbulent convection, Rev. Sci. Instrum. 81, 085103 (2010).
- [10] P. Urban, V. Musilová, and L. Skrbek, Efficiency of heat transfer in turbulent Rayleigh-Bénard convection, Phys. Rev. Lett., 107, 014302 (2011).
- [11] P. Urban, P. Hanzelka, T. Králík, V. Musilová, A. Srnka, and L. Skrbek, Effect of boundary layers asymmetry on heat transfer efficiency in turbulent Rayleigh-Bénard convection at very high Rayleigh numbers, Phys. Rev. Lett., 109, 154301 (2012).
- [12] P. Urban, P. Hanzelka, V. Musilová, T. Králík, M. La Mantia, A. Srnka, and L. Skrbek, Heat transfer in cryogenic helium gas by turbulent Rayleigh-Bénard convection in a cylindrical cell of aspect ratio 1, New J. Phys. 16, 053042 (2014).
- [13] V. Musilová, T. Králík M. La Mantia, M. Macek, P. Urban, and L. Skrbek, Reynolds number scaling in cryogenic turbulent Rayleig-Bénard convection in a cylindrical aspect ratio one cell, J. Fluid Mech. 832 721 (2017).
- [14] R. D. McCarty, National Bureau of Standards Technical Note No. 631, 1972; V. D. Arp and R. D. McCarty, The properties of critical helium gas, Technical Report, University of Oregon, 1998.
- [15] P. Urban, T. Králík, M. Macek, P. Hanzelka, T. Věžník, and L. Skrbek, Effect of boundary conditions in turbulent thermal convection, Europhysics Letters 134, 34003 (2021).
- [16] In some cases, we observed that the sensor No 6, placed close to the sidewall, shows even slightly smaller phase shift than sensors No 2 and 8, although its distance from the top plate is larger. We believe that this could occur due to the advection by the LSC flow.
- [17] C. H. B. Priestley, Turbulent transfer in the lower atmosphere, Univ. Chicago Press, Chicago, (1959).
- [18] W. V. R. Malkus, Heat transport and spectrum of thermal turbulence. Proc. R. Soc. Lond. A 225, 196 (1954).
- [19] D. Lohse, and F. Toschi, Ultimate State of Thermal Convection, Phys. Rev. Lett., 90, 014302 (2003).
- [20] The case when the total temperature modulation is applied at any ratio in the antiphase to both plates simultaneously is different and will be discussed separately.