H i absorption at against the lobe of the powerful radio galaxy PKS 040975
Abstract
We present results from a search for the H i 21-cm line in absorption towards 16 bright radio sources with the 6-antenna commissioning array of the Australian Square Kilometre Array Pathfinder (ASKAP). Our targets were selected from the 2-Jy sample, a flux-limited survey of the southern radio sky with extensive multi-wavelength follow-up. Two sources were detected in H i absorption including a new detection towards the bright FRII radio galaxy PKS 040975 at a redshift of . The H i absorption line is blueshifted by 3300 km s-1 compared to the optical redshift of the host galaxy of PKS 040975 at . Deep optical imaging and spectroscopic follow-up with the GMOS instrument on the Gemini-South telescope reveal that the H i absorption is associated with a galaxy in front of the southern radio lobe with a stellar mass of , a star-formation rate of yr-1 and an estimated H i column density of cm-2, assuming a spin temperature of K and source covering factor of . Using polarisation measurements of PKS 040975 from the literature we estimate the magnetic field of the absorbing galaxy to be G, consistent with field strengths observed in nearby spiral galaxies, but larger than expected for an elliptical galaxy. Results from this pilot study can inform future surveys as new wide-field telescopes allow us to search for 21-cm H i absorption towards all bright radio sources as opposed to smaller targeted samples.
keywords:
galaxies: active – galaxies: ISM – galaxies: individual (PKS 040975) – radio lines: galaxies1 Introduction
It is well established that the brightest extragalactic radio sources are produced by synchrotron-emitting radio jets launched from a central active galactic nucleus (AGN; Condon 1989; Condon et al. 1998; Mauch & Sadler 2007; Condon et al. 2019). The precise conditions required to trigger and form these jets remains an active area of research, but the presence of cold gas as a source of fuel for the central AGN is a critical component. As such, studying the distribution and kinematics of cold gas at the cores of active galaxies is crucial to understanding the fuelling and feedback processes that shape their evolution. Observing the dynamics and kinematics of the gas can provide some of the most direct evidence for fuelling (Maccagni et al., 2014; Tremblay et al., 2016; Chandola et al., 2020) and feedback processes (Morganti et al., 2005; Dasyra & Combes, 2012; Morganti et al., 2013; Tadhunter et al., 2014; Oosterloo et al., 2019; Herrera-Camus et al., 2020; Schulz et al., 2021) in AGN.
Searching for H i 21-cm absorption against bright radio sources is a highly effective tool in probing the dynamics of the cool, neutral gas, particularly beyond the nearby Universe () where emission line studies require prohibitively long integration times (see Morganti et al. 2015; Morganti & Oosterloo 2018 and references therein). In addition to being detectable out to large redshift, 21-cm absorption line studies have the advantage of directly tracing the gas at the position of the radio AGN, are more sensitive to the colder gas, and have the potential to probe gas at higher spatial resolution (e.g. Beswick et al. 2002, 2004; Morganti et al. 2013; Schulz et al. 2018).
van Gorkom et al. (1989) carried out one of the first systematic searches for H i absorption in radio-loud AGN with the Very Large Array (VLA), detecting H i in 13% of the 29 radio galaxies observed. Since then, there have been numerous studies searching for H i absorption using different source selections (Morganti et al., 2001; Gupta & Saikia, 2006; Curran et al., 2008; Geréb et al., 2015; Allison et al., 2015; Maccagni et al., 2017; Murthy et al., 2021). These searches typically detect the presence of neutral gas in approximately 30% of sources (Geréb et al., 2015; Maccagni et al., 2017), although this varies significantly according to the sample selection. Numerous studies have reported higher detection rates in compact radio sources ranging from 32-57% (Vermeulen et al., 2003; Pihlstrom et al., 2003; Gupta & Saikia, 2006; Chandola et al., 2013; Maccagni et al., 2017; Murthy et al., 2021) while a study of galaxy mergers found H i absorption in 84% of the sample (Dutta et al., 2018, 2019). By comparison, Maccagni et al. (2017) report a detection rate of 15% for extended radio sources and Murthy et al. (2021) did not detect any H i 21-cm absorption lines towards the 14 resolved radio sources in their sample.
The majority of these studies have been carried out at low redshifts largely due to the available frequency coverage of most interferometers, such as the Westerbork Synthesis Radio Telescope (WSRT; Geréb et al. 2015; Maccagni et al. 2017; Vermeulen et al. 2003), the VLA (van Gorkom et al., 1989; Morganti et al., 2005; Murthy et al., 2021) and the Australia Telescope Compact Array (ATCA; Allison et al. 2012b; Glowacki et al. 2017). In addition, the relatively narrow bandwidths meant that prior knowledge of the redshift of the radio source was needed to ensure the H i 21-cm line was observable in the frequency range available. This was particularly true for observations carried out prior to significant upgrades of the ATCA and VLA which increased the available bandwidth from MHz to MHz frequency windows for ATCA (Wilson et al., 2011) and from 100 MHz to 2–8 GHz (depending on the spectral resolution and frequency coverage) for the VLA (Perley et al., 2011). This requirement of prior knowledge of the spectroscopic redshift introduces various selection biases since the optical magnitude of the galaxy needs to be sufficiently bright to obtain a redshift measurement. An increasing number of high-redshift searches () have been performed using the Giant Metrewave Radio Telescope (GMRT; Curran et al. 2008, 2012; Aditya 2019; Aditya et al. 2021), significantly enhanced thanks to the recent upgrade which increased the instantaneous bandwidth from 32 MHz to 400 MHz and increasing the available frequency coverage from 50-1500 MHz (Aditya et al., 2016; Aditya, 2019; Dutta et al., 2020).
The advent of new facilities with wider bandwidths, including the Australian Square Kilometre Array Pathfinder (ASKAP; Hotan et al. 2021), MeerKAT (Jonas & MeerKAT Team, 2016), Westerbork Aperture Tile in Focus (AperTIF; Oosterloo et al. 2009) and the upgraded GMRT (Gupta et al., 2017), have opened up a much larger frequency window to search for H i in absorption. Importantly, the large instantaneous bandwidth ( MHz for ASKAP and Apertif and MHz for uGMRT and MeerKAT), and relatively Radio Frequency Interference (RFI)-free spectrum allow us to search for absorption lines without prior knowledge of the redshift. This has been demonstrated by the recent detection of several H i absorption systems where the redshift of the background radio source was not known before the observations (Allison et al., 2015; Moss et al., 2017; Glowacki et al., 2019; Allison et al., 2020; Chowdhury et al., 2020; Sadler et al., 2020).
This paper presents a search for H i absorption towards 16 powerful radio galaxies with the Boolardy Engineering Telescope Array (BETA); the 6-element commissioning array of ASKAP (Hotan et al., 2014; McConnell et al., 2016). The sources were selected from the 2-Jy sample (Wall & Peacock, 1985; Tadhunter et al., 1993) to ensure there was sufficient radio continuum to be able to detect H i absorption with the 6 antennas of ASKAP-BETA. Section 2 describes the sample selection, observations and data reduction of the ASKAP-BETA observations and Section 3 presents the results of the ASKAP-BETA search for H i absorption. Section 4 describes follow-up optical observations carried out with the Gemini-South telescope. We discuss the properties of the H i absorption detection and implications for similar detections in upcoming large absorption line surveys in Section 5 before concluding in Section 6.
2 Radio Observations
2.1 Sample selection
A sample of 16 bright radio galaxies was selected from the 2-Jy sample (Wall & Peacock, 1985); a complete, flux-density limited sample of sources brighter than 2 Jy at 2.7 GHz. An extensive campaign of multi-wavelength follow-up has been carried out for 2-Jy sources at declinations , steep spectral indices ()111where and the sub/super-scripts refer to the frequency range in GHz between which the spectral index was measured and redshifts between (Tadhunter et al., 1993). This includes high-resolution radio imaging (Morganti et al., 1999), deep optical imaging and spectroscopy (Ramos Almeida et al., 2011), mid and far-IR imaging (Dicken et al., 2008; Dicken et al., 2012) and X-ray observations (Mingo et al., 2014). The completeness of the multiwavelength follow-up make it an ideal sample to search for H i absorption as it is a radio-selected sample, yet has the accompanying multi-wavelength data needed to provide redshifts and luminosities without introducing additional selection effects based on the optical properties (e.g. such as those introduced by selecting sources with existing spectroscopic data from large optical surveys which can add an additional optical flux-limit). Only sources with redshifts were included to ensure the H i line would fall in the frequency range observed which can trace the H i line from .
A summary of the properties of these 16 radio galaxies is given in Table 1. All sources have been classified according to their radio morphology (Fanaroff-Riley Type I/II (FRI/FRII) or Compact Steep Spectrum (CSS) objects) and their optical spectral properties (Narrow or Broad Line Radio Galaxy (NLRG/BLRG, QSO) given in Tadhunter et al. (1993); Morganti et al. (1993). We also list the measured flux densities at 4.8 GHz (both the core and total flux measurements as given in Morganti et al. (1993)) and at 850 MHz from the Rapid ASKAP Continuum Survey (RACS; McConnell et al. 2020; Hale et al. 2021).
| Source | RA (J2000) | DEC (J2000) | Radio cl. | Opt. cl. | ||||
|---|---|---|---|---|---|---|---|---|
| PKS 002326 | 00h25m4916 | 26∘02126 | 0.322 | CSS | NLRG | 3.41 | unresolved | 11.6 |
| PKS 003502 | 00h38m2052 | 02∘07407 | 0.220 | (FRII)∗ | BLRG | 2.64 | 0.662 | 9.1 |
| PKS 003944 | 00h42m0898 | 44∘14005 | 0.346 | FRII | NLRG | 1.17† | no core | 5.7 |
| PKS 010516 | 01h08m1690 | 16∘04206 | 0.400 | FRII | NLRG | 1.17 | 0.002 | 6.3 |
| PKS 011715 | 01h20m2710 | 15∘20166 | 0.565 | FRII | NLRG | 1.6 | no core | 7.1 |
| PKS 023519 | 02h37m4345 | 19∘32333 | 0.620 | FRII | BLRG | 1.44 | 0.0002 | 6.8 |
| PKS 025271 | 02h52m4616 | 71∘04353 | 0.563 | CSS | NLRG | 1.58 | unresolved | 8.8 |
| PKS 040975 | 04h08m4849 | 75∘07193 | 0.693 | FRII | NLRG | 4.25 | no core | 19.6 |
| PKS 113613 | 11h39m1070 | 13∘50436 | 0.554 | FRII | QSO | 1.9 | no core | 6.2 |
| PKS 115134 | 11h54m2179 | 35∘05291 | 0.258 | CSS | QSO | 2.78 | unresolved | 7.6 |
| PKS 130609 | 13h08m3912 | 09∘50325 | 0.464 | CSS | NLRG | 1.9 | unresolved | 5.6 |
| PKS 154779 | 15h55m2165 | 79∘40363 | 0.483 | FRII | BLRG | 1.38 | 0.003 | 6.1‡ |
| PKS 160201 | 16h04m4532 | 01∘17510 | 0.462 | FRII | BLRG | 1.13 | 0.065 | 6.8 |
| PKS 193815 | 19h41m1507 | 15∘24313 | 0.452 | FRII | BLRG | 2.34 | no core | 9.2 |
| PKS 213514 | 21h37m4517 | 14∘32558 | 0.200 | FRII | QSO | 1.38 | 0.121 | 5.8 |
| PKS 213520 | 21h37m5001 | 20∘42316 | 0.635 | CSS | BLRG | 1.53 | unresolved | 5.2 |
-
•
∗ Brackets indicate an uncertain radio morphology for this object.
-
•
† Flux densities published in Morganti et al. (1999) for this object.
-
•
‡ Flux density for this source was obtained from the initial RACS catalogue available from the CSIRO ASKAP Science Data Archive (CASDA)222https://research.csiro.au/casda/.
2.2 ASKAP-BETA
Observations were carried out using ASKAP-BETA over the period from November 2014 - February 2016. This 6-element interferometer had baselines ranging from 37 to 916m, leading to a synthesised beam of approximately 1.5 arcmin at 850 MHz when using natural weighting.
The majority of sources were observed over the frequency range 711.5 – 1015.5 MHz corresponding to H i redshifts in the range . Five targets were observed at higher frequencies (967.5 – 1271.5 MHz) which covers the redshift range , however, this frequency range is more strongly affected by RFI from satellites and aircraft, with approximately 30-50% of the data being flagged. Each target was placed at the phase centre of the central beam, with the remaining 8 beams arranged in a diamond footprint (see Allison et al. 2015 for more details). The primary flux calibrator, PKS B1934638, was observed for short scans of 5–15 min in each beam at the beginning of each observing run. A summary of the ASKAP-BETA observations is given in Table 3.
The data were reduced using a custom-built miriad pipeline as described in detail by Allison et al. (2015). In summary, the data were separated into 64 subbands corresponding to the 4-5 MHz beam-forming frequency intervals used by ASKAP-BETA and each subband then reduced independently using the standard flagging, calibration and imaging miriad tasks. Processing each subband separately provided the advantage of allowing parallelisation of the data reduction, but also corrected for the discrete jumps in the gain solutions at the edge of the beam-forming intervals.
The continuum subtraction was performed in two steps: first, by subtracting the clean components generated from a continuum image of each subband from the visibilities using uvmodel, and then by fitting a second-order polynomial using uvlin to subtract any residual flux from continuum sources that were not sufficiently removed from the visibilities. Finally, a spectrum was extracted at the peak flux density of the target source (which were all unresolved by ASKAP-BETA) at the full spectral resolution of 18.5 kHz which corresponds to a rest-frame velocity resolution of 5.5-7.8 km s-1. For consistency, the data were re-reduced after the completion of all observations to ensure the same version of the pipeline was used for all targets.
After reducing each observation independently, the extracted spectrum for each target was averaged and weighted by the inverse-variance measured across the channel images. For more details on the data processing we refer the reader to Allison et al. (2015).
3 Results
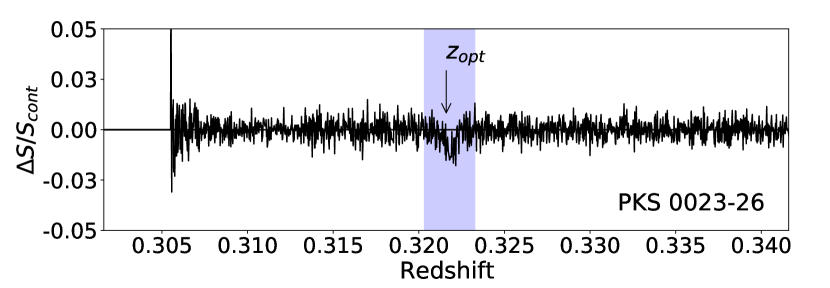
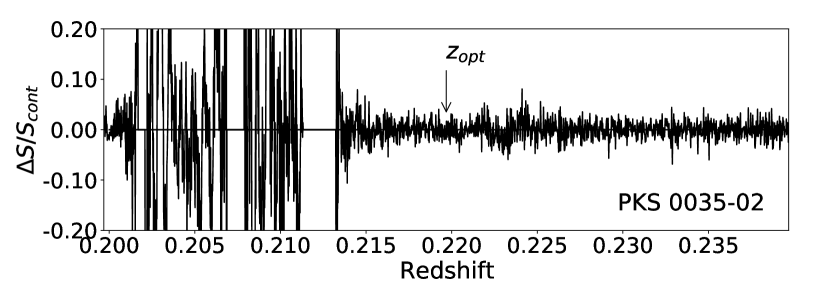
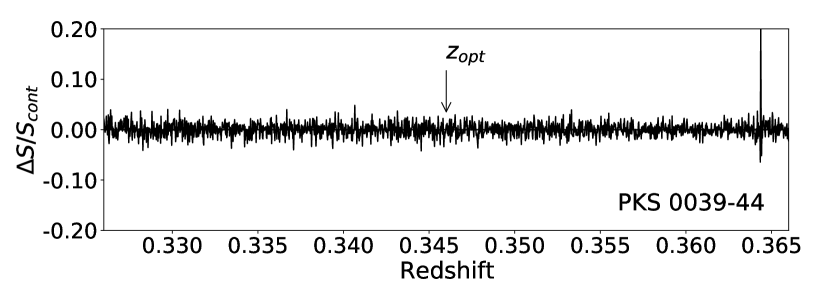
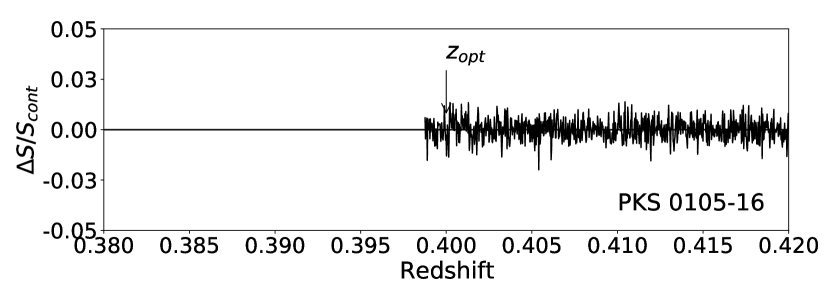
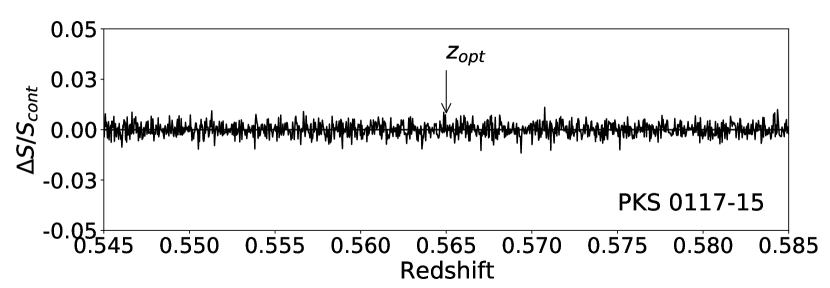
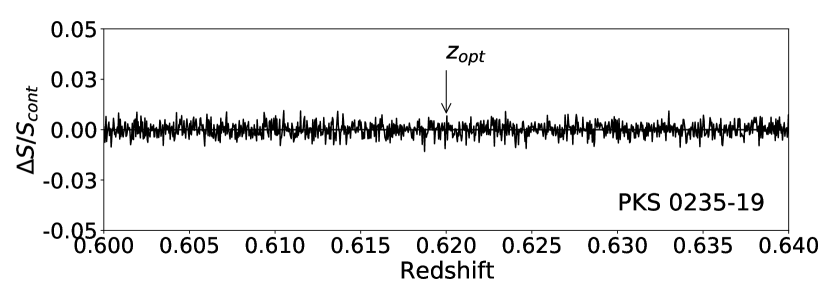
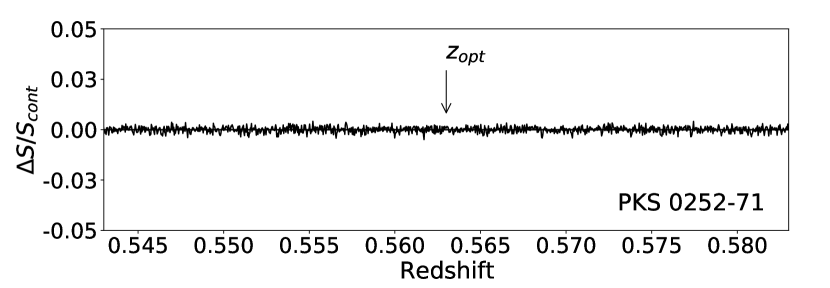
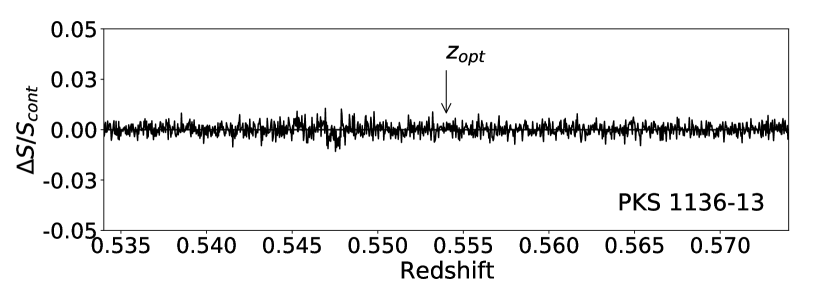
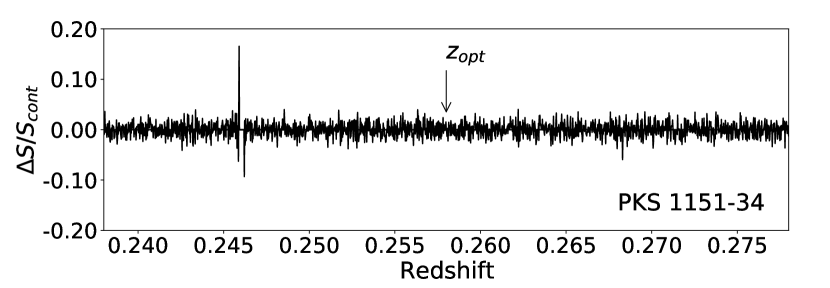
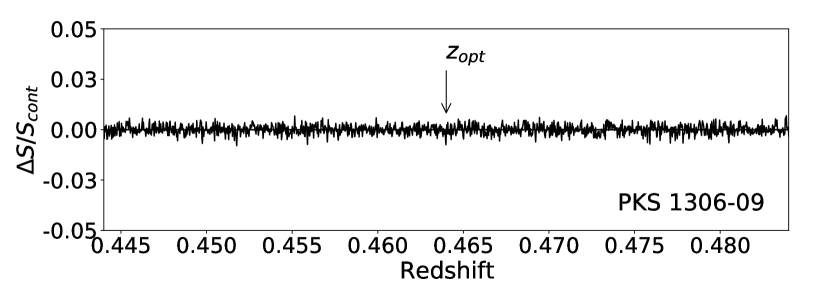
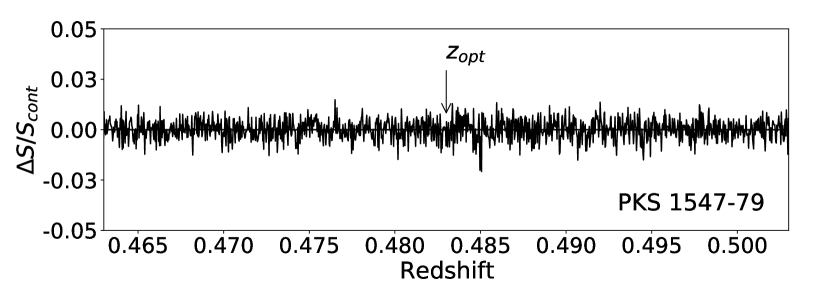
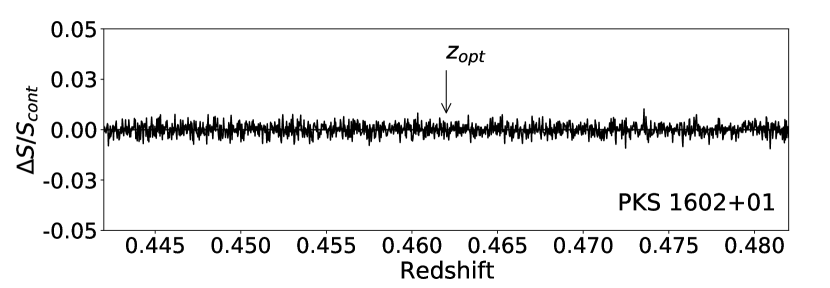
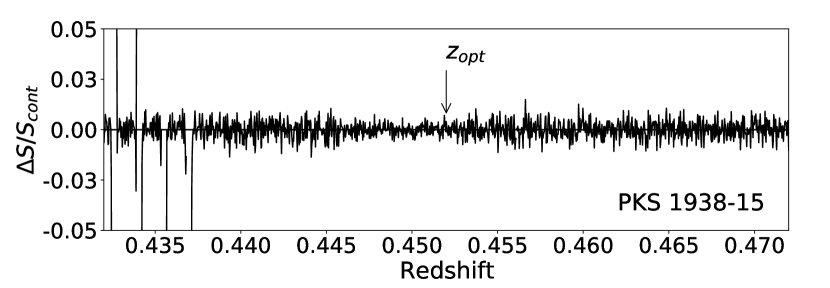
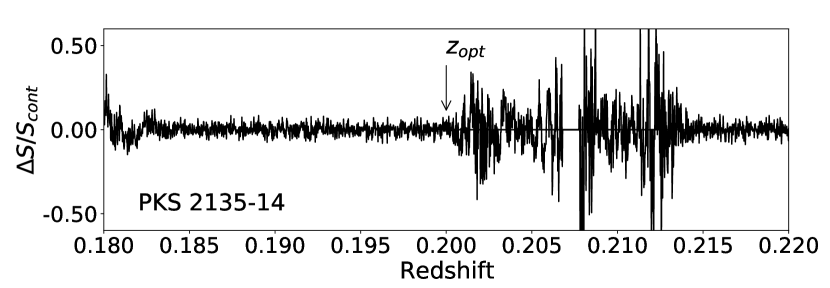
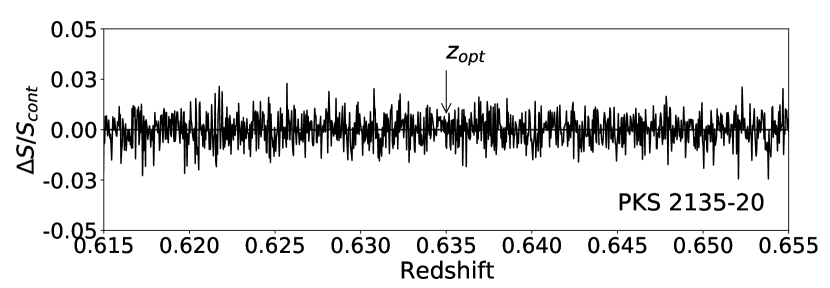
H i 21-cm absorption was detected in two of the sixteen targets observed with ASKAP; one associated with PKS 002326 at a redshift of (Vermeulen et al., 2003) and a new detection towards PKS 040975 at a redshift of . The H i spectra are shown in Figure 1. Here we display a small fraction of the total bandwidth around the expected frequency of the H i 21-cm line determined from the optical redshift of the radio galaxy. An example of the full spectrum obtained from ASKAP-BETA is shown in 6. The primary aim of this work is to search for associated absorption, but the wide bandwidth provided by ASKAP-BETA also allows us to search for any intervening absorption along the line-of-sight. No other detections of H i 21-cm absorption were observed in this sample, but given the small sample size and amount of bandwidth flagged due to RFI at the lower frequencies this is not unexpected.
3.1 H i properties of the sample
While this paper presents a comparatively small sample of 16 targets that were searched for H i 21-cm absorption, a detection rate of 12.5% (2/16) may appear to be at the lower end of the range of previously reported detection rates for associated 21-cm absorption (Morganti et al., 2001; Vermeulen et al., 2003; Curran et al., 2008; Chandola et al., 2013; Geréb et al., 2015; Maccagni et al., 2017; Dutta et al., 2018; Murthy et al., 2021). However, a number of uncertainties make it difficult to confirm this and carry out a fair comparison with previous studies. The biggest factors contributing to this are: (1) the wide range in integration time (and therefore sensitivity reached) for objects in the sample as all observations were carried out in an opportunistic fashion during the commissioning period, and (2) the large range of radio continuum source structure of our sample. The latter leads to highly uncertain covering factors () which can change the optical depth and H i column density limits by orders of magnitude.
The covering factor is often estimated by using the ratio of core to total flux density (‘’) which provides a measure of the compactness of the radio source, limited by the spatial resolution of the available data (see e.g. Kanekar et al. 2009a). For compact sources (i.e. such as those classified as CSS in Table 1) this gives a covering factor of which is the typically assumed for most 21 cm absorption line studies, driven by the fact that most samples are selected based on source compactness, or a minimum core flux density (e.g. Morganti et al. 2001; Maccagni et al. 2017). In addition, we also need to make an assumption about , the harmonic mean spin (excitation) temperature over the line-of-sight gas. At , the measured spin temperatures on sight lines through galaxies range from 100-1000 K (Kanekar et al., 2014; Allison, 2021) so in the absence of a direct measurement for these sources we assume a spin temperature of K. This value was chosen as the approximate mid-point of the range of observed , but could easily change the estimated by a factor of 2 if is similar to the Milky Way value of K (Dickey et al., 2009; Murray et al., 2018), or K as observed in some damped Lyman- systems (DLAs, e.g. Kanekar et al. 2009b; Kanekar et al. 2014) and in the central regions of AGN (Bahcall & Ekers, 1969; Holt et al., 2006).
Having measured the absorption fraction (), and using these assumptions for and we can calculate the optical depth () and from the following equations:
| (1) |
| (2) |
In Table 2 we calculate using both and where this information was available. The core-total flux density ratios () were calculated from the higher resolution 4.8 GHz radio data observed with either the VLA or ATCA as given in Table 1 (Morganti et al., 1993). Assuming a source covering factor of 1 is reasonable for compact radio sources, but is unphysical for extended radio sources with little core flux and will significantly underestimate . On the other hand, our detection of H i absorption towards PKS 040975 demonstrates that using the core-total flux density ratio is also not always representative of the true covering factor (see Section 5.1).
| Source | (=) | (=1) | ||
|---|---|---|---|---|
| PKS 002326 | 1.0 | 0.0122 | ||
| PKS 003502 | 0.335 | 0.050 | ||
| PKS 003944 | - | 0.050 | - | |
| PKS 010516 | 0.002 | 0.014 | ||
| PKS 011715 | - | 0.009 | - | |
| PKS 023519 | 0.0001 | 0.009 | ||
| PKS 025271 | 1.0 | 0.010 | ||
| PKS 040975∗ | - | 0.0107 | - | |
| PKS 113613 | - | 0.0075 | - | |
| PKS 115134 | 1.0 | 0.029 | ||
| PKS 130609 | 1.0 | 0.0063 | ||
| PKS 154779 | 0.002 | 0.013 | ||
| PKS 160201 | 0.061 | 0.0078 | ||
| PKS 193815 | - | 0.012 | - | |
| PKS 213514 | 0.096 | 0.093 | ||
| PKS 213520 | 1.0 | 0.021 |
-
•
∗ A source covering factor of was assumed for this source as discussed in Section 5.1.
Although the average spectral noise reached in these observations is similar to that achieved in similar studies using ASKAP-BETA (e.g. Allison et al. 2015; Moss et al. 2017; Glowacki et al. 2019; Sadler et al. 2020), these studies primarily focused on compact radio sources and therefore assumed a uniform source covering factor, similar to the majority of H i absorption searches carried out with other radio telescopes. Due to the large uncertainties associated with estimating the covering factor when including resolved or highly extended radio sources from the 2-Jy sample, it is challenging to carry out a fair comparison on the detection rate in this sample with previous studies. In the remainder of this paper we focus on the two detections of H i absorption towards PKS 002326 and PKS 040975.
3.2 H i absorption in PKS 002326
PKS 002326 is a compact steep spectrum radio source at (Santoro et al., 2020) with a linear size of 1.97 kpc (Tzioumis et al., 2002). The radio source is identified with an galaxy (Wall & Peacock, 1985) and deep optical and IR follow-up have found evidence for active star formation (Tadhunter et al., 2002; Holt et al., 2007; Dicken et al., 2012). Recent ALMA observations of this source also reveal that it is extremely rich in molecular gas (Morganti et al., 2021).
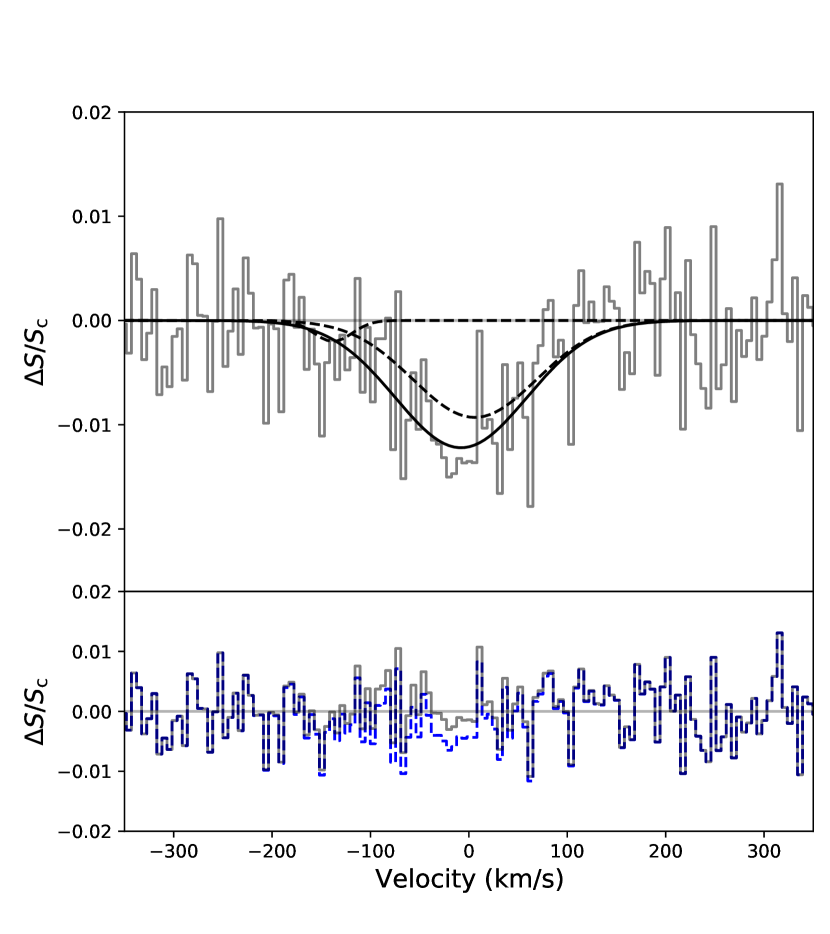
Observations with ASKAP-BETA reveal H i absorption at 1074.4 MHz. To derive the properties of the H i line we used FLASHFinder333https://github.com/drjamesallison/flash_finder, an automated line finding and characterisation tool, full details of which are described in Allison et al. (2012a). A single Gaussian component with a rest-frame FWHM km s-1, peak optical depth and redshift provided the best fit to the data. This best fitting model is shown in Fig 2 where the systemic velocity has been set to the optical redshift of (Santoro et al., 2020). Since PKS 002326 is a known CSS source (with Very Long Baseline Interferometry (VLBI) imaging confirming a linear extent kpc; Tzioumis et al. 2002) we assume a covering factor of 1 and a spin temperature of 500 K to obtain a H i column density of
| (3) |
H i 21-cm absorption was previously detected in this source by Vermeulen et al. (2003) using the Westerbork Synthesis Radio Telescope (WSRT). Due to the larger sensitivity of the WSRT array compared to ASKAP-BETA, these observations revealed two components of the absorption line: a deeper component centred close to the systemic velocity of the galaxy ( km s-1, km s-1 with peak optical depth ) and a second, shallower component blueshifted from the systemic ( km s-1, km s-1 with peak optical depth )444We note that the rest-frame velocities measured in the WSRT observations are defined from the most accurate redshift available at the time of publication of (di Serego Alighieri et al., 1994).
Figure 2 overlays these line fits to visually compare with the single Gaussian component identified in the ASKAP-BETA spectrum. The shallower component is not recovered in the ASKAP-BETA observations due to the higher noise levels, but while the velocity width is similar, the deeper component shows a slight change in peak optical depth between the WSRT and ASKAP-BETA observations. This is mostly clearly seen in the residual spectra after subtracting these two different fits as shown in the bottom panel of Figure 2. The uncertainties associated with the peak optical depth measurements indicate they are within 2 sigma and therefore any possible variability is unlikely to be statistically significant. To further verify this, the line parameters reported by Vermeulen et al. (2003) were subtracted from the ASKAP-BETA spectrum and the residual spectrum run through the FLASHfinder line-finding tool to search for evidence of an absorption feature remaining. No significant lines were detected confirming that the measured line parameters are consistent with each other within the noise.
3.3 H i absorption in PKS 040975
PKS 040975 is a powerful FRII radio galaxy with a projected linear size of 85 kpc (Large et al., 1981; Morganti et al., 1999)555PKS 040975 is also sometimes referred to as PKS 041075 (e.g. in the NASA Extragalactic Database; https://ned.ipac.caltech.edu/ ). The host galaxy is a magnitude mV = 21.6 galaxy which is resolved into two components and displays extended emission in [OII]3727 (di Serego Alighieri et al., 1994). Fitting stellar population models to the optical spectrum, Holt et al. (2007) found that PKS 040975 has a very young stellar population with an age of approximately 0.02 Gyr. The extended emission in [OII], a young stellar population, and complicated optical structure, point towards recent merger activity in this galaxy.
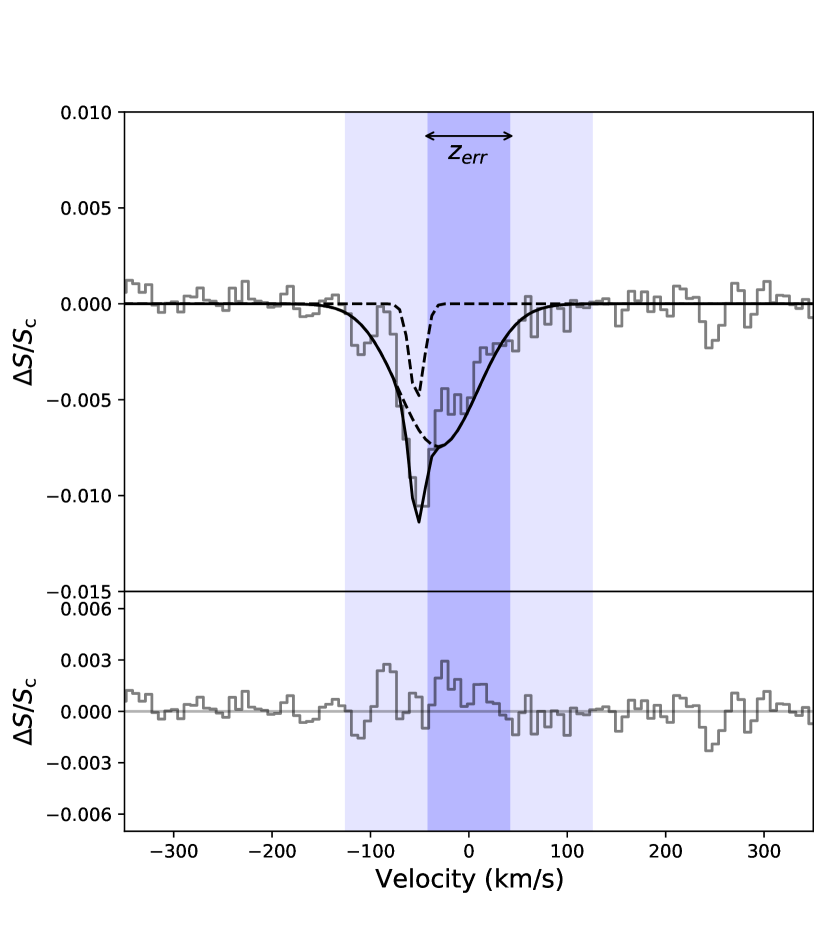
ASKAP-BETA observations revealed H i absorption detected along the line-of-sight to PKS 040975, at a frequency of 848.5 MHz. Using the FLASHfinder line-fitting tool the absorption line is best fit by two Gaussian components as shown in Figure 3; a narrow line with FWHM km s-1, peak redshift and peak optical depth and a broader component with FWHM km s-1, redshift and peak optical depth . However, the most striking feature of this detection is that the H i absorption is at a redshift of = 0.674, offset from the systemic velocity of the host galaxy (determined by the optical redshift of ) by more than km s-1.
Such an extreme velocity offset implies that the neutral gas detected via the 21-cm absorption signal is not associated with PKS 040975 itself, but more likely originates from a nearby galaxy in the surrounding environment of this powerful radio source. Although there is some evidence for merger-related activity in the host galaxy of PKS 040975 (Ramos Almeida et al., 2011), the velocity offset is significantly larger than what is typically associated with tidal features. Tidal features associated with individual galaxies or galaxy pairs are typically less than 200 km s-1 (Bekki et al., 2005; Koribalski, 2020) while the spread of tidal debris in galaxy groups or clusters can be larger, up to km s-1 and km s-1 respectively (Saponara et al., 2018; Lee-Waddell et al., 2019; Namumba et al., 2021). A velocity difference of more than 3000 km s-1 has not been observed and is unlikely in a bound system.
Previous deep optical imaging of PKS 0409-75 presented in Ramos Almeida et al. (2011) shows evidence for a separate galaxy co-incident with the southern radio lobe, however, no spectroscopic information was available to indicate if this galaxy is at the same redshift as the H i absorption line.
4 Optical follow-up of PKS 040975
To verify that this galaxy observed in previous optical images could be a possible association of the Hi feature, additional imaging and longslit spectroscopy were obtained using the Gemini-South telescope.
4.1 Optical Imaging
Follow-up multi-band imaging of PKS 040975 was carried out on 2017 August 28 using the Gemini Multi-Object Spectrograph (GMOS) on the Gemini-South 8m telescope (ProgID number GS-2017B-Q-63). The 5.5 arcmin field was centred on PKS 040975 and a 300 second exposure time used in each of the and filters with the aim of reaching limiting magnitudes of approximately =23.9, =23.5 and =23.3. The total exposure time in each band was split into 475 second individual exposures to aid in cosmic ray rejection. The seeing conditions during the observations ranged from 0.7 – 0.8 arcsec.
The data were reduced using the standard Gemini iraf packages and a gri-colour image made using the astropy and aplpy packages (The Astropy Collaboration et al., 2018; Robitaille, 2019). No standard stars were observed during the imaging observations, so the median photometric zero-points measured for each GMOS-S filter666https://www.gemini.edu/instrumentation/gmos/calibrations#PhotStand were used when calculating optical magnitudes.
4.2 Longslit Spectroscopy
Longslit observations of PKS 040975 were taken with the Gemini Multi-Object Spectrograph (GMOS) on the Gemini-South telescope on 2017 September 16 as part of the same observing programme (GS-2017B-Q-63). In order to distinguish between the two possible optical associations detected in previous Gemini imaging we orientated a 1.5 arcsec slit at a position angle of 133 deg to obtain spectra of both the host galaxy of PKS 040975 and the nearby galaxy at the position of the eastern radio lobe.
The observations were taken using the R400 grating with central wavelengths of 700 and 705 nm which allowed for dithering across the CCD chip gaps to obtain continuous spectral coverage from 490-910 nm. Using 2x2 binning resulted in pixel sizes of 0.16 arcsec spatially and 0.15 nm in the spectral direction. 6x900s exposures were taken for each central wavelength leading to a total on source integration time of 3 hr. GCALflat observations were taken in between the science observations while bias images and CuAr arc exposures were taken at the end of the night.
Standard Gemini iraf tasks were used for bias subtraction, flat-fielding, wavelength calibration and sky subtraction for each exposure independently. The 2D spectra for each configuration were then combined to increase the S/N before extracting two apertures for each combined 2D spectrum; one at the position of the host galaxy of PKS 040975 (denoted ‘galaxy A’ hereafter) and another at the position of the galaxy at the position of the eastern radio lobe (‘galaxy B’). The data were flux calibrated using an observation of a standard star (CD-34 241) taken on 2017 August 21. No telluric calibration was performed meaning the atmospheric A-band is still evident in the resulting spectra. Once calibrated, the 1D spectra were combined using the iraf scombine task.
The reduced spectra of both galaxies were then run through the MARZ web-based redshifting software (Hinton et al., 2016) to identify the redshift of both sources.
4.3 Optical properties of PKS 040975
A 3-colour image compiled from , and band observations is shown in Figure 4 overlaid with contours from 8 GHz Australia Telescope Compact Array (ATCA) observations (Morganti et al., 1999), which shows an elliptical galaxy at the position of the southern radio lobe. For ease of reference we denote the host galaxy of PKS 040975 ‘galaxy A’ and the galaxy coincident with the southern radio lobe ‘galaxy B’ hereafter. We also note that the radio contours shown in Figure 4 have much higher spatial resolution due to the higher observed frequency and longer baselines provided by the ATCA, resulting in a synthesised beam of compared to the resolution provided by ASKAP-BETA. The continuum source is unresolved in the ASKAP-BETA observations presented here and therefore we cannot directly determine if the absorption line is detected along the line of sight to one of the radio lobes from the ASKAP-BETA data alone.
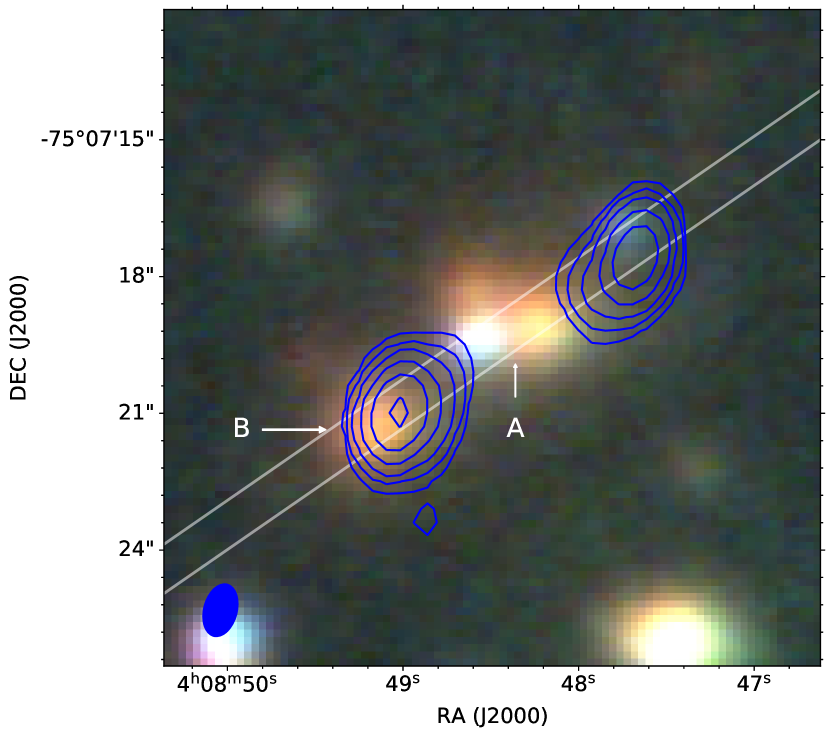
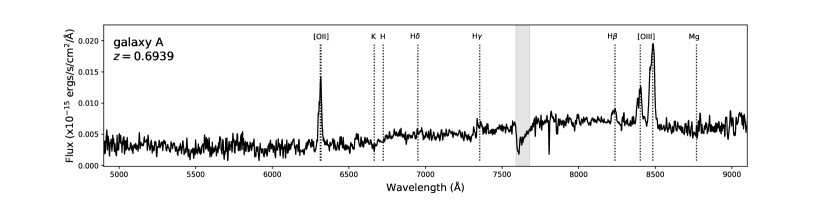
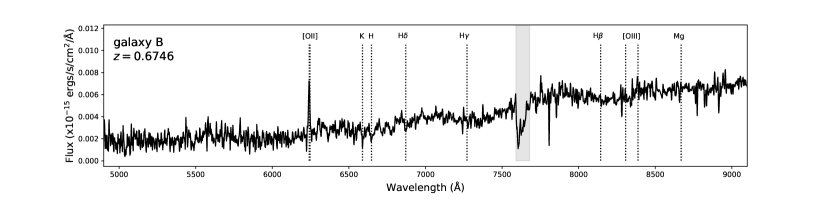
Figure 5 shows the spectra obtained from the Gemini-GMOS observations of galaxies A (top) and B (bottom). Both the optical imaging and spectroscopy confirm the complex nature of the host galaxy of PKS 040975 (galaxy A), with the 3-colour (gri) image showing clear evidence for a double nucleus as previously shown in Ramos Almeida et al. (2011). The spectrum of galaxy A is similar to that observed by di Serego Alighieri et al. (1994) and also shows extended [OII] and [OIII] emission as discussed in Holt et al. (2007).
The redder optical colours for galaxy B on the other hand suggest that this is more likely to be a early-type galaxy. The spectrum of galaxy B shows [OII] emission, as well as evidence for weak [OIII] emission and the CaII H and K absorption lines, placing the source at a redshift . This is very similar to the redshift of the absorption line detected with ASKAP-BETA (within km s-1), confirming galaxy B as the association of the H i 21-cm absorption line.
5 Discussion
5.1 Properties of the H i absorbing galaxy towards PKS 040975
Our targeted follow-up observations of this source at optical-wavelengths indicate that the H i 21-cm absorption system detected with ASKAP-BETA is associated with galaxy B in front of the eastern radio lobe of PKS 040975. Using the redshift of galaxy B () as the systemic velocity, Figure 3 shows that the H i feature detected is slightly blueshifted compared to the systemic velocity, but consistent within the redshift error of 42 km s-1 derived from the optical follow-up777The redshift error is estimated using the Penalized Pixel-Fitting (pPXF) software (Cappellari, 2017). The fact that most of the 21-cm absorption is observed blueward of the systemic velocity could indicate that only a portion of the H i in galaxy B is being detected in absorption. This is somewhat verified by the optical image shown in Figure 4 which shows that galaxy B is not entirely in front of the background radio lobe of PKS 040975, but higher resolution images in both the radio and optical are needed to confirm this. The peak of the radio emission is offset from the centroid of galaxy B meaning that an offset of km s-1 might be expected for a typical galaxy rotation velocity of km s-1 if this sight-line was probing only a small fraction of the galaxy (Reeves et al., 2016). The width of the H i line is broader than typically observed for intervening galaxies where the mean of the distribution is 30 km s-1 (Curran et al., 2016), however this could be explained by the fact that diffuse continuum emission from the background radio lobe could be illuminating multiple sight-lines through galaxy B. We also looked for evidence of rotation along the slit, but as a larger aperture was needed to get sufficient S/N to detect the weak emission lines there was no clear indication of any rotation.
To calculate the H i column density we assume a covering factor of 0.3, roughly estimated based on the flux ratio between the two radio lobes (the eastern lobe contains % of the total flux), combined with the fact that galaxy B intercepts approximately half of the radio lobe as shown in Figure 4. Again assuming a spin temperature K and using the measured integrated optical depth of , Equations 1 and 2 give a 21-cm H i column density of
| (4) |
We estimate a star-formation rate of 1.24 yr-1 using the Penalized Pixel-Fitting (pPXF) software (Cappellari, 2017) to fit and measure the flux of the [OII] emission and following the Kennicutt relation (Kennicutt, 1998). Since the balmer lines were not detected in the longslit observations it was not possible to do any extinction correction when calculating the SFR so this value represents a rough estimate. It should also be noted that [OII] emission is not typically the best tracer to estimate the star-formation rate due to contamination of AGN or shocks which can also produce [OII] emission (Maddox, 2018). However, there is no strong evidence for AGN activity in galaxy B and the moderate amount of star-formation is consistent both with the H i column density and typical SFR of early-type galaxies (Serra et al., 2012; Davis et al., 2014).
Using the SExtractor source finding software (Bertin & Arnouts, 1996), we measure optical magnitudes of , and using the automag option for the absorbing galaxy (galaxy B). The -band image was used as the detection image for all filters to ensure that a common aperture was used for the source finding. These optical magnitudes were corrected for Galactic extinction using values given by Schlafly & Finkbeiner (2011) and K-corrected to give a restframe () colour of 1.12 mag using the method in Chilingarian et al. (2010). Galaxy B was also detected in the VISTA Hemisphere Survey (VHS; McMahon et al. 2013, 2021) with source name VHS J040849.12750721.5 and magnitudes and mag. Using () colour combined with the /band magnitudes, and following the stellar M/L ratios as a function of opticalNIR colours (Bell et al., 2003) we estimate the stellar mass of galaxy B to be approximately . At this stellar mass, the optical colours are slightly redder (0.1 dex) than that of typical red sequence galaxies in low-density environments (Hogg et al., 2004). Both the SFR and stellar mass estimates assume a modified Salpeter initial mass function (Kennicutt, 1983; Bell & de Jong, 2001).
In summary, the H i absorption line detected with ASKAP is associated with an early-type galaxy along the line-of-sight to the radio lobe of PKS 040975. The H i column density is similar to column densities observed in some nearby early-type galaxies, and consistent with H i emission line studies that show of early-type galaxies show H i emission (Serra et al., 2012). The optical colours and stellar mass are also similar to that observed in samples of Luminous Red Galaxies (LRGs) at (Maraston et al., 2013; Ching et al., 2017).
5.2 Polarisation properties of PKS 040975
Previous narrow-band radio polarization observations of PKS 040975 at 3cm and 6cm showed an asymmetry in the fractional polarization and Faraday rotation between the two radio lobes (Morganti et al., 1999). More specifically, the observed Faraday rotation, Rotation Measure (; the integral of the line-of-sight magnetic field weighted by thermal electron density) of the eastern lobe exceeds that of the western lobe by approximately 300 rad/m2. While this difference could be produced within or in the vicinity of the lobes, the presence of coherent magnetic fields in the intervening galaxy towards the eastern lobe could also be responsible for the observed Faraday rotation difference. The presence of small-scale turbulent magnetic fields in the intervening galaxy could probably explain the stronger depolarization seen towards the eastern lobe.
Assuming that the RM difference between the lobes can be fully attributed to the absorber galaxy, and using an ionization fraction of 0.1 (He et al., 2013) to convert neutral column density to electron column density, the coherent magnetic field strength, , in the absorber galaxy can be estimated as
| (5) |
A spin temperature Tspin of 500 K, rest-frame Faraday rotation difference between the two lobes of 804.3 rad m-2 corresponds to a coherent magnetic field strength of 14.5 G in the absorber galaxy. The derived magnetic field strength in the absorber galaxy is broadly consistent with the total magnetic field strengths measured in local spiral galaxies (Beck & Wielebinski, 2013; Beck, 2015), as well as the large-scale coherent disk magnetic field strength measured in a galaxy (Mao et al., 2017). However, this estimated field strength is higher than that expected in elliptical galaxies (Seta et al., 2021). A more in-depth study of the broadband polarimetric properties of PKS 040975, including a more detailed estimation of the magnetic fields in the absorber galaxy and its implications on the build-up of galactic magnetic fields over cosmic time will be presented in Seta et al. (in preparation).
5.3 The detection of H i absorption against a radio lobe
Only a handful of H i absorption lines have been detected against the lobes of radio galaxies, primarily due to selection effects of previous samples that have focused on compact radio sources where the chances of detecting H i absorption within the host galaxy of the radio source are much greater. The few detections of H i absorption against a radio lobe have been discovered serendipitously, similar to the case presented here, rather than from a comprehensive survey searching for absorption against extended radio sources.
A recent study by Murthy et al. (2020) reported H i absorption against the radio lobe of 3C 433. In that case, the absorber is a faint disc galaxy with stellar mass of blueshifted by only km s-1 from the systemic velocity of the host galaxy, but has a similar line width of 80 km s-1. Based on this small difference in velocity, combined with some evidence of disturbed morphology in the southern radio lobe led the authors to suggest that the radio lobe could be interacting with the absorbing galaxy. Similar detections of H i absorption against extended radio sources have been detected in nearby galaxies 3C234 (Pihlström, 2001) and B2 132131 (Emonts, 2006), again where the measured velocity of the H i absorption signature is very close to the systemic velocity of the radio AGN host galaxy.
The most distant H i absorption line against a radio lobe detected prior to this discovery was in the radio galaxy PKS 1649062 at (Curran et al., 2011). In this case the H i absorption is redshifted 116 km s-1 compared to the systemic velocity, with the authors suggesting that the absorber is an intervening galaxy gravitationally bound to the system or possibly associated that a large galactic disc with kpc in PKS 1649062 (Curran et al., 2011). These examples all highlight that the detection of 21-cm absorption lines in radio galaxies can trace a number of different situations, and additional multi-wavelength data, especially in the optical, is often vital in the analysis and interpretation of these systems.
Unlike these previous detections, in PKS 040975 the velocity offset of km s-1 is too large for the radio lobe to be directly impacting the absorbing galaxy. Instead, the 21-cm absorption line detected towards this powerful radio galaxy is associated with a foreground galaxy in front of the south-eastern radio lobe.
5.4 Implications for large absorption line surveys
Despite being one of the brightest sources in the radio sky, this is the first time H i absorption has been searched for in this radio source. One reason for this is the fact that as a clearly extended radio source without a strong radio core, PKS 040975 would generally not have been included in typical searches for H i absorption, but a more significant reason is our ability to now search for the 21-cm H i line in absorption over a wide bandwidth at all redshifts between with the advent of the Australian Square Kilometre Array Pathfinder (ASKAP). This allows us to probe the neutral gas properties of galaxies at these intermediate redshifts for the first time (see e.g. Allison et al. 2015; Sadler et al. 2020; Allison 2021), bridging the gap between H i studies at lower redshifts (e.g. Darling et al. 2011), and QSO Damped Lyman Alpha studies at higher redshifts (Kanekar et al., 2014; Neeleman et al., 2016; Rao et al., 2017).
The detection of H i absorption against the lobe of PKS 040975 gives some insight into the range of H i absorption lines that could be detected by upcoming large H i 21-cm absorption line surveys being carried out with SKA pathfinders such as the First Large Absorption Line Survey in H i (FLASH; Allison et al. 2021) and the MeerKAT Absorption Line Survey (MALS; Gupta et al. 2016) which will explore intermediate redshifts from in addition to surveys such as the Search for H i Absorption with AperTIF (SHARP; e.g. Adams & van Leeuwen 2019) and the Widefield ASKAP L-band Legacy All-sky Blind surveY (WALLABY; Koribalski et al. 2020) which will detect H i 21-cm absorption at redshifts . While the sample size presented here is too small to extrapolate the expected detection rate of H i towards extended radio sources, we note that PKS 0409-75 is one of five objects in the sample that have clearly extended radio structure with no detectable radio emission from the core. Searching for absorption towards all bright radio sources regardless of underlying source structure over a wide area of sky, such as planned for the upcoming FLASH survey, will provide the first estimate of the typical detection rate towards extended radio sources. This study also highlights the need for deep multi-wavelength follow-up observations to understand the properties of H i absorbers that will be detected in these large surveys.
6 Conclusions
We have carried out a search for 21-cm H i absorption against 16 bright southern radio sources with using ASKAP-BETA, the commissioning array of the Australian Square Kilometre Array Pathfinder. This study revealed two detections of H i absorption; one in the compact steep spectrum source PKS 002326 at and another towards the radio galaxy PKS 040975. The former shows similar line properties to that reported by Vermeulen et al. (2003), with no significant evidence for variability in the H i line. The absorption towards PKS 040975 at has not been detected previously and is blueshifted from the systemic velocity of the host galaxy by km s-1. Follow-up optical imaging and spectroscopy with GMOS on Gemini-South confirmed that the H i absorption is associated with a foreground galaxy in front of the eastern radio lobe. Using the optical and radio data combined we estimate this galaxy to have a stellar mass of and an H i column density of cm-2. Using archival polarisation measurements of PKS 040975 from Morganti et al. (1999), we provide an estimate of the magnetic field in the foreground galaxy of G, giving the first estimate of the magnetic field of a normal galaxy at .
Although only a small sample was searched for H i absorption in this work, it provides a pilot study of what could be detected by future large absorption line surveys such as the First Large Absorption Line Survey in H i (Allison et al., 2021), currently being carried out with ASKAP. Having a sufficiently bright background radio source was the primary selection criteria used to define this sample, with no further constraints on the source size or optical properties (with the exception that the H i absorption line would be in the frequency range observable with ASKAP). The result of this broader selection criteria led to the detection of absorption towards the lobe of PKS 040975 as its extended radio structure and large velocity offset from the host galaxy means that it would likely have been excluded from many previous searches for H i absorption.
Acknowledgements
We thank Jesse van der Sande for useful discussions on the optical data analysis presented here and the anonymous referee for helpful suggestions that improved the quality of the paper. Optical observations for this paper were carried out under the Gemini programme GS-2017B-Q-63 and we thank the telescope operators and staff for carrying out these observations. We also thank CSIRO operations and engineering staff who assisted in obtaining the ASKAP-BETA observations. Parts of this research were conducted by the Australian Research Council Centre of Excellence for All-sky Astrophysics in 3D (ASTRO 3D) through project number CE170100013.
The Australian SKA Pathfinder is part of the Australia Telescope National Facility which is managed by CSIRO. Operation of ASKAP is funded by the Australian Government with support from the National Collaborative Research Infrastructure Strategy. ASKAP uses the resources of the Pawsey Supercomputing Centre. Establishment of ASKAP, the Murchison Radio-astronomy Observatory and the Pawsey Supercomputing Centre are initiatives of the Australian Government, with support from the Government of Western Australia and the Science and Industry Endowment Fund. We acknowledge the Wajarri Yamatji people as the traditional owners of the Observatory site.
Data Availability
All data underlying this article will be shared on reasonable request to the corresponding author. The optical data are publicly available for download through the Gemini archive under project code GS-2017B-Q-63 at https://archive.gemini.edu/searchform.
References
- Adams & van Leeuwen (2019) Adams E. A. K., van Leeuwen J., 2019, Nature Astronomy, 3, 188
- Aditya (2019) Aditya J. N., 2019, MNRAS, 482, 5597
- Aditya et al. (2016) Aditya J. N. H. S., Kanekar N., Kurapati S., 2016, MNRAS, 4012, 4000
- Aditya et al. (2021) Aditya J. N. H. S., Jorgenson R., Joshi V., Singh V., An T., Chandola Y., 2021, MNRAS, 500, 998
- Allison (2021) Allison J. R., 2021, MNRAS, 503, 985
- Allison et al. (2012a) Allison J. R., Sadler E. M., Whiting M. T., 2012a, PASA, 29, 221
- Allison et al. (2012b) Allison J. R., et al., 2012b, MNRAS, 423, 2601
- Allison et al. (2015) Allison J. R., et al., 2015, MNRAS, 1267, 1249
- Allison et al. (2020) Allison J. R., et al., 2020, MNRAS, 494, 3627
- Allison et al. (2021) Allison J. R., et al., 2021, arXiv e-prints, p. arXiv:2110.00469
- Astropy Collaboration et al. (2013) Astropy Collaboration et al., 2013, A&A, 558, A33
- Bahcall & Ekers (1969) Bahcall J. N., Ekers R. D., 1969, ApJ, 157, 1055
- Beck (2015) Beck R., 2015, A&ARv, 24, 4
- Beck & Wielebinski (2013) Beck R., Wielebinski R., 2013, Magnetic Fields in Galaxies. Springer Netherlands, Dordrecht, p. 641, doi:10.1007/978-94-007-5612-0_13
- Bekki et al. (2005) Bekki K., Koribalski B. S., Kilborn V. A., 2005, MNRAS, 363, L21
- Bell & de Jong (2001) Bell E. F., de Jong R. S., 2001, ApJ, 550, 212
- Bell et al. (2003) Bell E. F., McIntosh D. H., Katz N., Weinberg M. D., 2003, ApJS, 149, 289
- Bertin & Arnouts (1996) Bertin E., Arnouts S., 1996, A&AS, 117, 393
- Beswick et al. (2002) Beswick R. J., Pedlar A., Holloway A. J., 2002, MNRAS, 329, 620
- Beswick et al. (2004) Beswick R. J., Peck A. B., Taylor G. B., Giovannini G., 2004, MNRAS, 352, 49
- Cappellari (2017) Cappellari M., 2017, MNRAS, 466, 798
- Chandola et al. (2013) Chandola Y., Gupta N., Saikia D. J., 2013, MNRAS, 429, 2380
- Chandola et al. (2020) Chandola Y., Saikia D. J., Li D., 2020, MNRAS, 494, 5161
- Chilingarian et al. (2010) Chilingarian I. V., Melchior A.-L., Zolotukhin I. Y., 2010, MNRAS, 405, 1409
- Ching et al. (2017) Ching J. H. Y., et al., 2017, MNRAS, 464, 1306
- Chowdhury et al. (2020) Chowdhury A., Kanekar N., Chengalur J. N., 2020, ApJ, 900, L30
- Condon (1989) Condon J. J., 1989, ApJ, 338, 13
- Condon et al. (1998) Condon J. J., Cotton W. D., Greisen E. W., Yin Q. F., Perley R. A., Taylor G. B., Broderick J. J., 1998, AJ, 115, 1693
- Condon et al. (2019) Condon J. J., Matthews A. M., Broderick J. J., 2019, ApJ, 872, 148
- Curran et al. (2008) Curran S. J., Whiting M. T., Wiklind T., Webb J. K., Murphy M. T., Purcell C. R., 2008, MNRAS, 391, 765
- Curran et al. (2011) Curran S. J., Whiting M. T., Webb J. K., Athreya R., 2011, MNRAS, 414, L26
- Curran et al. (2012) Curran S. J., Whiting M. T., Tanna A., Sadler E. M., Pracy M. B., Athreya R., 2012, MNRAS, 9, 1
- Curran et al. (2016) Curran S. J., Duchesne S. W., Divoli A., Allison J. R., 2016, MNRAS, 462, 4197
- Darling et al. (2011) Darling J., Macdonald E. P., Haynes M. P., Giovanelli R., 2011, ApJ, 742, 60
- Dasyra & Combes (2012) Dasyra K. M., Combes F., 2012, A&A, 541, L7
- Davis et al. (2014) Davis T. A., et al., 2014, MNRAS, 444, 3427
- Dicken et al. (2008) Dicken D., Tadhunter C., Morganti R., Buchanan C., Oosterloo T., Axon D., 2008, ApJ, 678, 712
- Dicken et al. (2012) Dicken D., et al., 2012, ApJ, 745, 172
- Dickey et al. (2009) Dickey J. M., Strasser S., Gaensler B. M., Haverkorn M., Kavars D., McClure-Griffiths N. M., Stil J., Taylor A. R., 2009, ApJ, 693, 1250
- Dutta et al. (2018) Dutta R., Srianand R., Gupta N., 2018, MNRAS, 480, 947
- Dutta et al. (2019) Dutta R., Srianand R., Gupta N., 2019, MNRAS, 489, 1099
- Dutta et al. (2020) Dutta R., Raghunathan S., Gupta N., Joshi R., 2020, MNRAS, 491, 838
- Emonts (2006) Emonts B. H. C., 2006, PhD thesis, University of Groningen
- Geréb et al. (2015) Geréb K., Maccagni F. M., Morganti R., Oosterloo T. A., 2015, A&A, 575, 44
- Glowacki et al. (2017) Glowacki M., et al., 2017, MNRAS, 467, 2766
- Glowacki et al. (2019) Glowacki M., et al., 2019, MNRAS, 489, 4926
- Gupta & Saikia (2006) Gupta N., Saikia D. J., 2006, MNRAS, 742, 738
- Gupta et al. (2016) Gupta N., et al., 2016, in MeerKAT Science: On the Pathway to the SKA. p. 14 (arXiv:1708.07371)
- Gupta et al. (2017) Gupta Y., et al., 2017, Current Science, 113, 707
- Hale et al. (2021) Hale C. L., et al., 2021, arXiv e-prints, p. arXiv:2109.00956
- He et al. (2013) He C., Ng C. Y., Kaspi V. M., 2013, ApJ, 768, 64
- Herrera-Camus et al. (2020) Herrera-Camus R., et al., 2020, A&A, 635, A47
- Hinton et al. (2016) Hinton S. R., Davis T. M., Lidman C., Glazebrook K., Lewis G. F., 2016, Astronomy and Computing, 15, 61
- Hogg et al. (2004) Hogg D. W., et al., 2004, ApJ, 601, L29
- Holt et al. (2006) Holt J., Tadhunter C., Morganti R., Bellamy M., González Delgado R. M., Tzioumis A., Inskip K. J., 2006, MNRAS, 370, 1633
- Holt et al. (2007) Holt J., Tadhunter C. N., González Delgado R. M., Inskip K. J., Rodriguez Zaurin J., Emonts B. H. C., Morganti R., Wills K. A., 2007, MNRAS, 381, 611
- Hotan et al. (2014) Hotan A. W., et al., 2014, PASA, 31, e041
- Hotan et al. (2021) Hotan A. W., et al., 2021, PASA, 38, 1
- Jonas & MeerKAT Team (2016) Jonas J., MeerKAT Team 2016, in MeerKAT Science: On the Pathway to the SKA. p. 1
- Kanekar et al. (2009a) Kanekar N., Prochaska J. X., Ellison S. L., Chengalur J. N., 2009a, MNRAS, 396, 385
- Kanekar et al. (2009b) Kanekar N., Smette A., Briggs F. H., Chengalur J. N., 2009b, ApJ, 705, L40
- Kanekar et al. (2014) Kanekar N., et al., 2014, MNRAS, 438, 2131
- Kennicutt (1983) Kennicutt R. C. J., 1983, ApJ, 272, 54
- Kennicutt (1998) Kennicutt Robert C. J., 1998, ApJ, 498, 541
- Koribalski (2020) Koribalski B. S., 2020, arXiv e-prints, p. arXiv:2002.07312
- Koribalski et al. (2020) Koribalski B. S., et al., 2020, Ap&SS, 365, 118
- Large et al. (1981) Large M. I., Mills B. Y., Little A. G., Crawford D. F., Sutton J. M., 1981, MNRAS, 194, 693
- Lee-Waddell et al. (2019) Lee-Waddell K., et al., 2019, MNRAS, 487, 5248
- Maccagni et al. (2014) Maccagni F. M., Morganti R., Oosterloo T. A., Mahony E. K., 2014, A&A, 67, 4
- Maccagni et al. (2017) Maccagni F. M., Morganti R., Oosterloo T. A., Geréb K., Maddox N., 2017, A&A, p. 1
- Maddox (2018) Maddox N., 2018, MNRAS, 480, 5203
- Mao et al. (2017) Mao S. A., et al., 2017, Nature Astronomy, 1, 621
- Maraston et al. (2013) Maraston C., et al., 2013, MNRAS, 435, 2764
- Mauch & Sadler (2007) Mauch T., Sadler E. M., 2007, MNRAS, 375, 931
- McConnell et al. (2016) McConnell D., et al., 2016, PASA, 33
- McConnell et al. (2020) McConnell D., et al., 2020, PASA, 37, 1
- McMahon et al. (2013) McMahon R. G., Banerji M., Gonzalez E., Koposov S. E., Bejar V. J., Lodieu N., Rebolo R., VHS Collaboration 2013, The Messenger, 154, 35
- McMahon et al. (2021) McMahon R. G., Banerji M., Gonzalez E., Koposov S. E., Bejar V. J., Lodieu N., Rebolo R., VHS Collaboration 2021, VizieR Online Data Catalog, p. II/367
- Mingo et al. (2014) Mingo B., Hardcastle M. J., Croston J. H., Dicken D., Evans D. A., Morganti R., Tadhunter C., 2014, MNRAS, 440, 269
- Morganti & Oosterloo (2018) Morganti R., Oosterloo T., 2018, A&ARv, 26, 1
- Morganti et al. (1993) Morganti R., Killeen N., Tadhunter C., 1993, MNRAS, 263, 1023
- Morganti et al. (1999) Morganti R., Killeen N., Tadhunter C., Aiudi R., Jones P., Villar-Martin M., 1999, MNRAS, 140, 355
- Morganti et al. (2001) Morganti R., Oosterloo T. A., Tadhunter C. N., van Moorsel G., Killeen N., Wills K. A., 2001, MNRAS, 323, 331
- Morganti et al. (2005) Morganti R., Tadhunter C., Oosterloo T. A., 2005, A&A, 13, 9
- Morganti et al. (2013) Morganti R., Fogasy J., Paragi Z., Oosterloo T., Orienti M., 2013, Science, 341, 1082
- Morganti et al. (2015) Morganti R., Sadler E. M., Curran S., 2015, in Advancing Astrophysics with the Square Kilometre Array (AASKA14). p. 134 (arXiv:1501.01091)
- Morganti et al. (2021) Morganti R., Oosterloo T., Tadhunter C., Bernhard E. P., Oonk J. B. R., 2021, arXiv e-prints, p. arXiv:2109.13516
- Moss et al. (2017) Moss V. A., et al., 2017, MNRAS, 471, 2952
- Murray et al. (2018) Murray C. E., Stanimirović S., Goss W. M., Heiles C., Dickey J. M., Babler B., Kim C.-G., 2018, ApJS, 238, 14
- Murthy et al. (2020) Murthy S., Morganti R., Emonts B., Villar-Martín M., Oosterloo T., Peletier R., 2020, A&A, 643, A74
- Murthy et al. (2021) Murthy S., Morganti R., Oosterloo T., Maccagni F. M., 2021, arXiv e-prints, p. arXiv:2108.08122
- Namumba et al. (2021) Namumba B., et al., 2021, MNRAS, 505, 3795
- Neeleman et al. (2016) Neeleman M., Prochaska J. X., Ribaudo J., Lehner N., Howk J. C., Rafelski M., Kanekar N., 2016, ApJ, 818, 113
- Oosterloo et al. (2009) Oosterloo T., Verheijen M. A. W., van Cappellen W., Bakker L., Heald G., Ivashina M., 2009, in Wide Field Astronomy & Technology for the Square Kilometre Array. p. 70 (arXiv:0912.0093)
- Oosterloo et al. (2019) Oosterloo T., Morganti R., Tadhunter C., Raymond Oonk J. B., Bignall H. E., Tzioumis T., Reynolds C., 2019, A&A, 632, A66
- Perley et al. (2011) Perley R. A., Chandler C. J., Butler B. J., Wrobel J. M., 2011, ApJ, 739, L1
- Pihlström (2001) Pihlström Y., 2001, PhD thesis, Chalmers University of Technology
- Pihlstrom et al. (2003) Pihlstrom Y. M., Conway J. E., Vermeulen R. C., 2003, A&A, 881, 871
- Ramos Almeida et al. (2011) Ramos Almeida C., Tadhunter C. N., Inskip K. J., Morganti R., Holt J., Dicken D., 2011, MNRAS, 410, 1550
- Rao et al. (2017) Rao S. M., Turnshek D. A., Sardane G. M., Monier E. M., 2017, MNRAS, 471, 3428
- Reeves et al. (2016) Reeves S. N., et al., 2016, MNRAS, 457, 2613
- Robitaille (2019) Robitaille T., 2019, APLpy v2.0: The Astronomical Plotting Library in Python, doi:10.5281/zenodo.2567476
- Robitaille & Bressert (2012) Robitaille T., Bressert E., 2012, APLpy: Astronomical Plotting Library in Python (ascl:1208.017)
- Sadler et al. (2020) Sadler E. M., et al., 2020, MNRAS, 499, 4293
- Santoro et al. (2020) Santoro F., Tadhunter C., Baron D., Morganti R., Holt J., 2020, A&A, 644, A54
- Saponara et al. (2018) Saponara J., Koribalski B. S., Benaglia P., Fernández López M., 2018, MNRAS, 473, 3358
- Schlafly & Finkbeiner (2011) Schlafly E. F., Finkbeiner D. P., 2011, ApJ, 737, 103
- Schulz et al. (2018) Schulz R., Morganti R., Nyland K., Paragi Z., Mahony E. K., Oosterloo T., 2018, A&A, 617, 1
- Schulz et al. (2021) Schulz R., Morganti R., Nyland K., Paragi Z., Mahony E. K., Oosterloo T., 2021, A&A, 647, A63
- Serra et al. (2012) Serra P., et al., 2012, MNRAS, 422, 1835
- Seta et al. (2021) Seta A., Rodrigues L. F. S., Federrath C., Hales C. A., 2021, ApJ, 907, 2
- Tadhunter et al. (1993) Tadhunter C. N., Morganti R., di Serego-Alighieri S., Fosbury R. A. E., Danziger I. J., 1993, MNRAS, 263, 999
- Tadhunter et al. (2002) Tadhunter C., Dickson R., Morganti R., Robinson T. G., Wills K., Villar-Martin M., Hughes M., 2002, MNRAS, 330, 977
- Tadhunter et al. (2014) Tadhunter C., Morganti R., Rose M., Oonk J. B. R., Oosterloo T., 2014, Nature, 511, 440
- The Astropy Collaboration et al. (2018) The Astropy Collaboration et al., 2018, AJ, 156, 123
- Tremblay et al. (2016) Tremblay G. R., et al., 2016, Nature, 534, 218
- Tzioumis et al. (2002) Tzioumis A., et al., 2002, A&A, 392, 841
- Vermeulen et al. (2003) Vermeulen R. C., et al., 2003, A&A, 404, 861
- Wall & Peacock (1985) Wall J. V., Peacock J. A., 1985, MNRAS, 216, 173
- Wilson et al. (2011) Wilson W. E., et al., 2011, MNRAS, 416, 832
- di Serego Alighieri et al. (1994) di Serego Alighieri S., Danziger I., Morganti R., Tadhunter C. N., 1994, MNRAS, 269, 998
- van Gorkom et al. (1989) van Gorkom J. H., Knapp G., Ekers R., Ekers D. D., Laing R. A., Polk K. S., 1989, AJ, 97, 708
Appendix A ASKAP-BETA Observations
ASKAP-BETA observations of 16 sources selected from the 2-Jy sample of southern radio galaxies were observed between November 2014 and February 2016. Table 3 details the observation data, schedule block ID number (SBID) and median spectral noise across the full bandwidth for each observation of this sample.
| Source | Date | SBID | t | / | |
|---|---|---|---|---|---|
| (hrs) | mJy/bm/ch | (%) | |||
| Band 1 observations: (711.5 - 1015.5 MHz) | |||||
| PKS 010516 | 2015-sep-11 | 2538 | 4.5 | 43.3 | 0.68 |
| 2015-sep-11 | 2541 | 4.5 | 58.0 | 0.86 | |
| 2015-dec-10 | 3302 | 2.5 | 33.6 | 1.02 | |
| Total | 7.0 | 0.47 | |||
| PKS 011715 | 2015-jun-25 | 1998 | 6.5 | 35.5 | 0.53 |
| 2015-sep-12 | 2546 | 3.0 | 57.5 | 0.72 | |
| 2015-dec-10 | 3302 | 2.5 | 36.3 | 0.47 | |
| Total | 12.0 | 0.31 | |||
| PKS 023519 | 2014-sep-15 | 636 | 3.0 | 28.4 | 0.40 |
| 2015-dec-10 | 3302 | 3.0 | 38.9 | 0.52 | |
| Total | 6.0 | 0.31 | |||
| PKS 025271 | 2014-nov-11 | 1070 | 3.5 | 22.6 | 0.23 |
| 2015-sep-12 | 2546 | 3.0 | 57.3 | 0.61 | |
| 2015-oct-01 | 2675 | 5.0 | 26.0 | 0.28 | |
| 2015-oct-02 | 2680 | 4.0 | 25.9 | 0.28 | |
| 2015-dec-12 | 3317 | 3.0 | 28.7 | 0.31 | |
| 2015-dec-13 | 3321 | 6.0 | 20.2 | 0.22 | |
| Total | 24.5 | 0.11 | |||
| PKS 040975 | 2014-nov-20 | 1143 | 3.5 | 45.6 | 0.10 |
| 2015-may-05 | 1753 | 4.0 | 20.7 | 0.11 | |
| 2015-aug-28 | 2483 | 3.0 | 29.2 | 0.15 | |
| 2015-sep-19 | 2591 | 5.0 | 24.6 | 0.11 | |
| 2015-sep-30 | 2668 | 5.0 | 22.2 | 0.11 | |
| 2015-oct-04 | 2687 | 6.0 | 21.6 | 0.10 | |
| 2016-feb-14 | 3577 | 7.0 | 23.5 | 0.13 | |
| Total | 41.5 | 0.05 | |||
| PKS 113613 | 2014-nov-22 | 1147 | 2.0 | 34.0 | 0.50 |
| 2014-nov-23 | 1150 | 2.0 | 32.5 | 0.48 | |
| 2015-dec-18 | 3394 | 3.0 | 29.8 | 0.49 | |
| 2016-jan-28 | 3469 | 4.0 | 51.2 | 0.80 | |
| 2016-jan-29 | 3470 | 4.0 | 47.8 | 0.81 | |
| 2016-feb-03 | 3500 | 3.0 | 55.8 | 0.87 | |
| Total | 18.0 | 0.25 | |||
| PKS 130609 | 2014-nov-20 | 1143 | 3.5 | 54.9 | 0.60 |
| 2015-jul-11 | 2093 | 3.0 | 50.7 | 0.61 | |
| 2015-oct-03 | 2681 | 4.0 | 26.8 | 0.49 | |
| 2015-dec-10 | 3303 | 3.5 | 33.3 | 0.52 | |
| 2015-dec-19 | 3399 | 3.5 | 30.4 | 0.51 | |
| 2016-jan-28 | 3469 | 7.0 | 51.0 | 0.87 | |
| 2016-jan-29 | 3470 | 5.0 | 42.7 | 0.79 | |
| 2016-jan-30 | 3475 | 6.0 | 42.5 | 0.78 | |
| Total | 35.5 | 0.21 | |||
| PKS 154779 | 2014-nov-14 | 1096 | 3.0 | 23.6 | 0.51 |
| 2016-jan-28 | 3469 | 5.0 | 42.1 | 0.88 | |
| Total | 10.5 | 0.44 | |||
| PKS 160201 | 2015-jul-11 | 2093 | 4 | 43.8 | 0.51 |
| 2015-dec-10 | 3308 | 4 | 29.0 | 0.43 | |
| 2015-dec-19 | 3399 | 3.5 | 30.0 | 0.42 | |
| Total | 11.5 | 0.26 | |||
| PKS 193815 | 2015-jul-14 | 2127 | 3.0 | 32.9 | 0.31 |
| 2015-sep-12 | 2546 | 3.0 | 43.7 | 0.44 | |
| Total | 6.0 | 0.41 | |||
| PKS 213520 | 2016-jan-28 | 3468 | 2.5 | 67.1 | 1.26 |
| 2016-jan-29 | 3472 | 2.0 | 68.7 | 1.31 | |
| 2016-jan-30 | 3480 | 3.0 | 57.4 | 1.11 | |
| Total | 7.5 | 0.69 | |||
| Band 2 observations: (967.5–1271.5 MHz) | |||||
| PKS 002326 | 2015-nov-23 | 3184 | 3.0 | 50.1 | 0.50 |
| PKS 003502 | 2015-nov-24 | 3190 | 4.0 | 94.9 | 1.68 |
| PKS 003944 | 2015-nov-23 | 3185 | 3.0 | 84.8 | 1.68 |
| PKS 115134 | 2015-nov-23 | 3182 | 3.0 | 66.4 | 0.97 |
| PKS 213514 | 2015-nov-23 | 3184 | 3.0 | 52.1 | 3.10 |
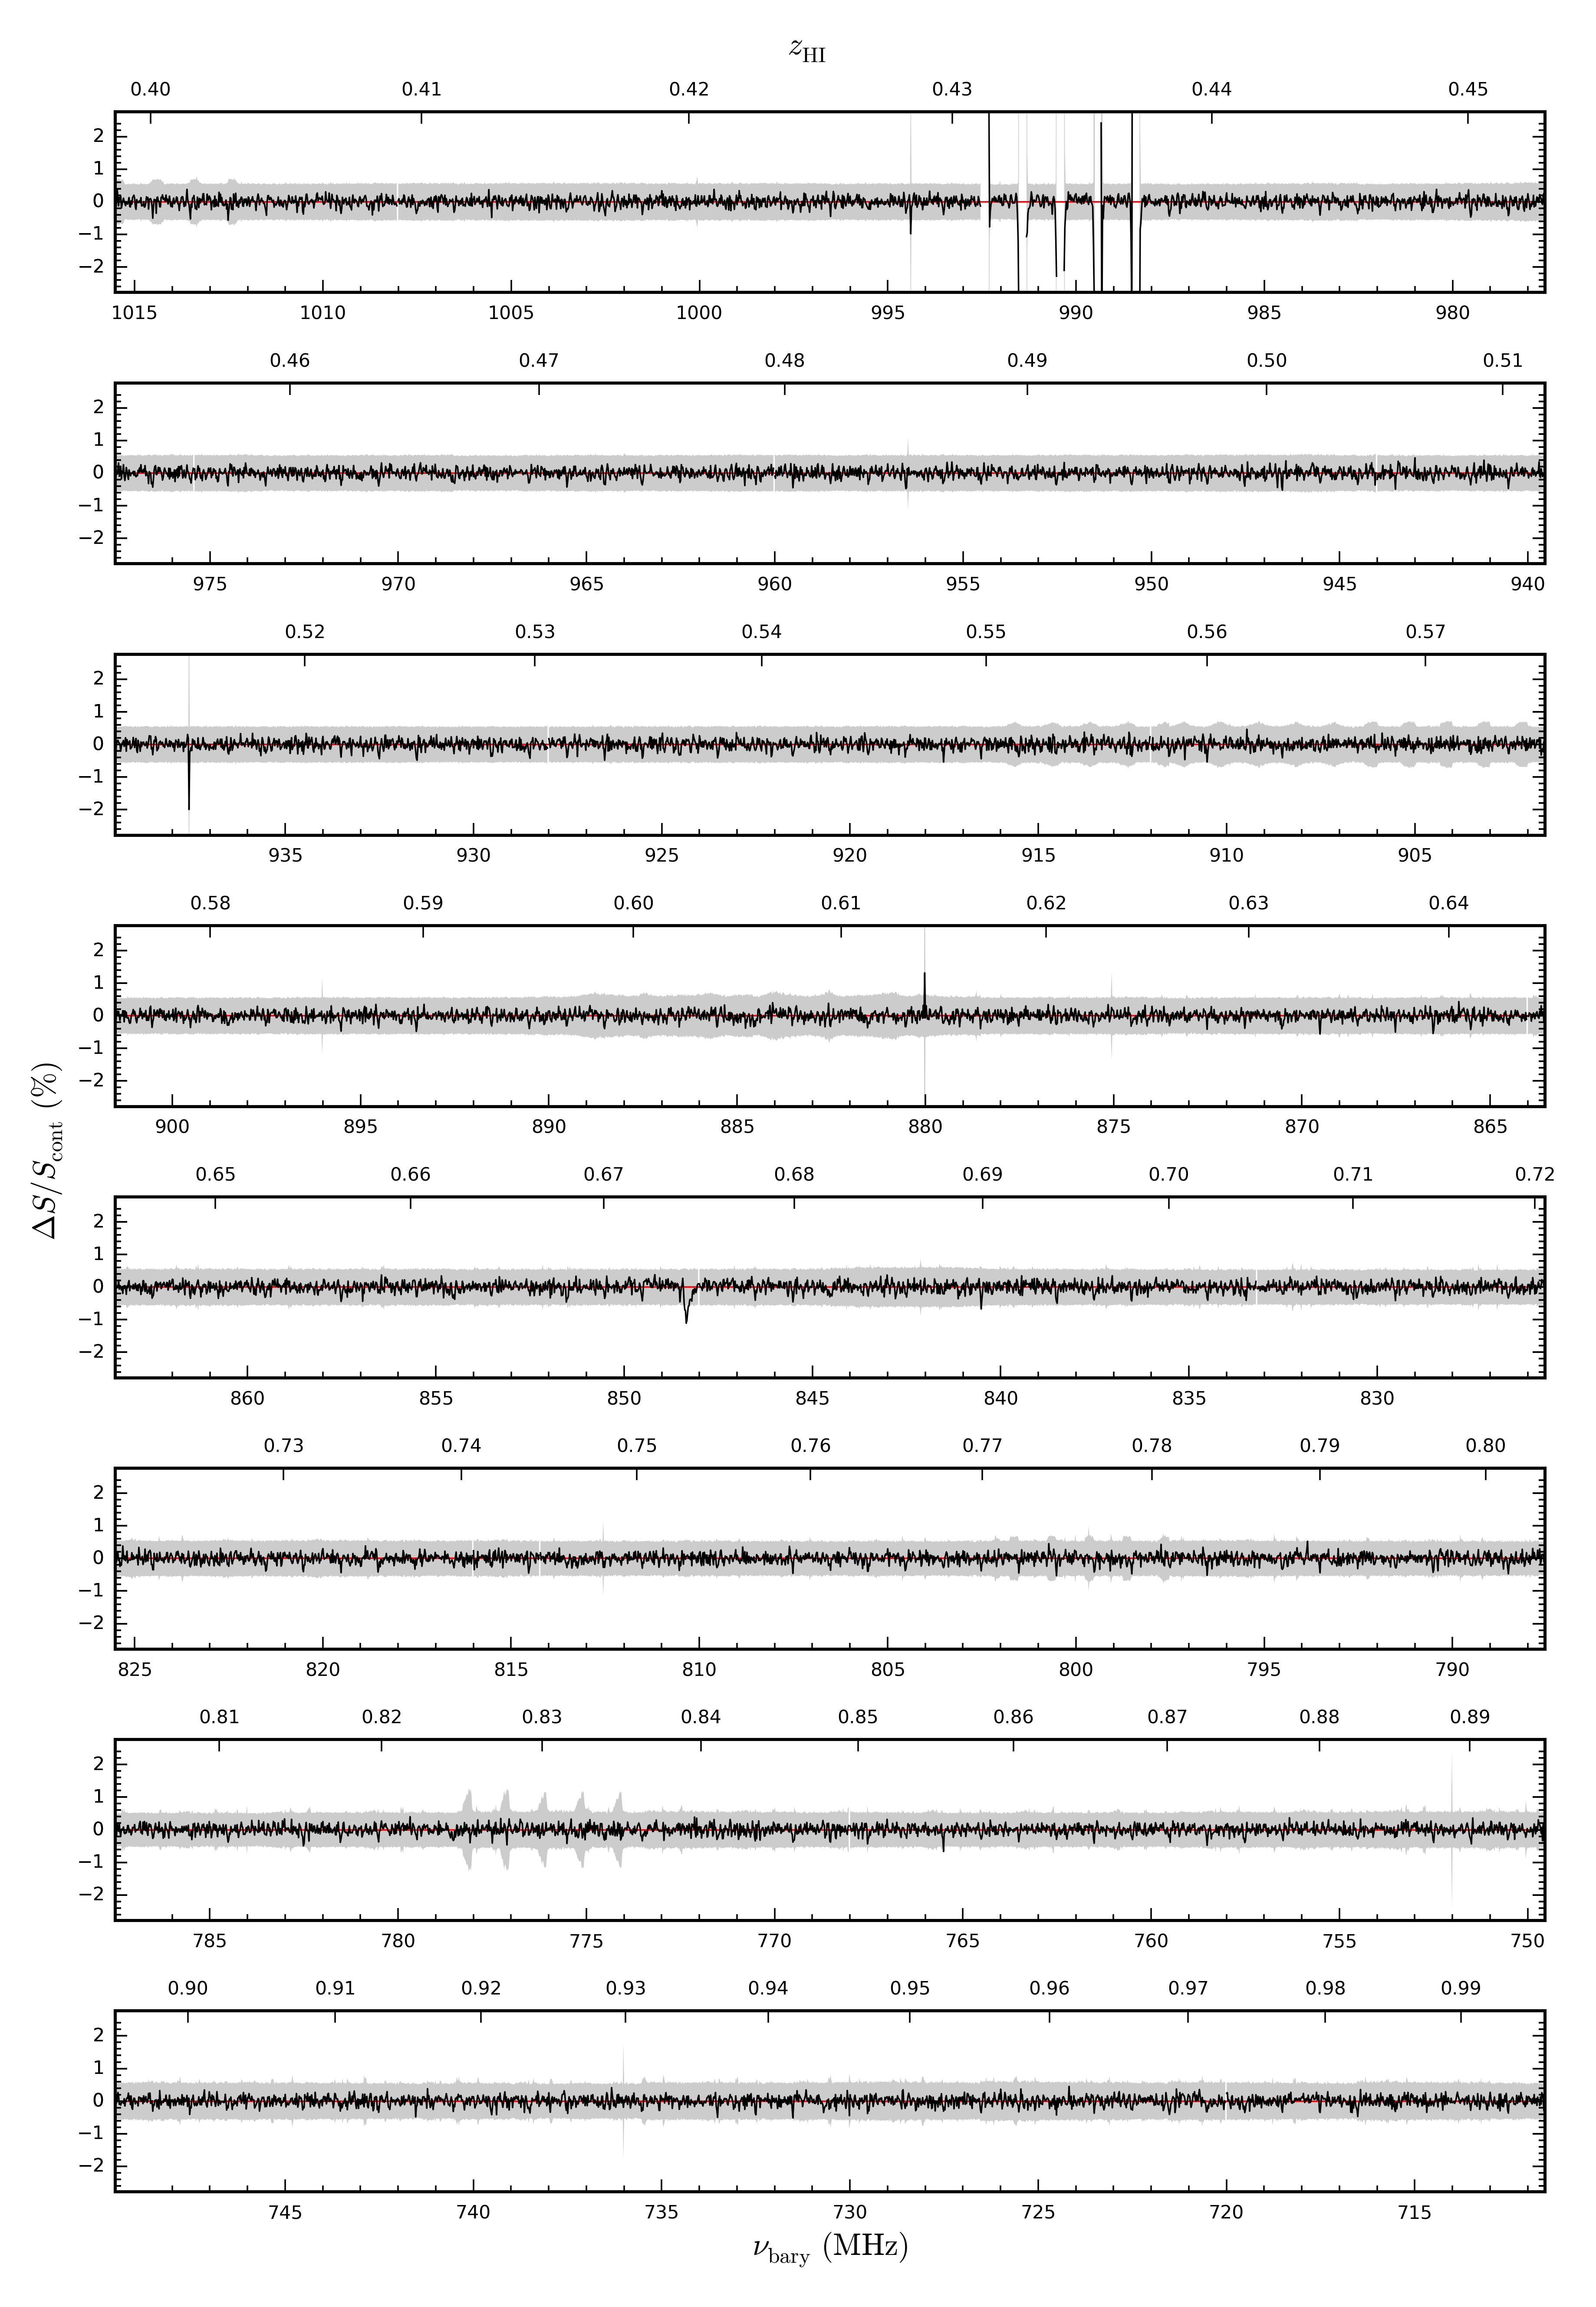
Appendix B ASKAP-BETA spectra
ASKAP-BETA provided a full bandwidth of 304 MHz covering a redshift range of for objects observed at a central frequency of 863.5 MHz. Figure 6 shows an example spectrum obtained from one observation of PKS 0409-75 demonstrating the full bandwidth covered for all observations and the lack of radio frequency interference at these frequencies. The top axis shows the redshift of the 21-cm H i line and the bottom axis shows the frequency shifted into the barycentric reference frame ().