The Ionization and Destruction of Polycyclic Aromatic Hydrocarbons in Powerful Quasars
Abstract
We reanalyze the mid-infrared () Spitzer spectra of 86 low-redshift () Palomar-Green quasars to investigate the nature of polycyclic aromatic hydrocarbon (PAH) emission and its utility as a star formation rate (SFR) indicator for the host galaxies of luminous active galactic nuclei (AGNs). We decompose the spectra with our recently developed template-fitting technique to measure PAH fluxes and upper limits, which we interpret using mock spectra that simulate the effects of AGN dilution. While luminous quasars can severely dilute and affect the detectability of emission lines, PAHs are intrinsically weak in some sources that are otherwise gas-rich and vigorously forming stars, conclusively demonstrating that powerful AGNs destroy PAH molecules. Comparing PAH-based SFRs with independent SFRs derived from the mid-infrared fine-structure neon lines and the total infrared luminosity reveals that PAHs can trace star formation activity in quasars with bolometric luminosities , but increasingly underestimate the SFR for more powerful quasars, typically by dex. Relative to star-forming galaxies and low-luminosity AGNs, quasars have a comparable PAH 11.3 /7.7 ratio but characteristically lower ratios of 6.2 /7.7 , 8.6 /7.7 , and 11.3 /17.0 . We suggest that these trends indicate that powerful AGNs preferentially destroy small grains and enhance the PAH ionization fraction.
1 Introduction
Originating mostly from photodissociation regions around sites where massive stars form, polycyclic aromatic hydrocarbon (PAH) emission has long been regarded as a promising indicator of star formation activity (e.g., Peeters et al. 2004b; Li 2020). Effective empirical star formation rate (SFR) calibrations based on PAH emission find broad application in star-forming galaxies (SFGs) (e.g., Farrah et al. 2007; Pope et al. 2008; Treyer et al. 2010; Diamond-Stanic & Rieke 2012; Shipley et al. 2016; Xie & Ho 2019; Lai et al. 2020; Zhang et al. 2021), although the apparent PAH deficit in dwarf galaxies raise complications in these systems (e.g., Calzetti et al. 2007; Draine et al. 2007; Xie & Ho 2019). PAH emission is also detected in galaxies containing active galactic nuclei (AGNs), both in their integrated mid-infrared (IR) spectra (e.g., Shi et al. 2006, 2014; Hao et al. 2007; O’Dowd et al. 2009; LaMassa et al. 2012; Stierwalt et al. 2014) and from spatially resolved spectra of the central regions of nearby galaxies (e.g., Mazzarella et al. 1994; Imanishi et al. 1998; Howell et al. 2007; Smith et al. 2007; Diamond-Stanic & Rieke 2010; Gallimore et al. 2010; onzález-Martín et al. 2013, 2015; Sales et al. 2013; Alonso-Herrero et al. 2014, 2016, 2020; Ruschel-Dutra et al. 2014; Espara-Arredondo et al. 2018). The prevalence of PAH emission in AGNs raises the hope that it can serve as a tool to probe star formation in active galaxies, so long as their harsh environments do not strongly affect the PAH carriers (Voit 1991, 1992). The possibility that the PAH molecules can be excited by photons from the AGN itself presents a further complication (Jensen et al. 2017).
The PAH spectra of AGNs differ from those of SFGs in several aspects. AGNs generally exhibit PAH features of lower equivalent width, most notably in the 6.2 and 7.7 bands, a characteristic widely used as a mid-IR diagnostic to identify the dominant energy source in a galaxy (e.g., Genzel et al. 1998; Lutz et al. 1998; Spoon et al. 2007). Compared to SFGs, AGNs also present lower ratios of the 6.2, 7.7, and 8.6 features relative to the 11.3 feature, to an extent that is difficult to explain in the context of dust models for star-forming regions (e.g., Smith et al. 2007; O’Dowd et al. 2009; Diamond-Stanic & Rieke 2010; Wu et al. 2010). Smith et al. (2007) also note that the PAH / ratio inversely correlates with the strength of the AGN radiation field, suggesting that the hard radiation from the AGN affects the small, ionized PAH molecules that give rise to the 6–9 emission. The large, neutral molecules radiating at 11.3 tend to be more robust against AGNs. If so, PAH 11.3 may be regarded as a reliable SFR indicator for AGN host galaxies (Diamond-Stanic & Rieke 2010, 2012; Alonso-Herrero et al. 2014). Yet, controversy remains. LaMassa et al. (2012) report that strong AGNs show significantly weaker PAH 11.3 emission and suggest that the carriers of this feature are destroyed. Esparza-Arredondo et al. (2018) reach a similar conclusion in their analysis of the PAH 11.3 profile in the central few hundred parsecs of nearby active galaxies. Additional evidence that AGNs may destroy PAHs comes from modeling the IR spectral energy distribution (SED) of luminous quasars, which indicate a mild depression of the overall PAH content with increasing quasar luminosity (Shangguan et al. 2018).
Apart from the destruction of PAHs, what additional factors might contribute to the apparent reduction of PAH strength in AGN environments? The equivalent widths of the PAH features can be reduced if the mid-IR spectrum is significantly diluted by the featureless continuum from hot dust emission from the AGN torus. Although this possibility has been raised frequently (e.g., Aitken & Roche 1985; Roche et al. 1991; Genzel et al. 1998; Sturm et al. 2000; Sales et al. 2010; LaMassa et al. 2012; Shi et al. 2014; Xie et al. 2017), to date it has yet to be investigated thoroughly. Of course, PAH emission may be weak simply because of the dearth of interstellar medium, or because star formation is inefficient nothwithstanding the availability of gas. The goal of this study is to break these degeneracies using a sample of bright, nearby quasars whose host galaxy interstellar medium has been well characterized (Shangguan et al. 2018, 2020a, 2020b; Molina et al. 2021) and whose star formation properties can be independently ascertained (Xie et al. 2021) with a SFR indicator suitable for AGNs (Zhuang et al. 2019). This work is based on a detailed re-analysis of the mid-IR spectra originally published by Shi et al. (2014).
Section 2 presents the sample, data, and mid-IR spectral measurements. We investigate the continuum dilution effect in Section 3 and compare different SFRs in Section 4. Section 5 discusses the implications of our results, with a summary of the main conclusions given in Section 6. This work adopts the following cosmological parameters: , , and km s-1 Mpc-1 (Ade et al. 2016). All SFRs reference the stellar initial mass function of Salpeter (1955).
2 Sample, Data, and Measurements
We study the 87 low-redshift () optical/UV-selected quasars from the Palomar-Green (PG) survey (Schmidt & Green 1983), as summarized in Boroson & Green (1992). Being bright and nearby, this sample has been studied extensively in previous works and has accumulated a vast amount of ancillary observations and physical parameters. As summarized in Shangguan et al. (2018), these include black hole (BH) mass (), bolometric luminosity (), Eddington ratio (, with the Eddington luminosity), and cold gas content inferred from robust total dust masses. Stellar masses () are available for the majority of the objects from high-resolution optical and near-IR photometry (Zhang et al. 2016; Zhao et al. 2021), and for the rest they can be estimated from the empirical relation, which for relatively massive, early-type galaxies has an intrinsic scatter of 0.65 dex (Greene et al. 2020).
The primary objective of this study is to obtain accurate measurements of the PAH emission for the PG quasars, placing special emphasis on understanding the nature of the sources for which the PAH features are either weak or undetected. The low-redshift PG quasars have complete low-resolution mid-IR () spectra acquired by Shi et al. (2014) using the Spitzer Infrared Spectrograph (IRS; Werner et al. 2004)111PG 0003+199 only has a low-resolution spectrum covering . We adopt a high-resolution spectrum available over and degrade it to lower resolution to measure the PAH emission (Shangguan et al. 2018).. The low-resolution mode of IRS has both short and long slits to span a different wavelength range (Houck et al. 2004). The slit size of the short-low mode is and , covering, respectively, and . The long-low mode covers with aperture size and with aperture size . In each segment, the spectral resolution varies from to 128. We adopt the aperture-corrected IRS spectra from Shi et al. (2014), who scaled the short-low spectra to match the long-low data. All the spectra are then scaled to match the MIPS 24 photometry to attain a global measurement. The resultant flux density of the final spectrum is consistent with the WISE (Wright et al. 2010) W3 and W4 bands (see Appendix A in Shangguan et al. 2018). We exclude the radio-loud quasar PG 1226023 (3C 273), whose synchrotron-emitting jet can bias the measurements significantly (Shangguan et al. 2018). Our final sample therefore contains 86 quasars with low-resolution spectra (Table 1).
We measure the PAH strength using the low-resolution spectra and the methodology of Xie et al. (2018a), which we briefly summarize here. After masking the ionic emission lines that are not blended seriously with the main PAH features, we fit the spectra with a four-component model consisting of a theoretical PAH template plus a dust continuum represented by three modified blackbodies of different temperatures. None of the PG quasars suffers from noticeable mid-IR extinction. Instead, most objects show prominent silicate emission around 9.7 and 18 , whose peak position shifts toward longer wavelengths (see also Shi et al. 2014), which are modeled with a warm silicate component (Section 4.4 in Xie et al. 2018a). Assuming optically thin conditions in the mid-IR, the silicate emission can be represented by the product of the mass absorption coefficient () and the Planck function (), where is a free parameter in the fit. The exact curvature of depends on the grain size, shape, and chemical composition of silicate dust. Considering grain sizes from 0.1 to 10 and six different chemical species, Xie et al. (2017) find that spherical “astronomical silicate” grains of size 1.5 can describe the width and peak position of the silicate emission in most PG quasars; a few favor micron-sized pyroxene and amorphous olivine. We adopt the best-fit grain size and chemical composition parameters for silicate dust and calculate following Xie et al. (2017). Section 5 further elaborates on the uncertainty of modeling silicate emission. The final model has nine free parameters. We constrain the global best fit with the Levenberg-Marquardt -minimization algorithm MPFIT (Markwardt 2009). We subtract the best-fit continuum and silicate emission from the observed IRS spectrum to derive the PAH spectrum. We use the integrated PAH strength within to calculate the SFR, since this spectral range includes all PAH features and associated continuum within the short-low spectrum and is less sensitive to the ionization and size distribution of the carriers of the individual PAH bands. For completeness, we also measure several key individual PAH features (6.2, 7.7, 8.6, 11.3, and 17.0 ) using the Drude profile and parameters given in Table 1 of Draine & Li (2007). To estimate the uncertainty of the PAH strength, we use the bootstrap method to sample the spectra multiple times and repeat the fit. The median value of 100 realizations and their corresponding standard deviation give the final PAH flux and its error. The measurement is regarded as an upper limit if the PAH flux is less than . As all the host galaxies have (Table 1), we adopt the PAH-based SFR calibration of Xie & Ho (2019) for massive galaxies, which has a scatter of 0.2 dex. Expressing the integrated PAH luminosity () in units of erg s-1,
| (1) |
To evaluate the reliability of using PAH emission to estimate SFRs in the context of luminous AGNs, it is crucial that we have access to independent SFR indicators already known to be trustworthy. To this end, we utilize a subset of 38 PG quasars that also has useful high-resolution IRS observations, which permit us to derive SFRs based on the fine-structure lines of [Ne II] 12.81 and [Ne III] 15.56 according to the method of Ho & Keto (2007), as extended to AGNs by Zhuang et al. (2019). The measurement of the neon lines and their conversion to SFRNe for the PG quasars are described in Xie et al. (2021). The high-resolution spectra taken with the short-high mode () were acquired with an aperture of width , which, while narrow, fortunately is comparable to that of the short-low spectra. This enables us to adopt the aperture flux correction factors derived for the low-resolution spectra from Shi et al. (2014). The majority (90%) of the sources have flux correction factors , comparable to the measurement error of the neon flux. We further extend the dynamic range of the SFR comparison using the torus-subtracted total () IR luminosity, which is available for the entire PG quasars.222Shi et al. (2014) calculated the SFR from the 160 luminosity for the PG sample. Compared with that work, the SED coverage of our study has been expanded significantly from to . Moreover, Shangguan et al. (2018) decompose the broadband SED into separate components to account for the starlight, the dusty torus, and the large-scale cool interstellar medium of the host (see Section 3). Using the total IR luminosity for the host galaxy, Xie et al. (2021) demonstrate that SFRIR is consistent with SFRNe within a scatter of 0.4 dex for quasars with bolometric luminosities .
3 Dilution of PAH Features by the AGN


Quasars exhibit a wide diversity of mid-IR spectra, ranging from those with strong PAH emission that closely resemble SFGs, such as PG 1351236, to continuum-dominated objects that are essentially devoid of line emission, such as PG 0804761. Figure 1a shows five examples, ordered according to PAH strength. We conduct a simple experiment to explore the possibility that the reduction of PAH equivalent width in AGNs is caused by the continuum dilution from the dusty torus (e.g., Sturm et al. 2000). This allows us to ascertain quantitatively the effect of continuum dilution and to interpret properly the upper limits of objects with weak or undetected PAH emission. We simulate spectra covering to mimic the IRS observations. To generate the mock spectra of active galaxies, we first assume that the signal consists of three components: (1) dust emission from the AGN torus; (2) interstellar dust emission from the host galaxy, and (3) stellar emission from host galaxy starlight. We assume that the three components are unresolved and do not consider their spatial distribution. This assumption is valid because the vast majority of the host galaxies of the PG quasars are unresolved within the IRS slit. Last but not least, we suppose that the three components are distinct from each other and that we do not need to consider radiation transfer. The composite spectrum is then constructed by linear combinations of the three components. In practice, we do not consider host galaxy starlight because in the present sample it contributes to the total mid-IR power on a global scale, indicating that evolved stars do not contribute significantly in the spectral range of interest. Indeed, the torus emission outshines the starlight at (Shangguan et al. 2018; Zhuang et al. 2018). Moreover, our mock simulations adopt the empirical template of an SFG (NGC 3351; see below) to represent the host galaxy, whose spectrum already includes the proper proportion of starlight. Our assumption would not apply to the lower luminosity AGNs, such as those that reside in elliptical galaxies whose old stellar population radiates significantly at (e.g., Smith et al. 2007; Rampazzo et al. 2013), but this is not the regime that concerns us here. We neglect the line emission contribution from the gas, either from the narrow-line region of the AGN or from the host galaxy, since the isolated narrow lines are removed prior to measuring the PAH emission (Section 2). The lines that blend with PAH ([Ne II] 12.81 and (1) 17.03 ) only contribute 2% to the total PAH luminosity, which is less than the measurement error for the latter (20%).
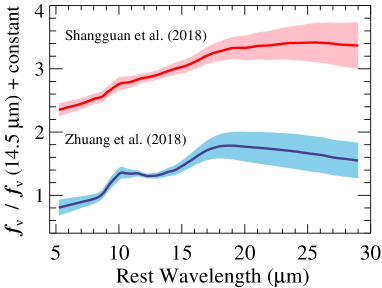
For the AGN continuum, we adopt the median spectrum of the best-fit torus model for the full sample of PG quasars from Shangguan et al. (2018), which is based on the detailed decomposition of the SED into a stellar component, a galaxy-scale cool dust component, and a torus component consisting of warm dust calculated from the CLUMPY model of Nenkova et al. (2008a, 2008b), supplemented by an additional blackbody component with K to account for the hot dust radiation in the near-IR (see Section 4.1 of Shangguan et al. 2018). We also consider the CAT3D wind torus model of Hönig & Kishimoto (2017), which Zhuang et al. (2018) used to analyze the PG sample following the methodology of Shangguan et al. (2018). Compared to CLUMPY, CAT3D does a better job at fitting the silicate emission profile at 9.7 and 18 , and it can account for the near-IR emission without having to introduce an ad hoc hot dust component. The two torus models are illustrated in Figure 2. We use the observed mid-IR spectrum of NGC 3351 (Figure 1b, bottom), a typical SFG from the SIRTF Nearby Galaxy Survey (SINGS; Kennicutt et al. 2003), to represent the interstellar dust emission of the host galaxy. The average signal-to-noise ratio333For flux density at wavelength with uncertainty , S/N = . of the IRS spectrum of NGC 3351 is . Xie et al. (2018a; their Figure 14) find that the PAH spectrum varies little among massive SFGs. The dispersion of the average PAH spectrum of SFGs is less than the PAH measurement uncertainty ( 20%). Thus, adopting a different SFG template will not affect our main conclusions.
The final mock spectra are constructed by summing the host galaxy component [] with various fractions () of the torus component [], with }, after normalizing the torus component to have the same integrated flux as the host at . Defined based on the integrated flux, is largely insensitive to possible variations in individual PAH band ratios among SFGs. We simulate 40 mock spectra with discrete values of to 100, which encompass the observed range for the PG sample. The error budget of the mock spectrum consists of
| (2) |
where represents the systematic errors from instrumental effects (e.g., readout noise, bias subtraction, and dark current) and data reduction, and and account for the photon noise associated with the host galaxy and torus component, respectively. The first two terms in Equation 2 are included already in the observed spectrum of NGC 3351, while the last term can be estimated from the quadrature sum of the Poisson noise from the torus emission and the variance of the torus template (delineated by the red and blue shaded regions in Figure 2):
| (3) |
Figure 1b shows five reprentative mock spectra for . The spectrum with is the observed spectrum of the SFG NGC 3351.
We apply the fitting procedure described in Section 2 to the mock spectra. Given the known PAH flux of the input spectrum of NGC 3351, we measure the output PAH flux of the mock spectra and calculate the quantity
| (4) |
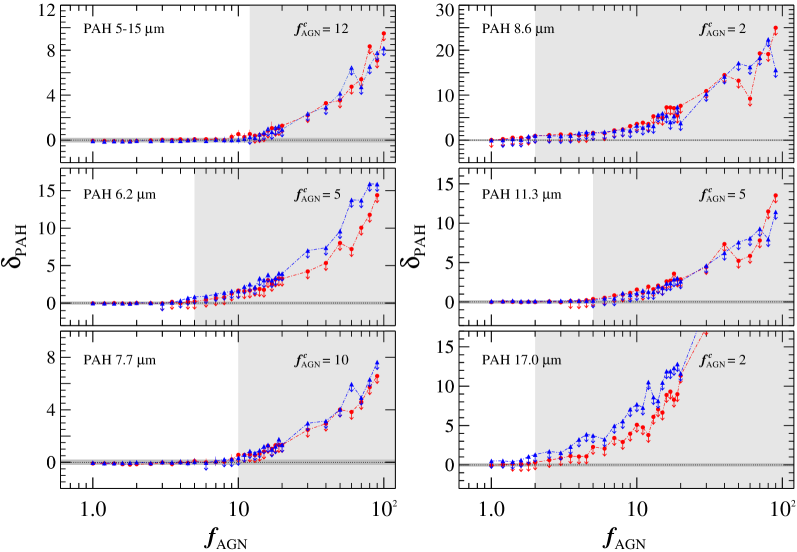
to evaluate the degree to which the input PAH strength can be recovered. Figure 3 illustrates the dependence of on for the two choices of torus templates; the separate panels correspond to the total PAH flux, as well as the flux of the individual PAH bands at 6.2, 7.7, 8.6, 11.3, and 17.0 . As expected, the mock spectra return robust PAH fluxes () for low values of , but as increases the output PAH fluxes gradually turn to upper limits that are overestimated systematically for large . We consider the deviation unacceptable when , which is comparable to the typical PAH flux uncertainty. The critical AGN fraction above which this threshold is reached is for PAH 5–15 , for PAH 6.2 , for PAH 7.7 , for PAH 8.6 , for PAH 11.3 , and for PAH 17.0 . PAH upper limits for sources with are reliable, but those for are not because the torus dilution is too severe.
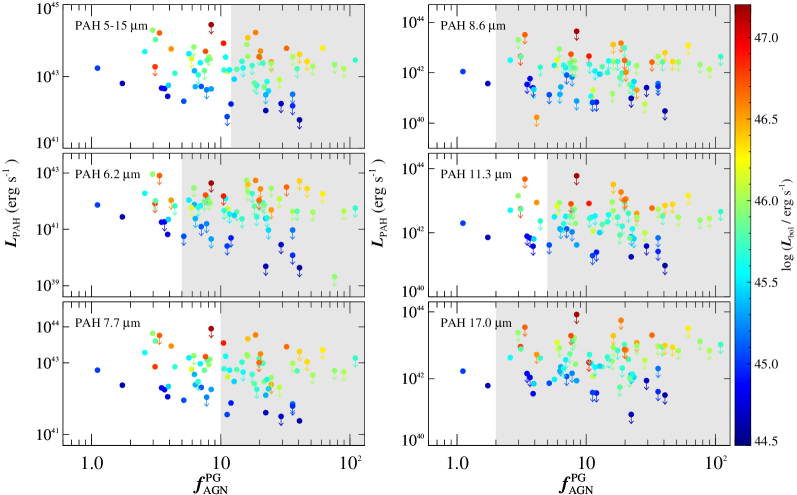
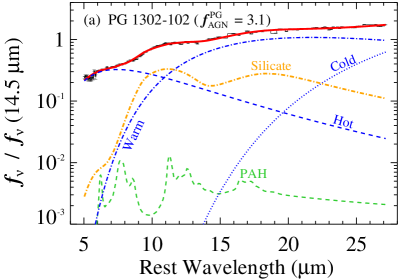
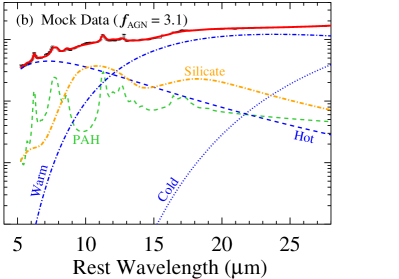
Figure 4 shows the distribution of PAH measurements as a function of the AGN fraction for the PG quasars, as derived by Shangguan et al. (2018)444The torus templates of Zhuang et al. (2018) yield consistent results. from decomposing the 1–500 SED, which consists of photometry from 13 broad bands (2MASS, WISE, Herschel PACS, and SPIRE) plus low-resolution 5–40 spectroscopic data (Spitzer IRS). The AGN fraction is defined as the ratio of the luminosity of the best-fit torus template to the luminosity of the best-fit host galaxy template, integrated over . Shangguan et al. (2018) modeled the host galaxy component of the PG quasars with the theoretical dust emission template of Draine & Li (2007), which accurately describes the IR SEDs of SINGS SFGs (including NGC 3351, Draine et al. 2007). Two points of note. First, PAH emission is detected in a handful of sources with because the AGN fraction can be highly uncertain in some hosts that have little to no cold dust emission (e.g., PG 1114445). Second, the existence of upper limits in sources with implies that these limits are significant. That is, in these sources PAH emission could have been detected, but it was not. Their PAH strengths are therefore intrinsically weak. We showcase an example in Figure 5. The observed spectrum of PG 1302102 (Figure 5a) is devoid of obvious PAH features, and a formal decomposition of the spectrum yields a PAH component that is orders of magnitude weaker than the continuum. However, with = 3.1 (Table 1), according to our mock simulations a quasar with this level of moderate AGN dilution clearly exhibits visible PAH features (Figure 5b) that should have been easily detected, if present. We stress that our conclusion that PAH can be intrinsically weak or absent in some PG quasars—one of the principal results of this study—critically depends on the assumption that measured from the data well approximates used in the mock simulations (Figure 3). We believe that this is the case, given that both quantities are defined exactly in the same manner, and the close resemblance between the real and mock spectra (Figure 1).
4 Results
4.1 The Reliability of PAH-based SFRs
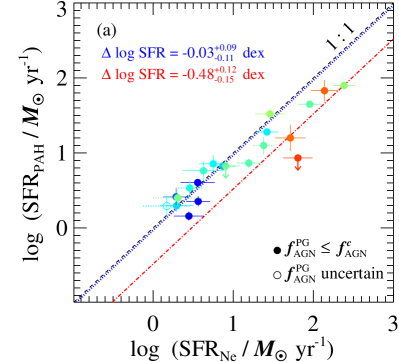
With robust PAH measurements in hand, we can formally compare PAH-based SFRs (Equation 1) with independently estimated SFRs derived from the mid-IR [Ne II]+[Ne III] lines, as calibrated by Zhuang et al. (2019). Figure 6a shows that SFRPAH tracks SFRNe on a one-to-one relation for , but that SFRPAH systematically underpredicts the true value at higher levels of star formation activity. Since SFR correlates with (e.g., Shangguan et al. 2020a; Zhuang et al. 2021), the PAH deficit in the high-SFR regime also corresponds to quasars of higher luminosity ( erg s-1). Using survival analysis to account for the SFRPAH upper limits and the range of SFRNe permitted by the incomplete detection of the neon lines in some objects (see Xie et al. 2021)555We perform survival analysis using the Weibullfitter package in lifelines.readthedocs.io/en/latest (Davidson-Pilon et al. 2020)., the median (16%, 84%) of the difference dex for , consistent with the dex scatter of the neon (Zhuang et al. 2019) and PAH (Xie & Ho 2019) SFR calibrations. For , dex, although this value is poorly constrained because of the small number of objects in this regime.
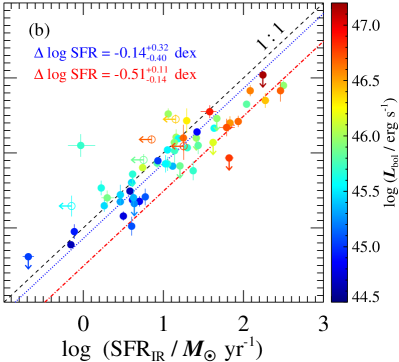
Figure 6b extends the analysis using SFRs obtained using the torus-subtracted, total IR () luminosity. As with SFRNe, SFRPAH statistically follows SFRIR with no significant offset for quasars having low to moderate SFRs, which typically correspond to AGN bolometric luminosities of , but for more powerful systems the PAH-based technique systematically underestimates the true SFR. Accounting for upper limits, dex for , and dex for . The logrank_test666lifelines.readthedocs.io/en/latest/lifelines.statistics.html#lifelines.statistics.StatisticalResult shows that differs significantly between the two regimes, with .
4.2 Mean PAH Spectrum and PAH Band Ratios in Quasar Host Galaxies
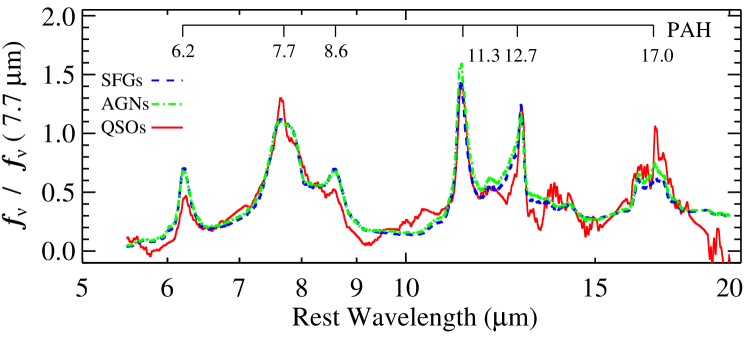
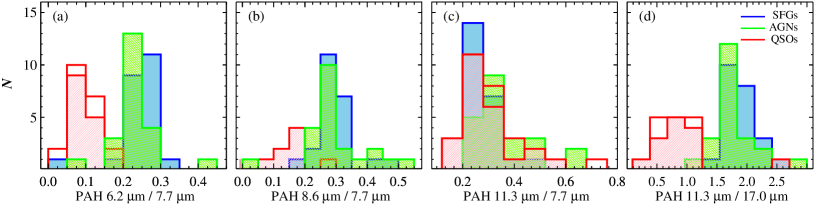
We use the best-fit PAH spectra derived in Section 2 to construct a mean PAH spectrum for the PG quasar sample (Figure 7). After subtracting the underlying continuum and silicate emission, each individual spectrum is scaled by the mean flux density in the spectral range prior to computing the error-weighted mean spectrum. We choose to normalize the spectra at 7.7 in order to highlight potential differences between quasars and other classes of objects in the PAH / and PAH / ratios, which are sensitive to PAH size distribution and ionization state (Section 5). For comparison, Figure 7 overplots the mean PAH spectrum of the 22 H II regions from SFGs and the nuclear regions of 23 low-luminosity AGNs acquired from SINGS. The IRS spectra of the SINGS sources have sufficient signal-to-noise ratio and were analyzed by Xie et al. (2018a) with the same technique as that used for the quasars. It is immediately apparent that, relative to the comparison sources, quasar host galaxies show markedly weaker 6.2 and 8.6 features, and to a lesser extent the same applies to the 11.3 feature. This is quantified in Figure 8, which compares the PAH flux ratio distributions of different galaxy types. The median and dispersion of PAH 6.2 /7.7 (Figure 8a) of H II regions and low-luminosity AGNs are indistinguishable ( and , respectively). By contrast, quasar hosts have a median (16%, 84%) of . According to the logrank_test, quasars differ from SFGs and AGNs with . Similarly, quasars exhibit a lower median (16%, 84%) PAH 8.6 /7.7 ratio of relative to H II regions and low-luminosity AGNs, which have equal values of (Figure 8b). The logrank_test yields , suggesting different distributions. Quasars also differ significantly from the comparison groups in terms of PAH 11.3 /17.0 (Figure 8d), having a median ratio of that is substantially lower than that of SFGs () and low-luminosity AGNs (), at a significance level of . By contrast, quasars show a median PAH 11.3 /7.7 ratio () comparable (Figure 8c; ) to those of SFGs () and low-luminosity AGNs ().
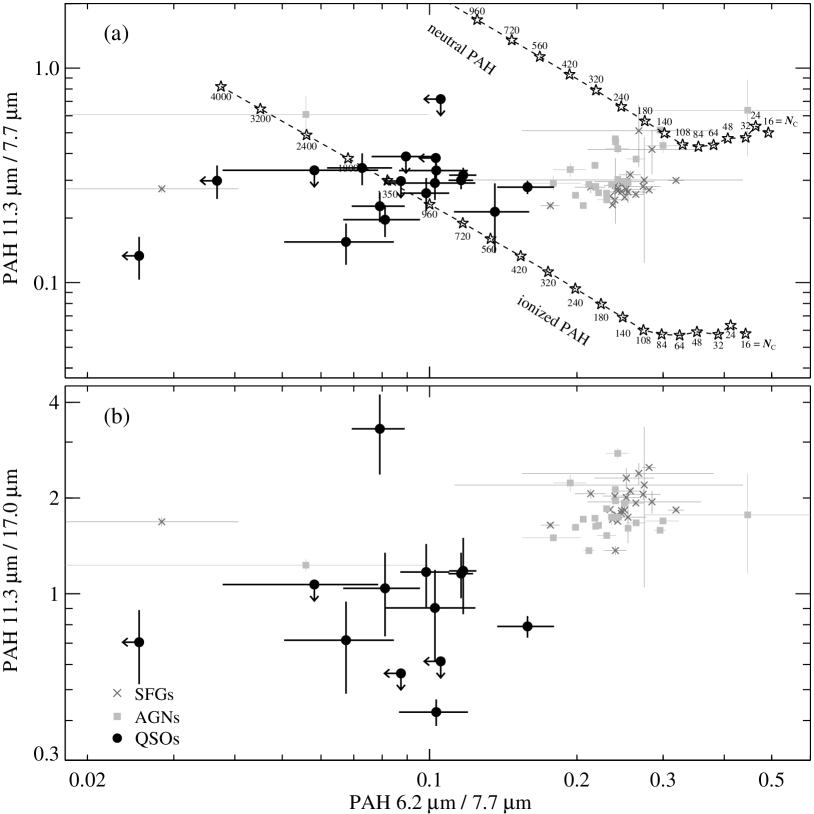
The relative strengths of the PAH bands reflect the size distribution and ionization of interstellar dust grains. Figure 9a compares the flux ratios of PAH 11.3 /7.7 and PAH 6.2 /7.7 with theoretical predictions from Draine & Li (2001). We adopt their model results for neutral and ionized PAHs of varying grain size exposed to heating intensity strength of 1.23 and 123 times that of the interstellar radiation field of Mathis et al. (1983). We note that the diagnostic plot of Draine & Li (2001) is based on PAH strengths that are measured in a manner that closely resembles the PAHFIT methodology of Smith et al. (2007). The method employed for our study, however, yields PAH band measurements that are consistent with those derived from PAHFIT (Xie et al. 2018a), and therefore no systematic bias is introduced. Relative to our comparison sample of SFGs and low-luminosity AGNs, it is immediately apparent that quasars distinguish themselves by their much lower PAH 6.2 /7.7 ratios while PAH 11.3 /7.7 remains virtually the same, a trend that can be interpreted to mean that quasar hosts have characteristically larger, more ionized grains. The grain population in quasar hosts contains carbon atoms or more (some sources formally extend beyond the model grid, which stops at ). SFGs and weak AGNs can be described by and lie intermediate between the model sequences for neutral and ionized grains. This interpretation is reinforced further by Figure 9b. As with PAH 6.2 /7.7 , the PAH 11.3 /17.0 ratio also traces grain size (e.g., Van Kerckhoven et al. 2000), and together they support the notion that quasars are deficient in small grains.
5 Discussion
The degree to which AGNs manifest PAH emission and the main physical reason behind its apparent suppression have long been subjects of investigation. Early ground-based spectroscopy of small samples of AGNs noted that their spectra are dominated by a featureless continuum (e.g., Kleinmann et al. 1976; Aitken et al. 1981; Cutri et al. 1981; Roche et al. 1984; Aitken & Roche 1985). In their comprehensive mid-IR atlas of 60 nearby galaxies, Roche et al. (1991) found that objects with active nuclei rarely exhibit narrow emission bands—later recognized as PAHs (Hudgins & Allamandola 1999)—in contrast with H II region nuclei, in which these narrow emission bands are pervasive. Voit (1991) suggested that X-ray heating by AGNs efficiently evaporates the tiny grains () responsible for the PAH emissions into the gas phase. Unless shielded by dark clouds, PAH molecules of in the host galaxy can be completely destroyed by the harsh radiation of the AGN (Voit 1992). Photo-destruction from X-rays has also been invoked to account for the absence of PAHs in protoplanetary disks (Siebenmorgen & Krgel 2010). With the advent of ISO and especially Spitzer, the vast improvement in the quantity and quality of mid-IR spectra has led to widespread investigations of PAH emission in galaxies and renewed interest in the physical nature of PAHs in AGN environments. Many studies report that in AGNs PAH emission at systematically drops relative to emission features at longer wavelengths (e.g., Smith et al. 2007; Diamond-Stanic & Rieke 2010; Sales et al. 2010). The PAH 11.3 feature seems more robust against the influence of the AGN and appears to be a promising SFR indicator. However, debate has persisted over the relative importance of intrinsic destruction of PAHs compared to their mere apparent weakness due to continuum dilution (e.g., Genzel et al. 1998; Lutz et al. 1998; Clavel et al. 2000; Sturm et al. 2000; Smith et al. 2007; LaMassa et al. 2012; Alonso-Herrero et al. 2014). Another explanation for the PAH deficit in AGNs is that active galaxies may simply be gas-poor, as might be expected if energy feedback from the active nucleus effectively expels the interstellar medium. Or, perhaps they have abundant gas but stars somehow form inefficiently.
The analysis presented in this study for the PG quasars, in conjunction with recent studies of their gas and star formation properties, sheds considerable light on the nature of PAH emission in AGNs. The weakness of PAH emission cannot be attributed to the lack of interstellar medium or star formation. The PG quasars possess a gas content largely commensurate with that of SFGs of similar stellar mass (Shangguan et al. 2018, 2020a), and the gas forms stars with efficiency at least as high as that of galaxies on the star-forming main sequence (Shangguan et al. 2020b; Xie et al. 2021). In fact, such conditions appear to be generic to other samples of AGNs accreting at moderately high mass accretion rates (e.g., Xia et al. 2014; Xu et al. 2015; Husemann et al. 2017; Kakkad et al. 2017; Stanley et al. 2017; Shangguan & Ho 2019; Jarvis et al. 2020; Kirkpatrick et al. 2020; Yesuf & Ho 2020; Zhuang & Ho 2020). Instead, we find compelling evidence that quasars genuinely do destroy and modify the grain population responsible for PAH emission (see Section 5.1 and 5.2).
5.1 PAH Destruction in Quasar Host Galaxies
Our analysis of mock spectra (Figure 1b) rigorously quantifies the impact of continuum dilution on the detectability of PAH emission in quasars under conditions that closely mimic those encountered in the host galaxies of the PG sample. Our mock spectra adopt an observationally motivated template for the underlying host galaxy light, as well as the most up-to-date median spectral templates for the AGN torus emission obtained from the PG quasars themselves (Shangguan et al. 2018; Zhuang et al. 2018; Figure 2). This then allows us to establish an empirical threshold on the critical AGN-to-host flux ratio () below which PAH measurements can be considered trustworthy. The value of varies from feature to feature (Figure 3), with for the total PAH emission integrated over , the measure used by Xie & Ho (2019) to derive SFRs.
Figure 4 reveals a critical finding: although PAH emission could have been detected for all sources with , nevertheless there are several sources for which PAH was not detected. As these PAH upper limits are robust, they are highly significant in guiding our interpretation. There are nine quasars with upper limits in PAH (). One object (PG 2304+042) has a relatively high AGN fraction ( = 11.2), and therefore its PAH content may be intrinsically low; it happens to be gas-poor (), and it has very little star formation (SFRIR = ). The other eight sources, however, have , (Shangguan et al. 2018), and , with a median value of . They should have strong, detectable PAH emission, but they do not. Figure 5 highlights the particular case of PG 1302102. Normal SFGs with already display prominent PAH emission (e.g., Smith et al. 2007; Xie & Ho 2019). PAH emission should have been detected easily in these quasars, but they are not. We therefore conclude that the PAH carriers must have been destroyed in these systems. Moreover, the availability of independent SFR estimates for the entire sample permits us to generalize this result (Figure 6b). In host galaxies with low to moderate SFRs (), which roughly correspond to quasars with , SFRPAH is suppressed relative to SFRIR by 0.14 dex, which may be regarded as statistically insignificant in view of the 0.4 dex uncertainty of SFRIR (Xie et al. 2021), but for or , PAH systematically underestimates the true SFR by dex. The effect could be even more severe for quasars with luminosities higher than those probed by the relatively local PG sample. These results are consistent with Shangguan et al. (2018; see their Section 5.2), who, based on modeling the global IR SED, report that PG quasars tend to present lower PAH mass fraction than SFGs, and that the reduction in PAH mass fraction may increase toward more luminous quasars.
Does the destruction of PAHs among the most powerful quasars originate from the hard radiation field of the AGN itself, or perhaps from the extreme conditions of violent star formation in the host galaxy? After all, powerful quasars coexist with powerful starbursts (Xie et al. 2021), and the star formation appears to be centrally concentrated (Zhuang & Ho 2020; Molina et al. 2021). We suggest that the AGN plays a more dominant role. Among massive, starburst-dominated ultraluminous IR galaxies, whose SFRs can reach or more, the extinction-corrected PAH-based SFRs faithfully follow the independent SFRs derived from the mid-IR fine-structure neon lines (Xie & Ho 2019). In these systems, there is no hint that the intense star formation affects the integrated PAH strength on galactic scales. Thus, we conclude that the hard photons from BH accretion are the main culprit for reducing the PAH emission in quasars. Figure 10 examines the relation between and the quasar bolometric luminosity () and Eddington ratio (). Although shows a very mild inverse trend with and , the correlation is statistically insignificant777We regard correlations with as statistically significant. The correlation analysis is performed using the IDL procedure linmix (Kelly 2007), which can consider upper limits for the dependent variable.. A larger sample covering a broader dynamic range in quasar properties is needed for future study.
In their comprehensive study of the PG quasar sample, Shi et al. (2014) concluded that SFRs from PAH 11.3 are consistent with those derived from the total IR luminosity, which the authors estimate from matching a star-forming template to the observed photometry at 160 . While we agree that SFRs for quasars can be estimated from PAH emission, we find that PAH-based SFRs may be systematically underestimated for . Our analysis differs in two respects compared to that of Shi et al. (2014). First, we rigorously address the important point of why certain objects have apparently weak PAH emission, clearly distinguishing between those whose PAH features are intrinsically weak from those that are merely diluted by the AGN. And second, instead of focusing on any individual PAH feature, we prefer to use the PAH emission integrated over because the total emission is less sensitive to band-to-band variations.

5.2 PAH Ionization and Grain Size Distribution
The ionization and size distribution of the grain population determine the relative strength of the different PAH bands. Upon absorption of a single photon, the radiation emitted by small PAH grains peaks at shorter wavelength than that of large grains because smaller grains acquire a higher temperature (e.g., Allamandola et al. 1989; Draine & Li 2001, 2007). Models attribute the 6.2 and 7.7 bands to the C-C stretching mode of ionized PAHs, while the PAH 11.3 band mainly arises from the C-H out-of-plane bending mode of neutral grains (e.g., Léger & Puget 1984; Allamandola et al. 1985; DeFrees et al. 1993; Draine & Li 2001; Hudgins & Allamandola 2004; Tielens 2008). Given that the 6.2 and 7.7 bands originate from the same vibrational mode of ionized grains, the PAH 6.2 /7.7 ratio is sensitive to the grain size distribution. The PAH 11.3 /7.7 ratio traces the ionization fraction, in addition to the grain size.
Quasar hosts have systematically lower PAH 6.2 /7.7 ratios than SFGs and low-luminosity AGNs. The median PAH 6.2 /7.7 of suggests large PAH molecules of size (Section 4.2). A similar, albeit less extreme, conclusion was reached by Sales et al. (2010), who studied low-redshift Seyferts with 12 luminosity (Rush et al. 1993). The 6.2 /7.7 ratios of found in their sample are consistent with relatively large PAH grains of . Our results provide a sharp contrast to previous studies that treated mainly lower-luminosity AGNs. For example, the very nearby Seyferts selected by Diamond-Stanic & Rieke (2010) from the Revised Shapley-Ames catalog (Sandage & Tammann 1987) have PAH ratios of 6.2, 7.7, and 8.6 that are indistinguishable from those of nuclear and off-nuclear H II regions. O’Dowd et al. (2009) studied low-redshift AGNs and AGN+H II composites and concluded that their PAH 6.2 /7.7 ratios broadly agree with those of SFGs. The same holds for the work of Wu et al. (2010). Our present emphasis on powerful quasars best elucidates the destructive effects of AGNs on small PAH molecules (Voit 1992).
Unlike PAH 6.2 /7.7 , the distribution of the PAH 11.3 /7.7 ratio of quasars closely resembles that of SFGs. By comparison, previous studies that focused on weaker sources generally stressed that PAH 11.3 /7.7 is elevated in AGNs888The previous literature conventionally uses the ratio PAH 7.7 /11.3 , but in this study we adopt its inverse for ease of comparison with models (e.g., Figure 9a), and we quote the literature results accordingly. (e.g., Smith et al. 2007; O’Dowd et al. 2009; Diamond-Stanic & Rieke 2010; Wu et al. 2010; García-Bernete et al. 2021). Multiple hypotheses have been advanced to account for the higher PAH 11.3 /7.7 ratio in active galaxies. For instance, the overall distribution of grain sizes may be depleted in small grains by the harsh radiation field of the AGN (e.g., Smith et al. 2007; O’Dowd et al. 2009; Wu et al. 2010). Alternatively, the grain distribution may be selectively enhanced in large grains if grain growth is promoted in the rich media associated with the AGN torus (Diamond-Stanic & Rieke 2010). Another possibility is that the enhanced electron density in the nuclear region may result in a proportionate drop in PAH ionization fraction, leading to a boost of the 11.3 feature relative to the features at shorter wavelength (e.g., O’Dowd et al. 2009). Diamond-Stanic & Rieke (2010) even postulated that AGN-driven shocks can produce more solo C-H groups, which would elevate the 11.3 feature. On the other hand, upon extending the luminosity range of the sample of O’Dowd et al. (2009) to include more powerful AGNs, LaMassa et al. (2012) reached the opposite conclusion, that AGNs actually present lower PAH 11.3 /7.7 ratios and reduced 11.3 equivalent widths. They argued that AGNs destroy even the neutral PAHs responsible for the 11.3 feature. Apart from sample selection effects, LaMassa et al. (2012) also attributed their different conclusions in part to differences in spatial coverage compared to previous studies999LaMassa et al. (2012) did not analyze the PAH 6.2 /7.7 ratio.. Sales et al. (2010) similarly used the 11.3 /7.7 ratio to suggest that PAH molecules are more ionized in luminous AGN hosts.
Our study, which extends the luminosity range even further with the addition of the PG quasars, offers a fresh perspective on this long-standing problem. For a given grain size specified by the 6.2 /7.7 ratio, the 11.3 /7.7 ratio of quasars is located far below the model predictions for neutral PAHs. The PAH ratios of quasar hosts occupy the branch of large (), ionized grains (Figure 9a). Solely destroying small grains cannot explain the distribution of points for the quasars on this line-ratio diagnostic diagram, as it would increase 11.3 /7.7 while reducing 6.2 /7.7 . Modifying the C-H/C-C ratio would not work either because this process does not affect the 6.2 /7.7 ratio (Diamond-Stanic & Rieke 2010). We argue that both small grain destruction and ionization fraction enhancement are needed. The ionization fraction depends on the balance between the photoionization rate and the electron capture rate of ionized PAHs. The exact form scales with , where is a dimensionless intensity parameter describing the energy density of the radiation field heating the dust, denotes PAH grain size, is the electron density, and is the electron kinetic temperature (Draine et al. 2021). Draine (2011) shows that for a given size distribution increasing the ionization fraction from 0 to 1 lowers the 11.3 /7.7 ratio by a factor of 6. Similarly, Galliano et al. (2008; their Figure 18b) find that 11.3 /7.7 is 8 times lower for galaxies whose ionization fraction is an order of magnitude higher. At the median value of 6.2 /7.7 (or grain size) observed in quasars, the median value of 11.3 /7.7 is about 10 times lower than that of neutral PAHs. Taken at face value, the 11.3 /7.7 ratios observed in quasars indicate that the ionization fraction (or ) is about an order of magnitude higher compared to neutral PAHs. This scenario is possible if quasars participate in the heating of PAHs and in regulating their ionization fraction. If so, H atoms might be peeled off from the benzene ring, which would lower C-H/C-C and further reduce the 11.3 /7.7 ratio. This process may be viable, in light of the lower PAH 8.6 /7.7 ratios observed in quasars (Figure 8b), as the 8.6 band arises mainly from the C-H in-plane bending modes of neutral PAHs. More data are needed to test this scenario, given the limited PAH 8.6 measurements currently available.
The systematically low values of PAH 11.3 /17.0 in quasars provide further corroborating evidence that powerful AGNs deplete small grains. On the basis of the observed suppressed PAH 11.3 /17.0 ratios in strong AGNs, LaMassa et al. (2012) also suggested that the PAH carrier of the 11.3 feature is depleted. Although the chemical carrier of PAH 17.0 is still uncertain (e.g., Boersma et al. 2010), it has been proposed that this feature originates from large () PAH molecules (e.g., van Kerckhoven et al. 2000; Smith et al. 2007; Draine et al. 2021) that arise from the in-plane or out-of-plane bending mode of a C-C-C skeleton structure (van Kerckhoven et al. 2000; Peeters et al. 2004a). The strength of PAH 17.0 is sensitive to the ionization parameter : increasing from to lowers the PAH 17.0 strength by a factor of (Draine et al. 2021, their Figure 19). When , larger PAH molecules cannot cool completely between single photon absorption events, gradually increasing their temperature so that they radiate at shorter wavelength bands. This effect elevates PAH 11.3 /17.0 . Two factors can produce a low value of PAH 11.3 /17.0 : a predominance of larger grains or a low . The second option seems highly unlikely. First, of the host galaxies of PG quasars are actively forming stars (Xie et al. 2021), and thus their value of cannot be lower than that of typical SFGs, let alone that of local low-luminosity AGNs, which have even lower levels of star formation activity (e.g., Ho et al. 2003; Ho 2008; Ellison et al. 2016). And second, the dust that accounts for the continuum in quasars has a temperature of K (Xie et al. 2017), approximately twice as hot as in SFGs or low-luminosity AGNs ( K; Xie et al. 2018b). Given that the dust temperature scales as (e.g., Draine & Li 2007), a factor of 2 increase in results in times greater heating in quasars. Hence, it is highly unlikely that quasar host galaxies have lower than SFGs or low-luminosity AGNs. Instead, the systematically lower PAH 11.3 /17.0 ratios in quasars most likely reflect a deficit of smaller grains.
The distinctive PAH properties of luminous AGNs suggest that the BH accretion influences the size distribution, ionization fraction, and chemistry of PAHs. In Figure 11, we look for possible trends between the PAH 6.2 /7.7 , 11.3 /7.7 , and PAH 11.3 /17.0 ratios with the quasar bolometric luminosity, Eddington ratio, and [Ne V] 14.32 /[Ne II] 12.81 . As PG quasars are luminous AGNs, we adopt [Ne V]/[Ne II] instead of the more commonly used [Ne III]/[Ne II] to represent the hardness of the AGN radiation field to mitigate contamination from star formation (Ho & Keto 2007). None of the trends is statistically significant, except for the inverse correlations between PAH 11.3 /7.7 and (, ) and between PAH 11.3 /17.0 and (, ), which support the notion that more powerful quasars have more ionized PAH molecules and larger size distribution. Future work should extend the dynamic range of the AGN parameters and substantially expand the sample size.

5.3 Potential Sources of Systematic Uncertainty
Prominent silicate emission features around 9.7 and 18 are detected in 53 out of the 86 PG quasars, and their PAH strength is inevitably sensitive to the subtraction of the silicate component, especially for PAH 11.3 and 17.0 , which located near the peak of silicate features. For the 53 objects with silicate emission, we test the effect of our fitting method on the final PAH measurements; the mid-IR spectrum of the rest is dominated by dust continuum emission, and their PAH strength is barely affected by the silicate fitting process. To calculate the absorption coefficient, we consider grain sizes distributed from 0.1 to 10 and six different chemical compositions of silicate dust. For a fixed grain size, different silicate dust peaks at a similar wavelength but differs in width and shape (e.g., Figure 4b in Xie et al. 2014). Amorphous olivine and pyroxene deviate from the silicate profile of most objects by showing a unique profile (e.g., Figure 3 in Xie et al. 2017). Once we identify the best-matching chemical composition, we fix it and then adjust the grain size. We find that in most cases, when the grain size is smaller than 0.8 or larger than 2 , the best fit predicts a bluer or redder silicate peak than observed. We, therefore, set the limits of the grain size distribution to these values and then derive the PAH strength following the method in Section 2. Since only 13/53 sources have ( of PAH 7.7 ) and 3 have ( of PAH 6.2 and 11.3 ), most of the PAH strengths are upper limits affected by AGN dilution. Studying the range of PAH strengths produced by our experiments involving different choices of silicate emission models, and taking into account upper limits using survival analysis, we find that the median (16%, 84%) of PAH 6.2 /7.7 and PAH 8.6 /7.7 are hardly affected by the details of the silicate fitting process. The reason is that PAH 6.2, 7.7, and 8.6 are located relatively far from the 9.7 silicate emission feature. PAH 11.3 and 17.0 can be more strongly affected by silicate emission, at 9.7 and 18 , respectively. However, we have verified that none of our statistical results on differences between the PG quasars and SFGs and low-luminosity AGNs is changed by the modeling details of silicate emission. The conclusions of the SFR, which is based on the integrated PAH 5–15 emission, are similarly unaffected.
We close with a comment on the possible influence of aperture effects on our conclusions, echoing a concern raised by Smith et al. (2007) and LaMassa et al. (2012). As the PG quasars are relatively distant (median , which corresponds to Mpc), the IRS short-low (long-low) slit aperture size of (107) encompasses a physical scale of (36) kpc. The IRS spectra, therefore, are essentially globally averaged spectra, including not only the active nucleus but all the star-forming regions in the host galaxy. While the similarity of the PAH 11.3 /7.7 ratio of quasars to that of SFGs might suggest that the PAH emission is dominated by the large-scale contribution from the host galaxy, we note that within the same aperture, we simultaneously detecte depressed PAH 6.2 /7.7 , 8.6 /7.7 , and 11.3 /17.0 ratios, from which we conclude that, despite the large aperture, the PAH 11.3 /7.7 ratio is sensitive to conditions affected by the AGN.
6 Summary
PAH emission serves as a useful indicator of star formation activity and a diagnostic of the physical conditions of the interstellar medium in galaxies. However, their applicability to the host galaxies of AGNs is controversial in view of the ability of PAH molecules to survive the harsh radiation field of an active nucleus. The situation in AGNs powerful enough to qualify as quasars is especially poorly understood. We investigate the nature of PAH emission and its feasibility as a SFR predictor by analyzing the Spitzer IRS spectra of 86 low-redshift () PG quasars. We apply the template-fitting method of Xie et al. (2018a) to decompose the PAH spectrum from the underlying continuum and silicate emission, which enables us to measure the flux of or place rigorous upper limits on the integrated () PAH flux, as well as the individual bands at 6.2, 7.7, 8.6, 11.3, and 17.0 . To elucidate the origin of the weak PAH emission often observed in quasars, we generate mock spectra to mimic the effect of line dilution by the hot dust continuum of the torus, using realistic torus templates generated from broadband fits of the SEDs of the PG quasars themselves. These simulations allow us to establish the maximum critical threshold of AGN-to-host flux ratio below which reliable measurements of PAH emission can be made. The principal conclusions of this study are:
-
•
The torus does prevent PAH emission from being detected when the AGN continuum substantially outshines the host galaxy cold dust component. However, given the observed AGN-to-host flux ratios of the PG sample, PAH emission is absent in some objects where it could have been detected, indicating that PAH emission can be intrinsically weak, even in host galaxies known to possess substantial interstellar medium and ongoing star formation. The harsh environment around powerful AGNs evidently destroys PAH molecules.
-
•
Using SFRs independently measured from the mid-IR fine-structure neon lines and the total IR luminosity, we demonstrate that PAH emission can probe , as typically found in quasars with , but the systematically suppressed PAH emission in quasars with leads to SFRs that are underestimated by dex.
-
•
On galactic scales, quasar host galaxies present lower 6.2 /7.7 , 8.6 /7.7 , and 11.3 /17.0 but comparable 11.3 /7.7 compared to star-forming galaxies and low-luminosity AGNs. These trends are consistent with model predictions for larger and more ionized PAH molecules, suggesting that powerful AGNs preferentially destroy small grains and enhance the ionization fraction of the dust.
| Object | log | log | log | log | log | log | log | log | log | log | log | log | |||
|---|---|---|---|---|---|---|---|---|---|---|---|---|---|---|---|
| (Mpc) | () | (erg s-1) | () | (erg s-1) | (erg s-1) | (erg s-1) | (erg s-1) | (erg s-1) | (erg s-1) | () | () | () | |||
| (1) | (2) | (3) | (4) | (5) | (6) | (7) | (8) | (9) | (10) | (11) | (12) | (13) | (14) | (15) | (16) |
| PG 0003158 | 0.450 | 2572 | 9.45 | 46.99 | 11.83∗ | ||||||||||
| PG 0003199 | 0.025 | 113 | 7.52 | 45.17 | 10.38∗ | 36.0 | |||||||||
| PG 0007106 | 0.089 | 420 | 8.87 | 45.79 | 11.03 | 13.3 | |||||||||
| PG 0026129 | 0.142 | 693 | 8.12 | 46.07 | 11.07 | 28.4 | |||||||||
| PG 0043039 | 0.384 | 2133 | 9.28 | 46.51 | 11.13 | ||||||||||
| PG 0049171 | 0.064 | 297 | 8.45 | 44.97 | 11.07∗ | 36.0 | |||||||||
| PG 0050124 | 0.061 | 282 | 7.57 | 45.76 | 11.31 | 19.8 | [0.19, 0.92] | ||||||||
| PG 0052251 | 0.155 | 763 | 8.99 | 46.00 | 11.24 | 16.2 | |||||||||
| PG 0157001 | 0.164 | 811 | 8.31 | 45.95 | 11.72 | 3.0 | |||||||||
| PG 0804761 | 0.100 | 475 | 8.55 | 46.03 | 10.83 | 36.0 | [0.76, 1.25] | ||||||||
| PG 0838770 | 0.131 | 635 | 8.29 | 45.70 | 11.33 | 4.4 | |||||||||
| PG 0844349 | 0.064 | 297 | 8.03 | 45.46 | 10.88 | 23.4 | |||||||||
| PG 0921525 | 0.035 | 159 | 7.45 | 44.60 | 10.32∗ | 40.7 | |||||||||
| PG 0923201 | 0.190 | 955 | 9.33 | 46.01 | 11.28 | 51.6 | [0.62, 1.25] | ||||||||
| PG 0923129 | 0.029 | 131 | 7.52 | 44.83 | 10.38∗ | 3.7 | |||||||||
| PG 0934013 | 0.050 | 229 | 7.15 | 44.85 | 10.10∗ | 3.5 | |||||||||
| PG 0947396 | 0.206 | 1045 | 8.81 | 45.78 | 10.92 | 39.0 | |||||||||
| PG 0953414 | 0.239 | 1235 | 8.74 | 46.35 | 11.35 | 46.6 |
Note. — Col. (1): Object name. Col. (2): Redshift. Col. (3): Luminosity distance. Col. (4): Mass of the BH, from Shangguan et al. (2018). Col. (5): Bolometric luminosity of the AGN, from Shangguan et al. (2018). Col. (6): Stellar mass of the quasar host galaxy, from Zhang et al. (2016) or derived from the relation of Greene et al. (2020; marked with an asterisk). Col. (7): AGN fraction. Col. (8): PAH luminosity at 6.2 m. Col. (9): PAH luminosity at 7.7 m. Col. (10): PAH luminosity at 8.6 m. Col. (11): PAH luminosity at 11.3 m. Col. (12): PAH luminosity at 17.0 m. Col. (13): PAH luminosity within 5–15 m. Col. (14): SFR derived from the PAH luminosity within 5–15 m. Col. (15): SFR derived from the neon line luminosity. Col. (16): SFR derived from the total IR luminosity. (Table 1 is published in its entirety in machine-readable format. A portion is shown here for guidance regarding its form and content.)
References
- (1)
- Ade et al. (2016) Ade, P. A. R., Aghanim, N., Arnaud, M., et al. 2016, A&A, 594, A13
- Aitken & Roche (1985) Aitken, D. K., & Roche, P. F. 1985, MNRAS, 213, 777
- Aitken et al. (1981) Aitken, D. K., Roche, P. F., & Phillips, M. M. 1981, MNRAS, 196, 101P
- Allamandola et al. (1985) Allamandola, L. J., Tielens, A. G. G. M., & Barker, J. R. 1985, ApJ, 290, L25
- Allamandola et al. (1989) Allamandola, L. J., Tielens, A. G. G. M., & Barker, J. R. 1989, ApJS, 71, 733
- Alonso-Herrero et al. (2016) Alonso-Herrero, A., Esquej, P., Roche, P. F., et al. 2016, MNRAS, 455, 563
- Alonso-Herrero et al. (2020) Alonso-Herrero, A., Pereira-Santaella, M., Rigopoulou, D., et al. 2020, A&A, 639, A43
- Alonso-Herrero et al. (2014) Alonso-Herrero, A., Ramos Almeida, C., Esquej, P., et al. 2014, MNRAS, 443, 2766
- Boersma et al. (2010) Boersma, C., Bauschlicher, C. W., Allamandola, L. J., et al. 2010, A&A, 511, A32
- Boroson & Green (1992) Boroson, T. A., & Green, R. F. 1992, ApJS, 80, 109
- Clavel et al. (2000) Clavel, J., Schulz, B., Altieri, B., et al. 2000, A&A, 357, 839
- Cutri et al. (1981) Cutri, R. M., Aitken, D. K., Jones, B., et al. 1981, ApJ, 245, 818
- Davidson-Pilon et al. (2020) Davidson-Pilon, C., Kalderstam, J., Jacobson, N., et al. 2020, Zenodo
- DeFrees et al. (1993) DeFrees, D. J., Miller, M. D., Talbi, D., et al. 1993, ApJ, 408, 530
- Diamond-Stanic, & Rieke (2010) Diamond-Stanic, A. M., & Rieke, G. H. 2010, ApJ, 724, 140
- Diamond-Stanic & Rieke (2012) Diamond-Stanic, A. M., & Rieke, G. H. 2012, ApJ, 746, 168
- Draine et al. (2007) Draine, B. T., Dale, D. A., Bendo, G., et al. 2007, ApJ, 663, 866
- Draine & Li (2001) Draine, B. T., & Li, A. 2001, ApJ, 551, 807
- Draine & Li (2007) Draine, B. T., & Li, A. 2007, ApJ, 657, 810
- Draine et al. (2021) Draine, B. T., Li, A., Hensley, B. S., et al. 2021, ApJ, 917, 3
- Ellison et al. (2016) Ellison, S. L., Teimoorinia, H., Rosario, D. J., et al. 2016, MNRAS, 458, L34
- Esparza-Arredondo et al. (2018) Esparza-Arredondo, D., González-Martín, O., Dultzin, D., et al. 2018, ApJ, 859, 124
- Farrah et al. (2007) Farrah, D., Bernard-Salas, J., Spoon, H. W. W., et al. 2007, ApJ, 667, 149
- Galliano et al. (2008) Galliano, F., Madden, S. C., Tielens, A. G. G. M., et al. 2008, ApJ, 679, 310
- Gallimore et al. (2010) Gallimore, J. F., Yzaguirre, A., Jakoboski, J., et al. 2010, ApJS, 187, 172
- García-Bernete et al. (2021) García-Bernete, I., Rigopoulou, D., Alonso-Herrero, A., et al. 2021, MNRAS, in press (arXiv:2011.10882)
- Genzel et al. (1998) Genzel, R., Lutz, D., Sturm, E., et al. 1998, ApJ, 498, 579
- González-Martín et al. (2015) González-Martín, O., Masegosa, J., Márquez, I., et al. 2015, A&A, 578, A74
- González-Martín et al. (2013) González-Martín, O., Rodríguez-Espinosa, J. M., Díaz-Santos, T., et al. 2013, A&A, 553, A35
- Greene et al. (2020) Greene, J. E., Strader, J., & Ho, L. C. 2020, ARA&A, 58, 257
- Hao et al. (2007) Hao, L., Weedman, D. W., Spoon, H. W. W., et al. 2007, ApJ, 655, L77
- Ho (2008) Ho, L. C. 2008, ARA&A, 46, 475
- Ho et al. (2003) Ho, L. C., Filippenko, A. V., & Sargent, W. L. W. 2003, ApJ, 583, 159
- Ho & Keto (2007) Ho, L. C., & Keto, E. 2007, ApJ, 658, 314
- Hönig & Kishimoto (2017) Hönig, S. F., & Kishimoto, M. 2017, ApJ, 838, L20
- Houck et al. (2004) Houck, J. R., Roellig, T. L., Van Cleve, J., et al. 2004, Proc. SPIE, 5487, 62
- Howell et al. (2007) Howell, J. H., Mazzarella, J. M., Chan, B. H. P., et al. 2007, AJ, 134, 2086
- Hudgins & Allamandola (1999) Hudgins, D. M. & Allamandola, L. J. 1999, ApJ, 516, L41
- Hudgins & Allamandola (2004) Hudgins, D. M. & Allamandola, L. J. 2004, Astrophysics of Dust, 309, 665
- Husemann et al. (2017) Husemann, B., Davis, T. A., Jahnke, K., et al. 2017, MNRAS, 470, 1570
- Imanishi et al. (1998) Imanishi, M., Terada, H., Goto, M., et al. 1998, PASJ, 50, 399
- Jarvis et al. (2020) Jarvis, M. E., Harrison, C. M., Mainieri, V., et al. 2020, MNRAS, 498, 1560
- Jensen et al. (2017) Jensen, J. J., Hönig, S. F., Rakshit, S., et al. 2017, MNRAS, 470, 3071
- Kakkad et al. (2017) Kakkad, D., Mainieri, V., Brusa, M., et al. 2017, MNRAS, 468, 4205
- Kelly (2007) Kelly, B. C. 2007, ApJ, 665, 1489
- Kennicutt (1998) Kennicutt, R. C. 1998, ARA&A, 36, 189
- Kennicutt et al. (2003) Kennicutt Jr., R. C., Armus, L., Bendo, G., et al. 2003, PASP, 115, 928
- Kirkpatrick et al. (2020) Kirkpatrick, A., Urry, C. M., Brewster, J., et al. 2020, ApJ, 900, 5
- Kleinmann et al. (1976) Kleinmann, D. E., Gillett, F. C., & Wright, E. L. 1976, ApJ, 208, 42
- Lai et al. (2020) Lai, T. S.-Y., Smith, J. D. T., Baba, S., et al. 2020, ApJ, 905, 55
- LaMassa et al. (2012) LaMassa, S. M., Heckman, T. M., Ptak, A., et al. 2012, ApJ, 758, 1
- Lebouteiller et al. (2015) Lebouteiller, V., Barry, D. J., Goes, C., et al. 2015, ApJS, 218, 21
- Lebouteiller et al. (2011) Lebouteiller, V., Barry, D. J., Spoon, H. W. W., et al. 2011, ApJS, 196, 8
- Léger & Puget (1984) Léger, A., & Puget, J. L. 1984, A&A, 137, L5
- Li (2020) Li, A. 2020, Nature Astronomy, 4, 339
- Lutz et al. (1998) Lutz, D., Spoon, H. W. W., Rigopoulou, D., Moorwood, A. F. M., & Genzel, R. 1998, ApJ, 505, L103
- Markwardt (2009) Markwardt, C. B. 2009, Astronomical Data Analysis Software and Systems XVIII, 411, 251
- Mathis et al. (1983) Mathis, J. S., Mezger, P. G., & Panagia, N. 1983, A&A, 128, 212
- Mazzarella et al. (1994) Mazzarella, J. M., Voit, G. M., Soifer, B. T., et al. 1994, AJ, 107, 1274
- Nenkova et al. (2008a) Nenkova, M., Sirocky, M. M., Ivezić, Ž., & Elitzur, M. 2008a, ApJ, 685, 147
- Nenkova et al. (2008b) Nenkova, M., Sirocky, M. M., Nikutta, R., Ivezić, Ž., & Elitzur, M. 2008b, ApJ, 685, 160
- O’Dowd et al. (2009) O’Dowd, M. J., Schiminovich, D., Johnson, B. D., et al. 2009, ApJ, 705, 885
- Peeters et al. (2004) Peeters, E., Mattioda, A. L., Hudgins, D. M., et al. 2004a, ApJ, 617, L65
- Peeters et al. (2004) Peeters, E., Spoon, H. W. W., & Tielens, A. G. G. M. 2004b, ApJ, 613, 986
- Pope et al. (2008) Pope, A., Chary, R.-R., Alexander, D. M., et al. 2008, ApJ, 675, 1171
- Rampazzo et al. (2013) Rampazzo, R., Panuzzo, P., Vega, O., et al. 2013, MNRAS, 432, 374
- Roche & Aitken (1984) Roche, P. F., & Aitken, D. K. 1984, MNRAS, 208, 481
- Roche et al. (1984) Roche, P. F., Aitken, D. K., Phillips, M. M., et al. 1984, MNRAS, 207, 35
- Roche et al. (1991) Roche, P. F., Aitken, D. K., Smith, C. H., et al. 1991, MNRAS, 248, 606
- Ruschel-Dutra et al. (2014) Ruschel-Dutra, D., Pastoriza, M., Riffel, R., et al. 2014, MNRAS, 438, 3434
- Rush et al. (1993) Rush, B., Malkan, M. A., & Spinoglio, L. 1993, ApJS, 89, 1
- Sales et al. (2010) Sales, D. A., Pastoriza, M. G., & Riffel, R. 2010, ApJ, 725, 605
- Sales et al. (2013) Sales, D. A., Pastoriza, M. G., Riffel, R., et al. 2013, MNRAS, 429, 2634
- Salpeter (1955) Salpeter, E. E. 1955, ApJ, 121, 161
- Sandage & Tammann (1987) Sandage, A., & Tammann, G. A. 1987, A Revised Shapley-Ames Catalog of Bright Galaxies (Washington, DC: Carnegie Inst. of Washington)
- Schmidt & Green (1983) Schmidt, M., & Green, R. F. 1983, ApJ, 269, 352
- Shangguan & Ho (2019) Shangguan, J., & Ho, L. C. 2019, ApJ, 873, 90
- Shangguan et al. (2020a) Shangguan, J., Ho, L. C., Bauer, F. E., et al. 2020a, ApJS, 247, 15
- Shangguan et al. (2020b) Shangguan, J., Ho, L. C., Bauer, F. E., et al. 2020b, ApJ, 899, 112
- Shangguan et al. (2018) Shangguan, J., Ho, L. C., & Xie, Y. 2018, ApJ, 854, 158
- Shi et al. (2006) Shi, Y., Rieke, G. H., Hines, D. C., et al. 2006, ApJ, 653, 127
- Shi et al. (2014) Shi, Y., Rieke, G. H., Ogle, P. M., Su, K. Y. L., & Balog, Z. 2014, ApJS, 214, 23
- Shipley et al. (2016) Shipley, H. V., Papovich, C., Rieke, G. H., Brown, M. J. I., & Moustakas, J. 2016, ApJ, 818, 60
- Siebenmorgen & Krügel (2010) Siebenmorgen, R. & Krügel, E. 2010, A&A, 511, A6
- Smith et al. (2007) Smith, J. D. T., Draine, B. T., Dale, D. A., et al. 2007, ApJ, 656, 770
- Spoon et al. (2007) Spoon, H. W. W., Marshall, J. A., Houck, J. R., et al. 2007, ApJ, 654, L49
- Stanley et al. (2017) Stanley, F., Alexander, D. M., Harrison, C. M., et al. 2017, MNRAS, 472, 2221
- Stierwalt et al. (2014) Stierwalt, S., Armus, L., Charmandaris, V., et al. 2014, ApJ, 790, 124
- Sturm et al. (2000) Sturm, E., Lutz, D., Tran, D., et al. 2000, A&A, 358, 481
- Tielens (2008) Tielens, A. G. G. M. 2008, ARA&A, 46, 289
- Treyer et al. (2010) Treyer, M., Schiminovich, D., Johnson, B. D., et al. 2010, ApJ, 719, 1191
- Van Kerckhoven et al. (2000) Van Kerckhoven, C., Hony, S., Peeters, E., et al. 2000, A&A, 357, 1013
- Voit (1991) Voit, G. M. 1991, ApJ, 379, 122
- Voit (1992) Voit, G. M. 1992, MNRAS, 258, 841
- Werner et al. (2004) Werner, M. W., Roellig, T. L., Low, F. J., et al. 2004, ApJS, 154, 1
- Wright et al. (2010) Wright, E. L., Eisenhardt, P. R. M., Mainzer, A. K., et al. 2010, AJ, 140, 1868
- Wu et al. (2010) Wu, Y., Helou, G., Armus, L., et al. 2010, ApJ, 723, 895
- Xia et al. (2012) Xia, X. Y., Gao, Y., Hao, C.-N., et al. 2012, ApJ, 750, 92
- Xie & Ho (2019) Xie, Y., & Ho, L. C. 2019, ApJ, 884, 136
- Xie et al. (2018a) Xie, Y., Ho, L. C., Li, A., et al. 2018a, ApJ, 860, 154
- Xie et al. (2018b) Xie, Y., Ho, L. C., Li, A., et al. 2018b, ApJ, 867, 91
- Xie et al. (2021) Xie, Y., Ho, L. C., Zhuang, M.-Y., et al. 2021, ApJ, 910, 124
- Xie et al. (2017) Xie, Y., Li, A., & Hao, L. 2017, ApJS, 228, 6
- Xu et al. (2015) Xu, L., Rieke, G. H., Egami, E., et al. 2015, ApJS, 219, 18
- Yesuf & Ho (2020b) Yesuf, H. M., & Ho, L. C. 2020b, ApJ, 901, 42
- Zhang et al. (2021) Zhang, L., Ho, L. C., & Xie, Y. 2021, AJ, 161, 29
- Zhang et al. (2016) Zhang, Z., Shi, Y., Rieke, G. H., et al. 2016, ApJ, 819, L27
- Zhao et al. (2021) Zhao, Y., Ho, L. C., Shangguan, J., et al. 2021, ApJ, 911, 94
- Zhuang & Ho (2020) Zhuang, M.-Y., & Ho, L. C. 2020, ApJ, 896, 108
- Zhuang et al. (2018) Zhuang, M.-Y., Ho, L. C., & Shangguan, J. 2018, ApJ, 862, 118
- Zhuang et al. (2019) Zhuang, M.-Y., Ho, L. C., & Shangguan, J. 2019, ApJ, 873, 103
- Zhuang et al. (2021) Zhuang, M.-Y., Ho, L. C., & Shangguan, J. 2021, ApJ, 906, 38