[table]capposition=top
Variability in extragalactic class I methanol masers: New maser components toward NGC 4945 and NGC 253
Abstract
We have used the Australia Telescope Compact Array (ATCA) to make new observations of the 36.2-GHz (E) methanol transition toward NGC 4945 and NGC 253. These observations have revealed the presence of new maser components toward these galaxies, and have provided the first clear evidence for variability in extragalactic class I methanol masers. Alongside the new observations of NGC 4945 and NGC 253, we present the results of recent 36.2-GHz methanol maser searches toward 12 galaxies, placing upper limits on the emission from the 36.2-GHz class I transition and the 37.7-GHz (E) class II maser line toward these sources. Flux density values for the 7-mm continuum emission toward these sources are also reported where applicable. A re-analysis of the published 36.2-GHz methanol observations of Arp 220 undertaken as part of the search revealed some issues with previous imaging procedures. The re-analysis, combined with non-detections in independent follow-up observations suggest that there is no 36.2-GHz methanol emission toward Arp 220 stronger than 3.5 mJy in a 10 channel (5 upper limit).
keywords:
masers – radio lines: galaxies – galaxies: starburst1 Introduction
The properties of galaxies (particularly those that are very distant) are often unable to be directly measured. Instead, we rely on indirect measurements through observations of some proxy. Historically, maser emission has proven to be a powerful tool for both direct and indirect investigation of various astrophysical phenomena both within our Galaxy and in others (e.g. star-formation, outflows, black-hole accretion disks; Moran et al., 1999; Kurtz et al., 2004). Galactic methanol masers, in particular, allow insight into the various stages of star-formation regions. Their compact and generally highly luminous nature, allows for conditions or evolutionary stages to be detected and accurately ascribed to certain locations within these star-forming regions (e.g. Cyganowski et al., 2009; Cyganowski et al., 2012; Breen et al., 2013; Voronkov et al., 2014). Extragalactic methanol masers may prove to be a similarly interesting tool for investigation of external galaxies, however, at this stage they are a relatively newly discovered and not well understood phenomenon.
The majority of known extragalactic methanol masers have been detected in the past five years. Class I methanol masers have been reported in NGC 253, Arp 220, NGC 4945, NGC 1068, IC 342 and NGC 6946 (Ellingsen et al., 2014; Wang et al., 2014; Chen et al., 2015; McCarthy et al., 2017, 2018b; Gorski et al., 2018) and class II masers in the Large Magellanic Cloud (LMC) and M31 (Green et al., 2008; Ellingsen et al., 2010; Sjouwerman et al., 2010). Considering these extragalactic examples, the class II masers appear to be highly luminous examples of regular Galactic-type class II masers (Ellingsen et al., 2010), however, this is not the case with the current detections of class I masers. Instead, they appear to be associated with large-scale regions of low-velocity shocks, such as molecular in-fall, within their host galaxies (Ellingsen et al., 2017; Gorski et al., 2018; McCarthy et al., 2018a).
NGC 253 and NGC 4945 are two nearby, southern, barred spiral galaxies with starburst nuclei. These sources are considered the prototypical examples of extragalactic class I methanol masers. The methanol masers in these sources are associated with the galactic bars of their host. The masers in NGC 253 appear to be associated with the inner bar-nucleus interface, where molecular in-fall along the bar is interacting with the central starburst zone, resulting in large-scale low velocity shocks (Ellingsen et al., 2017). The single maser region in NGC 4945 appears to be located at the interface region between the galactic bar and the south-eastern spiral arm (Henkel et al., 2018; McCarthy et al., 2018a).
Currently, there is no direct evidence for variability toward any extragalactic methanol maser sources. In Galactic sources, variability has been detected in numerous class II masers (e.g. Goedhart et al., 2003; Olech et al., 2019). However, the same has not been reported for Galactic class I sources. Variability in these class II sources has been suggested to be related to either changes in the pump rate (Araya et al., 2010), or variations in seed photon flux of the masers (van der Walt, 2011).
In this paper we report the results of new 7-mm observations toward NGC 4945 and NGC 253. Additionally we report upper-limits on the luminosity of 36.2-GHz class I and 37.7-GHz class II methanol emission toward twelve extragalactic sources (see Table 1), from data taken with the ATCA over the past few years. The initial search for extragalactic class I methanol masers was made towards a sample of luminous extragalactic OH and H2O megamasers (9 of the 12 sources reported here). These targets were selected before the first detection of an extragalactic class I methanol maser had been reported. This initial search was responsible for the first successful detections of 36.2-GHz class I masers reported in Ellingsen et al. (2014, 2017) and McCarthy et al. (2017). The remaining three sources (NGC 1097, NGC 1792 and NGC 1808) were observed as part of a follow up search, and as such selected targets are based on the general properties of NGC 253 and NGC 4945 (elevated star-formation rates, barred spirals etc.). We also provide a discussion of the entire sample, both detections and non-detections, which will allow a more focussed approach to target selection, allowing a higher success rate for future searches.
| Target | Right Ascension | Declination | Type | ||
|---|---|---|---|---|---|
| Source | ∘ | () | (Mpc) | ||
| NGC 253 | 00 47 33.10 | –25 17 18.00 | 243 | 3.4[1] | SAB(s)c |
| IRAS 01417+1651 | 01 44 30.50 | +17 06 05.00 | 8214 | 119 | pair of galaxies |
| NGC 1097 | 02 46 19.06 | –30 16 29.68 | 1271 | 9.51[2] | SB(s)b, Sy1 |
| NGC 1792 | 05 05 14.45 | –37 58 50.70 | 1211 | 9.6[3] | SA(rs)bc |
| NGC 1808 | 05 07 42.34 | –37 30 46.98 | 995 | 6.8[3] | (R′)SAB(s)a, Sy2 |
| ESO 558-g009 | 07 04 21.02 | –21 35 19.20 | 7674 | 118 | Sc |
| IC 2560 | 10 16 18.70 | –33 33 50.00 | 2925 | 32.5[4] | (R′)SB(r)b |
| IRAS 10173+0829 | 10 20 00.20 | +08 13 34.00 | 14716 | 231 | LIRG |
| IRAS 11506-3851 | 11 53 11.70 | –39 07 49.00 | 3232 | 30.3[5] | (R′)SAB(r)a |
| ESO 269-g012 | 12 56 40.50 | –29 34 02.81 | 5014 | 78.8 | S0, Sy2 |
| NGC 4945 | 13 05 27.50 | –49 28 06.00 | 563 | 3.7[6] | SB(s)cd, Sy2 |
| Circinus | 14 13 09.30 | –65 20 21.00 | 434 | 4.21[7] | SA(s)b |
| NGC 5793 | 14 59 24.70 | –16 41 36.00 | 3491 | 55 | Sb, Sy2 |
| IIZw 96 | 20 57 23.90 | +17 07 39.00 | 10822 | 159 | pair of galaxies |
| Target | Epoch | Array | Flux | Bandpass | Phase | On-source |
|---|---|---|---|---|---|---|
| Source | Configuration | Calibrator | Calibrator | Calibrator | Time | |
| NGC 253 | 2019 March | H214 | PKS B1934-638 | PKS B1921-293 | 0116-219 | 4.84h |
| IRAS 01417+1651 | 2014 March | H168 | Uranus | PKS B1921-293 | 0221+067 | 0.50 h |
| NGC 1097 | 2018 November | H168 | PKS B1934-638 | PKS B1921-293 | 0237-233 | 4.61h |
| NGC 1792 | 2018 December | H168 | PKS B1934-638 | PKS B1921-293 | 0521-365 | 3.72h |
| NGC 1808 | 2018 November | H168 | PKS B1934-638 | PKS B1921-293 | 0521-365 | 1.97h |
| ESO 558-g009 | 2014 March | H168 | Uranus | PKS B1921-293 | 0648-165 | 0.49 h |
| IC 2560 | 2014 March | H168 | PKS B1934-638 | PKS B1253-055 | 1034-293 | 0.20 h |
| IRAS 10173+0829 | 2015 August | EW352 | PKS B1934-638 | PKS B1921-293 | 1036+054 | 4.02h |
| IRAS 11506-3851 | 2014 March | H168 | PKS B1934-638 | PKS B1253-055 | 1144-379 | 0.50 h |
| ESO 269-g012 | 2014 March | H168 | PKS B1934-638 | PKS B1253-055 | 1322-427 | 0.20 h |
| NGC 4945 | 2017 June* | H214 | PKS B1934-638 | PKS B1921-293 | j1326-5256 | 1.64h |
| 2017 July | H75 | Uranus | PKS B1253-055 | j1326-5256 | 1.92h | |
| 2019 March | H214 | PKS B1934-638 | PKS B1921-293 | j1326-5256 | 3.93h | |
| Circinus | 2015 August | EW352 | PKS B1934-638 | PKS B1921-293 | 1414-59 | 2.80 h |
| NGC 5793 | 2014 March | H168 | PKS B1934-638 | PKS B1253-055 | 1510-089 | 0.20 h |
| IIZw 96 | 2015 August | EW352 | PKS B1934-638 | PKS B1921-293 | 2121+053 | 2.32 h |
2 Observations
The 7-mm observations reported in this paper were all made using the Australia Telescope Compact Array (ATCA) across multiple epochs between 2014 and 2019 (see Table 2). We adopted rest frequencies of 36 169.238 MHz (Voronkov et al., 2014) and 37 703.7000.030 MHz (Tsunekawa et al., 1995) for the class I 36.2- and class II 37.7-GHz transitions of methanol respectively.
Our observations are single pointings toward the centre of each galaxy (see Table 1). At 36.2-GHz the FWHM of the ATCA primary beam is 84 arcseconds. This corresponds to a linear radius from the pointing centre of 700 pc for our nearest source (NGC 253 at 3.4 Mpc) and 47 kpc for our furthest (IRAS 10173+0829 at 231 Mpc). This range is sufficient for detecting class I methanol masers at similar spatial offsets from the nucleus of the galaxies as those reported in previous reported detections.
Either PKS B1921–293 or PKS B1253–055 was utilised as a bandpass calibrator dependent on the epoch. The 10 minute scans of the target source were interleaved with 2 minute phase calibrator scans throughout the observations, with flux density calibration using PKS B1934–638 and Uranus. All sources observed in each epoch, and their relevant calibrators are listed in Table 2.
The details of the Compact Array Broadband Backend (CABB; Wilson et al., 2011) configurations for each epoch are detailed in the following subsections.
2.1 2014 March
Observations were made on 2014 March 26 and 28 (project code C2879), using the H168 hybrid array configuration (minimum and maximum baselines of 61 and 192m respectively). CFB 1M CABB mode was utilised for these observations, resulting in MHz IF bands, with centre frequencies of 35.3 GHz and 37.3 GHz respectively. The channel width for these IF bands was 1 MHz (8.2 at 36.2-GHz) resulting in 2048 spectral channels for each IF band. A typical synthesised beam for this hybrid array at 36.2-GHz is approximately (dependent on source declination).
Dependent on the day, the observing strategy utilised PKS B1934-638 or Uranus as flux density calibrators, with bandpass calibrated with respect to PKS B1921-293 or PKS B1253-055 (see Table 2). Scans of target sources were interleaved with phase calibration scans on nearby appropriate sources.
The weather for this epoch of observation was particularly bad which, when combined with low on-source times, resulted in bad data quality. We have only reported detection upper-limits for those sources which we could image to a sufficient standard. This generally includes sources where we could get continuum detections (see Table 6) in order to self-calibrate the data and achieve higher sensitivity. As an example of the data quality, NGC 4945 was originally observed during this epoch, and the data quality is too poor to detect the strong 36.2-GHz emission observed toward this source in observations since. A table of sources that were also observed, but with too low data quality (RMS over an order of magnitude higher than expected) to draw any useful conclusions, is included in the appendix (Table A.1).
2.2 2015 August
Observations were made on 2015 August 25 and 26 (project code C2879), using an EW352 east-west array configuration (minimum and maximum baselines of 31 and 352m respectively). The CABB was configured in the CFB 1M/64M hybrid mode, consisting of MHz IF bands. The first IF band has a channel width of 1 MHz resulting in 2048 spectral channels, with a centre frequency for the band of 36.85 GHz. The second IF is MHz channels (also centred on 36.85 GHz) with the ability to define up to 162048 channel zoom bands with a fine resolution of 32 kHz (resulting in a channel width of 0.26 at 36.2-GHz). Two sets of five zoom bands were combined (‘stitched’) together to cover each of the two lines of primary interest (36.2-GHz class I and 37.7-GHz class II methanol). A typical synthesised beam for these 36-GHz EW352 observations is .
2.3 2017 July
Observations were made on 2017 July 7 (project code C3617), using the ATCA H75 hybrid array configuration (minimum and maximum baselines of 30.6 and 89.2m respectively). The CABB was configured in CFB 1M-0.5k mode, resulting in MHz IF bands (with centre frequencies of 36.85 and 32.20 GHz), each with 1 MHz spectral resolution (8.2 at 36.2-GHz) and the option of configuring 16 zoom bands per IF, with 2048 channels and a fine resolution of 0.5 kHz ( at 36.2-GHz). We did not use zoom bands for these observations, due to the fine resolution producing insufficient velocity coverage for extragalactic sources at this frequency. These H75 array observations at 36.2-GHz had a synthesised beam size of approximately .
2.4 2018 November and December
Observations were made on 2018 November 28 and 29, and December 3 (project code C3263) using the H168 hybrid array configuration (minimum and maximum baselines of 61 and 192m respectively). The CFB 64M-32k CABB configuration was used, consisting of two MHz IF bands (centre frequencies of 32.2 and 36.85 GHz respectively), with both bands additionally allowing up to 162048 channel zoom bands to be defined with a fine resolution of 32 kHz. Each target methanol line (36.2-GHz class I and 37.7-GHz class II methanol), was covered by 4 stitched zoom bands (the 32 kHz channel width corresponds to 0.26 at this frequency). The synthesised beams of these observations are approximately .
It should be noted that due to frequency configuration issues, the flux density calibration for NGC 1097 required approximation based on levels seen from the other recent observations. NGC 1097 and NGC 1808 were observed one day apart and comparison of the flux density values for the bandpass calibrator used for both these sets of observations (PKS B1921–293) allowed for an approximate flux density calibration for NGC 1097. Therefore, both RMS values reported in Table 3 and continuum flux density values in Table 6 have higher levels of uncertainty (40 percent) than all other sources.
2.5 2019 March
Observations were made on 2019 March 3 (project code C3167), using the H214 hybrid array configuration minimum and maximum baselines of 82 and 247 m respectively). The CFB 64M-32k CABB configuration was used, consisting of two MHz IF bands (centre frequencies of 36.8 and 38.00 GHz respectively), with both bands additionally allowing up to sixteen 2048 channel zoom bands to be defined with a fine resolution of 32 kHz. The target 36.2-GHz methanol line was covered by 4 stitched zoom bands (the 32 kHz channel width corresponds to at this frequency). These observations had a synthesised beam of and for NGC 4945 and NGC 253 respectively.
The bandpass calibrator PKS B1921-293 was used with flux density calibrated against PKS B1934-638. A nearby quasar was selected for interleaved phase calibration scans for each source. Details on these sources can be found in Table 2.
The weather during this session was not ideal for mm-wavelength observing, with high ambient temperatures and patchy cloud cover. This results in higher RMS noise levels than would be expected for our on-source time. However, a combination of manual flagging (for scans affected by clouds passing through the line of sight) and self-calibration allows us to achieve a sensitivity similar to past observations of these sources (McCarthy et al., 2018a; Ellingsen et al., 2017).
| Target | Velocity | Channel | RMS |
|---|---|---|---|
| Source | Range | Width | Noise |
| () | () | (mJy beam-1) | |
| NGC 253 | 0–500 | 1 | 1.9 |
| IRAS 01417+1651 | 7100 – 9100 | 10 | 1.6/1.6 |
| NGC 1097 | 750 – 1750 | 10 | 0.5*/0.4* |
| NGC 1792 | 700 – 1700 | 10 | 0.4/0.4 |
| NGC 1808 | 600–1600 | 10 | 0.2/0.2 |
| ESO 558-g009 | 6800 - 9600 | 10 | 2.2/2.2 |
| IC 2560 | 2000 – 3600 | 10 | 6.5/6.7 |
| IRAS 10173+0829 | 13500 – 14900 | 10 | 1.2/1.3 |
| IRAS 11506-3851 | 1900 – 4100 | 10 | 2.2/2.5 |
| ESO 269-g012 | 4000 – 6000 | 10 | 6.6/6.2 |
| NGC 4945 (H214) | 250–850 | 1 | 1.9 |
| NGC 4945 (H75) | 200–1020 | 8.2 | 0.3 |
| Circinus | 0 – 800 | 10 | 0.5/0.6 |
| NGC 5793 | 2500 – 4400 | 10 | 6.4/5.4 |
| IIzw96 | 10000 – 12000 | 10 | 0.6/0.6 |
| Label | RA (J2000) | Dec (J2000) | |||||
|---|---|---|---|---|---|---|---|
| ∘ | (mJy) | (mJy ) | () | () | |||
| 1 | M1 | 13 05 28.0 | 49 28 12.67 | 55 | 500 | 673 | 630–710 |
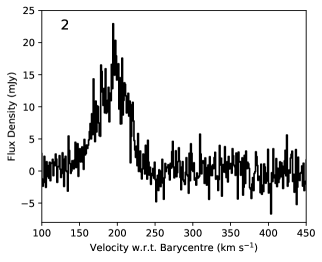
| 2 | M2 | 13 05 27.1 | 49 28 07.39 | 5 | 250 | 490 | 420–560 |
| Label | RA (J2000) | Dec (J2000) | |||||
|---|---|---|---|---|---|---|---|
| ∘ | (mJy) | (mJy ) | () | () | |||
| 1 | MM6 | 00 47 33.9 | 25 17 11.65 | 25 | 605.3 | 207 | 160–260 |
| 2 | MM5/MM4 | 00 47 33.7 | 25 17 12.39 | 24 | 655.9 | 195 | 140–250 |
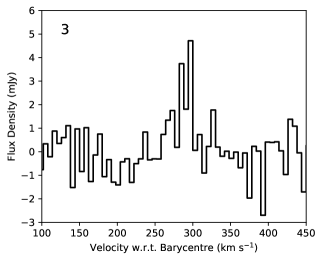
| 3 | - | 00 47 32.8 | 25 17 22.19 | 5 | 75.5 | 300 | 255–345 |
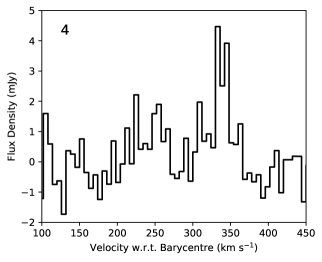
| 4 | - | 00 47 32.3 | 25 17 19.06 | 5 | 69.6 | 336 | 300–360 |
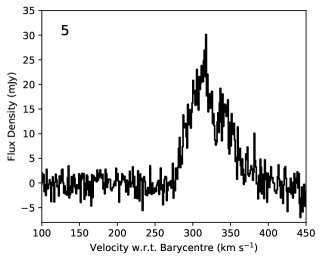
| 5 | MM1/MM2 | 00 47 32.0 | 25 17 28.98 | 30.0 | 1100 | 318 | 260–400 |
2.6 Data Reduction
Data were reduced with miriad using standard techniques for the reduction of 7-mm ATCA spectral line data. The data were corrected for atmospheric opacity and we estimate the absolute flux density calibration to be accurate to better than 30%. For targets with continuum source detections, multiple iterations of phase-only self-calibration was performed. Any potential spectral line emission was isolated from the data by using the uvlin miriad task. This task subtracts any potential continuum emission by estimating the correlated flux density on each baseline via polynomial interpolation based on line-free spectral channels. The velocity ranges and channels widths for our spectral line cubes varied depending on the source and CABB configuration/frequency setup that was utilised for the observations. When searching for spectral line emission, the data were resampled using many different channel widths, in order to appropriately identify both broad and narrow emission. Typical channel widths searched were 1, 3, 8, 10 and 20 as the native spectral-resolution allows (dependent on the CABB configuration). Spectral line cubes are produced with a cell (pixel) sizes of arcseconds and a Brigg’s visibility weighting robustness parameter of 1. Details of the final spectral line cubes are listed in Table 3, with image cube noise levels reported for a consistent channel width of 10 for ease of comparison.
2.6.1 Identification of maser sources
Spectral line cubes were visually inspected for strong maser emission. The DUCHAMP source finder software (Whiting, 2012) was then used to search each cube with a threshold. Such a low threshold produces many false positives (100), however the vast majority of these are on the outer edges of our images (which are typically ). Any candidate within 2 times the FWHM of the primary beam (corresponding to a radius of 84′′ from the pointing centre at 36.2-GHz) were manually inspected to determine if they were potential maser components. Generally with data of reasonable quality, very few false positives (less than two and typically none) were present within this central region of the image.
3 Results
This paper contains observations from three different projects, two involving searching for new extragalactic class I methanol maser sources (C2879 and C3263), and one studying known maser hosts (C3167). In order to facilitate easier reading we will separate the results based on project goal.
| Target Source | Right Ascension | Declination | ||
|---|---|---|---|---|
| ∘ | (mJy beam-1) | (mJy) | ||
| ESO 269-g012 | 12 56 40.5 | –46 55 34.00 | - | |
| IC 2560 | 10 16 18.7 | –33 33 50.00 | - | |
| IRAS 11506-3851 | 11 53 11.8 | –39 07 49.18 | 10.0 | 10.7 |
| NGC 5793 | 14 59 24.8 | –16 41 36.70 | 18.8 | 19.3 |
| ESO 558-g009 | 07 04 21.0 | –21 35 19.20 | - | |
| IRAS 01417+1651 | 01 44 30.5 | +17 06 05.00 | - | |
| Circinus | 14 13 10.0 | –65 20 20.74 | 56.6 | 63 |
| IIzw96 | 20 57 24.4 | +17 07 40.47 | 5.8 | 5.8 |
| IRAS 10173+0829 | 10 20 00.2 | +08 13 32.07 | 7.1 | 8 |
| NGC 1097 | 02 46 18.9 | -30 16 28.69 | 8.1* | 8.4* |
| NGC 1792 | 05 05 14.5 | –37 58 49.87 | 4.4 | 4.4 |
| NGC 1808 | 05 07 42.3 | –37 30 45.64 | 4.5 | 6.2 |
| NGC 253 | 00 47 33.2 | 25 17 17.77 | 214.3 | 335.7 |
| NGC 4945 | 13 05 27.4 | 49 28 05.43 | 296 | 430.8 |
3.1 Project C3167: the methanol masers of NGC 253 and NGC 4945
3.1.1 NGC 4945
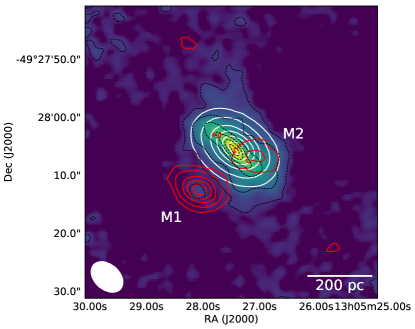
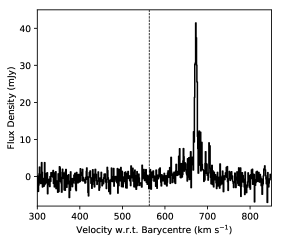
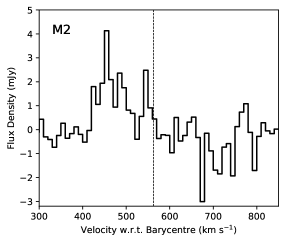
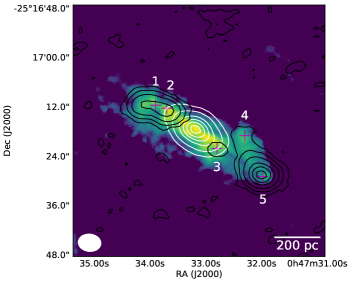
The previously reported bright 36.2-GHz methanol maser offset to the south-east from the nucleus of NGC 4945 was readily detected in the latest 2019 March epoch observation (M1 in Figure 1). In addition to this primary region, we identify another region of 36.2-GHz emission south-west of the galactic centre. This emission is offset by approximately 3 arcseconds to the south-west of the galactic nucleus (M2 in Figure 1). This location corresponds to the south-west component of 36.4-GHz HC3N and CS () emission reported in McCarthy et al. (2018a) and the methanol emission covers the same velocity range. When compared to the primary region, this new emission has a much lower peak flux density and a significantly broader spectral profile. This emission is clearly visible in the data prior to any self-calibration, indicating it is not an artefact of this process.
7-mm continuum emission was detected toward the nucleus of NGC 4945. As in McCarthy et al. (2018a), this continuum measurement was obtained using the line-free data in the 36.2-GHz zoom band. The measured flux density is in agreement with the previously reported measurement. The integrated flux density agrees with the modelled 7-mm continuum values from Bendo et al. (2016), which predicts that 75 percent of this 7-mm continuum emission is from free-free emission.
3.1.2 NGC 253
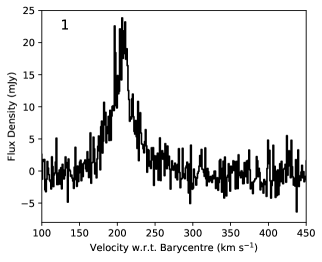
We detect the same 36.2-GHz methanol maser regions toward NGC 253 as have been reported by Ellingsen et al. (2014, 2017), though the resolution of the new observations does not allow us to resolve all of the individual features at the locations of the brightest emission. We also identify two tentative new components of methanol emission (see Figure 2) not formerly detected by Ellingsen et al. (2017) or Gorski et al. (2017). These components are only approximately 4 detections, however, they are located at the same positions and velocities as emission in the 87.9 GHz transition of HNCO emission (location C and D in figure 1 of McCarthy et al., 2018b). The previous 36.2-GHz ATCA observations of NGC 253 by Ellingsen et al. (2017) have a high enough sensitivity (1.1 mJy beam-1 in a 3 channel), however, their observations make use of more extended array configurations. Both components have sufficiently high peak flux densities (5 mJy) that they should have been detected by previous observations of NGC 253.
7-mm continuum emission was detected toward the nucleus of NGC 253. Continuum emission was extracted from the line-free data in the 36.2-GHz zoom band, flux density values for this continuum emission, along with those for the maser components are recorded in Table 5.
3.2 Projects C2879 & C3263: searching for masers
No additional extragalactic methanol maser sources have been detected in any of the targets of these projects and RMS noise levels for the 36.2-GHz class I and 37.7-GHz class II spectral line cubes are listed in Table 3. Results for NGC 1097 have a higher uncertainty due to flux-calibration issues, as outlined in Section 2.4.
7-mm continuum emission was detected toward the centre of many of these galaxies (see Table 6), many of which have no previously reported values in the literature.
4 Discussion
4.1 New methanol emission toward NGC 4945
The new methanol emission from region M2 shares overlapping position and velocities with the south-western CS (1–0) and HC3N (4–3) emission reported in McCarthy et al. (2018a). This increases our confidence that despite a relatively low-SNR, the emission at this location is indeed real. Before we can discuss what this new region of methanol emission means for our understanding of extragalactic class I methanol masers, we must first justify that it is reasonable to consider this emission the result of maser processes.
While not as narrow as the linewidths seen toward the primary maser region (M1), M2 appears to consist of two or more components with FWHM of 20 . These linewidths are much narrower than those observed from thermal emission toward the same regions (FWHM of ; Henkel et al., 2018; McCarthy et al., 2018a), and are comparable to the masing regions toward NGC 253 (Ellingsen et al., 2017). Similarly to the main 36.2-GHz methanol masing region, no methanol from the ground state 48 GHz transition has been reported toward M2 (McCarthy et al., 2018a).
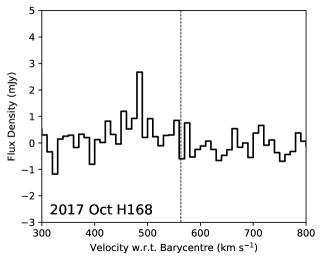
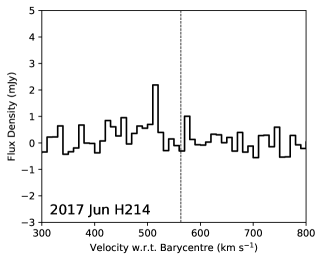
When investigating the emission at M2 in the three epochs of observation originally presented in McCarthy et al. (2018a), it should be noted that all were made in relatively compact ATCA array configurations (2016 Aug, 2017 Jun and Oct; see Table 7). Looking at these three array configurations we see the integrated flux density of M2 increasing as the array configuration gets more compact. This relationship may indicate thermal emission from this region, however, there are a few important caveats to this interpretation. The first is that the detections of emission from M2 in these epochs is very marginal, with only a channel or two above the noise level (see Figure 5). This means the extracted integrated flux density values from these locations with marginal detections is less reliable. Secondly, a similar relationship is observed toward M1, where integrated flux density increases as they array becomes more compact. Finally, it is hard to determine the true integrated flux density for M2 from the 2017 July H75 observations, as the emission from the primary component M1 is also captured within the larger synthesised beam.
The emission from this new methanol region also displays evidence of variability. This is the best evidence that the emission does not result from a thermal process. This variability is discussed in more detail in Section 4.3, as it is the first compelling evidence for variability in extragalactic class I methanol masers.
Due to the broad spectral profile of the emission and the larger velocity range, the integrated flux density of M2 is only approximately 50% lower than the primary masing region, despite a much lower peak flux density (by a factor of 10). This integrated intensity is approximately 5 orders of magnitude higher than that of a typical Galactic style 36.2-GHz emission, and over an order of magnitude (a factor of 40) higher than the combined 36.2-GHz emission from the Milky Way CMZ (Yusef-Zadeh et al., 2013). As this region is unresolved by our synthesised beam ( arcseconds), we can put an upper limit on its angular size. This angular size corresponds to a linear size of pc at the 3.7 Mpc distance of NGC 4945 (likely a vast over-estimate based on variability timescale, see Section 4.3). This implies we have over 40 times the 36.2-GHz emission coming from an area on the sky which is at most 30% larger than the CMZ would be at this distance.
Considering all these factors together, we conclude that the most reasonable explanation is that this emission is masing. McCarthy et al. (2018a) also put an upper limit of 6 mJy on the presence of any 44-GHz methanol emission from NGC 4945. This means the 36.2-GHz methanol emission from this region is unlikely to be resulting from the cumulative effect of Galactic-style class I masers, as otherwise we would expect to also see evidence of 44.1-GHz maser emission (Voronkov et al., 2014).
4.2 Tentative new methanol emission in NGC 253
The angular resolution of our observations does not allow us to separate the methanol emission into the individual components as reported in previous interferometeric studies (Ellingsen et al., 2017; Gorski et al., 2017; Chen et al., 2018). However, despite this we observe two new components of emission (labelled 3 and 4 in Figure 2). These components are only detections, however, their location and velocity strongly correlate with the components of HNCO emission reported in McCarthy et al. (2018b). Ellingsen et al. (2017) observe a close correlation between the location of 36.2-GHz methanol masers and thermal emission from HNCO, a low-velocity shock tracer. This indicates that despite being a marginal detection, these components are likely real.
Comparison of our new observations with past ATCA observations of the 36.2-GHz methanol masers toward NGC 253 (Ellingsen et al., 2014, 2017), the whole spectrum (combining all regions) is more similar to what is reported in the original detection paper. The ‘intermediate resolution’ observations displayed in figure 1 of Ellingsen et al. (2017) shows significantly higher peak flux density values then what we see from our observations or their past observations (Ellingsen et al., 2014). However, upon re-analysis of the data, this appears to be an error (with flux density values out by a factor of 2) in how the spectrum has been extracted from their ‘intermediate resolution’ spectral line cube (and it does not affect the spectra taken from the combined array cube in figure 2 of Ellingsen et al. (2017)), and the data is consistent across all 3 epochs.


4.3 Evidence for variability in extragalactic methanol masers
We currently have five epochs of observations of the 36.2-GHz methanol transition toward NGC 4945, three of which were originally reported in McCarthy et al. (2017) and McCarthy et al. (2018a), with the remaining 2 reported in this paper. This allows us to compare the methanol emission over a time baseline of approximately 3.5 years. Tabulated flux density values for the primary methanol maser component (M1), newly discovered central region (M2) and 7-mm continuum emission can be found in Table 7.
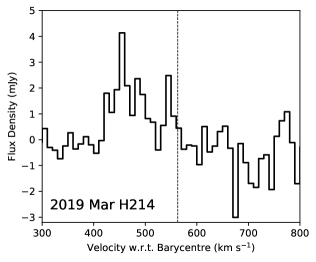
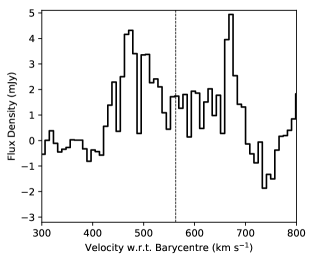
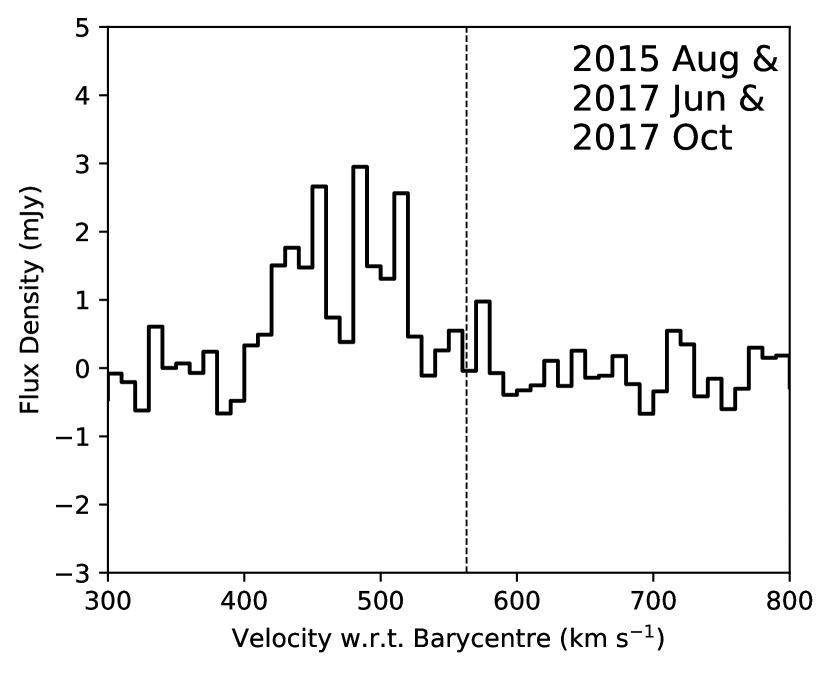
The detection of the new emission at M2 in NGC 4945 is the first strong evidence for variability in an extragalactic class I methanol maser source. This is most evident when comparing the two observations made using the H214 array configuration, one in 2019 March and the other in 2017 June (see Figure 5 for spectra and Table 7 for flux density values). Due to the difficulties of comparing emission observed with different array configurations, the comparison of these two H214 epochs will be the main focus of this section. We see a 330 percent increase in integrated flux density across the velocity range of the new component (420–560 ) when comparing these two epochs (see Table 7). We also see evidence of this emission in the much lower resolution (synthesised beam size of arcseconds) H75 array data from 2017 July, which is bracketed by the higher resolution observations in both 2017 June and October, neither of which show significant emission. This may indicate that emission from this region was much more diffuse during this period, with it becoming significantly more compact sometime prior to the most recent observation. However, if we assume a time-scale of 21 months for the variability (based on the time period between the H214 observations), this puts an upper limit on the size of the emitting region of 21 light-months (0.53 pc). At a distance of 3.7 Mpc, this corresponds to an angular size of 0.03 arcseconds, meaning the emission would be compact enough to be detectable on any ATCA baseline. It is therefore more likely that the change in luminosity of the region is instead related to an excitation change. Combining all data from the three intermediate resolution observations reported in McCarthy et al. (2018a) (see Figure 6), we can clearly see this emission at M2 (despite the the individual epochs showing no clear evidence) with a peak flux density of mJy and integrated flux density of 185 mJy . This further supports the interpretation that the variability is a result of an excitation change, rather than the emission simply being more diffuse during these earlier epochs.
The angular size of 0.03 arcseconds also allows us to put a lower limit of 6500 K on the brightness temperature of the emission from M2 based on the peak spectral channel (channel width 10 ), or K integrated over a 140 velocity range. This brightness temperature provides further evidence that this emission is the result of a non-thermal process, as discussed in Section 4.1.
The brighter region to the south-east of the nucleus (M1 in Figure 1) also shows some evidence of variability. The multiple spectral components reported in McCarthy et al. (2018a) are all present without any measurable shift in their velocities. When directly comparing the emission from the south-eastern bright region to the 2017 June observations in the same array configuration (H214), we observe a decrease in peak flux density of 6 percent and increase in integrated flux density of 30 percent. The integrated flux density of this primary region is also significantly higher (15 percent) than that observed using a more compact array configuration (H168) in 2017 October.
Our previous 2017 June H214 observations, when compared to other 7-mm observations toward NGC 4945, had lower continuum values than expected (McCarthy et al., 2018a). However, here we observe the same values of peak and integrated flux density for the 7-mm continuum source as reported from the previous H214 observations of NGC 4945 (see Table 7 for values). This suggests that instead of the 2017 June continuum levels being anomalously low, the 2015 August EW367 continuum levels may be higher than expected. This is likely related to the poor uv-coverage (highly elongated beam) of these observations preventing accurate imaging (flux density values are extracted from images using the imfit miriad task). The consistency of the 7-mm continuum measurements between these two H214 observations increases the confidence in our flux density calibration, which strengthens our comparisons of the maser emission between these two epochs.
It can be difficult to measure variability in the weak millimetre spectral line emission from these extragalactic sources. It is difficult to isolate what is variability in the source, and what is variability caused by differing array configurations, weather and uv-coverage between observations. With that said, the increased integrated flux density observed from M2 in our recent observations (2019 March) when compared to past observations (in particular the 2017 Jun H214 epoch) is far too large to be the result of weather or systematic effects.
The tentative new components detected toward NGC 253 also may indicate variability in this emission. The previous observations of NGC 253 at 36.2-GHz (Ellingsen et al., 2017) have appropriate sensitivity to detect these components, however, these observations use a higher-resolution east-west oriented array without complete uv-coverage. The resulting synthesised beam of those observations makes determining component separation along the north-east to south-west axis difficult, which is required to resolve the individual south-western components.
The mechanism driving such significant variation in these masers is mostly a mystery, especially because at this stage we do not understand the nature of the variability. It could be that it is a periodic phenomenon, or instead we may be observing the creation of new masers at these locations which will eventually stabilise. In Galactic sources, class I methanol masers are observed to exist for long periods of time, remaining relatively stable (Kurtz et al., 2004). This stability is consistent with the expected variability time-scales for saturated class I masers, where the low-velocity shocks have long relaxation times (15 years; Leurini et al., 2016). However, it should be noted that long-term monitoring of class I methanol maser sources has not been undertaken to date, and our understanding of variability in these Galactic class I masers is lacking. Another collisionally pumped maser species is water, which is observed to be highly variable in both Galactic and extragalactic sources (e.g. Haschick & Baan, 1990; Felli et al., 2007; McCallum et al., 2007). These water masers trace more energetic environments, with higher velocity shocks (Hollenbach et al., 2013). It may be that extragalactic class I methanol masers also trace higher-energy environments than their Galactic counterparts, though this is largely speculation as all modelling of the class I methanol lines is based on our understanding of Galactic sources (Sobolev et al., 2007; McEwen et al., 2014; Leurini et al., 2016). In order to confirm variability in these extragalactic class I methanol masers and develop our understanding of the phenomenon, constant and consistent monitoring is required. This monitoring should ideally be made with the same spatial resolution in order to accurately quantify any variability observed toward these sources.
| Epoch | Flux density source (mJy) | Angular Scale | |||
|---|---|---|---|---|---|
| M1 | M2 | Continuum | Phase Cal. | Min/Max (arcsec). | |
| 2015 Aug (EW352) | 27.9 (289) | 2.1 (44) | 313 (414) | 3328 | 3.6/55.8 |
| 2017 Jun (H214) | 27.4 (305) | 2.3 (65) | 236 (348) | 1369 | 4.4/20.7 |
| 2017 Jul (H75) | 21.3 (450) | 4.4 (279) | 452 (447) | 935 | 12.0/55.8 |
| 2017 Oct (H168) | 30.4 (346) | 2.8 (71) | 385 (489) | 1141 | 5.0/27.9 |
| 2019 Mar (H214) | 25.7 (397) | 4.3 (215) | 246 (356) | 1110 | 4.4/20.7 |
4.4 Non-detection in Arp 220 follow-up
The weather during the 2014 March observations, was quite poor (particularly on March 28). During the processing of the data from this epoch we found that certain imaging parameters were causing spurious emission to appear in the spectral line cubes of targets with relatively low on-source time (and therefore, high noise). This realisation prompted re-analysis of the Arp 220 data published in Chen et al. (2015), as the data reported in that paper was from this observing session, and has not been confirmed in any subsequent observations. Upon reanalysing with more robust imaging parameters we find a similar spectral profile to that which is reported in Chen et al. (2015), however, at much lower flux density than that reported (6 mJy peak compared with 25 mJy). The RMS noise in the cube is 4.3 mJy, so we can not be confident that this is real emission. Additionally, we see no evidence for the reported 37.7-GHz emission (Chen et al., 2015) in the re-analysed data. We have also reduced data from an ATCA follow-up observation in 2014 November (EW367 array configuration), with much longer integration times (4.8 hours). Analysis of these data does not show any 36.2-GHz methanol emission toward the central region of Arp 220 comparable to that reported in Chen et al. (2015). Based on these follow up observations, we put a upper limit on emission from the 36.2-GHz methanol line of 3.5 mJy. A recent 36.2-GHz search by Henkel et al. (submitted) targetted Arp 220 with the Effelsberg 100m telescope and report no detection of 36.2-GHz emission (with an upper limit of 4.2 mJy).
4.5 Sample discussion
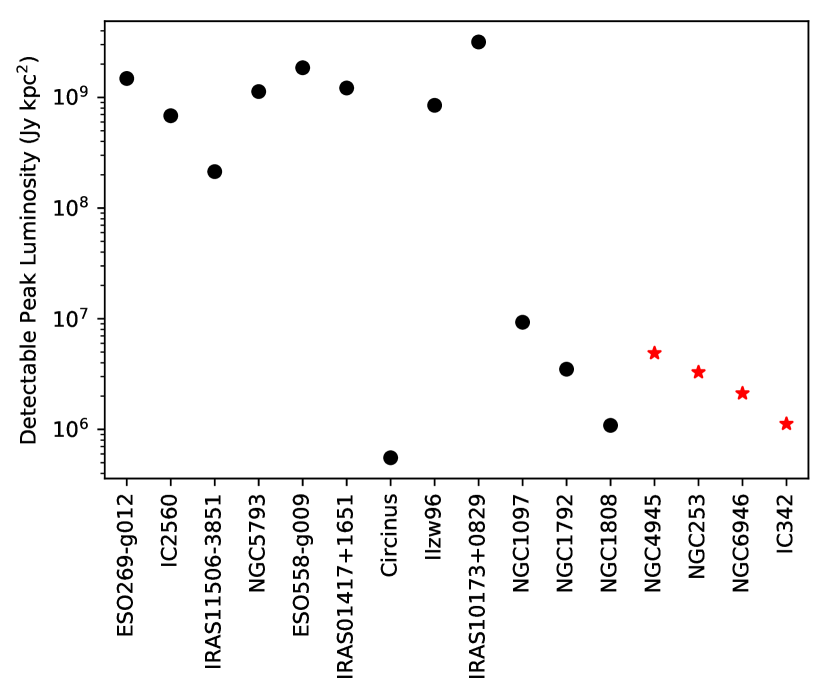
When considering the non-detections toward most of our targets, it is important to note that the observations conducted under project C2879 were also responsible for discovering the first extragalactic methanol masers. Hence at the time the observations were made there was no information on the luminosity, nor likely environments to host extragalactic class I methanol masers. This results in many of the target sources not having a high enough sensitivity to detect methanol masers of comparable luminosity to those observed toward our known hosts (see Figure 4). This was not a problem for the subsequent searches, which uses much higher sensitivity levels, based on the currently known extragalactic class I maser sources.
Of the 12 sources for which we report 36.2-GHz methanol upper limits (C2879 and C3263 targets), only four have sensitivity levels adequate for detecting masers with the same luminosity as those detected toward NGC 4945, with the sensitivity of the majority over an order of magnitude too low (see Figure 4). When combining the non-detections with detections for analysis of the sample, the majority of the time we will include only these sources with appropriate sensitivity levels. This means our primary sample for discussion will include: NGC 4945, NGC 253, NGC 6946, NGC 1068, NGC 1097, NGC 1792, NGC 1808, IC 342 and the Circinus Galaxy.
Considering the general properties of the galaxies with detections we see three common factors: They are all barred, spiral galaxies with elevated levels of star-formation toward their nucleus (when compared to the Milky Way). However, it is important to note that searches for extragalactic methanol masers have been biased toward these types of sources based on the first detections in NGC 253 and NGC 1068 (Ellingsen et al., 2014; Wang et al., 2014). As of yet no statistically complete search for these masers has been undertaken, and as such, it is hard to determine the most relevant properties for future target selection. The observations for project C3263, reported in this paper, used the above properties to target nearby southern sources. Despite that, the three sources observed so far as part of that project (NGC 1097, NGC 1792 and NGC 1808) have not shown any sign of methanol maser emission. The only other source observed with appropriate sensitivity is the Circinus Galaxy, which is a spiral galaxy with no bar, however it does show evidence of molecular outflows from its type 2 Seyfert AGN.
In order to determine the most efficient way, in terms of target selection and telescope time, to search for extragalactic 36.2-GHz methanol masers, we must determine the luminosity levels of a ‘typical’ region. The currently reported extragalactic 36.2-GHz methanol masers (in NGC 4945, NGC 253, NGC 6946 and IC 342) all have varying peak and integrated luminosity levels. In this discussion we consider the peak and integrated flux density from a single emission component at our resolution (rather than the combined emission across the whole source) as these are what will be detected when searching using interferometers like the VLA or the ATCA. Peak luminosities (in a 10 channel) for the brightest region in each source vary from Jy kpc2 in IC 342 to Jy kpc2 toward NGC 4945, with integrated luminosities ranging from Jy kpc2 in IC 342 to Jy kpc2 toward NGC 253. It must be noted that the flux density values for IC 342 and NGC 6946 are from observations with much higher spatial-resolution than the ATCA observations (VLA C-configuration) of NGC 4945 and NGC 253 (1 arcsec compared to 5 arcsec). We calculate an average peak luminosity of Jy kpc2 across these 4 sources. With a sensitivity of 0.5 mJy (in a 10 channel), a 5 detection of a maser with this luminosity can be made out to a distance of 34 Mpc. Assuming the ability to self-calibrate off a continuum source, this sensitivity can be achieved with about 4 hours of on-source time with the ATCA in an intermediate resolution array configuration (H168 – EW367) or 45 minutes of on-source time with VLA D-configuration (VLA D-configuration will allow detection of any extended emission, such as that seen toward NGC 253). A 10 channel width is appropriate for searching for these masers as this will allow multiple, above noise level, consecutive channels across the FWHM of the spectral profile for the vast majority of known extragalactic 36.2 GHz methanol sources. The only exception to this is the spectral profile of the M1 region in NGC 4945, which has a FWHM of 20 . Though this source has a much higher peak luminosity then the other sources, so the ability to image with narrower channel widths will still allow flexibility for detecting these sources. However, it should be noted that our analysis of optimal search parameters for these 36.2-GHz masers is based off a sample size of four sources, and as such is susceptible to small number statistics.
4.6 Galaxy-wide star-formation as a predictor for class I methanol masers
Within our Galaxy, methanol masers (both class I and II) provide useful sign-posts for the location of star-formation regions (Caswell, 1997; Kurtz et al., 2004; Voronkov et al., 2006; Breen et al., 2010, 2011). It was initially hypothesised that these extragalactic class I masers may be useable in the same manner, identifying starburst galaxies at cosmologically interesting distances (Chen et al., 2016). However, that speculation was largely predicated on the more luminous emission reported toward Arp 220. Reanalysis showing no 36.2-GHz methanol emission stronger than 3.5 mJy (peak luminosity of 2 Jy kpc2) toward Arp 220, means that at present the known extragalactic methanol sources are not readily detectable at cosmologically interesting distances with current generation facilities. Even considering only the sources that meet our detection threshold in Figure 4, we have four sources with star-formation rates (SFR) at the same level or higher than those observed toward NGC 253 or NGC 4945 with confident non-detections for 36.2-GHz class I methanol masers.
When considering known examples of extragalactic class I methanol masers, we see that locally, there is no clear link to star-formation rates in the regions where they are detected. The M1 region toward NGC 4945 and the masers toward NGC 253 are all likely associated with giant molecular clouds in these sources, however, these regions do not necessarily display enhanced star-formation rates when compared to the rest of the nuclear region (Ellingsen et al., 2017; McCarthy et al., 2018a). M1 in NGC 4945 may be associated with the star-formation from Knot B, though even if this is correct, we do not observe class I maser emission from other regions in NGC 4945 with enhanced star-formation levels. Instead of tracing current star-formation, based on our current understanding of the environments of these masers (dense-gas and low-velocity shocks), we believe they may indicate regions that are soon to experience higher levels of star-formation, essentially the class I maser emission is associated with the triggering of the star-formation.
The presence, or lack-thereof, of class I methanol masers may not directly infer information about the star-formation rate of its host, however, it can still provide useful information about the mechanism triggering the star-formation. The morphological features that these class I masers have been observed toward (Ellingsen et al., 2017; Gorski et al., 2018; McCarthy et al., 2018a) can be related to the star-formation in a galaxy and, therefore, the class I masers (and their association with low-velocity shocks) can help identify mechanisms that are providing the gas fueling these starburst regions (Ellingsen et al., 2017).
5 Conclusions
We present the results of new observations toward NGC 4945 and NGC 253, detecting new components of methanol emission toward both galaxies. Evidence of variability, especially toward the new region in NGC 4945, indicates that this emission is likely the result of a maser process. This is the first reported example of variability in an extragalactic class I methanol maser and we recommend continued monitoring of these sources in order to both confirm and further quantify this variability.
We provide flux density upper-limits for the 36.2-GHz class I and 37.7-GHz class II methanol transitions toward 9 galaxies, observed as part of the original extragalactic class I methanol searches which detected NGC 253 and NGC 4945, and 3 more sources observed more recently. In the majority of sources from the older observations (C2879), sensitivity levels are not sufficient in order to rule out maser emission of the same order as is observed toward NGC 4945 or NGC 253.
We also report the results of a re-analysis of the ATCA data on Arp 220. We do not find any evidence of the 36.2-GHz methanol maser emission toward this source. It appears a combination of poor data quality and sub-optimal imaging procedures may have resulted in the original reported detection. We place a upper limit on the 36.2-GHz line of 3.5 mJy.
Acknowledgements
We thank the referee for the valuable comments which have helped improve the manuscript. The ATCA is part of the Australia Telescope which is funded by the Commonwealth of Australia for operation as a National Facility managed by CSIRO. This research has made use of NASA’s Astrophysics Data System Abstract Service. This research has made use of the NASA/IPAC Extragalactic Database (NED), which is operated by the Jet Propulsion Laboratory, California Institute of Technology, under contract with the National Aeronautics and Space Administration. This research also utilised aplpy, an open-source plotting package for python hosted at http://aplpy.github.com. This research made use of Astropy, a community-developed core Python package for Astronomy (Astropy Collaboration et al., 2013).
References
- Araya et al. (2010) Araya E. D., Hofner P., Goss W. M., Kurtz S., Richards A. M. S., Linz H., Olmi L., Sewiło M., 2010, ApJ, 717, L133
- Astropy Collaboration et al. (2013) Astropy Collaboration et al., 2013, A&A, 558, A33
- Bendo et al. (2016) Bendo G. J., Henkel C., D’Cruze M. J., Dickinson C., Fuller G. A., Karim A., 2016, MNRAS, 463, 252
- Bottinelli et al. (1985) Bottinelli L., Gouguenheim L., Paturel G., de Vaucouleurs G., 1985, A&AS, 59, 43
- Breen et al. (2010) Breen S. L., Ellingsen S. P., Caswell J. L., Lewis B. E., 2010, MNRAS, 401, 2219
- Breen et al. (2011) Breen S. L., Ellingsen S. P., Caswell J. L., Green J. A., Fuller G. A., Voronkov M. A., Quinn L. J., Avison A., 2011, ApJ, 733, 80
- Breen et al. (2013) Breen S. L., Ellingsen S. P., Contreras Y., Green J. A., Caswell J. L., Stevens J. B., Dawson J. R., Voronkov M. A., 2013, MNRAS, 435, 524
- Caswell (1997) Caswell J. L., 1997, MNRAS, 289, 203
- Chen et al. (2015) Chen X., Ellingsen S. P., Baan W. A., Qiao H.-H., Li J., An T., Breen S. L., 2015, ApJ, 800, L2
- Chen et al. (2016) Chen X., Ellingsen S. P., Zhang J.-S., Wang J.-Z., Shen Z.-Q., Wu Q.-W., Wu Z.-Z., 2016, MNRAS, 459, 357
- Chen et al. (2018) Chen X., Ellingsen S. P., Shen Z.-Q., McCarthy T. P., Zhong W.-Y., Deng H., 2018, ApJ, 856, L35
- Chou et al. (2007) Chou R. C. Y., et al., 2007, ApJ, 670, 116
- Cyganowski et al. (2009) Cyganowski C. J., Brogan C. L., Hunter T. R., Churchwell E., 2009, ApJ, 702, 1615
- Cyganowski et al. (2012) Cyganowski C. J., Brogan C. L., Hunter T. R., Zhang Q., Friesen R. K., Indebetouw R., Chandler C. J., 2012, preprint, (arXiv:1210.3366)
- Dalcanton et al. (2009) Dalcanton J. J., et al., 2009, ApJS, 183, 67
- Ellingsen et al. (2010) Ellingsen S. P., Breen S. L., Caswell J. L., Quinn L. J., Fuller G. A., 2010, MNRAS, 404, 779
- Ellingsen et al. (2014) Ellingsen S. P., Chen X., Qiao H.-H., Baan W., An T., Li J., Breen S. L., 2014, ApJ, 790, L28
- Ellingsen et al. (2017) Ellingsen S. P., Chen X., Breen S. L., Qiao H.-H., 2017, MNRAS, 472, 604
- Felli et al. (2007) Felli M., et al., 2007, Astronomy & Astrophysics, 476, 373–664
- Gao et al. (2016) Gao F., et al., 2016, ApJ, 817, 128
- Goedhart et al. (2003) Goedhart S., Gaylard M. J., van der Walt D. J., 2003, MNRAS, 339, L33
- Gorski et al. (2017) Gorski M., Ott J., Rand R., Meier D. S., Momjian E., Schinnerer E., 2017, ApJ, 842, 124
- Gorski et al. (2018) Gorski M., Ott J., Rand R., Meier D. S., Momjian E., Schinnerer E., 2018, ApJ, 856, 134
- Green et al. (2008) Green J. A., et al., 2008, MNRAS, 385, 948
- Haschick & Baan (1990) Haschick A. D., Baan W. A., 1990, ApJ, 355, L23
- Henkel et al. (2018) Henkel C., et al., 2018, A&A, 615, A155
- Hollenbach et al. (2013) Hollenbach D., Elitzur M., McKee C. F., 2013, preprint, (arXiv:1306.5276)
- Jensen et al. (2003) Jensen J. B., Tonry J. L., Barris B. J., Thompson R. I., Liu M. C., Rieke M. J., Ajhar E. A., Blakeslee J. P., 2003, ApJ, 583, 712
- Kurtz et al. (2004) Kurtz S., Hofner P., Álvarez C. V., 2004, ApJS, 155, 149
- Leurini et al. (2016) Leurini S., Menten K. M., Walmsley C. M., 2016, A&A, 592, A31
- McCallum et al. (2007) McCallum J. N., Ellingsen S. P., Lovell J. E. J., 2007, MNRAS, 376, 549
- McCarthy et al. (2017) McCarthy T. P., Ellingsen S. P., Chen X., Breen S. L., Voronkov M. A., Qiao H.-h., 2017, ApJ, 846, 156
- McCarthy et al. (2018a) McCarthy T. P., Ellingsen S. P., Breen S. L., Henkel C., Voronkov M. A., Chen X., 2018a, MNRAS, 480, 4578
- McCarthy et al. (2018b) McCarthy T. P., Ellingsen S. P., Breen S. L., Voronkov M. A., Chen X., 2018b, ApJ, 867, L4
- McEwen et al. (2014) McEwen B. C., Pihlström Y. M., Sjouwerman L. O., 2014, ApJ, 793, 133
- Moran et al. (1999) Moran J. M., Greenhill L. J., Herrnstein J. R., 1999, Journal of Astrophysics and Astronomy, 20, 165
- Olech et al. (2019) Olech M., Szymczak M., Wolak P., Sarniak R., Bartkiewicz A., 2019, MNRAS, 486, 1236
- Sakamoto et al. (2011) Sakamoto K., Mao R.-Q., Matsushita S., Peck A. B., Sawada T., Wiedner M. C., 2011, ApJ, 735, 19
- Sjouwerman et al. (2010) Sjouwerman L. O., Murray C. E., Pihlström Y. M., Fish V. L., Araya E. D., 2010, ApJ, 724, L158
- Sobolev et al. (2007) Sobolev A. M., et al., 2007, in Chapman J. M., Baan W. A., eds, IAU Symposium Vol. 242, Astrophysical Masers and their Environments. pp 81–88 (arXiv:0706.3117), doi:10.1017/S1743921307012616
- Sorce et al. (2014) Sorce J. G., Tully R. B., Courtois H. M., Jarrett T. H., Neill J. D., Shaya E. J., 2014, MNRAS, 444, 527
- Tsunekawa et al. (1995) Tsunekawa S., Ukai T., Toyama A., Takagi K., 1995, Department of Physics, Toyama Univerity, Japan
- Tully & Fisher (1988) Tully R. B., Fisher J. R., 1988, Catalog of Nearby Galaxies
- Tully et al. (2009) Tully R. B., Rizzi L., Shaya E. J., Courtois H. M., Makarov D. I., Jacobs B. A., 2009, AJ, 138, 323
- Tully et al. (2013) Tully R. B., et al., 2013, AJ, 146, 86
- Tully et al. (2016) Tully R. B., Courtois H. M., Sorce J. G., 2016, AJ, 152, 50
- Voronkov et al. (2006) Voronkov M. A., Brooks K. J., Sobolev A. M., Ellingsen S. P., Ostrovskii A. B., Caswell J. L., 2006, MNRAS, 373, 411
- Voronkov et al. (2014) Voronkov M. A., Caswell J. L., Ellingsen S. P., Green J. A., Breen S. L., 2014, MNRAS, 439, 2584
- Wang et al. (2014) Wang J., Zhang J., Gao Y., Zhang Z.-Y., Li D., Fang M., Shi Y., 2014, Nature Communications, 5, 5449
- Whiting (2012) Whiting M. T., 2012, MNRAS, 421, 3242
- Wilson et al. (2011) Wilson W. E., et al., 2011, MNRAS, 416, 832
- Yamauchi et al. (2012) Yamauchi A., Nakai N., Ishihara Y., Diamond P., Sato N., 2012, PASJ, 64, 103
- Yusef-Zadeh et al. (2013) Yusef-Zadeh F., Cotton W., Viti S., Wardle M., Royster M., 2013, ApJ, 764, L19
- van der Walt (2011) van der Walt D. J., 2011, AJ, 141, 152
| Target | Right Ascension | Declination | ||
|---|---|---|---|---|
| Source | ∘ | () | (Mpc) | |
| MRK 1029 | 02 17 03.57 | +05 17 31.40 | 9076 | 133 |
| NGC 1052 | 02 41 04.80 | –08 15 21.00 | 1510 | 18.0[1] |
| J0350–0127 | 03 50 00.35 | –01 27 57.70 | 12322 | 185 |
| UGCA 116 | 05 55 42.63 | +03 23 31.80 | 789 | 10.3[2] |
| NGC 5765b | 14 50 51.50 | +05 06 52.00 | 8333 | 126[3] |
| TXS 2226–184 | 22 29 12.50 | –18 10 47.00 | 7520 | 108 |