Millimeter-sized Dust Grains Appear Surviving the Water-sublimating Temperature in the Inner 10 au of the FU Ori Disk
Abstract
Previous observations have shown that the 10 au, 400 K hot inner disk of the archetypal accretion outburst young stellar object, FU Ori, is dominated by viscous heating. To constrain dust properties in this region, we have performed radio observations toward this disk using the Karl G. Jansky Very Large Array (JVLA) in 2020 June-July, September, and November. We also performed complementary optical photometric monitoring observations. We found that the dust thermal emission from the hot inner disk mid-plane of FU Ori has been approximately stationary and the maximum dust grain size is 1.6 mm in this region. If the hot inner disk of FU Ori which is inward of the 150–170 K water snowline is turbulent (e.g., corresponding to a Sunyaev & Shakura viscous 0.1), or if the actual maximum grain size is still larger than the lower limit we presently constrain, then as suggested by the recent analytical calculations and the laboratory measurements, water-ice free dust grains may be stickier than water-ice coated dust grains in protoplanetary disks. Additionally, we find that the free-free emission and the Johnson B and V bands magnitudes of these binary stars are brightening in 2016–2020. The optical and radio variability might be related to the dynamically evolving protostellar or disk accretion activities. Our results highlight that hot inner disks of outbursting objects are important laboratories for testing models of dust grain growth. Given the active nature of such systems, to robustly diagnose the maximum dust grain sizes, it is important to carry out coordinated multi-wavelength radio observations.
1 Introduction
In the theoretical studies about interstellar dust grain growth (e.g., Ossenkopf 1993; Ormel et al. 2009; Wada et al. 2009; Okuzumi et al. 2012; Banzatti et al. 2015; Pinilla et al. 2017; Vorobyov et al. 2018, 2020; Molyarova et al. 2021) and the interpretation of the observations of (sub)millimeter dust spectral indices (e.g., Zhang et al. 2015), it has been conventional to assume or to conjecture that water-ice coated dust grains are stickier than water-ice free grains. It has been generally believed that grown dust with maximum grain sizes () greater than 1 mm (e.g., chondrules, pebbles) tend to form outside of the water snowline (T150–170 K; e.g., Pollack et al. 1994). It has also been considered that in the inner, higher temperature regions of protoplanetary disks, grown dust will likely fragment back down to smaller sizes when water-ice is sublimated (e.g., Banzatti et al. 2015; Cieza et al. 2016; Pinilla et al. 2017). These assumptions used to be supported by the results of the earlier laboratory experiments (e.g., Gundlach et al. 2011; Gundlach & Blum 2015 and references therein). However, they are inconsistent with analytical calculations (e.g., Kimura et al. 2015). An open issue related to this is how to form rocky planets or asteroids that are deficient in water.
| Date | Band | API rmsaaThe RMS phase measured with the Atmospheric Phase Interferometer (API; for more details see https://science.nrao.edu/facilities/vla/docs/manuals/oss2013A/performance/gaincal/api). The API a 2-element interferometer separated by 300 meters, observing an 11.7 GHz beacon from a geostationary satellite. The default API rms upper limits for the X, Ku, K, Ka, and Q band observations are 30∘, 15∘, 10∘, 7∘, and 5∘. | uv-range | IF1/IF2 Freq. range | FluxbbLimited to the inner 400 uv-distance to suppress the effects of the resolved structures of 3C147./Passband/Gain calibrators | Synthesized beamccMeasured from multi-frequency synthesis images generated using aggregated continuum bandwidths and Natural (i.e., Briggs Robust2) weighting. | rms noiseccMeasured from multi-frequency synthesis images generated using aggregated continuum bandwidths and Natural (i.e., Briggs Robust2) weighting. |
|---|---|---|---|---|---|---|---|
| (UTC) | (∘) | (meters) | (GHz/GHz) | (; ∘) | (Jy beam-1) | ||
| Project Code: JVLA/20A-106 | |||||||
| 2020-Jun-26 | X | 4.5-4.6 | 290-9470 | 7.98-11.96/ | 3C147/J0532+0732/J0532+0732 | 086064; -50∘ | 6.0 |
| 2020-Jun-28 | Ku | 4.7-17 | 240-9600 | 12.01-15.98/15.98-18.16 | 3C147/J0532+0732/J0532+0732 | 089044; -32∘ | 4.6 |
| 2020-Jul-03 | K | 5.1-9.1 | 610-9630 | 18.10-22.02/21.97-25.90 | 3C147/J0532+0732/J0532+0732 | 033029; -72∘ | 12 |
| 2020-Jul-04 | Ka | 9.8-12 | 190-10380 | 29.10-33.02/32.98-37.02 | 3C147/J0532+0732/J0532+0732 | 032020; -52∘ | 22 |
| 2020-Jul-07 | Q | 4.6 | 180-10460 | 40.10-44.02/43.98-48.02 | 3C147/J0532+0732/J0532+0732 | 022015; -60∘ | 85 |
| 2020-Sep-30 | Ka | 1.3 | 200-10550 | 29.10-33.02/32.98-37.02 | 3C147/J0532+0732/J0532+0732 | 023019; -23∘ | 12 |
| Project Code: JVLA/20B-423 | |||||||
| 2020-Nov-15 | K | 2.6-4.7 | 200-34420 | 17.98-22.02/21.97-26.02 | 3C147/3C84/J0532+0732 | 031013; -80∘ | 6.5 |
| Ka | 2.6-4.7 | 28.98-33.02/32.98-37.02 | 3C147/3C84/J0532+0732 | 0190086; -73∘ | 12 | ||
Growing modern laboratory experimental results conversely suggested that water-ice free dust grains are stickier or at least as sticky as the water-ice coated ones (Gundlach et al. 2018; Steinpilz et al. 2019; Musiolik & Wurm 2019; Pillich et al. 2021). Gundlach et al. (2018) pointed out that the inconsistency between the modern and the earlier experimental results (e.g., Gundlach et al. 2011) may be because the ice-coated dust samples in the earlier experiments were thermally processed due to the imperfect low-temperature operational techniques. If this is indeed the case, then grown dust may be prone to form inward rather than outward of the water snow line in protoplanetary disks (for some related discussion see Pinilla et al. 2021; Molyarova et al. 2021; Musiolik 2021 and references therein). Since the laboratory dust samples do not necessarily have the same composition and morphology (e.g., porosity) as interstellar dust, it remains essential to constrain the spatial distribution of in protoplanetary disks by observations to fully address the issue of dust grain growth and terrestrial planet-formation.
Intriguingly, many recent Atacama Large Millimeter/Submillimeter Array (ALMA) multi-frequency or polarization observations towards the spatially extended, lower-temperature (e.g., 100 K) regions of protoplanetary disks reported 100 m (Kataoka et al. 2016; Stephens et al. 2017; Bacciotti et al. 2018; Hull et al. 2018; Ohashi et al. 2018; Liu 2019; Ohashi & Kataoka 2019; Tazaki et al. 2019; Lin et al. 2020; Ueda et al. 2020; Ohashi et al. 2020; Mori & Kataoka 2021). As pointed out by Sierra & Lizano (2020), in the regions covered by these previous ALMA observations, millimeter-sized dust grains are more likely to be absent rather than hidden due to vertical grain-size segregation. These recent observational results are in contrast to the earlier observational studies which claimed the detection of 1 mm sized dust grains (for a review see Testi et al. 2014). This discrepancy was because the earlier observational studies did not consider the effects of dust scattering opacity self-consistently (Kataoka et al. 2015; Liu 2019; Zhu et al. 2019). The latest observational measurements of based on self-consistent consideration of dust scattering opacity might indicate that water-ice coated dust grains are not as sticky as previously considered, supporting the latest laboratory experimental results.
Constraining in regions inside the water snowlines is the natural next step to test whether or not the water-ice free dust grains are indeed sticky enough to grow or to survive in such regions. However, these regions are very small in general (e.g., 1–2 au scales; see the discussion in Mori et al. 2021 and references therein). Limited by the sensitivity and angular resolution of the present date facilities, it is rather difficult to make such measurements.
The accretion outburst type young stellar objects (YSOs), namely the FUors (see Audard et al. 2014 for a review), present elevated dust temperature thanks to their likely enhanced accretion rate (by several orders of magnitude relative to the quiescent Class II YSOs). For example, the archetypal FUor, FU Ori (407.5 pc; Gaia Collaboration et al. 2016, 2021), has maintained a 10-5–10-4 yr-1 accretion rate (e.g., Pérez et al. 2020 and references therein) over the last 80 yrs. In their protoplanetary disks, water snowlines may expand to become considerably larger than those of typical protoplanetary disks (e.g., see the analysis of dust temperature in Liu et al. 2017, 2019b). This can also be supported by the detection of abundant gas-phase water line emission (e.g., Fuente et al. 2020). When observed with sufficient spatial resolution and signal-to-noise ratio, these objects open a unique window to examine grain growth inward of water snowlines (see also the discussion in the proceeding by Okuzumi et al. 2021).
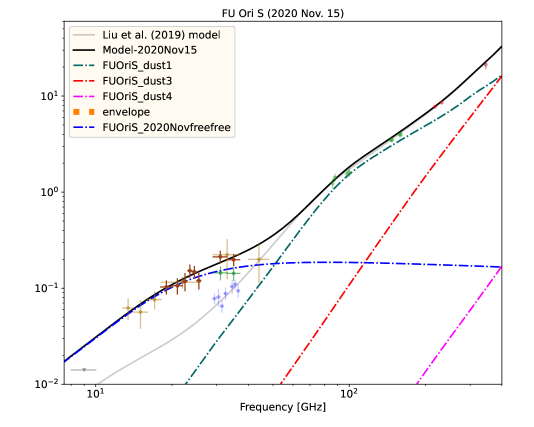
Concurrent with the aforementioned laboratory frameworks (Gundlach et al. 2018; Steinpilz et al. 2019; Musiolik & Wurm 2019; Pillich et al. 2021), previous spectral energy distribution (SED) analyses of FU Ori reported tentative detection of 2–3 mm sized dust grains in its 300–400 K hot inner disk, which is characterized by a flux density bump at the 30 GHz observing frequency (Liu et al. 2019b; for some introductory background on the SED features, see Appendix A). The SED analysis by Liu et al. (2019b) also found that in the lower temperature (e.g., K) regions of the FU Ori disk is 200 m, which may indicate that the millimeter-sized dust formed in-situ in the hot inner disk.
The interpretation of Liu et al. (2019b) was uncertain because their observations (1) only sparsely sampled the 8–50 GHz frequency range (c.f. Liu et al. 2017), (2) were impacted by the atmospheric delay bug that might not have been fully corrected111Details of this issue has been given in https://science.nrao.edu/facilities/vla/data-processing/vla-atmospheric-delay-problem. , and (3) could potentially be confused by the time variability of the radio or (sub)millimeter emission (e.g., Liu et al. 2018; Johnstone et al. 2018; Francis et al. 2019; Wendeborn et al. 2020).
To confirm the 30 GHz bump in the SED of FU Ori, and to tighten the constraints on the dust column density and , we have observed the radio continuum using the NRAO Karl G. Jansky Very Large Array (JVLA) at X band (8-12 GHz), Ku band (12-18 GHz), K band (18-26 GHz), Ka band (29-37 GHz), and Q band (40-48 GHz). These observations also simultaneously covered its close companion, FU Ori S.
|
|
|
|
|
|
|
|
|
|
|
|
|
|
|

|
During these observations, we serendipitously detected radio variability from both FU Ori and FU Ori S, which we immediately followed up with complementary optical observations using the Nanshan One-meter Wide-field Telescope (NOWT) and the Lulin Super Light Telescope (SLT). This work also utilizes the ASAS-SN Variable Stars Database (Shappee et al. 2014; Kochanek et al. 2017; Jayasinghe et al. 2018, 2019). The details of our radio and optical observations are provided in Section 2. The observational results are presented in Section 3. We provide a qualitative interpretation of our observational results in Section 4.1. Section 4.2 and 4.3 introduces our strategy to quantitatively realize our interpretation with SED modeling, as well as the model results. We discuss the physical implication of our results in Section 4.4. In Section 4.5, we briefly discuss how this experiment can be improved in the near future. Our conclusion is given in Section 5. Some introduction of the dust SED features related to the millimeter sized grains is provided in Appendix A. Appendix B summarizes our new JVLA observations together with the previous ALMA observations towards FU Ori and FU Ori S. Based on the dust temperature profiles derived from the observations, we provide our hypothesis about the turbulence strength in the FU Ori hot inner disk in Appendix C.
2 Observations
2.1 JVLA
2.1.1 Operation
We performed JVLA standard continuum mode observations toward FU Ori in the B and BnA array configurations in 2020 (project codes: 20A-106, 20B-423). The pointing and phase referencing centers for our target source is R.A. 054522.357 (J2000), decl. +09∘04′124 (J2000). We employed the 3 bit sampler to take the full RR, RL, LR, and LL correlator products. The dates, projected baseline ranges, frequency coverages at the two intermediate frequency (IFs), the adopted flux, passband, and complex gain calibrators of our observations are summarized in Table 1.
The original design of these observations was to observe at all selected frequency bands close in time. To maximize the chance of being dynamically scheduled in suitable weather conditions, the high frequency bands (K, Ka, and Q) were observed for relatively short durations, tolerating the high thermal noise. Because our target source is not ideal for the observations in the summer semester, the noise levels we actually achieved were still considerably higher than requested. Although some individual measurements are rather uncertain, jointly using all data points still provides very indicative constraints on the emission mechanisms (Section 4.1, 4.2). There is room to improve the observing strategy, which will be discussed in Section 4.5.
The initial observations were made from June 26 to July 07 (hereafter the 2020 July observations). The Atmospheric Phase Interferometer (API) rms for the Ka band observations during the 2020 July observations was considerably higher than the default limit. Therefore, the Ka band observations were repeated on September 30. The Ka band data taken in the 2020 July observations are usable although with some caution (more discussion in Section 3).
When comparing these new Ka band observations with the Ka band data published in Liu et al. (2017), we found that both FU Ori and FU Ori S could be undergoing radio emission flares (more in Section 3). Therefore, we requested to follow up this event at K and Ka bands with Director’s Discretionary Time (DDT), which was executed on November 15, 2020. These DDT observations also attempted to constrain polarization properties. In addition, we launched the complementary optical monitoring observations (Section 2.2).
2.1.2 Calibration
We manually followed the standard data calibration strategy using the Common Astronomy Software Applications (CASA; McMullin et al. 2007) package, release 5.6.2. The brightest source in our observations was our absolute flux calibrator, 3C147. The gain calibrator J0532+0732 has 1 Jy flux densities at all observing wavelengths and was not spatially resolved. Given that 3C147 was spatially resolved in our observations at K, Ka, and Q bands, we instead took J0532+0732 as our delay and passband calibrators for all observations and used only the inner 400 data of 3C147 when referencing the absolute fluxes. We also utilized the built-in image models for 3C147 during the calibrations. After implementing the antenna position corrections, weather information, gain-elevation curve, and opacity model, we bootstrapped delay fitting and passband calibrations, and then performed complex gain calibration. We applied the absolute flux reference to our complex gain solutions, and then applied all derived solution tables to the target source.
For the K and Ka band observations taken in November of 2020, we based our observations on 3C147 to solve the cross-hand delay and absolute polarization position angles using only the inner 400 data, and took 3C84 as a low polarization percentage calibrator when solving the leakage term (i.e., the D-term).
|
|
2.1.3 Imaging
We performed the zeroth order (i.e., nterm1) multi-frequency synthesis imaging (Cornwell, 2008; Rau & Cornwell, 2011) using the CASA task tclean. From the previous ALMA and JVLA observations (e.g., Hales et al. 2015; Liu et al. 2017, 2019b; Pérez et al. 2020), the deconvolved sizes (diameters) of individual of FU Ori and FU Ori S are 005 at the target frequencies. Therefore, FU Ori and FU Ori S are approximately point sources in our new JVLA observations given that there was not much sampling at 3000 baselines (Table 1; c.f. the right panel of Figure 1 of Pérez et al. 2020). Therefore, we utilized all visibilities to maximize sensitivity.
These two point sources are separable as long as there is adequate sensitivity at baselines longer than 150 . For our observations (Table 1), they can be clearly separated in the observations at K (18–26 GHz), Ka (29–37 GHz), and Q (40–44 GHz) bands; at Ku band (12–18 GHz) they can still be separated although we have to image with Briggs Robust0 or uniform weighting; they cannot be separated in the X (8–12 GHz) band observations.
To assess the data quality, we first produced the naturally weighted (i.e., Briggs Robust2.0) broad-band continuum images for each epoch of observations and at each band using the overall aggregated bandwidths. For each epoch of observations, we also tried producing images with narrower frequency widths for a better constraint on spectral indices. We chose the frequency widths such that both FU Ori and FU Ori S can be detected at 5–10, as far as it is possible. Yet we did not try a complicated strategy to optimize the frequency widths which may make it less straightforward for the future observations to compare with the present one.
We had to image the K, Ka, and Q band data taken during the 2020 July observations using the aggregated frequency widths due to the relatively poor weather condition; the Ku and X bands data were imaged with every 2 GHz frequency width222These frequency widths are approximated values. Sometimes a few consecutive spectral windows may be flagged due to very serious radio frequency interference (RFI). Nevertheless, a small error in the frequency width is negligible since the thermal noise is inversely scaled with the square root of frequency width. This has been taken in to consideration when evaluating the centroid frequencies of the images.. We separately imaged the two IFs of the Ka band data taken on September 30 and November 15 (i.e., each 4 GHz bandwidths). At K band the flux densities of FU Ori and FU Ori,S both increase with frequency (i.e., the signal was stronger at higher frequency). Therefore, for the K band data taken on November 15, the lower 4 GHz IF was imaged with each 2 GHz frequency width. while the upper 4 GHz IF was imaged with each 1 GHz frequency width.
2.1.4 Measurements of flux densities
The flux densities of FU Ori and FU Ori S were measured from the images produced with narrower frequency widths. We tried to measure them using the three methods: (1) directly quoting the peak intensities which is appropriate for point sources as long as the atmospheric phase errors were sufficiently calibrated, (2) performing 2D Gaussian fits, and (3) summing flux densities from the clean components. Visibility fitting is advantageous when the image is limited by dynamic range. However, it has less immunity to confusion and artifacts in general. Therefore, we did not adopt visibility fitting.
We found that for observations taken in good weather conditions, the measurements based on methods (1) and (2) are consistent within 1 with no identified systematic bias. For noisy observations, method (2) sometimes yielded ambiguous fitting results if we do not fix the values of source positions and angular scales; on the other hand, fixing source positions and angular scales will make method (2) essentially not different from method (1). Method (3) in general systematically underestimates the flux density by 1, which is expected since the clean algorithm cannot distinguish weak signal from thermal noise.
In the end, we adopted method (1) for the Q, Ka, K, and X (unresolved) bands observations. We refer to Section 5.4 of Howell (2006) which discussed why the approach of using the information within a small aperture may yield better accuracy when the signal-to-noise ratio is not high.
The images of FU Ori and FU Ori S are confused in the Robust0 weighted Ku band images, which can be approximated by neither a single point source nor two separated point sources. Therefore, for the individual FU Ori and FU Ori S, we took the flux densities summed from the clean components and added 0.5 as their flux densities. We confirmed that the summed flux density of FU Ori and FU Ori S is consistent with the flux density integrated above the 2 contour in the restored clean image. When analyzing the Ku band results, we adopted the 1.5 error bars rather than 1 to take into account the larger measurement uncertainties.
We consider that the strategy of measuring flux density we applied is optimal for our specific observations and science purpose. We argue that there is not yet a general ideal strategy for all observations.
|
|
The directly measured 29–37 GHz flux density on July 04 should be regarded as a lower limit of the true flux density owing to the high API (and phase) rms (see Table 1; Section 2.1). For a rough correction, we nominally assumed that the phase rms at the 11.7 GHz observing frequency and the 300 m baseline length of the API is in the range of (APIAPI)–(APIAPI), where API9.8∘, API12.0∘, and API7.0∘ are the observed minimum, maximum, and the default limiting API rms for the Ka band observations (Table 1). In addition, we assumed that the amplitude of phase fluctuation scales as (Asaki et al., 1998) and (e.g., Carilli & Holdaway 1999333The assumed power-law index is in between that of the theoretical 2D and 3D Kolmogorov turbulence.), respectively, where and are observing frequency and baseline length. Thereby, at the 33 GHz median observing frequency, the expected residual rms phase errors at the 5000 m median projected baseline length of our Ka band observations on July 04 (Table 1) is 30∘–60∘. Based on Equation 7.34 of Thompson et al. (1986), we expect that the observed 33 GHz flux density had been reduced to 50%–86% of the true values due to the phase errors. In the following analysis, we will adopt the corrected 29–37 GHz flux density for July 04 if not specifically mentioned.
2.2 Optical monitoring observations
We have performed time-series photometric observations at Johnson BVR bands using the Super Light 0.4 m Telescope (SLT) located in Taiwan444For technical details see http://www.lulin.ncu.edu.tw/english/index.htm. and the Nanshan One-meter Wide-field Telescope (NOWT) located in Xinjiang (Bai et al., 2020).
The Johnson R band data were calibrated by referencing to the VRI photometry of Ori star-forming region reported by Dolan & Mathieu (2002). The Johnson B and V bands data were calibrated by referencing to the AAVSO Photometric All Sky Survey (APASS) DR9 (Henden 2016) which is consistent with the calibration of the ASAS-SN survey (Shappee et al. 2014; Kochanek et al. 2017), except that when we evaluated the VR color, both the Johnson V and R bands data were calibrated by referencing to VRI photometry of the Ori star-forming region. The calibrations based on APASS and the VRI photometry of Ori star-forming region yielded a difference of 0.01-0.02 magnitudes, which is negligible for our science case.
3 Results
3.1 Radio observations
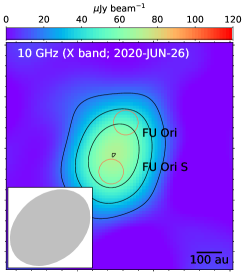
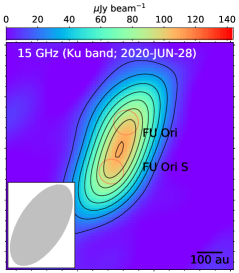
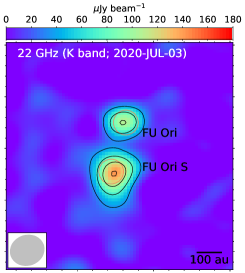
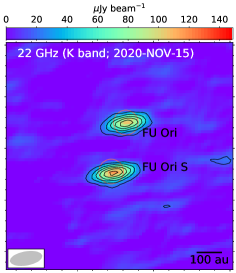
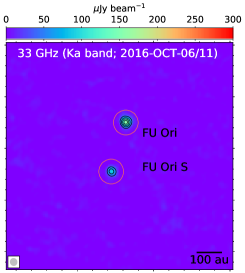
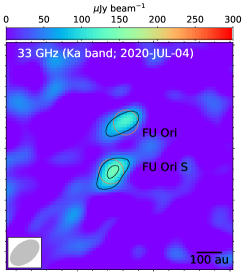
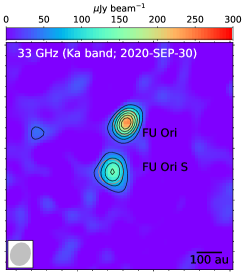
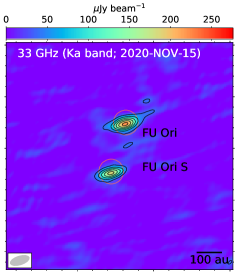
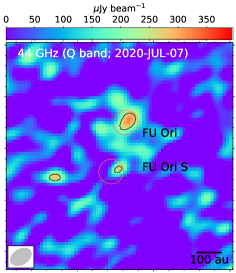
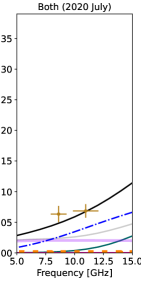
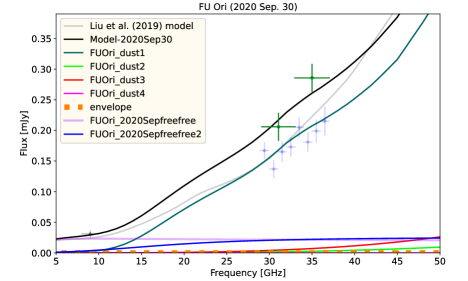
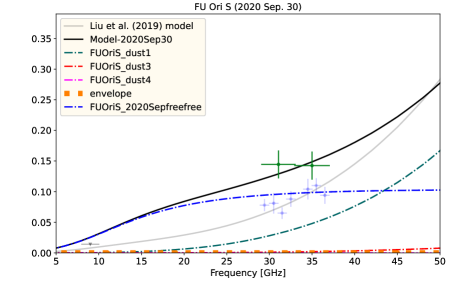
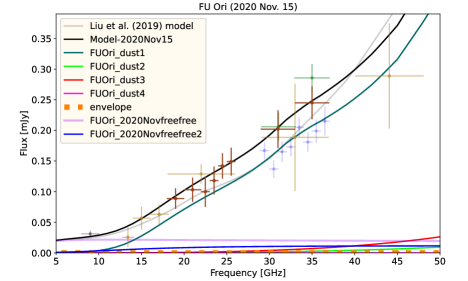
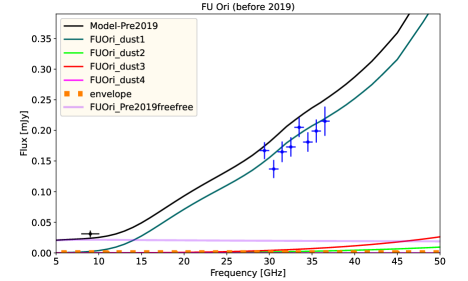
Figure 1 shows the naturally weighted new JVLA Stokes I continuum images produced using the aggregated bandwidths (Section 2.1) as well as the JVLA Ka band image presented in Liu et al. (2017). The achieved synthesized beams and rms noises in the new JVLA images are summarized in Table 1. From the observations on 2020 November 15, we did not find 3 detection of Stokes Q, U, and V. Figure 2 shows the radio flux densities measured from FU Ori, FU Ori S, and from both sources when they cannot be spatially separated by our JVLA observations.
In Figure 1, the locations of the 8–12 GHz and 12–18 GHz peaks in our new observations are closer to FU Ori S, meaning that FU Ori S was brighter than FU Ori at these two frequency bands. However, in the 8–10 GHz observations in 2016 September, FU Ori was marginally detected while FU Ori S was not (Liu et al. 2019b). Moreover, the 8.4 GHz nondetection in the data taken in 1988 October constrained the 3 upper limit on the individual of FU Ori and FU Ori S to be 50 Jy (Rodriguez et al. 1990). The 8–12 GHz flux density we detected on 2020 June 26 is higher than the upper limits reported by Rodriguez et al. (1990) and is also higher than the flux density of FU Ori in 2016 September (Figure 2). These observations indicate that FU Ori S has become brighter at low frequency.
The flux densities of these two sources are comparable in the two epochs of 18–26 GHz observations although the significant frequency variations at this band complicated the comparison (Figures 1, 2). FU Ori is brighter than FU Ori S at 40–48 GHz band and at higher frequencies (Hales et al. 2015; Liu et al. 2019b; Pérez et al. 2020). In summary, FU Ori presents a steeper spectral slope than FU Ori S at 8–48 GHz frequency.
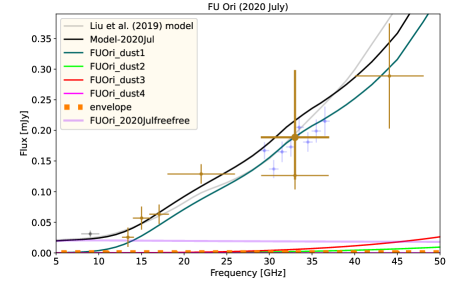
In the 2020 July observations (Figure 2), the 18–26 GHz and 40–48 GHz flux densities of FU Ori are comparable with the modeled spectral energy distribution published by Liu et al. (2019b). Due to the phase errors, the directly measured 29–37 GHz flux density on July 04 was slightly lower than the model prediction and also lower than the measurements taken in 2016 October (Liu et al. 2017, 2019b). As presented in the top row of Figure 2, the corrected (c.f., Section 2.1.4) 29–37 GHz flux density of FU Ori on July 04 is indeed more consistent with the model prediction and the measurement taken in 2016 October despite the enlarged error bars. The September 30 and November 15 observations consistently showed that at 29–37 GHz, FU Ori had become slightly brighter than how it was in 2016 October.
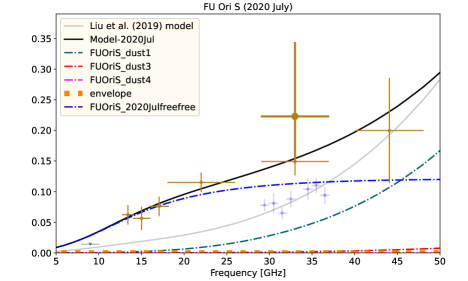
The 29–37 GHz flux densities of FU Ori S on July 04 both before and after correcting for the effect of phase errors were above the model prediction of Liu et al. (2019b) and the measurements taken in 2016 October. In the 2020 July observations, we also detected high 12–26 GHz flux densities from FU Ori S. From the point of view of SED modeling (Section 4.2), it is hard to reconcile these new observations with the 8–10 GHz band upper limit in 2016 September unless we consider time variability. The 29–37 GHz flux density of FU Ori S from 2020 July to November was persistently higher than the measurement of 2016 October and may also present some variability within this time period.
The variability of FU Ori S and FU Ori has a consequence on their relative brightness at 29–37 GHz: FU Ori appeared fainter than FU Ori S in 2020 July (Figure 1) but was brighter than FU Ori S on September 30 and November 15. Our images of two point sources are unlikely to be limited by intensity dynamic range. Therefore, the observed variation in relative brightness can hardly be attributed to calibration errors or imaging artifacts.
3.2 Optical observations
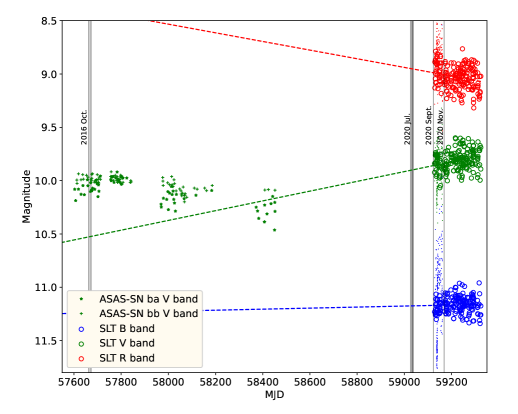
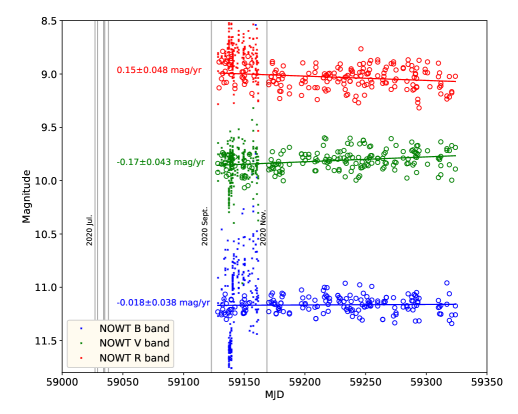
Figure 3 shows the results of the optical photometric monitoring observations. The Johnson BVR bands observations taken with the SLT and NOWT are reasonably consistent with each other. We will derive the optical colors based on the SLT data which have lower noise.
The ASAS-SN data show that the Johnson V band magnitude of the FU Ori and FU Ori S binary system had an increasing trend from late 2016 to late 2018 or early 2019 (i.e., the Johnson V band flux has a decreasing trend). The Johnson V band magnitudes detected in 2020-2021 appeared lower than the values in late 2018. The linear regressions for the SLT data indicate that both the Johnson B and V band magnitudes had a decreasing trend in 2020-2021, while the Johnson R band magnitudes had an increasing trend. The extrapolation of the Johnson V band regression line shows good consistency with the latest ASAS-SN Johnson V band measurements (Figure 3), indicating that the decreasing trend of the Johnson V band magnitude has not much changed since late 2018 or early 2019.
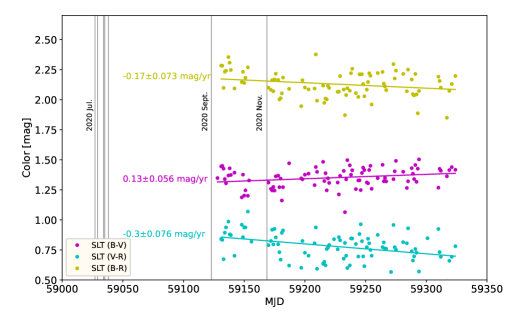
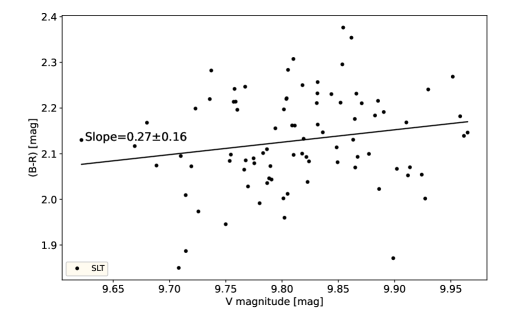
Figure 4 shows the Johnson B-V, V-R, and B-R colors observed by the SLT in 2020-2021, and compares the Johnson B-R color with Johnson V band magnitude over this time period. The trends appear complicated. The Johnson B-V color was becoming redder over time while the Johnson V-R and B-R colors were becoming bluer over time. The Johnson B-R color appears positively correlated with the Johnson V band magnitude (i.e., the source appeared bluer when it was brighter at Johnson V band). Our tentative interpretation for these optical colors will be provided in Section 4.
| aa1 sr 4.251010 square arcsecond. | |||
|---|---|---|---|
| (K) | (g cm-2) | ( sr) | (mm) |
| FUOri_dust1 | |||
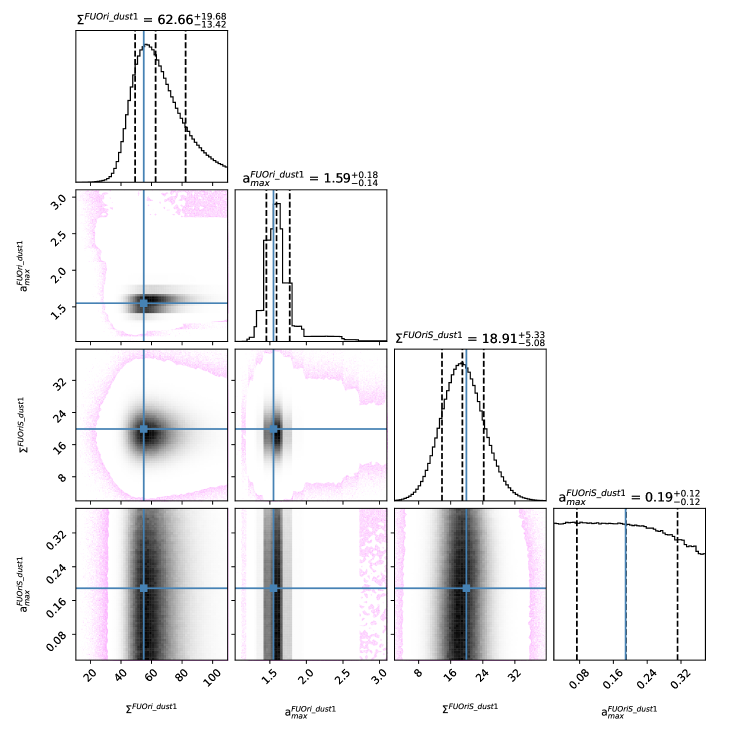
| 370 | 63 | 4.1 | 1.59 |
| FUOriS_dust1 | |||
| 150 | 19 | 4.1 | 0.19 |
| FU Ori free-free | FU Ori free-free2 | FU Ori S free-free | |||||||
|---|---|---|---|---|---|---|---|---|---|
| Time | EM | EM | EM | ||||||
| (UTC) | (103 K) | (cm-6pc) | (10-14sr)aa1 sr 4.251010 square arcsecond. | (103 K) | (cm-6pc) | (10-14sr)aa1 sr 4.251010 square arcsecond. | (103 K) | (cm-6pc) | (10-14sr)aa1 sr 4.251010 square arcsecond. |
| 2016 Sept./Oct. | 6.8 | 1.7 | 1.5 | 12 | 3.1 | 3.1 | |||
| 2020 July | 7.1 | 1.9 | 1.3 | 15 | 2.8 | 7.8 | |||
| 2020 September 30 | 5.9 | 1.8 | 1.4 | 7.6 | 1.9 | 2.0 | 15 | 2.7 | 6.9 |
| 2020 November 15 | 6.7 | 2.6 | 1.0 | 7.6 | 1.1 | 1.5 | 19 | 7.3 | 5.2 |
4 Discussion
Due to the complexity of our new observations and the existing data, and for the sake of making this manuscript self-contained, we first qualitatively discuss our overall interpretation in Subsection 4.1. We realized our interpretation by constructing SED models and employed the Markov chain Monte Carlo (MCMC) method to optimize the free parameters in the models, which is introduced in Subsection 4.2. The MCMC results are introduced in Subsection 4.3. Based on the results, we also briefly discuss the deficiency of our present experimental setup and make a suggestion of how to improve those in the near future in Subsection 4.5.
4.1 Qualitative interpretation
The absence of Stokes Q, U, and V detection (Section 3.1) is consistent with that our new JVLA observations detected predominantly thermal emission. The fractional radio flux density variations over a few months timescales are not large (Figure 2), which also make the dominant emission mechanisms appear more like the thermal ones rather than nonthermal (e.g., see Liu et al. 2014 and references therein for more discussion).
The previous X-ray observations have detected time varying high energy activities from our target sources (Skinner et al. 2010). The X-ray emission may also be accompanied by nonthermal radio emission. Nevertheless, such X-ray and nonthermal radio emissions should be emanated from regions that are very close to the protostellar surfaces. In actively accreting YSOs, such nonthermal radio emission is often fully obscured by free electrons (c.f., Feigelson & Montmerle 1999 and references therein). Therefore, it is sensible to interpret the observed 8–48 GHz flux densities by combinations of dust thermal emission and free-free emission.
Given that dust emission is unlikely to be prominent at 8–12 GHz (c.f., Liu et al. 2017, 2019b), the observed X band flux density at any time tightly constrains the total budget of free-free emission in the overall SED of FU Ori and FU Ori S at that time. At higher frequencies, the portions of flux densities that cannot be interpreted with free-free emission have to be attributed to dust thermal emission.
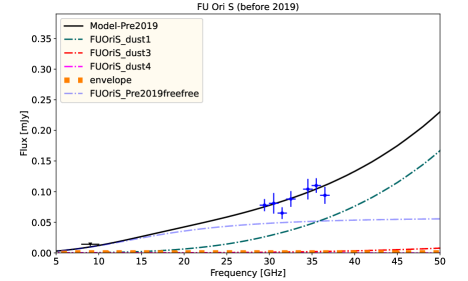
The stationary part of the 40 GHz emission of FU Ori S can be explained with the dominating optically thick dust emission mixed with some optically thin free-free emission; otherwise, it can be dominated by free-free emission over a range of optical depths (see also the discussion in Section 4.1 of Liu et al. 2017). Previously, Liu et al. (2019b) considered the former to be more likely in the interpretation of their 29–37 GHz data taken in 2016. However, it appears that the latter is more consistent with our new 8–48 GHz observations. Such a difference may be the consequence that the free-free emission of FU Ori S has become brighter from 2016 to 2020 while its dust emission has not changed considerably. The 8-48 GHz spectral indices of FU Ori S became lower when it became brighter in 2020. In other words, the variable part of the 8–48 GHz SED of FU Ori S appears to have a flat spectral index which is indeed more consistent with free-free emission (more in Subsections 4.2, 4.3.2).
We note that the 8–10 GHz upper limit in 2016 September (Figure 2) indicates that some stationary dust emission may still be necessary for the interpretation of the 8–48 GHz SED of FU Ori S. Our rather weak (although significant) 8–12 GHz detection on June 26 and the ALMA 86–160 GHz observations presented in Liu et al. (2019b) also disfavor interpreting the 8–48 GHz SED of FU Ori S solely by optically thick free-free emission (Section 4.2).
The SED of FU Ori is steeply rising (with frequency) at 10–20 GHz, meaning that dust emission dominates over free-free emission at this frequency range and at higher frequencies (Figure 2). Its spectral slope increases more slowly around 25–30 GHz and becomes steep again at 40 GHz, which may be consistent with having a persistent dust SED bump at 30 GHz (see also Appendix B the discussion in Section 4.4.1 of Liu et al. 2019b). Interpreting the flatter spectral index of FU Ori at 30 GHz by a high contribution of free-free emission instead of a dust SED bump will easily make the extrapolated 8–12 GHz flux density exceed what had been detected. Being dominated by dust instead of free-free emission may also explain why FU Ori appears more stationary than FU Ori S at 40–48 GHz (Figure 2).
The small radio variability of FU Ori, if not due to absolute flux calibration errors, can be explained by time varying free-free emission, or parametrically time varying dust temperature (), dust column density (), and . In reality, and are unlikely to vary significantly on timescales of only a few years unless is varied dramatically enough to sublimate dust or to change dust properties (e.g., Stammler et al. 2017; Molyarova et al. 2021). Physically, the time variations of free-free emission and are not mutually exclusive.
For the FU Ori and FU Ori S binary system, optical and infrared emission is dominated by the disk of FU Ori instead of the protostellar photosphere of either of these two sources (Hartmann & Kenyon, 1996; Turner et al., 1997; Wang et al., 2004; Liu et al., 2016; Takami et al., 2018; Laws et al., 2020). When is varying with time, we may expect the flux densities at optical/infrared and radio bands to vary in the same sense. In addition, the variability should appear considerably more prominent at the optical and infrared bands since the radio observations are well in the Rayleigh-Jeans limit. At optical, infrared, and (sub)millimeter bands, the observed variation on decadal timescales is small (Section 2.2, 3; Herbig 1977; Kolotilov & Petrov 1985; Green et al. 2016a; Liu et al. 2018). From Figure 3 it can also be seen that the optical V band magnitude has not varied significantly until mid-April of 2021555FU Ori became a day-time source after then, which cannot be observed from ground based optical observatories.. The small variability at optical and/or infrared bands can be attributed to very small variations of the disk temperature of FU Ori; otherwise, it may also be due to the more significant variability of the less luminous source of the binary system, FU Ori S. It is sensible to consider that the dust-mass weighted averages of , , and in the FU Ori disk are approximately invariant at least during the time period of our new JVLA observations and attribute its variability at 8–48 GHz to free-free emission.
A caveat is that when is changed due to the time varying non-passive heating mechanisms such as viscous heating, adiabatic compression, or shocks (e.g., Evans et al. 2015; Vorobyov et al. 2018, 2020), the effects can be initially more prominent in the deeply obscured, higher density disk mid-plane, during which only the (sub)millimeter or radio emission is brightened. Eventually, the heat will still be transported to the disk surface. However, in this case, the brightening at optical or infrared bands may lag. With the present observational data, there is still the possibility that in the mid-plane but not at the surface of the FU Ori disk was significantly changed over the time period of our JVLA observations. Our optical photometric monitoring observations have covered an extended time period after the latest epoch of the JVLA observations (Figure 3), which have made this possibility relatively unlikely. To strictly rule out this possibility, it might be necessary to extend the optical and infrared photometric monitoring observations for another year or two.
4.2 SED modeling
The noise levels of our new measurements at 8–48 GHz do not permit deriving spectral indices using every two adjacent data points in the frequency domain. Because the spectral indices of dust and free-free emission are not rapidly changing with frequency, the SED models presented in this section utilize the constraints given by all data points to view overall trends of spectral index variations over broad frequency ranges. The central goal of our SED modeling is to constrain the values in the dusty disks around FU Ori and FU Ori S.
We produced SED models for the new 8–48 GHz observations and for the JVLA and higher frequency (ALMA, SMA, Herschel, Spitzer, VLTI/GRAVITY) observations presented in Liu et al. (2019b). To avoid overfitting the infrared spectra, we followed the approach of Liu et al. (2019b) to artificially reduce the weight by assigning the flux errors of the Herschel/SPIRE, Herschel/PACS, and Spitzer/IRS data to be 1000, 10, and 1 times the detected fluxes. This adjustment is needed since fitting the details of these infrared spectra requires models of fine 3-dimensional temperature profiles (e.g., Yang et al. 2018; Zhang et al. 2021), which are very degenerated when the target sources are not spatially resolved and are not dominated by passive heating. Another reason that we should avoid overfitting the Herschel spectra is that Herschel spectra are inevitably confused by the foreground/background dust emission. Since the main focus of the present work is on interpreting the interferometric data in the Rayleigh-Jeans limit, it is sufficient to approximate with averaged temperatures without deriving the detailed temperature profiles based on the infrared spectra.
We assume that the 50 GHz emission is dominated by dust thermal emission and thus is approximately stationary. The 8–48 GHz measurements are treated as four independent epochs of data: the 2016 September/October observations reported in Liu et al. (2017) and Liu et al. (2019b) are treated as one single epoch; the 2020 July observations are treated as the second epoch; the 2020 September 30 and November 15 observations are treated as two independent epochs. We attempted to fit these data with stationary dust emission components and time varying free-free emission components.
4.2.1 Emission mechanisms
Due to the complicated physics involved in the accretion outburst of FU Ori, it is not feasible to describe the radial and profiles with analytical forms. To facilitate SED modeling, some simplification is necessary. We built on the strategy outlined in Section 4.2 of Liu et al. (2019b) to model the radio and higher frequency SEDs of FU Ori and FU Ori S with components (described in Section 4.2.2) of dust and free-free emission, taking into consideration their mutual obscuration. The physical properties within each component were assumed to be uniform. Specifically, we quoted their Equation 3 to describe the overall flux densities () of FU Ori and FU Ori S as:
| (1) |
where is the flux density of the dust or free-free emission component , and is the optical depth of the emission component to obscure the emission component . Physically, each dust emission component can represent a parcel of dust at a certain (radial, azimuthal, and vertical) location in the FU Ori or FU Ori S disk. The abstracted geometric information is provided by .
We approximated the spectral profile and optical depth of free-free emission according to the formulation outlined in Mezger & Henderson (1967) and Keto (2003). In this way, the spectral profile depends on three free parameters: electron temperature (), emission measure (EM)666The emission measure EM , with being the electron number density, and is the linear size scale of the free-free emission component along the line of sight., and solid angle ().
We quoted the DSHARP size-dependent dust opacity tables which were constructed for the purpose of modeling circumstellar dust emission. These tables assumed that dust grains are morphologically compact, which may be supported by the recent ALMA observations (e.g., Tazaki et al. 2019). In addition, the dust grains with and without water ice (Warren, 1984) are composed of astronomical silicates (Draine, 2003), troilite, refractory organics (Henning & Stognienko 1996; see Tabe 1 of Birnstiel et al. 2018). The default (i.e., water-ice coated) DSHARP opacity was quoted for dust components with 170 K temperatures; otherwise, the ice-free opacity table was quoted.
We assumed that the dust grain size () distribution follows in between the minimum and maximum grain sizes (, ) and is 0 beyond this range. We fixed to mm nominally since the spectral profile of dust is not sensitive to this parameter. The values of was optimized together with dust temperature (), column density (), and projected solid angle () to fit the observations. We followed Equation 6 of Birnstiel et al. (2018) to evaluate the dust mass opacities, and followed Equations 10–20 of Birnstiel et al. (2018) to approximate the dust spectral profile, taking anisotropic dust self-scattering into consideration.
We assumed that all dust components are approximately face-on given that we do not have enough measurements to constrain the inclinations as free parameters, which will not qualitatively change our analysis. We optimize as a free parameter instead of iteratively solving it using 3-dimensional radiative transfer since the innermost 10 au regions of FUors or any other actively accreting YSOs may be dominated by viscous heating (Calvet et al. 1991; Liu et al. 2019b; Takami et al. 2019; Liu 2021; Labdon et al. 2021).
4.2.2 Emission components
|
|
As described by Equation 1, our approach is to approximate the dust and free-free emission sources as a finite number of emission components. The total number of emission components is limited by the independent observational measurements we presently possess.
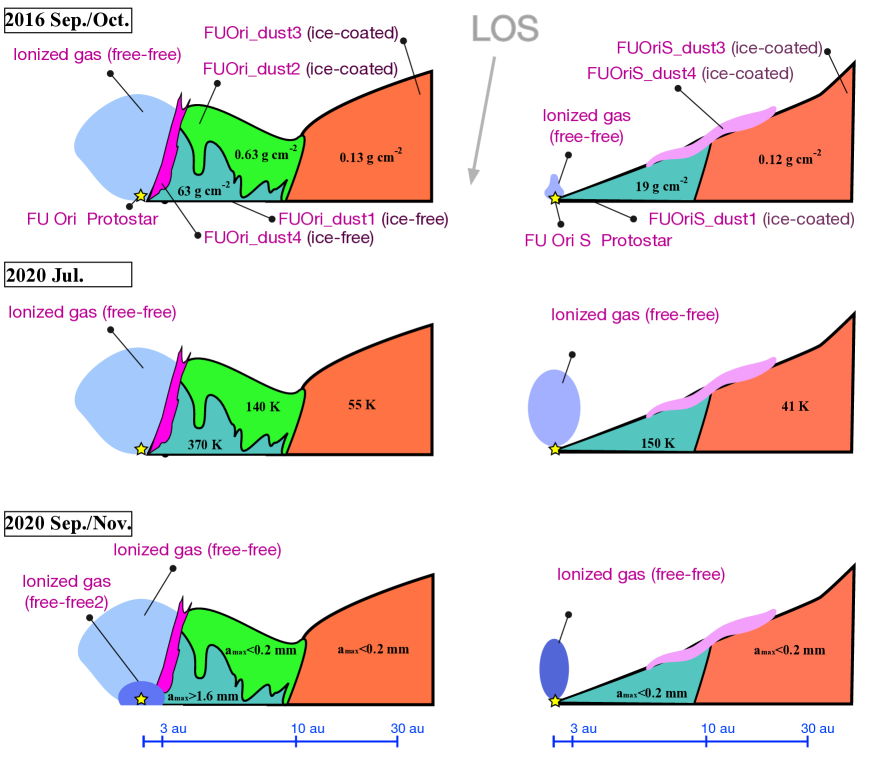
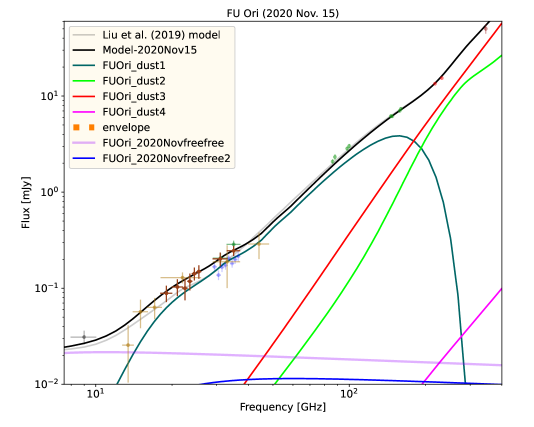
For FU Ori, Liu et al. (2019b) found that their JVLA 8–10 GHz and 29–37 GHz observations and ALMA 86–160 GHz observations, the General Relativity Analysis via VLT InTerferometrY (GRAVITY) instrument on the Very Large Telescope Interferometer (VLTI) 2–2.45 m observations, and the ALMA 225 and 345 GHz observations reported in Hales et al. (2015) and Pérez et al. (2020) can be described by a free-free emission component (FUOri_freefree) and only four dust components namely FUOri_dust1–4: FUOri_dust4 represents the very high temperature surface of the inner 3 au disk; FUOri_dust1 represents the mid-plane of the 10 au disk which is obscured by the lower temperature surface FUOri_dust2; and FUOri_dust3 is the lower temperature, lower column density outer disk. Similarly, their presented observations on FU Ori S can be described by a free-free emission component (FUOriS_freefree) and three dust components (FUOriS_dust1,3 and 4): FUOriS_dust1 and 4 represent the mid-plane and surface of the inner 10 au disk while FUOriS_dust3 is the lower temperature, lower column density outer disk. These dusty disk components are illustrated in Figure 5. After including a spatially extended common envelope component that is obscuring all the aforementioned emission components but was resolved out by JVLA and ALMA, the Herschel and Spitzer spectra reported in Green et al. (2006, 2013, 2016b), and Submillimeter Array (SMA) observations published in Liu et al. (2018) can also be reasonably well described.
After some trial adjustment of free parameters, we confirmed that those previous observations of FU Ori and FU Ori S, the JVLA observations taken in 2020 July, September 30, and November 15 can be approximated by the stationary dust emission components that are very similar to those in the models of Liu et al. (2019b), and the time variable free-free emission components.
In contrast to Liu et al. (2019b), we included one additional optically thick free-free emission component (FUOri_freefree2) in the model for FU Ori (i.e., using two free-free emission components in total) to artificially avoid interpreting its 8–48 GHz variability by the time varying (more in Subsection 4.3). The projected solid angle of FUOri_freefree2 corresponds to a 1 au diameter, which is 2 orders of magnitude smaller than that of optically thin free-free emission component, FUOri_freefree. The emission of FUOri_freefree2 was negligible in 2016 September/October and in 2020 July. Physically, FUOri_freefree2 may represent some radiatively ionized gas located close to the host protostar, or one or multiple thermally ionized gas knots associated with some hot spots in the FU Ori disk (illustrated in the bottom row of Figure 5).
In the MCMC optimization (Section 4.2.3), we found that the samplers tended to converge to a seemingly unreasonably high dust column density (200 g cm-2) and the relatively high values (e.g., 3-5 mm) in the inner 10 au FU Ori disk if FUOri_freefree2 is not included when is forced to be a constant of time. The high and values help enhance the dust emission at low frequency bands. Presently, we cannot rule out the possibility that the FUOri_freefree2 component was unnecessary. The of FU Ori derived from our MCMC models with two free-free emission components may (or may not) be underestimated by a factor of up to 3 (Subsection 4.3).
While we presently do not include more dust emission components, imperfections in the models may still be attributed to oversimplification, or measurement errors (e.g., absolute flux errors). In particular, likely has significant spatial dependence in the innermost few au. Some related discussion for the case of FU Ori S will be provided in Subsection 4.3.2. The values of may also have spatial dependence in regions where dust grain growth/fragmentation/migration/trapping is efficient (e.g., Vorobyov et al. 2018). The values of and derived based on the MCMC fits for the integrated SEDs represent the intensity-weighted averaged values.
4.2.3 Optimization
We used the MCMC fitting routine emcee to optimize the model free parameters and to help assess the uncertainties of those parameters. Both FU Ori and FU Ori S were fitted together because they share the same envelope. We adopted the model parameters of FUOri_dust2,3,4, FUOriS_dust3,4, and the common envelope quoted from Liu et al. (2019b) without advancing them, as these dust components have little contribution over the 8–48 GHz frequency range of our new JVLA observations. They are primarily constrained by the previous 50 GHz observations that can be reasonably well fit by the modeling parameters of Liu et al. (2019b).
The components FUOri_dust1 and FUOriS_dust1 may significantly contribute to the flux densities detected at 8–48 GHz (see Figure 5 of Liu et al. 2019b). Using MCMC and assuming flat priors, we seek (1) the solutions of FUOri_dust1 and FUOriS_dust1 that are optimal for all epochs of observations (i.e., these two components do not vary from epoch to epoch), and (2) the parameters to describe the free-free emission in individual epochs of observations.
It turned out that the additional free-free component (i.e., FUOri_freefree2) was only necessary for the data from 2020 September and 2020 November. The parameters (e.g., electron temperature, solid angle) for the free-free emission components are degenerate since our JVLA observations (Section 2) were not dedicated to constraining them. Nevertheless, as long as the observed SED profiles can be reproduced by the models, such degeneracy does not seriously impact our discussion about dust properties.
The and parameters of FUOri_dust1 and FUOriS_dust1 are also degenerated to some extent. For example, the fits can converge to a rather large value (e.g., as far as permitted by the Herschel spectra) and small , although this degeneracy turned out to be not particularly serious in our MCMC fits. In fact, the upper limit of has been constrained by the high angular resolution JVLA and ALMA observations (Liu et al. 2017; Pérez et al. 2020). Therefore, the and given by our fits should be regarded as upper and lower limits, respectively. The actual values of can be smaller if dust is concentrated in spatially unresolved substructures (e.g., rings, crescents, etc). On the other hand, should not exceed the 1500 K sublimation temperature in any case.
We performed two rounds of MCMC fits: in the first round all free parameters were iteratively advanced; in the second round we marginalized the and of FUOri_dust1,2 and all the parameters for the free-free emission by adopting the best fits of the first round, and only advanced the and of FUOri_dust1 and FUOriS_dust1 iteratively. This strategy helps yield better and more comprehensive samplings for and . In addition, in the second round, we only compared the models with the JVLA data taken in 2020 to alleviate the potential biases due to neglecting the possibility of the long-term time variability of .
In the first round, we used 150 walkers with 12000 iterative steps each; the results from the first 2000 steps were discarded. In the second round, we used 300 walkers with 80000 iterative steps each; again, the results from the first 2000 steps were discarded. For each walker, we rejected the steps which yielded 9 GHz flux densities of FU Ori S that are higher than the 3 upper limit in 2016 September (Figure 2). The results are introduced in the following subsection.
|
|
4.3 Modeling results
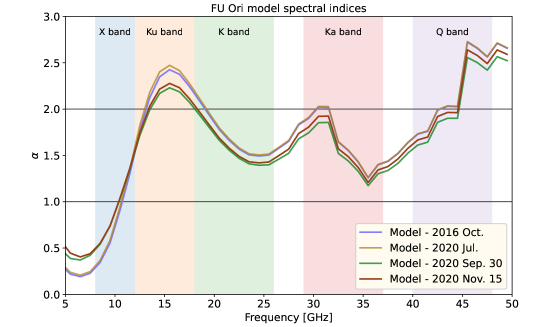
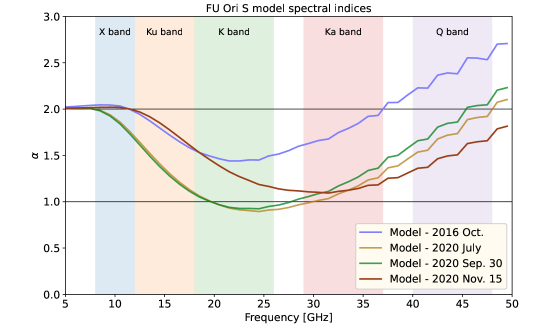
Tables 2 and 3 summarize the results of our MCMC fits, which include the 50th percentile of the samples as the best fit for each parameter and define the errors based on the 16th and 84th percentiles. Figure 6 shows the corner plot and the MCMC posteriors (Section 4.2.3) for the and parameters of the FUOri_dust1 and FUOriS_dust1 components (Table 2; c.f., Figure 5). The flux densities of the individual dust and free-free emission model components to fit the 2020 observations are presented in Figure 2; those to fit the earlier observations (i.e., reported by Liu et al. 2017, Liu 2019) are presented in Figure 7. The 8–48 GHz spectral indices of the models for each epoch of observations are presented in Figure 8. The results of individual models of FU Ori and FU Ori S are discussed in the following.
4.3.1 FU Ori
The new model (with 2 free-free emission components and four dust emission components) reproduced reasonably well the 8–48 GHz flux densities of FU Ori observed in 2020 (Figure 2). The newly derived , and of FUOri_dust1 are consistent with the previous derivation of Liu et al. (2019b). This is expected because the newly measured flux densities at 8–48 GHz are comparable to the previous model prediction. Our new measurements at 15–26 GHz better constrained the of FUOri_dust1, making its value 15% higher than the derivation of Liu et al. (2019b). From Figure 6 it can be seen that some solutions with further higher also can be consistent with the JVLA observations. Our update of over the results of Liu et al. (2019b) does not significantly impact the fits for the 50 GHz data (see also Appendix B) since FUOri_dust1 becomes very optically thick and is obscured by the disk surface component FUOri_dust2 at high frequencies.
Our updated value for FUOri_dust1 is 1.59 mm (see Figure 6), which is slightly lower than the 2.4 mm value reported by Liu et al. (2019b). The uncertainty of is mainly resulted from the uncertainty of the models for free-free emission. The value of becomes smaller when stronger free-free emission is assumed in the fits of the 8–48 GHz SED.
When we only use one free-free emission component in the model for FU Ori instead of two, the marginal distribution of the MCMC posteriors for the of FUOri_dust1 peaks at 2.7 mm and is skewed towards higher values (e.g., the values up to 5 mm are also reasonably probable). In general, assuming strong free-free emission will yield over-intensities at X band (8–12 GHz) and Ku band (12–18 GHz) as compared with the observations. Therefore, the MCMC fits (with a flat prior) favor the larger value and suppressing the free-free emission component(s). The marginal distribution of the MCMC posteriors for the values is skewed towards larger sizes even when we adopted two free-free emission components (Figure 6) although in this case the high tail is only detectable with a large number of MCMC samples. The best fit of given in Table 2 thus may be regarded as a conservative lower limit.
Comparing the upper panel of Figure 8 with Figure 9 also shows that it is very difficult to fit our JVLA observations with 1 mm in FUOri_dust1, which will yield too low flux densities and too high spectral indices at 8–48 GHz unless the assumed is as high as a few times 102 g cm-2. Such a high value implies that the overall dust mass within the 10 au radius of FUOri_dust1 is a few times 103 Earth-mass (M⊕). With a conventionally assumed gas-to-dust mass ratio of 100, the corresponding overall disk mass is higher than 0.3 . This seems unrealistic given that the mass of the host protostar itself may be only 0.3–0.5 (Zhu et al. 2007).
We conclude that the mid-plane of the inner 10 au FU Ori disk is populated with grown dust with 1–3 mm. We do not rule out the presence of components with larger grain sizes (e.g., 1 cm). To robustly test grain growth at the regime of 1 cm, the observations need to better sample the 6 cm wavelengths (i.e., 5 GHz frequencies) which will require the sensitivity and angular resolution of the next generation Very Large Array (ngVLA; Murphy et al. 2018) or the Square Kilometer Array (SKA; e.g., Ilee et al. 2020).
Our new model still has tension with the 29–37 GHz observations taken in 2016 (Figure 7) because it yields a slight over-intensity of dust emission in that frequency range. The discrepancy between the new model and the data is small enough to be attributed to absolute flux calibration errors of the JVLA observations or the attenuation of the observed flux density due to the delay bug in those previous JVLA observations (Section 1). There is no strong evidence that observational/calibration effects significantly impacted our analyses because such tension did not occur in the fits for FU Ori S (Figure 7). Otherwise, such a discrepancy may be explained by that the of the FUOri_dust1 component (i.e., averaging over the disk mid-plane in the inner 10 au) is up to 10% higher in 2020 than in 2016. Incorporating this possibility in our MCMC fits (Section 4.2.2, 4.2.3) by lowering the of the FUOri_dust1 component in 2016 by 10% will not yield any non-trivial implication, and thus was not implemented.
The possibility that at least some parts in the inner 10 au region of the FU Ori disk were warming up may be supported by the optical monitoring observations which show lower V band magnitude in 2020 than in 2016 September/October. The positive correlation between the Johnson B-R color and the V band magnitude (Figure 4; Section 3.2) also supports that the FU Ori disk, which has been the dominating optical emission source, was warming up during 2020-2021. So how we can interpret the increasing trend of the Johnson R band magnitude (Figure 3) and the complicated trends of the Johnson B-V, V-R, and B-R colors in 2020-2021? A tentative hypothesis is that the outer, lower-temperature regions of the disk that were dominating the Johnson R band magnitude was cooling down. Such cooling reduced the thermal pressure, which subsequently led to inflows of gas that induced heating (by compression, viscous heat dissipation, or shocks) in an inner region that was dominating the Johnson V band magnitude. The gas inflows may be thermally ionized and may enhance the accretion and ionizing irradiation of the host protostellar, leading to enhanced free-free emission. The regions which are dominating the optical emission were on 1 au spatial scales (Labdon et al. 2021) where the dynamic timescales are comparable with the timescales of the photometric monitoring presented in Figure 3. Alternatively, the brightening in the optical BV bands may also partly be attributed to the reduction of dust extinction. This can be due to the depletion of small dust grains, which can either be because of the ongoing dust grain growth or enhanced sublimation.
Modeling the optical light curves requires self-consistently solving the vertical and radial thermal and small-dust density structures, which is beyond the scope of the present paper. Uncertainty in our interpretation is that there might be a systematic bias between the ASAS-SN, SLT, and NOWT data calibration although there is no evidence to demonstrate that this is indeed the case. The lower Johnson V band magnitude in 2020 could also be due to that FU Ori S instead of FU Ori was brightened (Subsection 4.3.2). To discern these possibilities, it is necessary to conduct new multi-frequency monitoring observations.
|
|

|
|

|
|
|
|
4.3.2 FU Ori S
The newly derived and for FUOriS_dust1 are also consistent with the previous derivation of Liu et al. (2019b). The JVLA observations taken in 2016 and 2020 did not provide a strong constraint on the of FUOriS_dust1 due to the very significant contribution of free-free emission relative to dust emission at 8–48 GHz. As a consequence, the marginal posterior distribution of does not present an obvious peak (e.g., as the case of FUOri_dust1; see Figure 6). Instead, the distribution is skewed towards 0.2 mm grain sizes such that the 50th percentile of our samplers (i.e., given in Table 2) should be regarded as a loose upper limit.
The upper limit of is (weakly) constrained due to that FUOriS_dust1 dominates the emission at 90–230 GHz where the observed spectral indices were close to 2.0 (Liu et al. 2019b). For a value of 0.2 mm, the effect of dust scattering helps suppress the spectral index at 90–230 GHz, making FUOriS_dust1 fit the previous ALMA observations more easily. However, if of FUOriS_dust1 is 0.3 mm, the dust self-scattering will yield the too significant anomalously high/low spectral indices at 90–230 GHz (c.f. discussion in Appendix Section A), leading to tension with the previous ALMA observations.
Due to the high noise of our new JVLA observations at 29–48 GHz, the value of FUOriS_dust1 is marginally consistent with 0.1 mm. However, when is smaller than 0.1 mm, the effect of dust scattering is very week at 90–230 GHz such that it requires a very high dust column density to yield a 2.0 spectral index at 90–230 GHz. The high column density will in turn lead to a high contribution of optically thin dust emission at 29–48 GHz, making the spectral index of our model approach the high-end allowed by the present observations. We expect the parameter space (for FUOriS_dust1) with 0.1 mm to be ruled out once the S/N at 29–48 GHz is improved. Therefore, in our second round of MCMC fits, we artificially forbade such possibilities in order to better resolve the more probable parameter space. Tightening the lower limit of can also be achieved by obtaining additional 5 au resolution observations at 345–700 GHz (e.g., using ALMA). Finally, we cannot rule out the possibility that there is 1 mm sized dust in the mid-plane of the FU Ori S disk, which may only be robustly diagnosed when the free-free emission become a few times weaker.
As compared with the fits of Liu et al. (2019a), the of FUOriS_dust1 is reduced from 32 g cm-2 to 19 g cm-2 (Table 2). The update of does not affect the fits at 50 GHz due to that FUOriS_dust1 is optically thick at high frequency (see also Appendix B). The effect of lowering the value of is significantly reducing the contribution of dust emission at 8–48 GHz which is compensated by the brighter free-free emission component in our new fits.
Our present best fit may yield a too high spectral index at 29–48 GHz as compared with the observations taken in 2020 July and November 15. This is not a fundamental failure of our modeling strategy. A better fit to the data can be achieved by dividing FUOriS_dust1 into two internal components with different and values (but without changing the overall projected solid angle): the spatially more compact one with a higher value (0.5–1 mm) efficiently obscures the free-free emission at 30–50 GHz while the spatially more extended one with 0.2 mm dominates the dust emission at 90–250 GHz. In fact, there has been some hint that this should be the case, which was why the index 2 of the FUOriS_dust components has been reserved (in Liu et al. 2019b and the present work). Physically, this can be illustrated either by a significant radial dependence of either and/or within FUOriS_dust1 (e.g., due to the inward migration of grown dust). Since the averaged of FUOriS_dust1 (Table 2) is close to the 150–170 K sublimation temperature of water-ice, another appealing conjecture would be that 1 mm sized dust grains are forming inward of the snowline of FU Ori S. In our baseline experimental design, we expected these two dust components to be separable in the SED fits if the achieved noise is low enough such that we can image the 29–37 GHz and 40–48 GHz bands in each 2 GHz baseband (e.g., the 29 GHz data were too dominated by free-free emission to help constrain dust properties). With the noise level we actually achieved, sub-dividing FUOriS_dust1 into two internal components will yield a larger number (8) of free parameters than the (5) constraints (JVLA Ka, Q bands and ALMA Band 3, 4, 6), making the MCMC fits too degenerate to be comprehensive.
In our best fits, the free-free emission component is optically thick at 20-30 GHz and becomes optically thin at the higher frequency where dust emission becomes dominant. This leads to a minimized spectral indices at 20–30 GHz (see the right panel of Figure 8). The spectral indices observed in 2020 are lower than those observed in 2016 September/October due to that the brightened free-free emission in 2020. This might be related to a temporarily enhanced accretion rate of FU Ori S that resulted in enhanced ionizing radiation. This also partly or fully explains the enhanced emission of this binary system at Johnson V band (Figure 3; Section 3.2). The values of and EM of FUOriS_freefree may both be changing with time. This may also be the case for FU Ori, although the degeneracy in determining the parameters of free-free emission is higher in the source which is dominated by dust emission.
4.4 Implication
The origin of the 1 mm sized dust grains in the hot inner disk of FU Ori remains uncertain. These millimeter-sized dust grains survived the high temperature in the inner few au FU Ori disk without fragmenting back down to smaller sizes (e.g., 100 m), supporting that pebbles, planetesimals, and/or the Earth-like terrestrial planets can form in-situ (e.g., for a thorough discussion see Liu & Ji 2020 and references therein).
If water-ice free dust grains are fragile (e.g., Gundlach et al. 2011; Gundlach & Blum 2015), then the coagulation or survival of the millimeter-sized grains may require the inner few au FU Ori disk to be not turbulent (e.g., maintaining a magnetorotational instability (MRI) dead zone such that dust grains do not collide with each other at high velocities; for an example see model 2 of Molyarova et al. 2021; c.f., Vorobyov et al. 2020). This might be contradictory with the observations of the radial temperature profile (Liu et al. 2019b; Labdon et al. 2021) which can be consistent with that the FU Ori disk is turbulent inward of the 10 au radius (). The comparison of the 1 year rise time of FU Ori with numerical simulations (e.g., Figure 2 in Kadam et al. 2020 and Figure 7 Vorobyov et al. 2020) also indicate that at least the innermost part of the FU Ori disk is very viscous (which maybe due to that it is turbulent).
Otherwise, water-ice free dust grains might be sticky. The stickiness of dust grains can be characterized with the fragmentation velocity that is higher for stickier grains (for a review see Birnstiel et al. 2016). Assuming that the maximum grain size is limited by the fragmentation barrier, the material density of dust grains 3.0 g cm-3, dust and gas are perfectly thermalized, then following Equation 34 of Birnstiel et al. (2016), we can derive the lower limits of by assuming that the gas-to-dust mass ratio is 100. We note that in protoplanetary disks, in general, the values of can potentially be considerably lower than 100 although the existing observational constraints are very uncertain (c.f., Miotello et al. 2017 and references therein). Adopting the dust column density, temperature, and obtained from our SED fitting for FUOri_dust1 (Table 2), the assumptions of the Sunyaev & Shakura viscous values 0.01, 0.1, and 1.0 will correspond to the lower limits of 2.3, 7.4, and 23 m s-1, respectively. These values are already higher than that of the previously considered poorly sticky rocky grains (1 m s-1; Blum & Wurm 2000). If in reality the effective is 0.1 (see Appendix C for some hypothesis about the values of ), our lower limit of will support the results of the latest analytical calculations (Kimura et al. 2015) and laboratory experiments (Gundlach et al. 2018; Steinpilz et al. 2019; Musiolik & Wurm 2019). Conversely, if we adopt the indicated by the latest laboratory experiments (Gundlach et al. 2018; Steinpilz et al. 2019; Musiolik & Wurm 2019; Pillich et al. 2021), then we might consider the inner 10 au region of FU Ori to be turbulent with an effective in the range of 0.1–1. Finally, we note that Hubbard (2017) pointed out that the molten dust grains in the specific environment where the temperature is modestly above 1000 K may be sticky enough to bypass the bouncing and fragmentation barriers.
4.5 How to improve this experiment?
Growing evidence has shown that the radio and/or (sub)millimeter flux densities of FUors can vary with time (e.g., Liu et al. 2018; Johnstone et al. 2018; Francis et al. 2019; Wendeborn et al. 2020). In addition, our present work and the measurements published in Liu et al. (2019b) indicate that the spectral profiles of FUors can present complicated features at 8–350 GHz and higher frequencies, although the interpretation for the higher frequency measurement may be ambiguous to some extent in any case due to the high optical depths.
To robustly diagnose and dust column density within the snowline of FUors, we suggest that it is important to obtain sensitive and simultaneous flux density measurements at 8–50 GHz, accompanied by some SED measurements at 90–350 GHz. Considering the sensitivities and the site (weather) condition of the present and upcoming facilities, a feasible approach in the near future is to use ALMA Band 1 (Hwang et al. 2012) to observe at 30–50 GHz on a target source for a few hours, coordinating with triggered JVLA observations to take lower-frequency data at the same time. The JVLA observations over a few hours’ duration can interleave with X, Ku, and K band observations. The ALMA observations can be complemented by snapshots at Band 3 or 4 and snapshots at Band 6 or 7777For this science case, snapshots are sensitive enough for the ALMA Band 3–10 receivers. The limitation is that the ALMA cryogenic system only permits activating 3 receivers at a time. One possibility to permit simultaneously observing at more frequency bands in the future may be developing the sub-arrays capability..
The development of wider bandwidth capabilities (e.g., ALMA Band 2+3, Gonzalez et al. 2016 and the coordination with the next generation facilities including the ngVLA (e.g., Andrews et al. 2018) and SKA (e.g., Braun et al. 2015; Carilli 2015) will further improve the precision of these studies and increase schedule flexibility. Combining the observations of the ngVLA and SKA, one can achieve (sub)milli-arcsecond angular resolutions and 1 Jy beam-1 rms noise at centimeter bands for a large number of protoplanetary disks, which will be particularly elucidating for the physical processes of pebble formation.
5 Conclusion
We observed the accretion outburst YSO, FU Ori, and its companion FU Ori S, using the JVLA at X (8–12 GHz), Ku (12–18 GHz), K (18–26 GHz), Ka (29–37 GHz), and Q (40–48 GHz) bands around 2020 July, at Ka band on 2020 September 30, and at K and Ka bands on 2020 November 15. We have performed the complementary Johnson BVR bands optical photometric monitoring observations using the SLT and NOWT. We found that:
-
1.
The new radio observations and the previous radio and (sub)millimeter observations towards FU Ori indicate that the maximum dust grain size is 1.6 mm in its inner 10 au, 400 K hot inner disk where water-ice likely has been sublimated. Grown dust either formed in-situ in the hot inner disk, otherwise migrated to the hot inner disk and survives the high temperature. We note that the latter case is not inconsistent with the theoretical timescale estimates of Schoonenberg et al. (2017) since it does not require grown dust to start piling up in the inner 10 au region only after the onset of the FU Ori outburst.
-
2.
The constrained lower limit of in the FU Ori hot inner disk implies that either this region remains to harbor an MRI dead zone with low turbulence (i.e., corresponding to 0.01), or the fragmentation velocity of the water-ice free dust grains in the protoplanetary disks is considerably higher than that of the previously considered poorly sticky rocky grains (1 m s-1; Blum & Wurm 2000). The latter is true if the actual value of is higher than the lower limit derived from our observations, the hot inner disk is turbulent (e.g., 0.01), or if the gas-to-dust mass ratio is lower than 100 (which are not mutually exclusive). The recent analytical calculations (Kimura et al. 2015) and laboratory experiments (Gundlach et al. 2018; Steinpilz et al. 2019; Musiolik & Wurm 2019; Pillich et al. 2021) indicated that of the water-ice free dust grains in the protoplanetary disks can be 10 m s-1.
-
3.
The observed value in the inner 10 au FU Ori S disk (150 K) is 100–200 m. Due to the confusion of the relatively strong free-free emission in FU Ori S at low frequencies, we cannot rule out the possibility that there are millimeter-sized or larger dust grains in the disk mid-plane. We cannot verify this possibility either.
-
4.
The free-free emission in FU Ori S is brighter in 2020 than in 2016 September, leading to the significantly varying 8–48 GHz flux densities. The optical Johnson V band magnitude of the binary system also presents small variations and might be slightly brighter in 2020 than in 2016. These radio and optical variabilities may be partly attributed to the variable accretion activities of FU Ori S although they appeared not as dramatic as the onset of the FU Ori outburst.
-
5.
The 8–48 GHz flux density of FU Ori might also be higher in 2020 than in 2016 October although we cannot rule out the possibility that this is due to some observational or calibration artifacts. Otherwise, the observed 8–48 GHz variability may be explained by very slight temperature variation of the FU Ori disk, or the formation of some optically thick free-free emission knots around the disk. These two possibilities are not mutually exclusive and may be both related to viscous heating, adiabatic compression, or shock in the FU Ori disk.
Coagulating water-ice coated dust grains, although is taking place in the environment of molecular clouds (e.g., Chen & Graham 1993) is not necessarily the most efficient or the only mode of dust grain growth in protoplanetary disks. The importance of our result is that it provides a possibility to understand why the terrestrial planets (e.g., Earth, Mars) and the asteroid-belt objects in the inner Solar System are deficient in water.
Appendix A Spectral index features related to millimeter sized dust
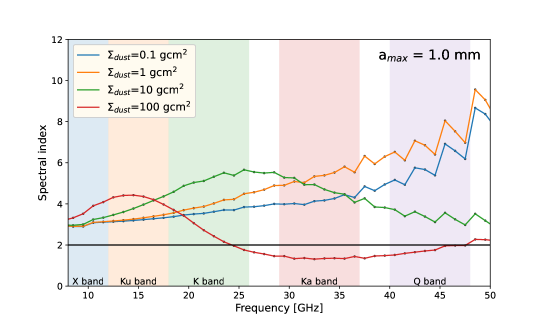
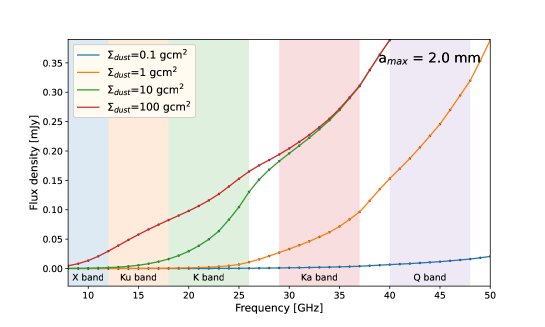
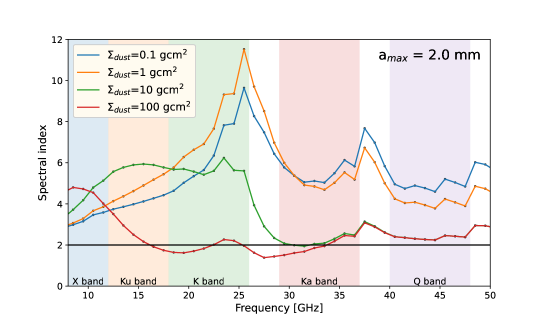
When dust grains grow to millimeter sizes or beyond, the Rayleigh limit ( ) is shifted into the 0–50 GHz frequency coverage of the JVLA. In this case, the effective dust scattering opacity (i.e., excluding forward scattering; ) can become 1 order of magnitude higher than the absorption opacity (e.g., Kataoka et al. 2015; Birnstiel et al. 2018; Liu 2019; Zhu et al. 2019). The frequency variation of albedo (defined as /(+)) then starts playing a role in changing the spectral indices. In this case, the shape of the dust SED in the frequency coverage of the JVLA is complicated because it is no longer always a monotonic function of frequency.
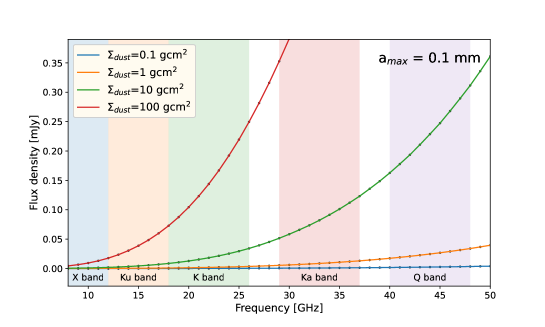
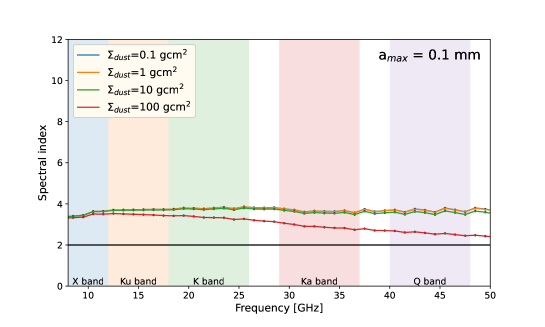
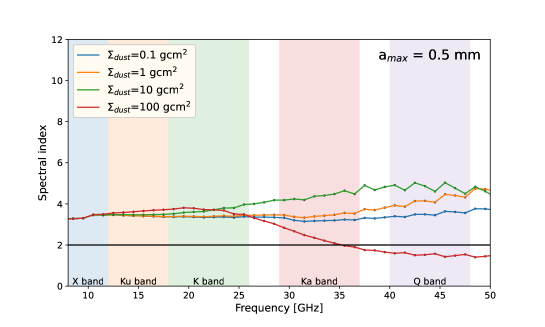
As an example, assuming the DSHARP dust opacity tables appropriate for the studies of protoplanetary disks (Birnstiel et al. 2018), when is 2–3 mm, increases with frequency at 30 GHz and decreases with frequency at higher frequencies (e.g., for some examples of dust opacities see Figure 2 of Liu 2019). As a result, the SED is anomalously flattened at 30 GHz and is anomalously steepened at 40–90 GHz. At 10–30 GHz, the spectral indices may become very high if dust is not optically thick, which is related to a feature in (see also the discussion in Pavlyuchenkov et al. 2019). These features may lead to the presence of one or more spectral index bump(s) in the frequency domain. For a broad range of dust column density, it is possible to constrain by identifying these SED features from multi-frequency radio interferometric observations (Figure 9). We note that the qualitative spectral features induced by the high values are relatively fundamental, insensitive to dust composition as long as the dust grains are not carriers of free charges (Jackson 1998).
On the other hand, with the broad 8–48 GHz frequency coverage of our experimental design (Section 2.1), it is appropriate to regard the spectral indices of the target sources as constants of frequency only if they fulfill the following two asymptotic conditions. The first is the extremely optically thin, Rayleigh-Jeans, and small dust grain (1 mm) limit, where asymptotically approaches 3.8 (e.g., Figure 9). The second is the extremely optically thick and Rayleigh-Jeans limit with either very large or very small such that the Rayleigh criterion (in terms of frequency, c/() ) is located well outside of this frequency coverage. (e.g., 1 mm or 10 cm). In this case, asymptotically approaches 2.0. When the observed is apparently inconsistent with the aforementioned two limits, the value of is likely a few mm. In this case, we can simultaneously constrain dust temperature, column density, and maximum grain size based on SED fits/models.
We note that the aforementioned two limits may not be particularly realistic for our present case study. In the extremely optically thin limit, the expected flux density is very low throughout our frequency coverage which is unlikely to be detected. In the extremely optically thick limit, in the case of either very small or very large , throughout the 8–48 GHz frequency coverage, the dust absorption mass opacities are small. This is because very small dust grains cannot emit/absorb efficiently at long wavelengths while the surface area per unit mass is small in the case of very large dust grains. Therefore, in such cases, a very high dust column density is required to achieve the optically thick constant 2.0 limit over our frequency coverage (Figure 9). Moreover, in the case with 10 cm the values of will be close to 1.0, which will lead to additional attenuation of the observed flux densities. If we require the projected area of the disks to be large enough such that they are detectable, the implied overall dust mass by such a high dust column density may not be realistic. Therefore, observing a constant 2.0 over our frequency coverage may still favor that 1 mm although it may require mixing multiple dust or free-free emission components to interpret the SED. In light of these concerns, there is no strong reason to assume that is a constant over the 8–48 GHz frequency range.
In case of misunderstanding, we note that when 1.0 is constant in frequency, the flux densities presented in linear instead of log scales will trend up or down. When the observed flux densities are consistent with a linear function with frequency, must vary with frequency unless that linear function passes through the origin with a slope consistent with 1.0.
Appendix B Radio–submillimeter SED and our best fit models
Appendix C Hypothesis about viscous heating and turbulence in the FU Ori hot inner disk
In this section, we provide the rationales of why we hypothesize that the hot inner disk of FUOri_dust1 may be turbulent (e.g., characterized by an that is 0.01). Although we understand that our estimates are very uncertain, we still think that this scenario may be possible. The uncertainties are mainly caused by lacking some observational constraints on the essential physical parameters (mean and UV opacity, disk geometry/morphology, gas-to-dust ratio, etc), such that we have to base on various assumptions that are likely oversimplified.
First, we assume that FUOri_dust1 (see Figure 5; Table 2) is a standard steady Sunyaev & Shakura viscous accretion thin-disk (Shakura & Sunyaev 1973) of which the disk accretion rate is a constant over the radius and is identical to the protostellar accretion rate. The constant accretion rate helps understand why FU Ori is approximately stationary over a 102 years timescale (i.e., the mass at any radius is always sufficiently replenished). Otherwise, we might expect significant variability on the timescales that are shorter than the dynamic (e.g., orbital, 50 years) timescales at the 10 au radius, which would be contradictory with the observations. The viscosity is characterized by the variable that is smaller than 1 (e.g., equal to 1 in the most MRI turbulent cases; Shakura & Sunyaev 1973). These assumptions are not necessarily realistic. But without them, we are not able to proceed. Here we quote the stellar radius and accretion rate from Pérez et al. (2020) which might also have some uncertainties. The derived mid-plane and surface temperature profiles for such models are presented in Figure 11.
In these models, the surface temperature profile has no dependence on given that it is merely determined by a balance between the radiative cooling rate and the rate to convert gravitational potential energy to heat. The latter only depends on the accretion rate (i.e., there is no explicit dependence on the micro-physics which are assisting the accretion or inducing viscosity). This surface temperature is reasonably well consistent with the measured dust temperature from FUOri_dust2 (which is not only heated by viscous heat generation but also radiation). For a 0.01 disk, at 10 au radii, the gas temperature at the disk mid-plane is around 1000 K. Under our assumptions, the detected lower (400 K) temperature of FUOri_dust1, which is a mass-weighted average from the inner 10 au region, appears to favor the values that are well above 0.01. Qualitatively, this can be understood since the mid-plane temperature is determined by the surface temperature and the optical depth in the vertical direction: the the higher optical depth, the higher the mid-plane temperature. When the viscosity is stronger (i.e., is larger), it requires a lower column density thus lower optical depth to achieve the same accretion rate, thereby yields the lower mid-plane temperature.
The origin of is very uncertain. It can be partly or largely due to MRI. Although in this specific target source, the region which can thermally ionize the gas yet does not sublimate dust is not big. However, in an environment that dust (in the mid-plane) can be sublimated, the UV opacity distribution is very uncertain and it may not be sufficient to ignore UV and X-ray photo-ionization. We presently do not have the development to tackle this issue self-consistently. Finally, in such a dynamically active region, there might (easily) be other sources of turbulence.
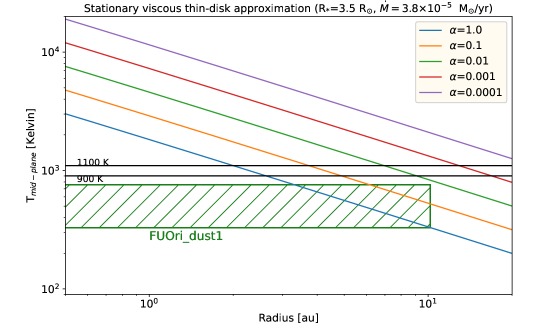
|
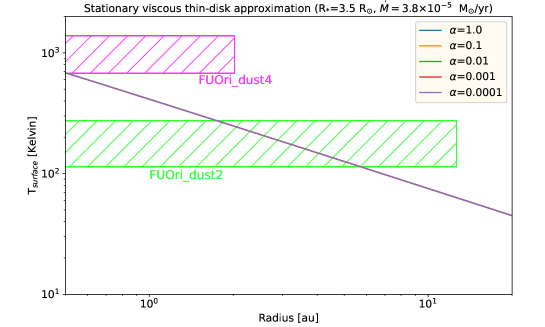
|
References
- Andrews et al. (2018) Andrews, S. M., Wilner, D. J., Macías, E., Carrasco-González, C., & Isella, A. 2018, in Astronomical Society of the Pacific Conference Series, Vol. 517, Science with a Next Generation Very Large Array, ed. E. Murphy, 137
- Asaki et al. (1998) Asaki, Y., Shibata, K. M., Kawabe, R., et al. 1998, Radio Science, 33, 1297, doi: 10.1029/98RS01607
- Astropy Collaboration et al. (2013) Astropy Collaboration, Robitaille, T. P., Tollerud, E. J., et al. 2013, A&A, 558, A33, doi: 10.1051/0004-6361/201322068
- Audard et al. (2014) Audard, M., Ábrahám, P., Dunham, M. M., et al. 2014, in Protostars and Planets VI, ed. H. Beuther, R. S. Klessen, C. P. Dullemond, & T. Henning, 387, doi: 10.2458/azu_uapress_9780816531240-ch017
- Bacciotti et al. (2018) Bacciotti, F., Girart, J. M., Padovani, M., et al. 2018, ApJ, 865, L12, doi: 10.3847/2041-8213/aadf87
- Bai et al. (2020) Bai, C.-H., Feng, G.-J., Zhang, X., et al. 2020, Research in Astronomy and Astrophysics, 20, 211, doi: 10.1088/1674-4527/20/12/211
- Banzatti et al. (2015) Banzatti, A., Pinilla, P., Ricci, L., et al. 2015, ApJ, 815, L15, doi: 10.1088/2041-8205/815/1/L15
- Birnstiel et al. (2016) Birnstiel, T., Fang, M., & Johansen, A. 2016, Space Sci. Rev., 205, 41, doi: 10.1007/s11214-016-0256-1
- Birnstiel et al. (2018) Birnstiel, T., Dullemond, C. P., Zhu, Z., et al. 2018, ApJ, 869, L45, doi: 10.3847/2041-8213/aaf743
- Blum & Wurm (2000) Blum, J., & Wurm, G. 2000, Icarus, 143, 138, doi: 10.1006/icar.1999.6234
- Braun et al. (2015) Braun, R., Bourke, T., Green, J. A., Keane, E., & Wagg, J. 2015, in Advancing Astrophysics with the Square Kilometre Array (AASKA14), 174
- Calvet et al. (1991) Calvet, N., Hartmann, L., & Kenyon, S. J. 1991, ApJ, 383, 752, doi: 10.1086/170832
- Carilli (2015) Carilli, C. 2015, in Advancing Astrophysics with the Square Kilometre Array (AASKA14), 171. https://arxiv.org/abs/1408.5317
- Carilli & Holdaway (1999) Carilli, C. L., & Holdaway, M. A. 1999, Radio Science, 34, 817, doi: 10.1029/1999RS900048
- Chen & Graham (1993) Chen, W. P., & Graham, J. A. 1993, ApJ, 409, 319, doi: 10.1086/172665
- Cieza et al. (2016) Cieza, L. A., Casassus, S., Tobin, J., et al. 2016, Nature, 535, 258, doi: 10.1038/nature18612
- Cornwell (2008) Cornwell, T. J. 2008, IEEE Journal of Selected Topics in Signal Processing, 2, 793, doi: 10.1109/JSTSP.2008.2006388
- Czesla et al. (2019) Czesla, S., Schröter, S., Schneider, C. P., et al. 2019, PyA: Python astronomy-related packages. http://ascl.net/1906.010
- Dolan & Mathieu (2002) Dolan, C. J., & Mathieu, R. D. 2002, AJ, 123, 387, doi: 10.1086/324631
- Draine (2003) Draine, B. T. 2003, ARA&A, 41, 241, doi: 10.1146/annurev.astro.41.011802.094840
- Evans et al. (2015) Evans, M. G., Ilee, J. D., Boley, A. C., et al. 2015, MNRAS, 453, 1147, doi: 10.1093/mnras/stv1698
- Feigelson & Montmerle (1999) Feigelson, E. D., & Montmerle, T. 1999, ARA&A, 37, 363, doi: 10.1146/annurev.astro.37.1.363
- Foreman-Mackey (2016) Foreman-Mackey, D. 2016, The Journal of Open Source Software, 1, 24, doi: 10.21105/joss.00024
- Foreman-Mackey et al. (2013) Foreman-Mackey, D., Hogg, D. W., Lang, D., & Goodman, J. 2013, PASP, 125, 306, doi: 10.1086/670067
- Francis et al. (2019) Francis, L., Johnstone, D., Dunham, M. M., Hunter, T. R., & Mairs, S. 2019, ApJ, 871, 149, doi: 10.3847/1538-4357/aaf972
- Fuente et al. (2020) Fuente, A., Treviño-Morales, S. P., Le Gal, R., et al. 2020, MNRAS, 496, 5330, doi: 10.1093/mnras/staa1919
- Gaia Collaboration et al. (2016) Gaia Collaboration, Prusti, T., de Bruijne, J. H. J., et al. 2016, A&A, 595, A1, doi: 10.1051/0004-6361/201629272
- Gaia Collaboration et al. (2021) Gaia Collaboration, Smart, R. L., Sarro, L. M., et al. 2021, A&A, 649, A6, doi: 10.1051/0004-6361/202039498
- Gonzalez et al. (2016) Gonzalez, A., Tapia, V., Reyes, N., et al. 2016, in IEEE International Symposium on Antennas and Propagation 2016, 1195–1196, doi: 10.1109/APS.2016.7696305
- Green et al. (2006) Green, J. D., Hartmann, L., Calvet, N., et al. 2006, ApJ, 648, 1099, doi: 10.1086/505932
- Green et al. (2013) Green, J. D., Evans, II, N. J., Kóspál, Á., et al. 2013, ApJ, 772, 117, doi: 10.1088/0004-637X/772/2/117
- Green et al. (2016a) Green, J. D., Jones, O. C., Keller, L. D., et al. 2016a, ApJ, 832, 4, doi: 10.3847/0004-637X/832/1/4
- Green et al. (2016b) Green, J. D., Yang, Y.-L., Evans, II, N. J., et al. 2016b, AJ, 151, 75, doi: 10.3847/0004-6256/151/3/75
- Gundlach & Blum (2015) Gundlach, B., & Blum, J. 2015, ApJ, 798, 34, doi: 10.1088/0004-637X/798/1/34
- Gundlach et al. (2011) Gundlach, B., Kilias, S., Beitz, E., & Blum, J. 2011, Icarus, 214, 717, doi: 10.1016/j.icarus.2011.05.005
- Gundlach et al. (2018) Gundlach, B., Schmidt, K. P., Kreuzig, C., et al. 2018, MNRAS, 479, 1273, doi: 10.1093/mnras/sty1550
- Hales et al. (2015) Hales, A. S., Corder, S. A., Dent, W. R. D., et al. 2015, ApJ, 812, 134, doi: 10.1088/0004-637X/812/2/134
- Hartmann & Kenyon (1996) Hartmann, L., & Kenyon, S. J. 1996, ARA&A, 34, 207, doi: 10.1146/annurev.astro.34.1.207
- Henden (2016) Henden, A. 2016, Journal of the American Association of Variable Star Observers (JAAVSO), 44, 84
- Henning & Stognienko (1996) Henning, T., & Stognienko, R. 1996, A&A, 311, 291
- Herbig (1977) Herbig, G. H. 1977, ApJ, 217, 693, doi: 10.1086/155615
- Ho et al. (2004) Ho, P. T. P., Moran, J. M., & Lo, K. Y. 2004, ApJ, 616, L1, doi: 10.1086/423245
- Howell (2006) Howell, S. B. 2006, Handbook of CCD Astronomy, Vol. 5
- Hubbard (2017) Hubbard, A. 2017, ApJ, 840, L5, doi: 10.3847/2041-8213/aa6dae
- Hull et al. (2018) Hull, C. L. H., Yang, H., Li, Z.-Y., et al. 2018, ApJ, 860, 82, doi: 10.3847/1538-4357/aabfeb
- Hwang et al. (2012) Hwang, Y.-J., Chiong, C.-C., Kuo, Y.-F., et al. 2012, in Society of Photo-Optical Instrumentation Engineers (SPIE) Conference Series, Vol. 8452, Millimeter, Submillimeter, and Far-Infrared Detectors and Instrumentation for Astronomy VI, ed. W. S. Holland & J. Zmuidzinas, 84522Q, doi: 10.1117/12.925875
- Ilee et al. (2020) Ilee, J. D., Hall, C., Walsh, C., et al. 2020, MNRAS, 498, 5116, doi: 10.1093/mnras/staa2699
- Jackson (1998) Jackson, J. D. 1998, Classical Electrodynamics, 3rd Edition
- Jayasinghe et al. (2018) Jayasinghe, T., Kochanek, C. S., Stanek, K. Z., et al. 2018, MNRAS, 477, 3145, doi: 10.1093/mnras/sty838
- Jayasinghe et al. (2019) Jayasinghe, T., Stanek, K. Z., Kochanek, C. S., et al. 2019, MNRAS, 486, 1907, doi: 10.1093/mnras/stz844
- Johnstone et al. (2018) Johnstone, D., Herczeg, G. J., Mairs, S., et al. 2018, ApJ, 854, 31, doi: 10.3847/1538-4357/aaa764
- Kadam et al. (2020) Kadam, K., Vorobyov, E., Regály, Z., Kóspál, Á., & Ábrahám, P. 2020, ApJ, 895, 41, doi: 10.3847/1538-4357/ab8bd8
- Kataoka et al. (2016) Kataoka, A., Muto, T., Momose, M., Tsukagoshi, T., & Dullemond, C. P. 2016, ApJ, 820, 54, doi: 10.3847/0004-637X/820/1/54
- Kataoka et al. (2015) Kataoka, A., Muto, T., Momose, M., et al. 2015, ApJ, 809, 78, doi: 10.1088/0004-637X/809/1/78
- Keto (2003) Keto, E. 2003, ApJ, 599, 1196, doi: 10.1086/379545
- Kimura et al. (2015) Kimura, H., Wada, K., Senshu, H., & Kobayashi, H. 2015, ApJ, 812, 67, doi: 10.1088/0004-637X/812/1/67
- Kochanek et al. (2017) Kochanek, C. S., Shappee, B. J., Stanek, K. Z., et al. 2017, PASP, 129, 104502, doi: 10.1088/1538-3873/aa80d9
- Kolotilov & Petrov (1985) Kolotilov, E. A., & Petrov, P. P. 1985, Soviet Astronomy Letters, 11, 358
- Labdon et al. (2021) Labdon, A., Kraus, S., Davies, C. L., et al. 2021, A&A, 646, A102, doi: 10.1051/0004-6361/202039370
- Laws et al. (2020) Laws, A. S. E., Harries, T. J., Setterholm, B. R., et al. 2020, ApJ, 888, 7, doi: 10.3847/1538-4357/ab59e2
- Lin et al. (2020) Lin, Z.-Y. D., Li, Z.-Y., Yang, H., et al. 2020, MNRAS, 496, 169, doi: 10.1093/mnras/staa1499
- Liu & Ji (2020) Liu, B., & Ji, J. 2020, Research in Astronomy and Astrophysics, 20, 164, doi: 10.1088/1674-4527/20/10/164
- Liu et al. (2019a) Liu, B., Ormel, C. W., & Johansen, A. 2019a, A&A, 624, A114, doi: 10.1051/0004-6361/201834174
- Liu (2019) Liu, H. B. 2019, ApJ, 877, L22, doi: 10.3847/2041-8213/ab1f8e
- Liu (2021) —. 2021, ApJ, 914, 25, doi: 10.3847/1538-4357/abf8b6
- Liu et al. (2014) Liu, H. B., Galván-Madrid, R., Forbrich, J., et al. 2014, ApJ, 780, 155, doi: 10.1088/0004-637X/780/2/155
- Liu et al. (2016) Liu, H. B., Takami, M., Kudo, T., et al. 2016, Science Advances, 2, e1500875, doi: 10.1126/sciadv.1500875
- Liu et al. (2017) Liu, H. B., Vorobyov, E. I., Dong, R., et al. 2017, A&A, 602, A19, doi: 10.1051/0004-6361/201630263
- Liu et al. (2018) Liu, H. B., Dunham, M. M., Pascucci, I., et al. 2018, A&A, 612, A54, doi: 10.1051/0004-6361/201731951
- Liu et al. (2019b) Liu, H. B., Mérand, A., Green, J. D., et al. 2019b, ApJ, 884, 97, doi: 10.3847/1538-4357/ab391c
- McMullin et al. (2007) McMullin, J. P., Waters, B., Schiebel, D., Young, W., & Golap, K. 2007, Astronomical Society of the Pacific Conference Series, Vol. 376, CASA Architecture and Applications, ed. R. A. Shaw, F. Hill, & D. J. Bell, 127
- Mezger & Henderson (1967) Mezger, P. G., & Henderson, A. P. 1967, ApJ, 147, 471, doi: 10.1086/149030
- Miotello et al. (2017) Miotello, A., van Dishoeck, E. F., Williams, J. P., et al. 2017, A&A, 599, A113, doi: 10.1051/0004-6361/201629556
- Molyarova et al. (2021) Molyarova, T., Vorobyov, E. I., Akimkin, V., et al. 2021, ApJ, 910, 153, doi: 10.3847/1538-4357/abe2b0
- Mori et al. (2021) Mori, S., Okuzumi, S., Kunitomo, M., & Bai, X.-N. 2021, ApJ, 916, 72, doi: 10.3847/1538-4357/ac06a9
- Mori & Kataoka (2021) Mori, T., & Kataoka, A. 2021, ApJ, 908, 153, doi: 10.3847/1538-4357/abd08a
- Murphy et al. (2018) Murphy, E. J., Bolatto, A., Chatterjee, S., et al. 2018, in Astronomical Society of the Pacific Conference Series, Vol. 517, Science with a Next Generation Very Large Array, ed. E. Murphy, 3. https://arxiv.org/abs/1810.07524
- Musiolik (2021) Musiolik, G. 2021, MNRAS, doi: 10.1093/mnras/stab1963
- Musiolik & Wurm (2019) Musiolik, G., & Wurm, G. 2019, ApJ, 873, 58, doi: 10.3847/1538-4357/ab0428
- Ohashi & Kataoka (2019) Ohashi, S., & Kataoka, A. 2019, ApJ, 886, 103, doi: 10.3847/1538-4357/ab5107
- Ohashi et al. (2018) Ohashi, S., Kataoka, A., Nagai, H., et al. 2018, ApJ, 864, 81, doi: 10.3847/1538-4357/aad632
- Ohashi et al. (2020) Ohashi, S., Kataoka, A., van der Marel, N., et al. 2020, ApJ, 900, 81, doi: 10.3847/1538-4357/abaab4
- Okuzumi et al. (2021) Okuzumi, S., Momose, M., & Kataoka, A. 2021, in ngVLA-J memo series. https://ngvla.nao.ac.jp/researcher/memo/pdf/Okuzumi.pdf
- Okuzumi et al. (2012) Okuzumi, S., Tanaka, H., Kobayashi, H., & Wada, K. 2012, ApJ, 752, 106, doi: 10.1088/0004-637X/752/2/106
- Ormel et al. (2009) Ormel, C. W., Paszun, D., Dominik, C., & Tielens, A. G. G. M. 2009, A&A, 502, 845, doi: 10.1051/0004-6361/200811158
- Ossenkopf (1993) Ossenkopf, V. 1993, A&A, 280, 617
- Pavlyuchenkov et al. (2019) Pavlyuchenkov, Y., Akimkin, V., Wiebe, D., & Vorobyov, E. 2019, MNRAS, 486, 3907, doi: 10.1093/mnras/stz1046
- Pérez et al. (2020) Pérez, S., Hales, A., Liu, H. B., et al. 2020, ApJ, 889, 59, doi: 10.3847/1538-4357/ab5c1b
- Pillich et al. (2021) Pillich, C., Bogdan, T., Landers, J., Wurm, G., & Wende, H. 2021, A&A, 652, A106, doi: 10.1051/0004-6361/202140601
- Pinilla et al. (2021) Pinilla, P., Lenz, C. T., & Stammler, S. M. 2021, A&A, 645, A70, doi: 10.1051/0004-6361/202038920
- Pinilla et al. (2017) Pinilla, P., Pohl, A., Stammler, S. M., & Birnstiel, T. 2017, ApJ, 845, 68, doi: 10.3847/1538-4357/aa7edb
- Pollack et al. (1994) Pollack, J. B., Hollenbach, D., Beckwith, S., et al. 1994, ApJ, 421, 615, doi: 10.1086/173677
- Rau & Cornwell (2011) Rau, U., & Cornwell, T. J. 2011, A&A, 532, A71, doi: 10.1051/0004-6361/201117104
- Rodriguez et al. (1990) Rodriguez, L. F., Hartmann, L. W., & Chavira, E. 1990, PASP, 102, 1413, doi: 10.1086/132784
- Schoonenberg et al. (2017) Schoonenberg, D., Okuzumi, S., & Ormel, C. W. 2017, A&A, 605, L2, doi: 10.1051/0004-6361/201731202
- Shakura & Sunyaev (1973) Shakura, N. I., & Sunyaev, R. A. 1973, A&A, 500, 33
- Shappee et al. (2014) Shappee, B. J., Prieto, J. L., Grupe, D., et al. 2014, ApJ, 788, 48, doi: 10.1088/0004-637X/788/1/48
- Sierra & Lizano (2020) Sierra, A., & Lizano, S. 2020, ApJ, 892, 136, doi: 10.3847/1538-4357/ab7d32
- Skinner et al. (2010) Skinner, S. L., Güdel, M., Briggs, K. R., & Lamzin, S. A. 2010, ApJ, 722, 1654, doi: 10.1088/0004-637X/722/2/1654
- Stammler et al. (2017) Stammler, S. M., Birnstiel, T., Panić, O., Dullemond, C. P., & Dominik, C. 2017, A&A, 600, A140, doi: 10.1051/0004-6361/201629041
- Steinpilz et al. (2019) Steinpilz, T., Teiser, J., & Wurm, G. 2019, ApJ, 874, 60, doi: 10.3847/1538-4357/ab07bb
- Stephens et al. (2017) Stephens, I. W., Yang, H., Li, Z.-Y., et al. 2017, ApJ, 851, 55, doi: 10.3847/1538-4357/aa998b
- Takami et al. (2018) Takami, M., Fu, G., Liu, H. B., et al. 2018, ApJ, 864, 20, doi: 10.3847/1538-4357/aad2e1
- Takami et al. (2019) Takami, M., Chen, T.-S., Liu, H. B., et al. 2019, ApJ, 884, 146, doi: 10.3847/1538-4357/ab43c8
- Tazaki et al. (2019) Tazaki, R., Tanaka, H., Kataoka, A., Okuzumi, S., & Muto, T. 2019, ApJ, 885, 52, doi: 10.3847/1538-4357/ab45f0
- Testi et al. (2014) Testi, L., Birnstiel, T., Ricci, L., et al. 2014, in Protostars and Planets VI, ed. H. Beuther, R. S. Klessen, C. P. Dullemond, & T. Henning, 339, doi: 10.2458/azu_uapress_9780816531240-ch015
- Thompson et al. (1986) Thompson, A. R., Moran, J. M., & Swenson, G. W. 1986, Interferometry and synthesis in radio astronomy
- Turner et al. (1997) Turner, N. J. J., Bodenheimer, P., & Bell, K. R. 1997, ApJ, 480, 754, doi: 10.1086/303983
- Ueda et al. (2020) Ueda, T., Kataoka, A., & Tsukagoshi, T. 2020, ApJ, 893, 125, doi: 10.3847/1538-4357/ab8223
- van der Walt et al. (2011) van der Walt, S., Colbert, S. C., & Varoquaux, G. 2011, Computing in Science and Engineering, 13, 22, doi: 10.1109/MCSE.2011.37
- Vorobyov et al. (2018) Vorobyov, E. I., Akimkin, V., Stoyanovskaya, O., Pavlyuchenkov, Y., & Liu, H. B. 2018, A&A, 614, A98, doi: 10.1051/0004-6361/201731690
- Vorobyov et al. (2020) Vorobyov, E. I., Khaibrakhmanov, S., Basu, S., & Audard, M. 2020, A&A, 644, A74, doi: 10.1051/0004-6361/202039081
- Wada et al. (2009) Wada, K., Tanaka, H., Suyama, T., Kimura, H., & Yamamoto, T. 2009, ApJ, 702, 1490, doi: 10.1088/0004-637X/702/2/1490
- Wang et al. (2004) Wang, H., Apai, D., Henning, T., & Pascucci, I. 2004, ApJ, 601, L83, doi: 10.1086/381705
- Warren (1984) Warren, S. G. 1984, Appl. Opt., 23, 1206, doi: 10.1364/AO.23.001206
- Wendeborn et al. (2020) Wendeborn, J., Espaillat, C. C., Macías, E., et al. 2020, ApJ, 897, 54, doi: 10.3847/1538-4357/ab9304
- Yang et al. (2018) Yang, Y.-L., Green, J. D., Evans, Neal J., I., et al. 2018, ApJ, 860, 174, doi: 10.3847/1538-4357/aac2c6
- Zhang et al. (2021) Zhang, C.-P., Launhardt, R., Liu, Y., Tobin, J. J., & Henning, T. 2021, A&A, 646, A18, doi: 10.1051/0004-6361/202039536
- Zhang et al. (2015) Zhang, K., Blake, G. A., & Bergin, E. A. 2015, ApJ, 806, L7, doi: 10.1088/2041-8205/806/1/L7
- Zhu et al. (2007) Zhu, Z., Hartmann, L., Calvet, N., et al. 2007, ApJ, 669, 483, doi: 10.1086/521345
- Zhu et al. (2019) Zhu, Z., Zhang, S., Jiang, Y.-F., et al. 2019, ApJ, 877, L18, doi: 10.3847/2041-8213/ab1f8c