∎
22email: sali85@student.gsu.edu 33institutetext: Yijing Zhou 44institutetext: Georgia State University, Atlanta, Georgia, USA
44email: yzhou43@student.gsu.edu 55institutetext: Murray Patterson 66institutetext: Georgia State University, Atlanta, Georgia, USA
66email: mpatterson30@gsu.edu
Efficient Analysis of COVID-19 Clinical Data using Machine Learning Models
Abstract
Because of the rapid spread of COVID-19 to almost every part of the globe, huge volumes of data and case studies have been made available, providing researchers with a unique opportunity to find trends and make discoveries like never before, by leveraging such big data. This data is of many different varieties, and can be of different levels of veracity e.g., precise, imprecise, uncertain, and missing, making it challenging to extract important information from such data. Yet, efficient analyses of this continuously growing and evolving COVID-19 data is crucial to inform — often in real-time — the relevant measures needed for controlling, mitigating, and ultimately avoiding viral spread. Applying machine learning based algorithms to this big data is a natural approach to take to this aim, since they can quickly scale to such data, and extract the relevant information in the presence of variety and different levels of veracity. This is important for COVID-19, and for potential future pandemics in general.
In this paper, we design a straightforward encoding of clinical data (on categorical attributes) into a fixed-length feature vector representation, and then propose a model that first performs efficient feature selection from such representation. We apply this approach on two clinical datasets of the COVID-19 patients and then apply different machine learning algorithms downstream for classification purposes. We show that with the efficient feature selection algorithm, we can achieve a prediction accuracy of more than 90% in most cases. We also computed the importance of different attributes in the dataset using information gain. This can help the policy makers to focus on only certain attributes for the purposes of studying this disease rather than focusing on multiple random factors that may not be very informative to patient outcomes.
Keywords:
COVID-19 Coronavirus Clinical Data Classification Feature Selection1 Introduction
Because of the rapid global spread of COVID-19, and the cooperation of medical institutions worldwide, a tremendous amount of public data — more data than ever before for a single virus — has been made available for researchers gisaid_website_url ; ali2021spike2vec ; ali2021classifying . This “big data” opens up new opportunities to analyse the behavior of this virus leung2020big ; leung2020machine . Despite these opportunities, the huge size of the data poses a challenge for its processing on smaller systems ali2021spike2vec . On one hand, this creates scalability issues, and on the other hand, it creates the problem of high dimensionality (the curse of dimensionality) Ali2020ShortTerm ; ali2019short . Since such data was not previously available to the research community at this magnitude and ease of access, new and more sophisticated methods are required to extract useful information from this big data.
At the same time, the shortage of medical resources may occur when such a severe pandemic happens, and the surging number of patients exceeds the capacity of the clinical system. This situation happens in many countries and regions during continuous outbreaks of the COVID-19 pandemic, and clinicians have to make the tough decision of which individual patients have a higher possibility to recover and should receive a limited amount of medical care. What is more difficult is the decision of which patients have little to no chance of survival, regardless of treatment level, and should hence be abandoned for the sake of optimizing the use of limited resources for others who still have a chance. In addition to this, patients with different levels of severity and urgency of symptoms require the medical system to create a complete plan to provide various treatments in proper order abdulkareem2021realizing .
Hence, a clinical decision support system is of utmost importance to optimize the use of the limited medical resources and thus save more lives overall abdulkareem2021realizing . In order to develop a such a clinical decision support system with high quality, it is necessary to build a model that can predict the possible complications of patients, assessing the likelihood that they will survive under certain levels of care. Machine learning (ML) based algorithms are proven to perform well in terms of classification and clustering. Therefore, we work on building machine learning models that can scale to larger datasets and reduce the run time by selecting the proper attributes. Since ML models take a feature vector representation as input ali2021predicting ; grover2016node2vec , designing such vectors while preserving a maximum amount of information is a challenging task yang2018multi . Moreover, when the size of data becomes this large, even scalability of these models becomes an issue. Much work has been done on genomic data of COVID-19 patients kuzmin2020machine ; ali2021effective ; melnyk2021alpha . One major challenge in this case is the conversion of genomic sequences into fixed-length numerical feature vectors so that they can be given as input to the underlying ML classifiers for prediction purposes.
In this paper, we propose an algorithm that efficiently predicts with high accuracy patient mortality as a function many different factors. This problem can help doctors to prescribe medications and design strategies in advance that can help to save the highest number of lives. In this paper, our contributions can be summarised as follows:
-
1.
We propose a pipeline to efficiently predict patient mortality as a function of a few dozen factors. We show that with basic information about a patient (gender, race, exposure, etc.), we can predict in advance the likelyhood of a mortality in the future. We also predict if a patient is COVID-19 positive or negative using attributes like red blood cells and hemoglobin, etc.
-
2.
We show that our model is scalable on larger dataset (achieves accuracies 90%).
-
3.
From our results, it is evident that the proposed model (using efficient feature selection) outperforms the baselines (without using any feature selection) in terms of prediction accuracy and runtime.
-
4.
We show the importance of each attribute by measuring the information gain of the attributes with the class labels. This study can help doctors and other relevant authorities to focus more on specific attributes rather than dealing with all information at once, which can be difficult for humans to fathom.
The rest of the paper is organised as follows: Section 2 contains literature review for the problem. Our proposed model is give in Section 3. Dataset statistics and experimental details are given in Section 4. We show results and their comparisons in Section 5. We discuss the importance of different attributes in Section 6. Finally, in Section 7, we conclude our paper.
2 Related Work
Machine learning based models that take fixed length feature vectors as input has been successfully applied (for data analytics tasks) in many domains such as graphs analytics ali2021predicting ; AHMAD2020Combinatorial , smart grid ali2019short ; Ali2020ShortTerm , electromyography (EMG) ullah2020effect , and text classification Shakeel2020LanguageIndependent ; Shakeel2020Multi ; Shakeel2019MultiBilingual . It is important to perform objective evaluation of the underlying model rather than just doing subjective evaluation hassan2021locally . Many methodologies of data science have been applied to objectively analyze the data of COVID-19 and provide support to the medical system. The synergy between data scientists and the biomedical communities is helpful to improve the detection of diseases and illnesses, as well as the prediction of possible complications. Authors in leung2020data developed a framework with to predict cancer trends accurately. This type of framework could be used for the analysis of other clinical data. S. Ali et al. in ali2021k uses spike sequences to classify the variants of the COVID-19 infected humans. An effective approach to cluster the spike sequences based on the virus’s variants is conducted in ali2021effective .
Several studies discussed different data mining techniques to study the behavior of the COVID-19 li2020using ; albahri2020role ; leung2020big . Authors in fung2021predictive uses neural networks, which takes advantage of few-shot learning and autoencoder to perform predictive analysis on COVID-19 data. A study for predicting the clinical outcomes of patients and indicating whether patients are more likely to recover from coronavirus or in danger of death is performed in leung2020machine . They presented a tool called online analytical processing (OLAP), which can help the researchers learn more about the confirmed cases and mortality of COVID-19 by conducting machine learning methods on the big dataset of COVID-19.
3 Proposed Approach
Most of the machine learning (ML) models take fixed-length feature vectors as an input to perform different tasks such as classification and clustering. We design a fixed-length feature vector representation, which includes the values of different attributes of the clinical data. One important point to mention here is that not all the features in the vectors are important in terms of predicting the class labels. Therefore, it is required to apply feature selection to not only improve the predictive performance of the underlying classifiers (by removing unnecessary features), but also improve the training runtime. The feature selection methods that we used in this paper are discussed below.
3.1 Feature Selection Methods
We use different supervised and unsupervised feature selection methods to improve the runtime of the underlying classifiers and also to improve the predictive performance. For supervised models, we use Boruta (shadow features) kursa2010feature , and Ridge Regression (RR) hoerl1975ridge . For unsupervised methods, we use Approximate kernel approach called Random Fourier Features (RFF) rahimi2007random .
3.1.1 Boruta (shadow features)
The main idea of Boruta is that features do not compete among themselves but rather they compete with a randomized version of them. Boruta captures the non-linear relationships and interactions using the random forest algorithm. It then extract the importance of each feature (corresponding to the class label) and only keep the features that are above a specific threshold of importance. To compute the importance of the features, it performs the following task: From the original features set in the data, it creates dummy features (shadow features) by randomly shuffling each feature. Now the shadow features are combined with the original features set to obtain a new dataset, which has twice the number of features of the original data. Using random forest, it compute the importance of the original features and the shadow features separately. Now the importance of the original features are compared with the threshold. The threshold is defined as the highest feature importance recorded among the shadow features. The feature from the original feature set is selected is its importance (computed using random forest) is greater than the threshold (highest importance value among shadow features). In Boruta, a feature is useful only if it is capable of doing better than the best randomized feature. Note that we are using two datasets in this paper, namely Clinical Data1, and Clinical Data2 (see Section 4.1 for detail regarding datasets). For the Clinical Data1, Boruta selected features out of and removed Year, Gender, Race, Case Positive Specimen Interval, Case Onset Interval, Exposure, Current Status, and Symptom Status. For the Clinical Data2, Boruta selected features from features in total. The selected features are Red blood Cells, Platelets, Hematocrit, Monocytes, Leukocytes, Eosinophils, and Proteina C reativa mg/dL.
3.1.2 Ridge Regression
Ridge Regression (RR) is a supervised algorithm for parameter estimation that is used to address the collinearity problem that arises in multiple linear regression frequently mcdonald2009ridge . Its main idea is to increase the bias (it first introduces a Bias term for the data) to improve the variance, which shows the generalization capability of RR as compared to simple linear regression. RR ignores the datapoints that are far away from others and it try to make the regression line more horizontal. RR is useful for Feature selection because it gives insights on which independent variables are not very important (can reduce the slope close to zero). The un-important independent variables are then removed to reduce the dimensions of the overall dataset. The objective function of ridge regression is the following
| (1) |
where is called penalty terms.
3.1.3 Random Fourier Features (RFF)
A popular approach for the classification is using kernel based algorithms, which computes a similarity matrix that can be used as input for traditional classification algorithms such as support vector machines. However, pair-wise computation for the kernel matrix is an expensive task. To make this task efficient, an efficient approach, called kernel trick is used.
Definition 1 (Kernel Trick)
It works by taking dot product between the pairs of input points. Kernel trick avoid the need to map the input data (explicitly) to a high-dimensional feature space.
The main idea of the Kernel Trick is the following: Any positive definite function f(x,y), where , defines an inner product and a lifting for the purpose of computing the inner product quickly between the lifted data points rahimi2007random . More formally:
| (2) |
The main problem of kernel method is that when we have large sized data, they suffers from large initial computational and storage costs. To solve these problems, we use an approximate kernel method called Random Fourier Features (RFF) rahimi2007random . The RFF maps the given data to a low dimensional randomized feature space (euclidean inner product space). More formally:
| (3) |
RFF basically approximate the inner product between a pair of transformed points. More formally:
| (4) |
In Equation (4), is low dimensional (unlike the lifting ). In this way, we can transform the original input data with . Now, is the approximate low dimensional embedding for the original data. We can then use as the input for different classification algorithms.
3.2 Classification Algorithms
For classification, we use Support Vector Machine (SVM), Naive Bayes (NB), Multiple Linear Regression (MLP), K-Nearest Neighbors (KNN), Random Forest (RF), Logistic Regression (LR), and Decision Tree (DT). All algorithms are used with default parameters. The value for K in case of KNN is taken as (using standard validation set approach validationSetApproach ).
We are also using a deep learning model, called Keras Classifier for the classification purposes. For this model, we use a sequential constructor. We create a fully connected network with one hidden layer that contains neurons, where is equal to the length of the feature vector. We use "rectifier" as an activation function and “softmax" activation function in the output layer. We also use ab efficient Adam gradient descent optimization algorithm with “sparse categorical crossentropy" loss function (used for multi-class classification problem), which computes the crossentropy loss between the labels and predictions. The batch size and number of epochs are taken as and , respectively for training the model. Since deep learning model does not require any feature selection, we use the original data without any feature selection as input to keras classifiers.
Remark 1
We use “sparse categorical crossentropy" instead of simple “categorical crossentropy" because we are using integer labels rather than one-hot representation of labels.
4 Experimental Setup
In this section, we describe our dataset in detail. All experiments are performed on a Core i5 system running the Windows operating system, 32GB memory, and a 2.4 GHz processor. Implementation of the algorithms is done in Python. Our code and prepossessed dataset is available online111https://github.com/sarwanpasha/COVID˙19˙Clinical˙Data˙Analytics.
4.1 Dataset Statistics
In this paper, we are using clinical data from two different sources. The description of both datasets is given below.
4.2 Clinical Data1
We use COVID-19 Case Surveillance dataset (we call it Clinical Data1 for reference), which is publicly available on center of disease control CDC, USA’s website222https://data.cdc.gov/Case-Surveillance/COVID-19-Case-Surveillance-Public-Use-Data-with-Ge/n8mc-b4w4/data. After preprocessing (removing missing values), we got patients data record. The attributes in the dataset are following:
-
1.
Year: The earlier of year the Clinical Date. date related to the illness or specimen collection or the Date Received by CDC
-
2.
Month: The earlier of month the Clinical Date. date related to the illness or specimen collection or the Date Received by CDC (see Figure 1 for month and year distribution).
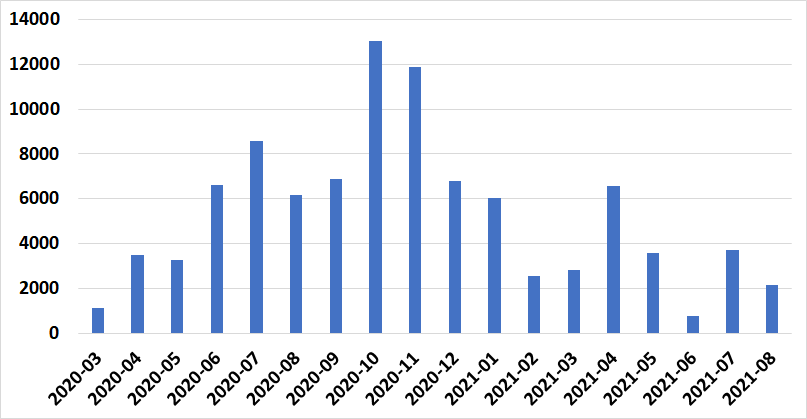
Figure 1: Month and Year attribute distribution. -
3.
State of residence: This attributes shows the name of the state (of United States of America) in which the patient is living (see Figure 2 for states distribution).
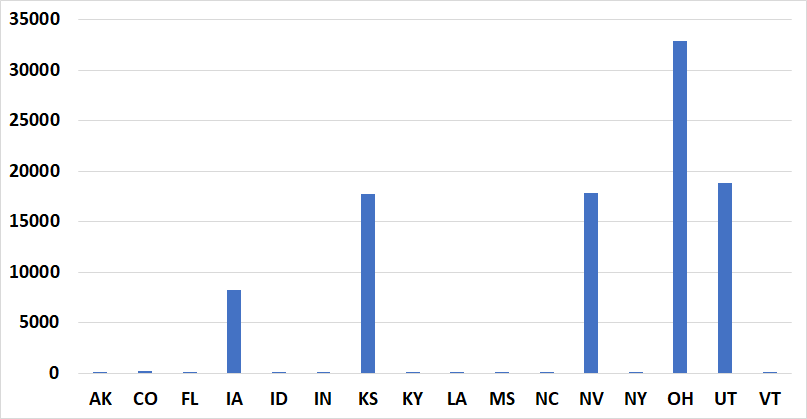
Figure 2: State of residence distribution. -
4.
State FIPS code: Federal Information Processing Standards (FIPS) code for different states
-
5.
County of residence: Name of the County
-
6.
County fips code: Federal Information Processing Standards (FIPS) code for different Counties
-
7.
Age group: Age groups of patients that include 0 - 17 years, 18 - 49 years, 50 - 64 years, and 65 + years.
-
8.
Gender: Female, Male, Other, Unknown.
-
9.
Race: American Indian/Alaska Native, Asian, Black, Multiple/Other, Native Hawaiian/Other Pacific Islander, White, Unknown (see Table 1 for the distribution of values for race attribute).
Race Count American Indian/ Alaska Native 94 Asian 3067 Black 8806 Multiple/Other 1833 Native Hawaiian/Other Pacific Islander 859 Unknown 3081 White 78244 Table 1: Race attribute distribution. -
10.
Ethnicity: Hispanic, Non-Hispanic, Unknown.
-
11.
Case positive specimen interval: Weeks between earliest date and date of first positive specimen collection.
-
12.
Case onset interval: Weeks between earliest date and date of symptom onset.
-
13.
Process: Under what process was the case first identified, e,g, Clinical evaluation, Routine surveillance, Contact tracing of case patient, Multiple, Other, Unknown. (see Table 2).
Process Count Clinical evaluation 43768 Contact tracing of case patient 6813 Laboratory reported 11848 Multiple 22595 Other 556 Other detection method (specify) 164 Provider reported 212 Routine physical examination 22 Routine surveillance 8641 Unknown 1365 Table 2: Process attribute distribution. -
14.
Exposure: In the days prior to illness onset, did the patient have any of the following known exposures e.g. domestic travel, international travel, cruise ship or vessel travel as a passenger or crew member, workplace, airport/airplane, adult congregate living facility (nursing, assisted living, or long-term care facility), school/university/childcare center, correctional facility, community event/mass gathering, animal with confirmed or suspected COVID-19, other exposure, contact with a known COVID-19 case? Possible values for this attribute are Yes and Unknown.
-
15.
Current status: What is the current status of this person? Possible values are Laboratory-confirmed case, Probable case.
-
16.
Symptom status: What is the symptom status of this person? Possible values are Asymptomatic, Symptomatic, Unknown, Missing.
-
17.
Hospital: Was the patient hospitalized? Possible values are Yes, No, Unknown.
-
18.
ICU: Was the patient admitted to an intensive care unit (ICU)? Possible values are Yes, No, Unknown.
-
19.
Death/Deceased: This attribute highlights whether the patient die as a result of this illness. The possible values are “Yes", “No", and “Unknown".
-
20.
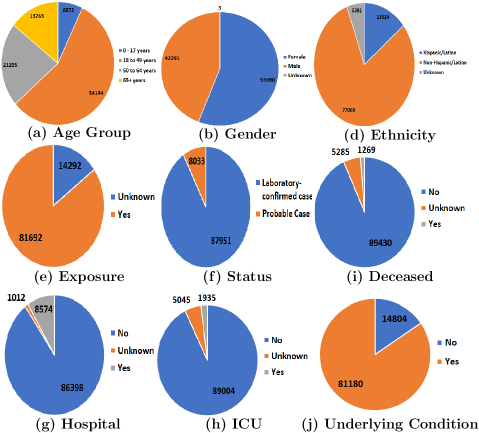
Underlying Conditions: This attribute highlights if the patient have single or multiple medical conditions and risk behaviors. These conditions includes diabetes mellitus, hypertension, severe obesity (occurs when BMI is greater than ), cardiovascular disease, chronic renal disease, chronic liver disease, chronic lung disease, other chronic diseases, immunosuppressive condition, autoimmune condition, current smoker, former smoker, substance abuse or misuse, disability, psychological/psychiatric, pregnancy, other. The possible values are for this attribute are “Yes" and “No".
The Distributions of values for different attributes is shown in Figure 3.
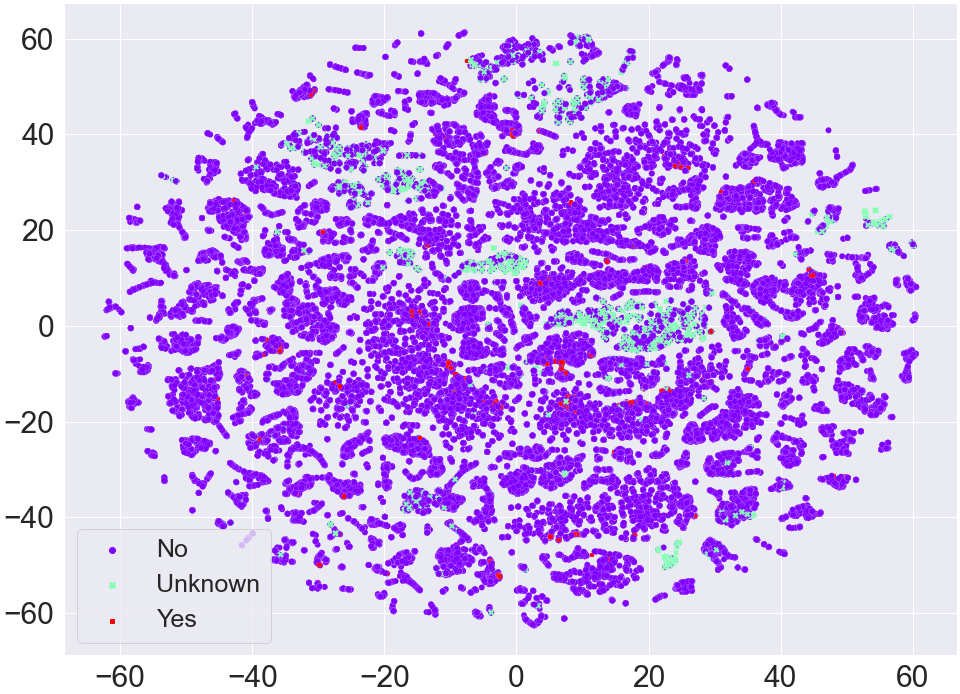
To check if there is any natural clustering in Clinical Data1, we use t-distributed stochastic neighbor embedding (t-SNE) approach van2008visualizing . We maps input data to 2d real vectors representation using t-SNE and Deceased attribute (for Clinical Data1) as class label (see Figure 4). We can observe in the figure that there is no visible clustering corresponding to different values of the deceased attribute. All values (No, Yes, and Unknown) are scattered around in the whole plot. This behavior shows that performing any ML task on such data will not directly give us efficient results (since the data is not properly grouped together).
4.3 Clinical Data2
We got the Clinical Data2 data from alakus2020comparison . This study used a laboratory dataset of patients with COVID-19 in the Israelita Albert Einstein Hospital in Sao Paulo, Brazil. The patient samples were collected to identify who were infected by COVID-19 in the beginning of year . The laboratory dataset contains information on patients with laboratory findings. In this dataset, had no findings, and were patients with COVID-19. The attributes are Red blood Cells, Hemoglobin, Platelets, Hematocrit, Aspartate transaminase, Lymphocytes, Monocytes, Sodium, Urea, Basophils, Creatinine, Serum Glucose, Alanine transaminase, Leukocytes, Potassium, Eosinophils, Proteina C reativa mg/dL, Neutrophils, SARS-Cov-2 exam result (positive or negative). All the attributes (other than “SARS-Cov-2 exam result") contains integer values.
4.4 Evaluation Metrics
To measure the performance of underlying machine learning classifiers, we use different evaluation metrics such as Average Accuracy, Precision, Recall, weighted and Macro F1, and Receiver Operator Curve (ROC) Area Under the Curve (AUC). We also computed the training runtime of all ML models to see which model is the best in terms of runtime.
5 Results and Discussion
The results for Clinical Data1 are given in Table 3. For classifying the Deceased attribute, we can see that all methods are able to classify the label (Deceased attribute) with very high accuracy (accuracy in most of the cases). Note that feature selection based models are not only better in terms of prediction accuracy, but also outperforms the setting in which we are not using any feature selection approach (No Feat. Selec.). Also, Boruta feature selection model is outperforming all other feature selection approaches. In terms of training runtime, RFF with Logistic Regression classifier is performing better than the other classifiers.
| Acc. | Prec. | Recall | F1 (Weighted) | F1 (Macro) | ROC AUC | Train Time (Sec.) | ||
| No Feat. Selec. | NB | 0.78 | 0.93 | 0.78 | 0.83 | 0.49 | 0.80 | 0.19 |
| MLP | 0.94 | 0.93 | 0.94 | 0.93 | 0.59 | 0.66 | 35.28 | |
| KNN | 0.94 | 0.93 | 0.94 | 0.93 | 0.60 | 0.69 | 4.71 | |
| RF | 0.94 | 0.94 | 0.94 | 0.94 | 0.64 | 0.71 | 4.88 | |
| LR | 0.93 | 0.87 | 0.93 | 0.90 | 0.32 | 0.50 | 1.38 | |
| DT | 0.93 | 0.93 | 0.93 | 0.93 | 0.62 | 0.73 | 0.37 | |
| Boruta | NB | 0.83 | 0.94 | 0.83 | 0.87 | 0.54 | 0.81 | 0.149 |
| MLP | 0.94 | 0.93 | 0.94 | 0.93 | 0.58 | 0.66 | 22.76 | |
| KNN | 0.94 | 0.94 | 0.94 | 0.94 | 0.62 | 0.70 | 1.814 | |
| RF | 0.95 | 0.94 | 0.95 | 0.94 | 0.64 | 0.72 | 3.346 | |
| LR | 0.93 | 0.89 | 0.93 | 0.90 | 0.33 | 0.50 | 0.968 | |
| DT | 0.94 | 0.94 | 0.94 | 0.94 | 0.64 | 0.73 | 0.227 | |
| RR | NB | 0.84 | 0.93 | 0.84 | 0.87 | 0.45 | 0.72 | 0.129 |
| MLP | 0.93 | 0.87 | 0.93 | 0.90 | 0.32 | 0.50 | 5.658 | |
| KNN | 0.93 | 0.92 | 0.93 | 0.92 | 0.48 | 0.60 | 1.660 | |
| RF | 0.94 | 0.93 | 0.94 | 0.93 | 0.51 | 0.64 | 2.214 | |
| LR | 0.93 | 0.87 | 0.93 | 0.90 | 0.32 | 0.50 | 0.338 | |
| DT | 0.94 | 0.93 | 0.94 | 0.93 | 0.51 | 0.64 | 0.154 | |
| RFF | NB | 0.93 | 0.87 | 0.93 | 0.90 | 0.32 | 0.50 | 0.144 |
| MLP | 0.93 | 0.89 | 0.93 | 0.90 | 0.32 | 0.50 | 24.22 | |
| KNN | 0.93 | 0.91 | 0.93 | 0.92 | 0.45 | 0.58 | 3.280 | |
| RF | 0.94 | 0.93 | 0.94 | 0.93 | 0.56 | 0.64 | 27.87 | |
| LR | 0.93 | 0.87 | 0.93 | 0.90 | 0.32 | 0.50 | 0.261 | |
| DT | 0.91 | 0.92 | 0.91 | 0.91 | 0.51 | 0.65 | 1.461 | |
| Keras Class. | - | 0.93 | 0.87 | 0.93 | 0.90 | 0.32 | 0.50 | 11.582 |
The results for Clinical Data2 are given in Table 4. For classifying whether a patient is COVID-19 positive or negative, we can see that random forest classifier with Boruta feature selection approach outperforms all other feature selection methods and also the deep learning model. In terms of runtime, logistic regression classifier with RFF is outperforming other approaches.
Remark 2
We note that the deep learning model is slightly worse that the traditional classifiers in case of Clinical Data1 while performing worst on Clinical Data2. This is because the deep learning models are usually “Data Hungry" and require a lot more data to efficiently learn the patters in the data. Since we have small number of data points in both datasets, the deep learning model is unable to beat the traditional classification algorithms.
| Acc. | Prec. | Recall | F1 (Weighted) | F1 (Macro) | ROC AUC | Train Time (Sec.) | ||
| No Feat. Selec. | NB | 0.89 | 0.88 | 0.89 | 0.88 | 0.71 | 0.70 | 0.025 |
| MLP | 0.86 | 0.85 | 0.86 | 0.85 | 0.65 | 0.64 | 1.327 | |
| KNN | 0.88 | 0.87 | 0.88 | 0.87 | 0.68 | 0.66 | 0.013 | |
| RF | 0.85 | 0.79 | 0.85 | 0.82 | 0.49 | 0.50 | 0.178 | |
| LR | 0.87 | 0.86 | 0.87 | 0.86 | 0.65 | 0.63 | 0.013 | |
| DT | 0.81 | 0.81 | 0.81 | 0.81 | 0.56 | 0.56 | 0.01 | |
| Boruta | NB | 0.83 | 0.89 | 0.83 | 0.85 | 0.71 | 0.79 | 0.01 |
| MLP | 0.87 | 0.89 | 0.87 | 0.88 | 0.75 | 0.78 | 1.621 | |
| KNN | 0.86 | 0.85 | 0.86 | 0.86 | 0.66 | 0.66 | 0.015 | |
| RF | 0.91 | 0.90 | 0.91 | 0.90 | 0.77 | 0.74 | 0.125 | |
| LR | 0.87 | 0.88 | 0.87 | 0.88 | 0.73 | 0.74 | 0.01 | |
| DT | 0.85 | 0.86 | 0.85 | 0.86 | 0.68 | 0.69 | 0.007 | |
| RR | NB | 0.83 | 0.80 | 0.83 | 0.81 | 0.57 | 0.56 | 0.016 |
| MLP | 0.85 | 0.84 | 0.85 | 0.85 | 0.67 | 0.66 | 1.024 | |
| KNN | 0.85 | 0.84 | 0.85 | 0.84 | 0.66 | 0.64 | 0.01 | |
| RF | 0.85 | 0.83 | 0.85 | 0.84 | 0.65 | 0.64 | 0.137 | |
| LR | 0.87 | 0.84 | 0.87 | 0.84 | 0.61 | 0.59 | 0.009 | |
| DT | 0.82 | 0.82 | 0.82 | 0.82 | 0.62 | 0.62 | 0.009 | |
| RFF | NB | 0.89 | 0.78 | 0.89 | 0.83 | 0.47 | 0.50 | 0.022 |
| MLP | 0.77 | 0.79 | 0.77 | 0.78 | 0.48 | 0.48 | 1.565 | |
| KNN | 0.86 | 0.80 | 0.86 | 0.83 | 0.50 | 0.51 | 0.019 | |
| RF | 0.88 | 0.78 | 0.88 | 0.83 | 0.47 | 0.50 | 0.163 | |
| LR | 0.89 | 0.78 | 0.89 | 0.83 | 0.47 | 0.50 | 0.008 | |
| DT | 0.73 | 0.80 | 0.73 | 0.76 | 0.50 | 0.52 | 0.009 | |
| Keras Class. | - | 0.83 | 0.76 | 0.83 | 0.79 | 0.48 | 0.50 | 10.928 |
6 Importance of Attributes
To evaluate importance positions in spike sequences, we find the importance of each attribute with respect to class label (for Clinical Data1). For this purpose, we computed the Information Gain (IG) between each attribute and the true class label. The IG is defined as follows:
| (5) |
| (6) |
where is the entropy, and is the probability of the class . The IG values for each attribute is given in Figure 5.
What is particularly interesting is that State and County code of the are two major predictors of patient outcome. This is likely due to the current vaccination situation in the US, which varies quite widely from county to county nyt_url .
7 Conclusion
We propose an efficient model for the classification of COVID-19 patients using efficient feature selection methods and machine learning classification algorithms. We show that with Boruta for feature selection, the simple classification algorithms like random forest can also beat the deep learning model when dataset size is not too big. We also show the importance of each attribute in the Clinical Data1 by computing the information gain values for each attribute corresponding to class label. In the future, we will extract more data and apply other sophisticated deep learning models such as LSTM and GRU to improve the predictive performance. We will also use other factors such as weather along with the clinical data to further improve the classification results.
These results have many practical meanings. The most direct real-world application of the machine learning model is to provide support to medical doctors during the COVID-19 pandemic. By predicting the risk level of individual patients, our model enables clinicians to wisely assign, in real-time, limited medical resources, especially during periods of medical shortage, and provide immediate treatment to the most vulnerable groups. With the help of the risk prediction system, clinicians learn which individual patients may be in danger of death and can thus conduct personalized prevention treatment in due time. Moreover, our research can be used to build a general clinical decision support system that serves not only COVID-19 but also other potential future pandemics. The patterns found in this data may also help biologies to design effective vaccines or vaccination strategies. Finally, these methodologies can be applied for future studies on big data and machine learning in the broader sense.
References
- (1) Abdulkareem, K.H., Mohammed, M.A., Salim, A., Arif, M., Geman, O., Gupta, D., Khanna, A.: Realizing an effective covid-19 diagnosis system based on machine learning and iot in smart hospital environment. IEEE Internet of Things Journal (2021)
- (2) Ahmad, M., Ali, S., Tariq, J., Khan, I., Shabbir, M., Zaman, A.: Combinatorial trace method for network immunization. Information Sciences 519, 215–228 (2020)
- (3) Alakus, T.B., Turkoglu, I.: Comparison of deep learning approaches to predict covid-19 infection. Chaos, Solitons & Fractals 140, 110120 (2020)
- (4) Albahri, A.S., Hamid, R.A., Alwan, J.K., Al-Qays, Z., Zaidan, A., Zaidan, B., Albahri, A., AlAmoodi, A., Khlaf, J.M., Almahdi, E., et al.: Role of biological data mining and machine learning techniques in detecting and diagnosing the novel coronavirus (covid-19): a systematic review. Journal of medical systems 44, 1–11 (2020)
- (5) Ali, S., Bello, B., Patterson, M.: Classifying covid-19 spike sequences from geographic location using deep learning. arXiv preprint arXiv:2110.00809 (2021)
- (6) Ali, S., Khan, M.A., Khan, I., Patterson, M., et al.: Effective and scalable clustering of SARS-CoV-2 sequences. To appear at: International Conference on Big Data Research (ICBDR) (2021)
- (7) Ali, S., Mansoor, H., Arshad, N., Khan, I.: Short term load forecasting using smart meter data. In: International Conference on Future Energy Systems (e-Energy), pp. 419–421 (2019)
- (8) Ali, S., Mansoor, H., Khan, I., Arshad, N., Khan, M., Faizullah, S.: Short-term load forecasting using AMI data. CoRR abs/1912.12479 (2020)
- (9) Ali, S., Patterson, M.: Spike2vec: An efficient and scalable embedding approach for covid-19 spike sequences. CoRR arXiv:2109.05019 (2021)
- (10) Ali, S., Sahoo, B., Ullah, N., Zelikovskiy, A., Patterson, M., Khan, I.: A k-mer based approach for SARS-Cov-2 variant identification. To Appear at: International Symposium on Bioinformatics Research and Applications (ISBRA) (2021)
- (11) Ali, S., Shakeel, M., Khan, I., Faizullah, S., Khan, M.: Predicting attributes of nodes using network structure. ACM Transactions on Intelligent Systems and Technology (TIST) 12(2), 1–23 (2021)
- (12) Devijver, P., Kittler, J.: Pattern recognition: A statistical approach. In: London, GB: Prentice-Hall, pp. 1–448 (1982)
- (13) Fung, D.L., Hoi, C.S., Leung, C.K., Zhang, C.Y.: Predictive analytics of covid-19 with neural networks. In: 2021 International Joint Conference on Neural Networks (IJCNN), pp. 1–8 (2021)
- (14) GISAID Website: . https://www.gisaid.org/ (Accessed: 10-10-2021)
- (15) Grover, A., Leskovec, J.: node2vec: Scalable feature learning for networks. In: International Conference on Knowledge Discovery & Data Mining (KDD), pp. 855–864 (2016)
- (16) Hassan, I.U., Haseeb, A., Ali, S.: Locally weighted mean phase angle (lwmpa) based tone mapping quality index (tmqi-3). Accepted at: International Conference on Intelligent Vision and Computing (ICIVC) (2021)
- (17) Hoerl, A.E., Kannard, R.W., Baldwin, K.F.: Ridge regression: some simulations. Communications in Statistics-Theory and Methods 4(2), 105–123 (1975)
- (18) Kursa, M.B., Rudnicki, W.R., et al.: Feature selection with the boruta package. J Stat Softw 36(11), 1–13 (2010)
- (19) Kuzmin, K., et al.: Machine learning methods accurately predict host specificity of coronaviruses based on spike sequences alone. Biochemical and Biophysical Research Communications 553(3), 553–558 (2020)
- (20) Leung, C.K., Chen, Y., Hoi, C.S., Shang, S., Cuzzocrea, A.: Machine learning and olap on big covid-19 data. In: 2020 IEEE International Conference on Big Data (Big Data), pp. 5118–5127 (2020)
- (21) Leung, C.K., Chen, Y., Shang, S., Deng, D.: Big data science on covid-19 data. In: 2020 IEEE 14th International Conference on Big Data Science and Engineering (BigDataSE), pp. 14–21 (2020)
- (22) Leung, C.K., Fung, D.L., Mushtaq, S.B., Leduchowski, O.T., Bouchard, R.L., Jin, H., Cuzzocrea, A., Zhang, C.Y.: Data science for healthcare predictive analytics. In: Proceedings of the 24th Symposium on International Database Engineering & Applications, pp. 1–10 (2020)
- (23) Li, W.T., Ma, J., Shende, N., Castaneda, G., Chakladar, J., Tsai, J.C., Apostol, L., Honda, C.O., Xu, J., Wong, L.M., et al.: Using machine learning of clinical data to diagnose covid-19: a systematic review and meta-analysis. BMC medical informatics and decision making 20(1), 1–13 (2020)
- (24) Van der M., L., Hinton, G.: Visualizing data using t-SNE. Journal of Machine Learning Research (JMLR) 9(11) (2008)
- (25) McDonald, G.C.: Ridge regression. Wiley Interdisciplinary Reviews: Computational Statistics 1(1), 93–100 (2009)
- (26) Melnyk, A., Mohebbi, F., Knyazev, S., Sahoo, B., Hosseini, R., Skums, P., Zelikovskiy, A., Patterson, M.D.: From alpha to zeta: Identifying variants and subtypes of sars-cov-2 via clustering. bioRxiv (2021)
- (27) NewYork Times (NYT): https://www.nytimes.com/interactive/2020/us/covid-19-vaccine-doses.html (2021). [Online; Accessed: 15-10-2021]
- (28) Rahimi, A., Recht, B., et al.: Random features for large-scale kernel machines. In: NIPS, vol. 3, p. 5 (2007)
- (29) Shakeel, M.H., Faizullah, S., Alghamidi, T., Khan, I.: Language independent sentiment analysis. In: 2019 International Conference on Advances in the Emerging Computing Technologies (AECT), pp. 1–5 (2020)
- (30) Shakeel, M.H., Karim, A., Khan, I.: A multi-cascaded deep model for bilingual sms classification. In: International Conference on Neural Information Processing, pp. 287–298 (2019)
- (31) Shakeel, M.H., Karim, A., Khan, I.: A multi-cascaded model with data augmentation for enhanced paraphrase detection in short texts. Information Processing & Management 57(3), 102204 (2020)
- (32) Ullah, A., Ali, S., Khan, I., Khan, M., Faizullah, S.: Effect of analysis window and feature selection on classification of hand movements using EMG signal. In: SAI Intelligent Systems Conference (IntelliSys), pp. 400–415 (2020)
- (33) Yang, L., Guo, Y., Cao, X.: Multi-facet network embedding: Beyond the general solution of detection and representation. In: AAAI Conference on Artificial Intelligence (AAAI), pp. 499–506 (2018)