Mainblah1 \newcitesMethodsblah2
Non-destructive optical readout of a superconducting qubit
pacs:
Valid PACS appear hereEntangling superconducting quantum processors via light would enable new means of secure communication and distributed quantum computing [1]. However, transducing quantum signals between these disparate regimes of the electromagnetic spectrum remains an outstanding goal [2, 3, 4, 5, 6, 7], and interfacing superconducting qubits with electro-optic transducers presents significant challenges due to the deleterious effects of optical photons on superconductors [8, 9]. Moreover, many remote entanglement protocols [10, 11, 12, 13] require multiple qubit gates both preceding and following the upconversion of the quantum state, and thus an ideal transducer should leave the state of the qubit unchanged: more precisely, the backaction [14] from the transducer on the qubit should be minimal. Here we demonstrate non-destructive optical readout of a superconducting transmon qubit via a continuously operated electro-optic transducer. The modular nature of the transducer and circuit QED system used in this work enable complete isolation of the qubit from optical photons, and the backaction on the qubit from the transducer is less than that imparted by thermal radiation from the environment. Moderate improvements in transducer bandwidth and added noise will enable us to leverage the full suite of tools available in circuit QED to demonstrate transduction of non-classical signals from a superconducting qubit to the optical domain.
Superconducting quantum computers using arrays of transmon qubits are a leading platform for scalable quantum computation [1]. However, these devices must operate at temperatures below mK, with quantum information encoded in microwave fields that would be corrupted by thermal noise if transmitted at ambient temperature. In contrast, optical quantum networks are a well-established technology for the transmission of quantum states over long distances, and do not require low temperatures [15, 16, 17]. Thus, a quantum-enabled electro-optic transducer linking the microwave and optical domains would greatly expand the capabilities of quantum information science.
The pursuit of an optical quantum network of superconducting qubits has given rise to a rich research field searching for efficient, low-noise electro-optic transduction techniques [2, 3, 4, 6, 9, 5, 7]. Although electro-optic elements have been demonstrated as useful tools for delivering classical signals to superconducting circuits [18, 19], devices designed to transduce quantum states must satisfy a different and more stringent set of requirements [20]. In spite of substantial recent progress, it remains an outstanding challenge to combine these transducers with superconducting qubits in a manner that is not destructive to the information stored in the qubit. An impressive recent experiment demonstrated the transduction of photons from a superconducting qubit to the optical domain [9], but the state of the qubit was destroyed by the optical pulses required for transduction. Furthermore, such piezo-optomechanical transducers require a specific piezoelectric materials platform for qubit fabrication, complicating the introduction of some recent advances in modular circuit QED [21, 22, 23].
In this work, we use a mechanically-mediated electro-optic transducer to perform non-destructive optical readout of a transmon qubit embedded in a modular 3D circuit QED architecture. The transducer imparts minimal backaction on the qubit, equivalent to only photons in the microwave readout cavity dispersively coupled to the qubit. Although the transduction bandwidth is relatively narrow, the operation of the transducer is continuous rather than pulsed [7, 9, 6], enabling efficiency and repetition rates far exceeding the values demonstrated by a device that integrates the transducer and the qubit on the same chip [9]. We then use the superconducting qubit as a non-Gaussian resource to characterise the quantum efficiency [24] with which we transduce signals from the circuit QED system to the optical domain.
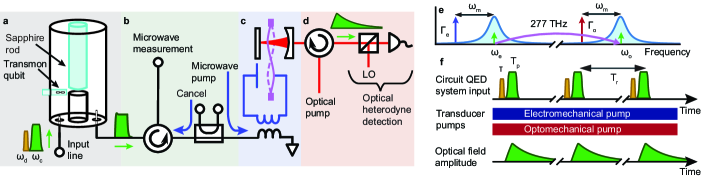
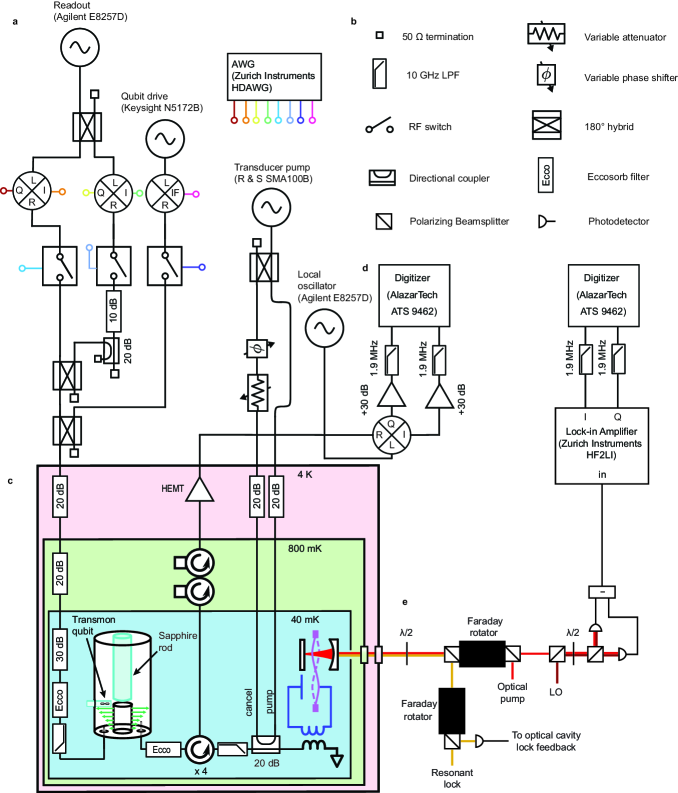
The experiment consists of two modular systems attached to the base plate of an optical-access dilution refrigerator at . The first of these (Fig. 1(a)) is a 3D circuit QED system comprising a transmon qubit dispersively coupled to a quarter-wave coaxial cavity resonator [21]. The microwave cavity has a total linewidth of kHz, while the dispersive interaction between the qubit and the cavity causes a state-dependent shift of the cavity’s resonant frequency by kHz; thus , the optimal value for low-power dispersive readout of the qubit [25]. The microwave cavity’s resonant frequency can be tuned in situ by a sapphire rod (see Fig. 1(a)) attached to a piezoelectric stepping module, enabling the microwave resonance of the circuit QED system to be brought into resonance with the transducer’s microwave mode at GHz.
The other experimental module (Fig. 1(c)) is an electro-optic transducer containing microwave and optical resonators coupled to a single mode of a silicon nitride membrane with a mechanical resonance frequency of MHz [4, 35]. Simultaneously applying strong microwave and optical pumps red-detuned by (see Fig. 1(e)) enhances the parametric coupling to the mechanical resonator [4]. This enables microwave (optical) photons to be swapped through a beamsplitter interaction with phonons at a rate () far exceeding the intrinsic mechanical dissipation rate of Hz. An incident signal on resonance with the microwave (optical) resonator will then be transduced to the optical (microwave) domain with the bandwidth of the process determined by the total damping rate .
Our optically mediated qubit readout scheme uses the dispersive interaction between the qubit and the microwave cavity, which causes the cavity’s resonant frequency to depend on whether the qubit is prepared in the ground or excited state [26]. Thus if a short microwave readout pulse centred at is applied to the microwave cavity input line (see Fig. 1(a)), the phase of the emitted microwave pulse will depend on the state of the qubit. This microwave pulse is then routed to the electro-optic transducer through elements used to isolate the qubit from transducer backaction (see Fig. 1(b) and Methods), and the upconverted readout pulse at wavelength nm is demodulated using balanced heterodyne detection (Fig. 1(d)). During qubit readout experiments, the transducer pumps are applied continuously, while qubit preparation and readout pulses are repeated at intervals ranging from 0.4 ms to 2 ms depending on the bandwidth of the transducer. The bandwidth of the transducer filters the upconverted readout pulse as shown in the bottom row of Fig. 1(f), which sets the upper limit on .
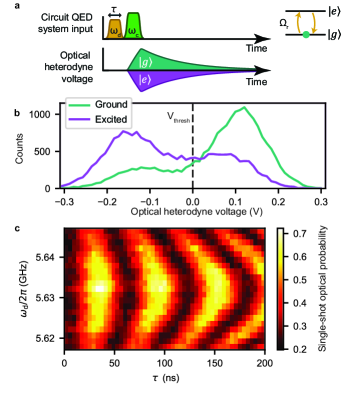
To initialise the qubit state, a short qubit drive pulse with frequency and duration (gold pulse in Fig. 2(a)) can be applied to the input line of the circuit QED system to induce Rabi oscillations in the qubit at a rate . For , the qubit population is inverted, and prepared mainly in the excited state . When no pulse is applied (), the qubit is prepared mainly in the ground state . State preparation is followed by a square readout pulse of length (green pulse in Fig. 2(a)). The maximum useful length of the readout pulse, and hence the minimum pulse bandwidth, is determined by the lifetime of the qubit ( ) [27]. The pulse then travels through the cavity and is upconverted as described above, and the demodulated optical signal is digitised and integrated to extract a single voltage encoding the state of the qubit.
We first use this protocol to demonstrate single-shot optical readout of the superconducting qubit. By recording multiple voltage traces to form histograms of the qubit state-dependent optical heterodyne voltage, we can estimate the single-shot probability , and choose a voltage threshold (see dashed line in Fig. 2(b)) to maximise the fidelity , where () is the probability of measuring () given that () was prepared. In Fig. 2(b) we show histograms of the optical heterodyne voltage when preparing the qubit in either or . The amplitude of the microwave readout pulse incident on the circuit QED system’s microwave cavity is , and the electro-optic transducer is operated continuously with kHz to transduce the emitted microwave field to the optical domain for detection. A bimodal distribution is clearly visible in each histogram, with the two modes corresponding to the ground and excited states of the qubit. We find a maximum optical readout fidelity of , limited by inefficient measurement and residual excited state population in the qubit (see Supplementary Information).
We can then use single-shot optical readout to measure Rabi oscillations of the superconducting qubit and demonstrate the stability of the optical readout. To measure Rabi oscillations we vary the qubit drive pulse length and the pulse frequency (Fig. 2(c), with the same pulse amplitude and transducer damping rates as in Fig. 2(b)). This measurement was taken over approximately 1.5 hours using a single threshold value chosen at the beginning of the experiment, indicating stability of the optical cavity lock and electro-optic transducer over this period of time.
Next, we characterise the effects of backaction from the transducer on the qubit. An ideal electro-optic transducer performs unitary operations on the microwave and optical fields, and need not add noise or impart backaction during the transduction process [28]. However, under real experimental conditions the effective thermal bath coupled to the circuit QED system imparts backaction on the qubit in the form of shot noise from microwave photons randomly arriving in the cavity. For these photons cause dephasing of the qubit of the form [29]
| (1) |
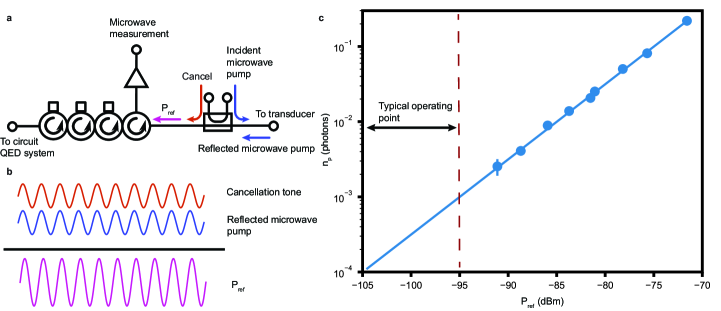
where we can split the effective occupancy into a thermal component and a component describing excess backaction from the transducer. It is desirable to minimise this excess backaction as it can limit the fidelity of error correction and post-selection operations on the qubit [14]. We are able to eliminate most of the backaction from the transducer using a combination of circulators and interferometric cancellation [30] of the strong microwave pump required for efficient transduction (see Fig. 1(b) and Methods).
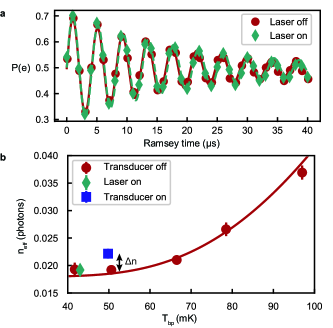
We first measure the effect of the optical pump on the circuit QED system, with the microwave pump off. In Fig. 3(a) a microwave-domain Ramsey experiment is performed to measure the coherence time of the qubit when the laser is off (red circles) and when it is on with kHz (cyan diamonds), achieved with mW of circulating power in the optical cavity. Heating of the circuit QED system by the laser would dephase the qubit and reduce its coherence time. We find and , showing no measurable change in the qubit coherence time due to laser illumination.
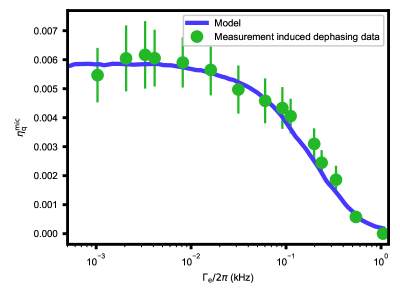
We can expand the scope of this measurement, and additionally measure the lifetime of the qubit to determine its dephasing rate , and infer the effective occupancy of the circuit QED system’s microwave cavity using Eq. (1). In Fig. 3(b) we plot this effective occupancy as the temperature of the dilution refrigerator’s base plate is varied. At low temperature, the inferred thermal occupancy plateaus at photons ( mK), though this plateau may be caused by intrinsic sources of qubit dephasing other than an elevated temperature [31]. The cyan diamond in Fig. 3(b) demonstrates that there is no measurable excess backaction from the laser ( kHz) on the qubit. We then turn on the microwave pump ( kHz, leaving unchanged) and the blue square in Fig. 3(b) indicates excess backaction of photons. This excess backaction comes largely from local heating of microwave components by the strong microwave pump with incident power dBm—see Methods for details. We emphasise that these backaction measurements are taken at the largest values of and used in this work, and backaction will likely be even lower when operating at smaller .
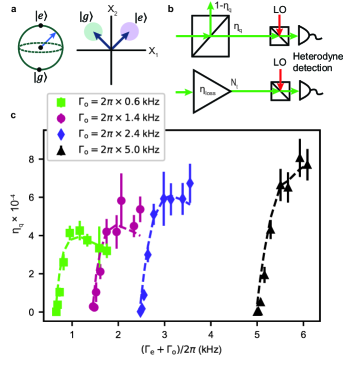
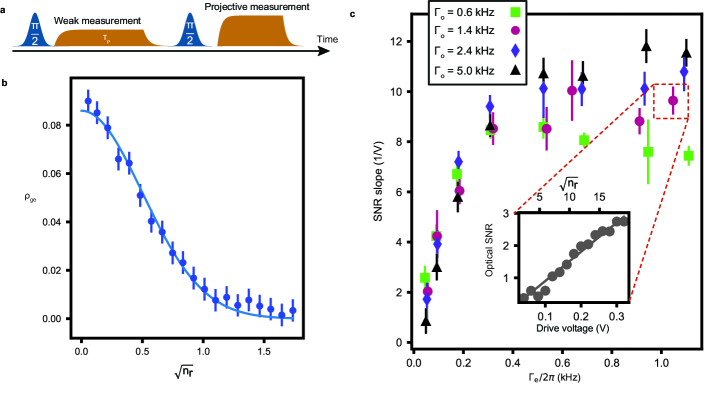
The final figure of merit for optically mediated qubit readout is the quantum efficiency , which is a measure of how well the optical measurement apparatus can distinguish the coherent states encoding the state of the qubit, and can be characterised in situ by using the superconducting qubit as a non-Gaussian resource [24, 32, 33]. As measurement photons transit the cavity and extract information about the state of the qubit, the phase coherence of the qubit is necessarily destroyed [34]. This establishes a fundamental relationship between the signal-to-noise ratio of a dispersive measurement (see Fig. 4(a)) and the measurement-induced dephasing due to the qubit readout pulse [24]—see Methods. An imperfect readout apparatus degrades the signal-to-noise ratio further, and thus reduction of the signal-to-noise ratio below this fundamental bound can be used to measure the loss and added noise of the readout process. We model the measurement apparatus as a beamsplitter with effective transmissivity (see upper row in Fig. 4(b)), with an ideal optical heterodyne detector at the beamsplitter output, combining the effects of loss and added noise into a single performance metric (see Methods for details).
In Fig. 4(c) we measure the quantum efficiency while varying the electromechanical damping for several different fixed values of the optomechanical damping rate . For the quantum efficiency decreases due to mismatched damping rates [35], while the plateau in efficiency is primarily due to noise emitted by the LC circuit and -dependent LC circuit loss. From these measurements we obtain a maximum quantum efficiency of . The dashed lines in Fig. 4(c) are obtained from a state-space model using measured transducer parameters—see Supplementary Information.
To more directly compare our optically mediated qubit readout to existing results, we can instead describe the optical measurement apparatus as an effective amplifier with gain and two-quadrature added noise at its output (see Methods and lower row in Fig. 4(b)), followed by an ideal optical heterodyne detector. Thus the total noise at the input of the ideal optical heterodyne detector consists of the sum of vacuum fluctuations, the added noise of this ideal heterodyne detector, and the transducer added noise .
We obtain a maximum transmission efficiency of , which captures all sources of loss between the circuit QED system and the optical detector, and is more than two orders of magnitude larger than the best demonstrated efficiency for transduction of states from a superconducting qubit to the optical domain [9]. This maximum value of is the product of many individual contributions, and includes the transducer efficiency as defined in Ref. [4] (), optical detection efficiency (), microwave transmission loss (), and inefficiency due to the bandwidth of the readout pulse exceeding that of the transducer ()—see Methods. The noise at the input of the optical heterodyne detector is relatively high at this operating point ( photons) owing primarily to technical noise emitted by the LC circuit, which is caused by the application of the strong microwave pump and is present even in the absence of laser light [35]. It is this added noise that is the major factor preventing quantum-enabled transduction [20]—see Methods.
However, with only moderate improvements in the bandwidth and added noise of the electro-optic transducer, the upconversion of non-trivial quantum states from a superconducting qubit is well within reach. Using standard techniques [21, 36], the lifetime of the qubit in our circuit QED system can straightforwardly be improved to . Moreover, the vacuum electromechanical coupling was smaller in this device than in previously measured transducers [35], suggesting that the transduction bandwidth can easily be improved to kHz by enhancing this coupling. The combination of spectrally narrower pulses emerging from the circuit QED system and increased would largely remove bandwidth as a limiting factor, and enhancements in would also reduce microwave noise by reducing the pump power required to achieve a given damping [35]. With kHz, , and we expect a quantum efficiency of and the ability to transmit heralded quantum states from superconducting qubits exhibiting non-classical statistics. Two such systems would then enable remote entanglement of superconducting qubits over kilometer-scale distances.
References
- Arute et al. [2019] F. Arute et al., Quantum supremacy using a programmable superconducting processor, Nature 574, 505 (2019).
- Hisatomi et al. [2016] R. Hisatomi et al., Bidirectional conversion between microwave and light via ferromagnetic magnons, Phys. Rev. B 93, 174427 (2016).
- Han et al. [2018] J. Han et al., Coherent microwave-to-optical conversion via six-wave mixing in Rydberg atoms, Phys. Rev. Lett. 120, 093201 (2018).
- Higginbotham et al. [2018] A. P. Higginbotham et al., Harnessing electro-optic correlations in an efficient mechanical converter, Nat. Phys. 14, 1038 (2018).
- Bartholomew et al. [2020] J. G. Bartholomew et al., On-chip coherent microwave-to-optical transduction mediated by ytterbium in YVO4, Nat. Commun. 11, 1 (2020).
- [6] R. Stockill et al., Ultra-low-noise microwave to optics conversion in gallium phosphide, arXiv preprint arXiv:2107.04433 .
- [7] R. Sahu et al., Quantum-enabled interface between microwave and telecom light, arXiv preprint arXiv:2107.08303 .
- Barends et al. [2011] R. Barends et al., Minimizing quasiparticle generation from stray infrared light in superconducting quantum circuits, Appl. Phys. Lett. 99, 113507 (2011).
- Mirhosseini et al. [2020] M. Mirhosseini, A. Sipahigil, M. Kalaee, and O. Painter, Superconducting qubit to optical photon transduction, Nature 588, 599 (2020).
- Campbell and Benjamin [2008] E. T. Campbell and S. C. Benjamin, Measurement-based entanglement under conditions of extreme photon loss, Phys. Rev. Lett. 101, 130502 (2008).
- Kalb et al. [2017] N. Kalb et al., Entanglement distillation between solid-state quantum network nodes, Science 356, 928 (2017).
- Zhong et al. [2020] C. Zhong et al., Proposal for heralded generation and detection of entangled microwave–optical-photon pairs, Phys. Rev. Lett. 124, 010511 (2020).
- Kurpiers et al. [2019] P. Kurpiers et al., Quantum communication with time-bin encoded microwave photons, Phys. Rev. Appl. 12, 044067 (2019).
- Hatridge et al. [2013] M. Hatridge et al., Quantum back-action of an individual variable-strength measurement, Science 339, 178 (2013).
- Inagaki et al. [2013] T. Inagaki et al., Entanglement distribution over 300 km of fiber, Opt. Express 21, 23241 (2013).
- Ursin et al. [2007] R. Ursin et al., Entanglement-based quantum communication over 144 km, Nat. Phys. 3, 481 (2007).
- Yin et al. [2017] J. Yin et al., Satellite-based entanglement distribution over 1200 kilometers, Science 356, 1140 (2017).
- Lecocq et al. [2021] F. Lecocq et al., Control and readout of a superconducting qubit using a photonic link, Nature 591, 575 (2021).
- Youssefi et al. [2021] A. Youssefi et al., A cryogenic electro-optic interconnect for superconducting devices, Nat. Electron. 4, 326 (2021).
- Zeuthen et al. [2020] E. Zeuthen, A. Schliesser, A. S. Sørensen, and J. M. Taylor, Figures of merit for quantum transducers, Quantum Sci. Technol. 5, 034009 (2020).
- Reagor et al. [2016] M. Reagor et al., Quantum memory with millisecond coherence in circuit QED, Phys. Rev. B 94, 014506 (2016).
- Campagne-Ibarcq et al. [2020] P. Campagne-Ibarcq et al., Quantum error correction of a qubit encoded in grid states of an oscillator, Nature 584, 368 (2020).
- Chakram et al. [2021] S. Chakram et al., Seamless high-Q microwave cavities for multimode circuit quantum electrodynamics, Physical Review Letters 127, 107701 (2021).
- Bultink et al. [2018] C. C. Bultink et al., General method for extracting the quantum efficiency of dispersive qubit readout in circuit QED, Appl. Phys. Lett. 112, 092601 (2018).
- Clerk et al. [2010] A. A. Clerk et al., Introduction to quantum noise, measurement, and amplification, Rev. Mod. Phys. 82, 1155 (2010).
- Blais et al. [2004] A. Blais et al., Cavity quantum electrodynamics for superconducting electrical circuits: An architecture for quantum computation, Phys. Rev. A 69, 062320 (2004).
- Gambetta et al. [2007] J. M. Gambetta et al., Protocols for optimal readout of qubits using a continuous quantum nondemolition measurement, Phys. Rev. A 76, 012325 (2007).
- Caves [1982] C. M. Caves, Quantum limits on noise in linear amplifiers, Phys. Rev. D 26, 1817 (1982).
- Clerk and Utami [2007] A. A. Clerk and D. W. Utami, Using a qubit to measure photon-number statistics of a driven thermal oscillator, Phys. Rev. A 75, 042302 (2007).
- Mallet et al. [2011] F. Mallet et al., Quantum state tomography of an itinerant squeezed microwave field, Phys. Rev. Lett. 106, 220502 (2011).
- Krantz et al. [2019] P. Krantz et al., A quantum engineer’s guide to superconducting qubits, Appl. Phys. Rev. 6, 021318 (2019).
- Rosenthal et al. [2021] E. I. Rosenthal et al., Efficient and low-backaction quantum measurement using a chip-scale detector, Phys. Rev. Lett. 126, 090503 (2021).
- Touzard et al. [2019] S. Touzard et al., Gated conditional displacement readout of superconducting qubits, Phys. Rev. Lett. 122, 080502 (2019).
- Gambetta et al. [2006] J. M. Gambetta et al., Qubit-photon interactions in a cavity: Measurement-induced dephasing and number splitting, Phys. Rev. A 74, 042318 (2006).
- [35] B. M. Brubaker et al., Optomechanical ground-state cooling in a continuous and efficient electro-optict transducer, in preparation.
- Place et al. [2021] A. P. M. Place et al., New material platform for superconducting transmon qubits with coherence times exceeding 0.3 milliseconds, Nat. Commun. 12, 1 (2021).
I Methods
II Circuit QED system
The circuit QED system consists of a planar superconducting transmon qubit coupled to the fundamental mode of a seamless 3D aluminium cavity. The qubit was fabricated on a C-plane sapphire chip. Using a single e-beam lithography step, the Dolan bridge process [1] was used to fabricate an \chAl-AlO_x-Al Josephson junction with area of . The qubit capacitance comes from two rectangular pads separated by .
The cavity, a mm long circular waveguide with radius mm, was machined out of a single piece of % purity aluminium. The waveguide is open at one end, with a mm long post with 1.5 mm radius at the other end; this geometry defines the fundamental mode as a quarter-wave resonance with evanescent coupling to the waveguide above [21]. To reduce surface loss, the cavity was etched in Transene aluminium etchant Type A for 24 hours at ambient temperature. A sapphire rod with radius mm is epoxied to a copper plate and fastened to a piezoelectric stepping module above the waveguide with a maximum travel of 5 mm. This assembly allows the sapphire rod to be translated along the centre of the waveguide to tune the fundamental mode’s resonant frequency in situ by up to GHz. The cavity mode has a total linewidth of kHz and is strongly overcoupled to the transmission line connected to the electro-optic transducer.
The circuit QED system can be described by the Jaynes-Cummings model with interaction Hamiltonian . Here, the resonator has creation (annihilation) operator , and can swap excitations with the qubit via the raising and lowering operators . When the qubit is far detuned from the resonator (, where ), the Jaynes-Cummings model can be described under the dispersive approximation . The dispersive shift is given by [2], where the qubit anharmonicity encodes the contribution from higher energy levels of the transmon qubit. See Extended Data Table 1 for a list of parameters describing the circuit QED system.
The qubit lifetime ( ) is far from Purcell-limited [3], likely due to participation of lossy dielectrics that remain after e-beam lithography and aluminium deposition. The coherence time of the qubit is , and no difference is seen when it is measured using a Hahn echo versus a standard Ramsey sequence.
The circuit QED system is contained in a magnetic shield comprising an outer shield of high-permeability Amumetal 4K and an inner shield made of pure aluminium in order to minimise stray magnetic fields near the circuit QED system during cooling of the device through its critical temperature.
III Electro-optic transducer
The electro-optic transducer consists of a microwave resonator and an optical resonator coupled to a single mode of a micromechanical oscillator. It is described by the Hamiltonian
| (2) |
where , and are the annihilation operators for the optical, microwave and mechanical modes, respectively, and is the vacuum optomechanical (electromechanical) coupling rate.
The mechanical oscillator is a 100 nm thick, 500 wide square silicon nitride membrane suspended from a silicon chip. Phononic shielding is patterned into the silicon chip, isolating the membrane mode used for transduction, with resonant frequency MHz, from vibrational modes of the chip. This shielding results in a quality factor for the mode of interest, or equivalently an energy dissipation rate Hz.
The microwave resonator is a superconducting flip-chip LC circuit whose capacitance is modulated by the motion of a superconducting pad deposited on the membrane. The vacuum electromechanical coupling is determined by the capacitor gap spacing between this pad and a second nearby chip hosting the rest of the circuit, which is nm for most devices. In the transducer used in this work the capacitor gap was unusually large, resulting in a low vacuum electromechanical coupling rate Hz. The LC circuit is coupled to a microwave transmission line at rate MHz, and its total linewidth varies between 1.6 MHz and 2.7 MHz due to dependence of the internal loss on the power of the microwave pump used to mediate transduction.
The optical resonator is a Fabry-Pérot cavity defined by high-reflectivity ion beam sputtered mirror coatings deposited by FiveNine Optics, which are chosen to be very asymmetric such that the cavity mode couples preferentially out the front mirror with external coupling MHz. The total cavity linewidth is MHz, where includes scattering and absorption losses as well as transmission through the back mirror. The membrane is positioned at a maximum in the intensity gradient of the intracavity light, yielding a vacuum coupling rate Hz. The heterodyne mode matching factor quantifying the overlap of the propagating optical cavity mode and the local oscillator beam (LO) is .
During operation, strong microwave and optical pumps are applied near the corresponding electromagnetic resonances to enhance the vacuum coupling rates and [4]. Transforming to a rotating frame to remove the free evolution of the fields, , and , the Hamiltonian can then be linearised around the strong pumps to yield
| (3) |
where () is the optical (microwave) mode coherent state amplitude due to the incident pump. Both pumps are red-detuned from the respective resonances by , resonantly enhancing the optomechanical and electromechanical beamsplitter terms in the Hamiltonian [5]. In the resolved sideband limit at this optimal detuning, the electromechanical (optomechanical) damping rate is then given by . The transducer bandwidth is given by .
IV Superconducting qubit readout signal-to-noise ratio
In a dispersive measurement, a coherent state is entangled with the state of the qubit. If initially the qubit is prepared in a superposition state , its interaction with the driven cavity mode causes it to evolve into the state
| (4) |
where and are coherent states with equal magnitude but phases shifted by , with the sign corresponding to the qubit in (). The readout amplitude determines the separation in phase space between these two coherent states. The degree to which we can resolve the two Gaussian distributions in phase space is quantified by the signal-to-noise ratio (SNR): loss degrades the SNR by reducing the phase space separation, while noise degrades the SNR by increasing the variance of each distribution. We define the SNR as
| (5) |
where is the standard deviation of the Gaussian-distributed optical heterodyne voltage corresponding to the qubit in either the ground or the excited state, and and are the mean values of the two distributions. Noise gets added by the transducer, and some of the signal is lost such that ; thus the SNR can be written as
| (6) |
V Measurement-induced dephasing and the quantum efficiency
Reading out the state of the qubit through the cavity necessarily causes fluctuations in the frequency of the qubit due to the dispersive interaction between the qubit and the cavity . This leads to measurement-induced dephasing [34], destroying the coherence of any initial superposition. The off-diagonal elements of the qubit’s density matrix after this interaction are given by [32].
To demonstrate measurement-induced dephasing we inject a weak measurement pulse into a Ramsey sequence (see Extended Data Fig. 1(a)), and measure the resulting amplitude of the Ramsey oscillations—where —using a strong projective measurement of the qubit. Extended Data Fig. 1(b) shows the results of these measurements, using the microwave readout chain and varying the strength of the weak readout pulse. We observe a clear Gaussian decay of as a function of readout amplitude .
This measurement-induced dephasing quantifies the amplitude of the readout pulse inside of the circuit QED system’s microwave cavity, while the SNR quantifies the distinguishability of the two (thermal) coherent states at the optical detector. Thus these two quantities are fundamentally related to each other via the quantum efficiency [24], which describes the optical measurement apparatus as an effective beamsplitter between the circuit QED system and an ideal optical heterodyne detector.
VI Technical details of the quantum efficiency calibration
To control the readout amplitude a drive voltage is varied via an IQ mixer. The SNR and Gaussian decay of can be recast in terms of this drive voltage as: and . As shown in Ref. [24], the quantum efficiency is then a function of the slope of the SNR (see Extended Data Fig. 1(c)) and the width of the Gaussian distribution :
| (7) |
where in this convention an ideal heterodyne detector would have
VII Contributions to the quantum efficiency
The quantum efficiency of the optically mediated qubit readout apparatus can be split into seven main components, . We describe each contribution below, and the contributions are also summarised in Extended Data Table 2.
Bandwidth limitations. A significant contribution to is due to the mismatch in bandwidth between the transducer and the readout pulse emitted by the qubit cavity. In the rotating wave approximation, and approximating the circuit QED system’s output as a square pulse with width , we obtain
| (8) |
Solving for the full dynamics without the above approximations gives a contribution to the efficiency in the range over the range of values plotted in Fig. 4(c) in the main text.
Transducer efficiency. The relatively low electromechanical coupling in this device ( Hz) limits the maximum achievable electromechanical damping rate to kHz. To maximise bandwidth we often operate the transducer in a mismatched mode with , but this comes at a cost to the narrowband signal efficiency of the transducer [35]:
| (9) |
which sets an upper bound on the efficiency with which broadband signals can be transduced. Eq. (9) also depends on implicitly due to the pump power-dependent LC circuit loss [35]. This contribution is responsible for the sharp drop in efficiency for on each curve in Fig. 4(c) in the main text, and contributes to the plateau in at high for each fixed value of .
Transducer gain Due to the finite sideband resolution of the electro-optomechanical system [5], the transducer has gain [4]
| (10) |
This two-quadrature gain is undesirable for transduction, as it is necessarily accompanied by unwanted added noise [28], but it is a small effect, varying in the range with microwave pump power.
Microwave transmission loss between the circuit QED system and the transducer. Our system also permits qubit readout through a microwave readout apparatus, shown in Fig. 1(b) of the main text. Its quantum efficiency is defined to include all sources of loss and noise that affect the readout pulse as it emerges from the circuit QED system’s cavity, reflects off the transducer’s LC circuit, and is detected using the microwave heterodyne measurement chain. Measuring allows us to back out the microwave transmission loss between the circuit QED system and the transducer, which also contributes to . As shown in Extended Data Fig. 2, decreases significantly with increasing —mainly due to -dependent reflection loss. This data is fit to a model (purple curve in Extended Data Fig. 2) that includes the effects of -dependent LC circuit reflection loss, noise emitted from the microwave port of the transducer, and independently calibrated microwave measurement chain added noise referred to the transducer output [35], with as the only free parameter, yielding (4.7 dB). This relatively high loss can be mitigated by reducing the total number of microwave connectors in the signal path, switching to superconducting cables, and removing filters from the signal path and placing them instead on the pump and cancellation lines.
Using the quantum efficiency of the optical measurement apparatus and a state-space model (see Supplementary Information) we perform a fit to as is varied, with as the only free parameter. This yields an apparent microwave loss of , in slight tension with inferred from the microwave measurement described above. This discrepancy may be due to drifts in the optical cavity mode matching or microwave chain gain over a several month time scale.
Optical detection efficiency. The optical detection efficiency is given by the product of factors encoding optical transmission losses between the transducer and the balanced heterodyne detector, the inefficiency of the heterodyne detector itself, and the detector’s dark noise: together these three factors yield . This figure excludes optical cavity losses and imperfect mode matching, which are included in the transducer efficiency, Eq. (9).
Circuit QED system cavity loss. Through the measured attenuation on the lines, we bound the sum of the of the weak port coupling and the internal loss to kHz. Thus does not significantly affect .
Added noise. Here we show how the noise measured at the input of the optical heterodyne detector, or equivalently at the output of an effective amplifier with gain , can alternatively be expressed as a contribution to the quantum efficiency of the optically mediated readout apparatus, modelled as an effective beamsplitter (see Fig. 4(b) in the main text).
The voltage records obtained from optical heterodyne detection of the upconverted qubit readout pulse can be written in the form
| (11) |
| (12) |
where is an overall gain factor and the index labels whether the qubit was prepared in the ground state or the excited state. includes all sources of loss between the circuit QED system and the ideal optical detector, while and are noise operators whose autocorrelation functions include contributions from vacuum fluctuations, the added noise of an ideal heterodyne detector, and transducer added noise :
| (13) |
Eqs. (11), (12), and (13) define the amplifier model described in Fig. 4(b) of the main text in which the transduction process is characterised by an efficiency and total two-quadrature noise at the input of an ideal optical detector. But for qubit readout it is often more convenient to combine these metrics into a single figure of merit. To this end, we rescale Eqs. (11), (12) to obtain
| (14) |
| (15) |
where is a modified overall gain factor, and and are noise operators containing only contributions from vacuum fluctuations and ideal heterodyne detection: . From Eqs. (14) and (15) it is clear that can be defined as
| (16) |
See Supplementary Information for a derivation of the exact form of .
VIII Prospects for quantum transduction
The relevant figure of merit for quantum state transduction is the added noise referred to the output of the circuit QED system [20]. When we optimise for maximum efficiency, with kHz, and achieve , we obtain photons. This is of course far from the value required for quantum-enabled transduction [20] and is limited by insufficient bandwidth, LC circuit loss, transducer efficiency, and pump power-dependent noise generated by the LC circuit [35]. However, even moderate improvements in the vacuum electromechanical coupling will greatly improve , , and .
An increase in would provide many simultaneous improvements to the operation of the transducer by reducing the number of microwave pump photons required to achieve a given transduction bandwidth. For example, Hz would enable kHz and reduce pump power-dependent LC circuit loss, yielding . If accompanied by an increase in the qubit decay times to , we expect , and the transducer to be quite close to quantum-enabled with . Further reductions in added noise, which will be needed to approach the regime, are currently being explored, including the use of wafer bonding to achieve more reliable and even larger electromechanical coupling rates. Pump-induced vortex loss in the superconductor is also currently being investigated as a possible source of both LC circuit loss and added noise, which may be improved through better magnetic shielding.
IX Isolation and filtering
The two modular systems are connected via a coaxial transmission line through a single-junction circulator in series with a triple-junction circulator. This provides a total of 63 dB of isolation to shield the circuit QED system from the strong microwave pump (up to dBm incident on the LC circuit), which is routed to the transducer through a directional coupler. Additional isolation is achieved by sending a cancellation tone through the second port of the directional coupler (labelled “cancel port” in Extended Data Fig. 3(a)) to interferometrically cancel the large reflected microwave pump [30]. Filters are also placed between the circuit QED system and the transducer to eliminate the propagation of high-frequency thermal radiation along the coaxial cable connecting the two systems. See Extended Data Fig. 4(c) for details of the layout and filtering.
X Source of excess backaction
As shown in Fig. 3(b) of the main text, there is a small amount of excess backaction from the operation of the transducer at very high , equivalent to excess photons in the circuit QED system’s microwave cavity. Two possible mechanisms could cause such excess backaction: heating of the 50 termination that thermalises the circuit QED system by the strong microwave pump, or direct backaction from pump photons making it through the isolation between the circuit QED system and the transducer. We can differentiate these two possible sources of backaction by using our cancellation scheme as an interferometer to tune the power of the microwave field propagating towards the circuit QED system (see Extended Data Fig. 3(a),(b)).
The number of pump photons in the circuit QED system’s microwave cavity can be accurately measured by monitoring the qubit frequency shift due to the (coherent) AC Stark effect [34]. Extended Data Fig. 3(c) shows the number of coherent pump photons in the circuit QED system’s cavity as a function of . During normal operation of the transducer the cancellation is optimised so that dBm, and we can linearly extrapolate to low powers to find that during normal operation. The measured excess backaction is larger, so it is likely that local heating of the 50 termination that thermalises the circuit QED system is responsible for the majority of the excess backaction observed in Fig. 3(b) in the main text. Improvements in that will enable a reduction in microwave pump power will serve to further reduce this excess backaction.
XI acknowledgements
We acknowledge funding from AFOSR MURI Grant No. FA9550-15-1-0015, from ARO CQTS Grant No. 67C1098620, and NSF under Grant No. PHYS 1734006. We thank Jim Beall and Katarina Cicak for help with our fabrication process, as well as Ramin Lalezari for fabricating the optical cavity mirror coatings. We thank John Teufel, Graeme Smith, Kyle Quinlan, Kazemi Adachi and Luca Talamo for feedback on the manuscript.
XII Supplementary Information
Supplementary Information is available for this paper.
XIII author contributions
R.D.D., C.A.R. and K.W.L. conceived of the experiment. B.M.B., M.D.U., J.M.K., S.M. and R.D.D. planned and carried out the measurements. M.D.U. constructed the optical cavity. R.D.D. designed and fabricated the circuit QED system. S.M. and P.S.B. developed the fabrication process for the chips hosting the electrical circuit and membrane, which were fabricated by S.M. All authors contributed to writing the manuscript.
XIV Data availability
The experimental data and numerical calculations are available from the corresponding author upon reasonable request.
References
- Dolan [1977] G. J. Dolan, Offset masks for lift-off photoprocessing, Appl. Phys. Lett. 31, 337 (1977).
- Koch et al. [2007] J. Koch et al., Charge-insensitive qubit design derived from the Cooper pair box, Phys. Rev. A 76, 042319 (2007).
- Houck et al. [2008] A. A. Houck et al., Controlling the spontaneous emission of a superconducting transmon qubit, Phys. Rev. Lett. 101, 080502 (2008).
- Andrews et al. [2014] R. W. Andrews et al., Bidirectional and efficient conversion between microwave and optical light, Nat. Phys. 10, 321 (2014).
- Aspelmeyer et al. [2014] M. Aspelmeyer, T. J. Kippenberg, and F. Marquardt, Cavity optomechanics, Rev. Mod. Phys. 86, 1391 (2014).
| Parameter | Symbol | Value |
|---|---|---|
| Qubit frequency | GHz | |
| Qubit-cavity coupling | MHz | |
| Qubit anharmonicity | MHz | |
| Dispersive shift | kHz | |
| Cavity frequency | GHz | |
| Cavity linewidth | kHz | |
| Weak port coupling | kHz | |
| Cavity internal loss | kHz | |
| Qubit lifetime | ||
| Ramsey time | ||
| Optical cavity frequency | THz | |
| Optical cavity external coupling | MHz | |
| Optical cavity linewidth | MHz | |
| LC circuit frequency | GHz | |
| LC circuit external coupling | MHz | |
| LC circuit linewidth (low pump power) | MHz | |
| LC circuit linewidth (high pump power) | MHz | |
| Mechanical mode frequency | MHz | |
| Intrinsic mechanical dissipation rate | Hz | |
| Vacuum optomechanical coupling | Hz | |
| Vacuum electromechanical coupling | Hz | |
| Optical cavity mode matching |
| Parameter | Symbol | Value |
|---|---|---|
| Finite bandwidth | see Eq. (8) | |
| Microwave transmission loss | ||
| Circuit QED system cavity loss | ||
| Optical detection efficiency | ||
| Added noise | ||
| Transducer efficiency | See Eq. (9) | |
| Transducer gain | See Eq. (10) |