Paleomagnetic evidence for a disk substructure in the early solar system
Abstract
Astronomical observations and isotopic measurements of meteorites suggest that substructures are common in protoplanetary disks and may even have existed in the solar nebula. Here, we conduct paleomagnetic measurements of chondrules in CO carbonaceous chondrites to investigate the existence and nature of these disk sub-structures. We show that the paleomagnetism of chondrules in CO carbonaceous chondrites indicates the presence of a 101 48 T field in the solar nebula in the outer solar system (3 to 7 AU from the Sun). The high intensity of this field relative to that inferred from inner solar system (3 AU) meteorites indicates a factor of 5 to 150 mismatch in nebular accretion between the two reservoirs. This suggests substantial mass loss from the disk associated with a major disk substructure, possibly due to a magnetized disk wind.
1 Introduction
Observations from the Atacama Large Millimeter/submillimeter Array have shown that substructures, mostly in the form of rings and gaps, are prevalent in protoplanetary disks (Andrews, 2020). Isotopic studies of meteorites and their components have been interpreted as evidence that two isotopically distinct regions existed within 7 astronomical units (AU) from the young Sun (see the Supplementary Materials), known as the noncarbonaceous (3 AU) and carbonaceous reservoirs (3 to 7 AU) (Kruijer et al., 2020; Scott et al., 2018), that existed during the protoplanetary disk phase of the solar system (i.e., solar nebula). It has been proposed that these two reservoirs were separated by a gap in the disk, perhaps generated by the growth of Jupiter (Kleine et al., 2020) and/or a pressure local maximum in the disk (Brasser & Mojzsis, 2020). Alternatively, these two reservoirs may have formed because of a migrating snowline with no persistent disk gap (Lichtenberg et al., 2021). Because the evolution of protoplanetary disks is thought to depend on the coupling of the weakly ionized gas of the disk with large-scale magnetic fields (Bai & Goodman, 2009; Bai, 2017; Turner et al., 2014; Weiss et al., 2021), we can search for evidence of disk substructures and explore their origin by studying the paleomagnetism of meteorites that formed in each reservoir.
Previous paleomagnetic measurements of LL chondrites, derived from the noncarbonaceous reservoir, indicate the presence of a disk midplane magnetic field of 54 21 T at 2.0 0.8 million years (Ma) after the formation of calcium-aluminum–rich inclusion (CAIs) (Fu et al., 2014; Kita & Ushikubo, 2011). These paleointensities, which were measured from individual chondrules that carry thermoremanent magnetization (TRM) acquired before their accretion onto the LL parent body, provide evidence for the existence of a nebular magnetic field in the noncarbonaceous reservoir. Paleomagnetic studies of CM (Cournede et al., 2015), CR (Fu et al., 2020a), and CV (Fu et al., 2021) chondrites indicate a field in the carbonaceous reservoir of 6 T at 3 Ma after CAI formation, 8 T at 3.7 Ma after CAI formation (Weiss et al., 2021; Schrader et al., 2017), and 40 T sometime between 3-40 Ma after CAI formation (Fu et al., 2021; Carporzen et al., 2011). However, these records have several key limitations. For instance, the records in CM and CV chondrites are postaccretional chemical remanent magnetizations acquired during parent-body alteration (Cournede et al., 2015). This poses two problems: The magnetic record could have been imparted by a parent-body dynamo field rather than from the solar nebula field and the retrieved paleointensity is likely a lower limit (Weiss et al., 2021). In addition, the age of the CR record is within error of the estimated lifetime of nebula (Wang et al., 2017), such that it may not constrain the strength of the nebular field during the main period of disk accretion (Weiss et al., 2021). Therefore, the intensity of the nebular field in the carbonaceous reservoir is currently poorly constrained.
To obtain robust paleointensity records from the midplane of the solar nebula in the carbonaceous reservoir, we conducted paleomagnetic studies on two CO carbonaceous chondrites: Allan Hills (ALH) A77307 (type 3.03) and Dominion Range (DOM) 08006 (type 3.00) (Bonal et al., 2007; Davidson et al., 2019; Alexander et al., 2018; Scott et al., 1992; Alexander et al., 2007). We selected these meteorites because they experienced low peak metamorphic temperatures (200∘ to 300∘C), minor parent-body aqueous alteration, shock pressures below 5 GPa, and minimal terrestrial weathering (weathering grades A/B and Ae, respectively) (Bonal et al., 2007; Davidson et al., 2019; Alexander et al., 2018; Scott et al., 1992; Alexander et al., 2007). Therefore, they are unlikely to have been magnetically overprinted following accretion onto the CO parent body, with DOM 08006 in particular being one of the least altered known meteorites (Davidson et al., 2019). Following the previous paleomagnetic study of LL chondrules, we targeted dusty olivine chondrules because they contain high-fidelity paleomagnetic recorders in the form of fine-grained (25 to 1000 nm) kamacite (-Fe) crystals formed before accretion onto the parent body (Fu et al., 2014; Shah et al., 2018; Einsle et al., 2016; Lappe et al., 2011, 2013). Because chondrules cooled quickly in the protoplanetary disk environment [100∘ to 1000∘C hour-1; (Scott & Krot, 2013)], they should carry a near-instantaneous TRM record of the nebular field (Fu et al., 2014; Desch et al., 2012, 2010). Al-Mg dating of CO chondrules indicate that this record was acquired 2.2 0.8 Ma after CAI formation (Kita & Ushikubo, 2011)111Recent high-precision Al-Mg ages of LL chondrules support a shorter formation interval than previous Al-Mg ages. See Supplementary Text for more information..
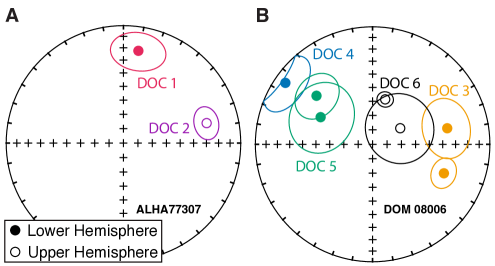
We extracted six 100- to 300-m-diameter dusty olivine chondrules from both meteorites: two from ALHA77307 (DOC1 and DOC2) and four from DOM 08006 (DOC3, DOC4, DOC5, and DOC6). Three of the DOM 08006 chondrules were split into two subsamples each (DOC3a, DOC3b, DOC5a, DOC5b, and DOC6a, DOC6b) to produce nine total subsamples from both meteorites used for paleomagnetic measurements. All chondrules and chondrule fragments were mutually oriented during extraction and paleomagnetic measurements.
Given the chondrules’ weak natural remanent magnetization (NRM) (ranging from 1.310-10 down to 1.710-12 Am2 before demagnetization), we obtained magnetic measurements using the superconducting quantum interference device (SQUID) microscope and quantum diamond microscope (QDM) in the Massachusetts Institute of Technology (MIT) Paleomagnetism Laboratory (see Materials and Methods) (Weiss et al., 2007).
2 Results
Backscattered electron microscopy (BSE) images and compositional analysis using wavelength dispersive spectrometry (WDS) indicate that the chondrules contain numerous submicrometer diameter inclusions of nearly pure-Fe kamacite (see the Supplementary Materials). Furthermore, QDM imaging confirms that the magnetization-carrying capacity of the chondrules is dominated by these grains rather than by any multidomain metal grains and/or secondary ferromag- netic minerals (see the Supplementary Materials). These fine metal grains are expected to have formed during subsolidus reduction of the chondrules before their accretion on the parent body (Lappe et al., 2011). On the basis of their size and composition, many of these grains are predicted to be in the single vortex size range and smaller, which has been shown to have the potential to carry paleomagnetic records over a period longer than the lifetime of the solar system (Fu et al., 2014; Nagy et al., 2019).
Our alternating field (AF) demagnetization showed that some subsamples carried a low-coercivity (LC) component blocked up to 20 mT (Fig. 1 and figs. S2 and S3). The LC component may be a viscous remanent magnetization acquired on Earth and/or a weak-field isothermal remanent magnetization acquired during sample handling. After the removal of the LC component, all subsamples were found to contain high-coercivity (HC) components blocked up to at least 50 mT (Fig. 1 , figs. S2 and S3, and table S1), with two subsamples having HC components blocked up to 160 and 270 mT (Fig. 1 and fig. S2).

The high AF-stability of the HC components coupled with the pristine conditions of the meteorites suggest that the HC components are likely records of the nebular field. To further test this conclusion, we conducted unidirectionality tests and conglomerate tests (see the Supplementary Materials). Because the nebular field is expected to have been directionally homogeneous on submillimeter length scales, a nebular TRM should be unidirectional within each chondrule. Our measurements confirm this: Pairs of subsamples of three DOM 08006 chondrules have HC directions within each other’s maximum angles of deviation (Fig. 2). In addition, if the chondrules have not been remagnetized since parent body accretion (including on their parent body and after arrival on Earth), then they should collectively exhibit random magnetization directions. Our measure- ments of two chondrules from ALHA77307 and four chondrules from DOM 08006 (Fig. 2) confirm this: We cannot reject the hypothesis that both sets of directions are random with 95% confidence (Watson, 1956) (see the Supplementary Materials). In summary, the unidirectionality and conglomerate tests strongly support the conclusion that the chondrules carry robust paleomagnetic records of the solar nebula magnetic field acquired before accretion onto their parent bodies.
To determine the paleointensity of the recorded field, we compared the AF demagnetization of the NRM to that of an anhysteretic remanent magnetization (ARM) acquired in a bias field of 200 T and a peak AF of up to 145 mT for seven chondrules [following previous studies (Tikoo et al., 2014)]. Paleointensity estimates were estimated assuming a ratio of ARM to TRM of 1.87 as previously measured for dusty olivine chondrules (see Materials and Methods). The resulting mean HC paleointensity estimates from two ALHA77307 chondrules and five DOM 08006 chondrules are 30 10 T and 59 31 T, respectively. Combining the seven samples and accounting for chondrule spinning during TRM acquisition [which decreases the background nebular field intensity recorded by the chondrule by an average factor of 2 (Fu et al., 2014)], we obtained a grand mean paleointensity of the background nebular field of 101 48 T (table S2).
3 Discussion
Together with the previous paleomagnetic study of CM chondrites (Cournede et al., 2015), the magnetic record from CO chondrules strongly supports the presence of a nebular magnetic field in the carbonaceous reservoir at 2 to 3 Ma after CAI formation. Furthermore, the data from the CO chondrules provide the first accurate constraints on the intensity of the nebular magnetic field in the carbonaceous reservoir. In particular, the CO chondrule paleointensities are 16 times higher than the lower limit measured from bulk CM chondrites, which highlights the importance of measuring TRMs to obtain robust magnetic records. The identification of magnetic fields in the noncarbonaceous and carbonaceous reservoirs suggests a widespread role for magnetically driven accretion in the early solar system.

The structures and evolution of protoplanetary disks are governed by the mechanisms that drive disk accretion, likely mediated by magnetic fields. The accretion rate scales quadratically with field strength in the disk midplane with a prefactor depending on disk microphysics (especially ionization and field orientation). For a spatially constant accretion rate, the field intensity should decay as R-5/4 or R-11/8, where is the radial distance from the Sun, depending on whether accretion is primarily driven by the radial-toroidal () or vertical-toroidal () components of the Maxwell stress (Fig. 3) (Weiss et al., 2021). Because of the Hall effect, the predicted field intensity is a factor of up to 10 higher if the background field threading the disk is aligned with disk rotation axis compared to the antialigned case. Given typical astronomically observed disk accretion rates of 110-8 year-1 (Hartmann et al., 1998), the measured CO paleointensity strongly favors the scenario of aligned polarity (Fig. 3), which would otherwise lead to an unreasonably large accretion rate (110-5 year-1).
Considering the mean paleointensities from LL and CO chondrules, we find that the accretion rate was highly variable in the early solar system: for a disk with aligned polarity and a net vertical magnetic field ( only), the accretion rates are 10-9 year-1 in the noncarbonaceous reservoir and 10-7 year-1 in the carbonaceous reservoir (Fig. 3). The observed factor of 5 to 150 variation in the magnetically driven accretion rate between the two reservoirs could reflect variations in the accretion rate in time and/or in space. Temporal variations would be broadly consistent with astronomically observed accretion bursts in protoplanetary disks that occur on a timescale of hundreds of years (Hartmann et al., 2016). However, our Monte Carlo simulations suggest that the probability that the observed changes in accretion are due to temporal fluctuations is 0.4% (see the Supplementary Materials). Thus, our results favor the presence of a spatial mismatch in the magnetically driven accretion rates between the two reservoirs. This spatial mismatch in the accretion rate has also been observed in recent paleomagnetic measurements of the CV chondrite Allende (Fu et al., 2021). While a spatial variation in accretion rate has also been proposed to explain the anomalously weak fields recorded by CR chondrules, it was not possible to conclusively differentiate between varying accretion rates or a null magnetic record because of the prior dissipation of the solar nebula in those samples (Weiss et al., 2021).
The observed mismatch in the accretion rates requires a mechanism that removed mass from the accretion flux between the carbonaceous and the noncarbonaceous reservoirs. If proto-Jupiter or another giant planet was present between the two reservoirs, then it is possible that part of this accretion flux was intercepted and accreted onto the growing planet. However, if the mismatch was completely due to accretion onto proto-Jupiter, that would require a growth time scale of just 10,000 years for the planet. This is several orders of magnitude faster than the several–million year time scale predicted by the core accretion model, the favored mechanism for Jupiter formation (Atreya et al., 2018). Alternatively, a large fraction of accretion mass flux could be lost through a disk outflow. A substantial mass loss has been predicted in theoretical models of photoevaporation leading to inside-out disk clearing [e.g., (Clarke et al., 2001; Owen et al., 2012; Picogna et al., 2019)]. On the other hand, given the likely role magnetic fields in driving disk accretion, photo-evaporation and magnetized disk winds may operate concurrently (Wang et al., 2019; Bai, 2016), leading to magnetothermal disk winds whose mass loss rates are comparable to or exceed that of observed accretion rates of protoplanetary disks. This is sufficient to account for our observed mismatch in accretion rates and potentially lead to the formation of an inner cavity (i.e., extreme version of a gap) (Suzuki et al., 2016). Note, however, that this scenario does not preclude a role for Jupiter in gap formation. Its presence would likely accelerate the formation of the cavity (Rosotti et al., 2013), transforming the solar nebula into a transition disk.
In summary, we present a robust record of magnetic fields in the carbonaceous reservoir of the solar nebula. When compared to previous measurements of magnetic fields from the noncarbonaceous reservoir and models that describe the magnetic field in protoplanetary disks, we observe that the accretion rate in the carbonaceous reservoir is several times higher than that of the noncarbonaceous reservoir, implying the presence of a mismatch in accretion rates. This mismatch may be associated with disk mass loss through the presence of a gas giant, photoevaporation, and/or magnetized winds. These mechanisms could produce a disk substructure like those observed astronomically and like that inferred from the isotopic dichotomy measured among various meteorites in the early solar system.
4 Materials and Methods
4.1 Chondrule extraction and orientation
Bulk samples of ALHA77307,157 (0.57 g) and DOM 08006,102 (2.8 g) were obtained from the NASA Johnson Space Center. At MIT, oriented thick sections were cut from these using a wire saw cooled with ethanol during cutting. Each thick section had an average area of 4 cm2 and a thickness of 500 m. The thick sections were then polished down to 1-m roughness, and dusty olivine chondrules were identified using reflected light microscopy. Overall, we found that dusty olivine chondrules are very rare among CO chondrites, with a frequency of only 1 out of 100 chondrules (0.005 inclusion mm-3). The six dusty olivine chondrules used in this study were obtained from two thick sections from ALHA77307 and eight from DOM 08006. We note that some thick sections did not contain identifiable dusty olivine chondrules. All extracted chondrules were at least 3 mm away from the fusion crust of the parent sample (table S1).
Figure S1 shows the procedure for chondrule extraction. Before extraction, the thick section surface orientation was documented using imaging with a petrographic microscope (step 1, fig. S1). A region of 300 to 500 m in thickness was excavated around the target chondrule using a degaussed carbide dental drill bit (step 2, fig. S1). After excavation, we used two different techniques to extract the chondrules. In the first technique, chondrule samples DOC1, DOC2, DOC3a, and DOC3b were extracted using a degaussed dental drill then glued to the quartz disk using cyanoacrylate cement. While the glue hardened, we oriented the sample by comparing its surface with the previously acquired image of the chondrule in situ. In the second technique, chondrule samples DOC4, DOC5a, DOC5b, DOC6a, and DOC6b each had a 400 m by 400 m by 1000 m non-magnetic quartz glass coverslip glued with cyanoacrylate cement onto their top surfaces (step 3, fig. S1). We then marked the glass with a marker to orient it with respect to the thick section. The chondrules were then extracted using a degaussed dental drill bit and mounted on a quartz glass with cyanoacrylate cement. After extraction, we added Kapton tape as standoffs that were at least 2 mm away from the samples (step 4, fig. S1). The standoffs were added such that they were slightly higher than the samples, protecting the samples from rubbing against the SQUID microscope window during the magnetic measurements. Table S1 shows the orientations of the chondrules during the SQUID microscope measurements. We estimate that the extraction and mounting techniques can add up to 15∘ of total angular uncertainty.
4.2 Paleomagnetism
We used AFs to demagnetize the chondrules in steps of 5 or 10 mT, using an automatic 3-axis degausser system integrated into the 2G Enterprises Superconducting Rock Magnetometer 755R (Kirschvink et al., 2008) at MIT. We demagnetized the samples with repeated AF applications to reduce spurious ARM and used the Zijderveld-Dunlop averaging method to correct for gyroremanent magnetization (Stephenson, 1993). The maximum AF field necessary to demagnetize the samples varied among our samples. Sample DOC1 was demagnetized up to 400 mT, DOC2 up to 410 mT, DOC3a up to 100 mT, DOC3b up to 60 mT, DOC4 up to 100 mT, DOC5a up to 60 mT, DOC5b up to 75 mT, DOC6a up to 70 mT, and DOC6b up to 100 mT. For each AF step, we measured the magnetic field of each sample six times: once after applications of the AF in the , , and directions successively, twice after applications in the direction, twice after applications in the direction, and once after an application in the direction.
NRM measurements were obtained using the SQUID microscope in the MIT Paleomagnetism Laboratory (Weiss et al., 2007). Measurements of the samples’ magnetic fields were obtained at an effective sensor-to-sample distance of 300 m (Weiss et al., 2007). For samples found to be dipolar magnetic field sources (DOC1, DOC2, DOC3a, DOC3b, DOC4, DOC5b, and DOC6b), we used a previously described inversion technique to obtain the magnetic moment from the magnetic field (Lima & Weiss, 2016). For samples DOC5a and DOC6a, whose fields were found to be nondipolar, we upward-continued the magnetic maps by 150 m and retrieved their dipole moments using averages from a first- to the fifth- and second-degree multipole model, respectively. After obtaining magnetic moments from each AF step, we averaged across the six steps and sometimes also across AF levels. The directions of NRM components were calculated using principal components analysis (Kirschvink, 1980). The demagnetization projections are shown in figs. S2 and S3. If a NRM component had a deviation angle less than the maximum angle deviation, then this component was inferred to be the characteristic component and therefore anchored to the origin (Kirschvink, 1980; Tauxe & Staudigel, 2004). Table S1 shows the results of the principal components analysis including the levels that were averaged.
| (1) |
where is the ancient magnetic field recovered from the experiment, is the 200-T ARM bias magnetic field applied to the sample, and are the respective changes in magnetic moment during the demagnetization of the NRM and the ARM, and is the ratio of TRM to ARM. The ARM was applied with a peak AF field of 145 mT for DOC1 and DOC2, 100 mT for DOC3a, 60 mT for DOC3b, 100 mT for DOC4, 75 mT for DOC5b, and 100 mT for DOC6b. We AF demagnetized the ARM using the same sequence used for the NRM. All samples used for paleointensity determination were nearly dipolar sources, such that we used the inversion technique for dipolar sources described above. Following previous paleomagnetic studies of dusty olivine chondrules, we adopted an experimentally determined value for f’ of 1.87 (Fu et al., 2014; Lappe et al., 2013).
Figures S5 and S6 show the results of the paleointensity experiments. For all samples except DOC3a, we fit for / using reduced major axis least squares. For DOC3a, we used ordinary least squares because the correlation parameter was 0.6 (Smith, 2009). was calculated by vector subtraction from the first demagnetization step in the HC component fit, while was calculated by subtraction from the first acquired ARM step. Table S5 shows a summary of the paleointensities and their quality criteria.
4.3 Mineralogy
Mineral compositions (fig. S4 and tables S3 and S4) were analyzed on a JEOL JXA-8200 Superprobe electron probe microanalyzer (EPMA) using WDS in the MIT Electron Microprobe Facility. BSE images were obtained with the same instrument (fig. S4). The EPMA was operated at an accelerating voltage of 15 kV and a beam current of 10 nA, and natural and synthetic standards were used for calibration. The counting times were typically 40 s per element, and the 1 SDs of the accumulated counts were 0.5 to 1.0% from counting statistics. The raw data were corrected for matrix effects using the CITZAF package (Armstrong, 1995). To identify the origin of the magnetic signal of these two samples, we mapped the magnetization of chondrules using the QDM at MIT (fig. S4) (Fu et al., 2020b; Glenn et al., 2017). The sensor to sample distance was 5 m, and the map resolution was 1.17 m. The QDM maps were obtained after the demagnetization of an ARM applied to DOC2 (200 T bias with an AF of 145 mT) to 145 mT (fig. S4C) and after the application of an ARM (200 T bias with an AF of 100 mT) to DOC6b (fig. S4F).
References
- Alexander et al. (2007) Alexander, C. M. O., Fogel, M., Yabuta, H., & Cody, G. D. 2007, Geochimica et Cosmochimica Acta, 71, 4380, doi: 10.1016/j.gca.2007.06.052
- Alexander et al. (2018) Alexander, C. M. O., Greenwood, R. C., Bowden, R., et al. 2018, Geochimica et Cosmochimica Acta, 221, 406, doi: 10.1016/j.gca.2017.04.021
- Andrews (2020) Andrews, S. M. 2020, Annual Review of Astronomy and Astrophysics, 58, 483, doi: 10.1146/annurev-astro-031220-010302
- Armstrong (1995) Armstrong, J. T. 1995, Microbeam Analysis, 4, 177
- Atreya et al. (2018) Atreya, S. K., Crida, A., Guillot, T., et al. 2018, in Saturn in the 21st Century (Cambridge: Cambridge University Press), 5–43, doi: 10.1017/9781316227220.002
- Bai (2016) Bai, X. 2016, Astrophys. J., 821, 80
- Bai (2017) Bai, X.-N. 2017, The Astrophysical Journal, 845, 75, doi: 10.3847/1538-4357/aa7dda
- Bai & Goodman (2009) Bai, X.-N., & Goodman, J. 2009, The Astrophysical Journal, 701, 737, doi: 10.1088/0004-637X/701/1/737
- Bonal et al. (2007) Bonal, L., Bourot-Denise, M., Quirico, E., Montagnac, G., & Lewin, E. 2007, Geochimica et Cosmochimica Acta, 71, 1605, doi: 10.1016/j.gca.2006.12.014
- Brasser & Mojzsis (2020) Brasser, R., & Mojzsis, S. J. 2020, Nature Astronomy, 4, 492, doi: 10.1038/s41550-019-0978-6
- Carporzen et al. (2011) Carporzen, L., Weiss, B. P., Elkins-Tanton, L. T., et al. 2011, Proc. Natl. Acad. Sci. USA, 108, 6386
- Clarke et al. (2001) Clarke, C. J., Gendrin, A., & Sotomayor, M. 2001, Monthly Notices of the Royal Astronomical Society, 328, 485, doi: 10.1046/j.1365-8711.2001.04891.x
- Cournede et al. (2015) Cournede, C., Gattacceca, J., Gounelle, M., et al. 2015, Earth and Planetary Science Letters, 410, 62, doi: 10.1016/j.epsl.2014.11.019
- Davidson et al. (2019) Davidson, J., Alexander, C. M. O., Stroud, R. M., Busemann, H., & Nittler, L. R. 2019, Geochimica et Cosmochimica Acta, 265, 259, doi: 10.1016/j.gca.2019.08.032
- DeMeo & Carry (2014) DeMeo, F. E., & Carry, B. 2014, Nature, 505, 629, doi: 10.1038/nature12908
- Desch et al. (2018) Desch, S. J., Kalyaan, A., & Alexander, C. M. O. 2018, The Astrophysical Journal Supplement Series, 238, 11, doi: 10.3847/1538-4365/aad95f
- Desch et al. (2010) Desch, S. J., Morris, M. A., Connolly, H. C., & Boss, A. P. 2010, The Astrophysical Journal, 725, 692, doi: 10.1088/0004-637X/725/1/692
- Desch et al. (2012) —. 2012, Meteoritics & Planetary Science, 47, 1139, doi: 10.1111/j.1945-5100.2012.01357.x
- Ebert et al. (2018) Ebert, S., Render, J., Brennecka, G. A., et al. 2018, Earth and Planetary Science Letters, 498, 257, doi: 10.1016/j.epsl.2018.06.040
- Einsle et al. (2016) Einsle, J. F., Harrison, R. J., Kasama, T., et al. 2016, Am. Mineral., 101, 2070
- Fu et al. (2020a) Fu, R. R., Kehayias, P., Weiss, B. P., et al. 2020a, Journal of Geophysical Research: Planets, e2019JE006260, doi: https://doi.org/10.1029/2019JE006260
- Fu et al. (2020b) Fu, R. R., Lima, E. A., Volk, M. W. R., & Trubko, R. 2020b, Geochemistry, Geophysics, Geosystems, 21, e2020GC009147, doi: 10.1029/2020GC009147
- Fu et al. (2021) Fu, R. R., Volk, M. W. R., Bilardello, D., et al. 2021, AGU Advances, 2, e2021AV000486, doi: 10.1029/2021AV000486
- Fu et al. (2014) Fu, R. R., Weiss, B. P., Lima, E. A., et al. 2014, Science, 346, 1089
- Glenn et al. (2017) Glenn, D. R., Fu, R. R., Kehayias, P., et al. 2017, Geochemistry, Geophysics, Geosystems, 18, 3254, doi: 10.1002/2017GC006946
- Hartmann et al. (1998) Hartmann, L., Calvet, N., Gullbring, E., & D’Alessio, P. 1998, Astrophys. J., 495, 385, doi: 10.1086/305277
- Hartmann et al. (2016) Hartmann, L., Herczeg, G., & Calvet, N. 2016, Annual Review of Astronomy and Astrophysics, 54, 135, doi: 10.1146/annurev-astro-081915-023347
- Hertwig et al. (2019) Hertwig, A. T., Kimura, M., Ushikubo, T., Defouilloy, C., & Kita, N. T. 2019, Geochimica et Cosmochimica Acta, 253, 111, doi: 10.1016/j.gca.2019.02.020
- Kirschvink (1980) Kirschvink, J. L. 1980, Geophys. J. R. Astr. Soc., 62, 699
- Kirschvink et al. (2008) Kirschvink, J. L., Kopp, R. E., Raub, T. D., Baumgartner, C. T., & Holt, J. W. 2008, Geochemistry, Geophysics, Geosystems, 9, doi: 10.1029/2007GC001856
- Kita & Ushikubo (2011) Kita, N. T., & Ushikubo, T. 2011, Meteorit. Planet. Sci., 47, 1108
- Kleine et al. (2020) Kleine, T., Budde, G., Burkhardt, C., et al. 2020, Space Science Reviews, 216, 55, doi: 10.1007/s11214-020-00675-w
- Kruijer et al. (2020) Kruijer, T. S., Kleine, T., & Borg, L. E. 2020, Nature Astronomy, 4, 32, doi: 10.1038/s41550-019-0959-9
- Lappe et al. (2013) Lappe, S.-C. L. L., Feinberg, J. M., Muxworthy, A., & Harrison, R. J. 2013, Geochemistry, Geophysics, Geosystems, 14, 2143, doi: 10.1002/ggge.20141
- Lappe et al. (2011) Lappe, S.-C. L. L., Church, N. S., Kasama, T., et al. 2011, Geochemistry, Geophysics, Geosystems, 12, doi: 10.1029/2011GC003811
- Lichtenberg et al. (2021) Lichtenberg, T., Drazkowska, J., Schönbächler, M., Golabek, G. J., & Hands, T. O. 2021, Science, 371, 365, doi: 10.1126/science.abb3091
- Lima & Weiss (2016) Lima, E. A., & Weiss, B. P. 2016, Geochemistry, Geophysics, Geosystems, 17, 3754, doi: 10.1002/2016GC006487
- Morbidelli et al. (2015) Morbidelli, A., Walsh, K. J., O’Brien, D. P., Minton, D. A., & Bottke, W. F. 2015, Asteroids IV, 493, doi: 10.2458/azu_uapress_9780816532131-ch026
- Nagashima et al. (2017) Nagashima, K., Krot, A. N., & Komatsu, M. 2017, Geochimica et Cosmochimica Acta, 201, 303, doi: 10.1016/j.gca.2016.10.030
- Nagy et al. (2019) Nagy, L., Williams, W., Tauxe, L., & Muxworthy, A. R. 2019, Geochemistry, Geophysics, Geosystems, 20, 2907, doi: 10.1029/2019GC008319
- Owen et al. (2012) Owen, J. E., Clarke, C. J., & Ercolano, B. 2012, Mon. Not. R. Astron. Soc., 422, 1880, doi: 10.1111/j.1365-2966.2011.20337.x
- Picogna et al. (2019) Picogna, G., Ercolano, B., Owen, J. E., & Weber, M. L. 2019, Monthly Notices of the Royal Astronomical Society, 487, 691, doi: 10.1093/mnras/stz1166
- Rosotti et al. (2013) Rosotti, G. P., Ercolano, B., Owen, J. E., & Armitage, P. J. 2013, Monthly Notices of the Royal Astronomical Society, 430, 1392, doi: 10.1093/mnras/sts725
- Schneider et al. (2020) Schneider, J. M., Burkhardt, C., Marrocchi, Y., Brennecka, G. A., & Kleine, T. 2020, Earth and Planetary Science Letters, 551, 116585, doi: 10.1016/j.epsl.2020.116585
- Schrader et al. (2017) Schrader, D. L., Nagashima, K., Krot, A. N., et al. 2017, Geochim. Cosmochim. Acta, 201, 275
- Scott et al. (1992) Scott, E. R. D., Keil, K., & Stöffler, D. 1992, Geochimica et Cosmochimica Acta, 56, 4281, doi: 10.1016/0016-7037(92)90268-N
- Scott & Krot (2013) Scott, E. R. D., & Krot, A. N. 2013, in Planets, Asteroids, Comets, and the Solar System, Vol. 2, Treatise on Geochemistry, ed. H. D. Holland & K. K. Turekian (Amsterdam: Elsevier Science), 66–137
- Scott et al. (2018) Scott, E. R. D., Krot, A. N., & Sanders, I. S. 2018, The Astrophysical Journal, 854, 164, doi: 10.3847/1538-4357/aaa5a5
- Selkin et al. (2000) Selkin, P. A., Gee, J. S., Tauxe, L., Meurer, W. P., & Newell, A. J. 2000, Earth Planet. Sci. Lett., 183, 403
- Shah et al. (2018) Shah, J., Williams, W., Almeida, T. P., et al. 2018, Nature Communications, 9, 1, doi: 10.1038/s41467-018-03613-1
- Siron et al. (2021a) Siron, G., Fukuda, K., Kimura, M., & Kita, N. T. 2021a, Geochimica et Cosmochimica Acta, 293, 103, doi: 10.1016/j.gca.2020.10.025
- Siron et al. (2021b) Siron, G., Kita, N. T., Fukuda, K., & Kimura, M. 2021b, Lunar and Planetary Science Conference, 1639. https://ui.adsabs.harvard.edu/abs/2021LPI....52.1639S/abstract
- Smith (2009) Smith, R. J. 2009, American Journal of Physical Anthropology, 140, 476, doi: 10.1002/ajpa.21090
- Stephenson (1993) Stephenson, A. 1993, Journal of Geophysical Research: Solid Earth, 98, 373, doi: 10.1029/92JB01849
- Sutton et al. (2017) Sutton, S., Alexander, C. M. O., Bryant, A., et al. 2017, Geochimica et Cosmochimica Acta, 211, 115, doi: 10.1016/j.gca.2017.05.021
- Suzuki et al. (2016) Suzuki, T. K., Ogihara, M., Morbidelli, A., Crida, A., & Guillot, T. 2016, Astronomy & Astrophysics, 596, A74, doi: 10.1051/0004-6361/201628955
- Tauxe & Staudigel (2004) Tauxe, L., & Staudigel, H. 2004, Geochemistry, Geophysics, Geosystems, 5, doi: 10.1029/2003GC000635
- Testi et al. (2014) Testi, L., Birnstiel, T., Ricci, L., et al. 2014, Protostars and Planets VI, 339, doi: 10.2458/azu_uapress_9780816531240-ch015
- Tikoo et al. (2014) Tikoo, S. M., Weiss, B. P., Cassata, W. S., et al. 2014, Earth and Planetary Science Letters, 404, 89, doi: 10.1016/j.epsl.2014.07.010
- Turner et al. (2014) Turner, N. J., Fromang, S., Gammie, C., et al. 2014, in Protostars and Planets VI (University of Arizona Press), 411–432
- Wang et al. (2017) Wang, H., Weiss, B. P., Bai, X.-N., et al. 2017, Science, 355, 623, doi: 10.1126/science.aaf5043
- Wang et al. (2019) Wang, L., Bai, X.-N., & Goodman, J. 2019, The Astrophysical Journal, 874, 90, doi: 10.3847/1538-4357/ab06fd
- Watson (1956) Watson, G. S. 1956, Geophysical Journal International, 7, 160, doi: 10.1111/j.1365-246X.1956.tb05561.x
- Weiss et al. (2021) Weiss, B. P., Bai, X.-N., & Fu, R. R. 2021, Science Advances, 7, eaba5967, doi: 10.1126/sciadv.aba5967
- Weiss et al. (2007) Weiss, B. P., Lima, E. A., Fong, L. E., & Baudenbacher, F. J. 2007, J. Geophys. Res.: Solid Earth, 112, B09105, doi:10.1029/2007JB004940
Acknowledgments
We thank K. Righter and the Meteorite Working Group for allocating the samples, R. Fu and N. Kita for helpful discussions, and R. Walsworth and R. Fu for sharing quantum diamond microscopy technology and techniques.This study was supported by NASA Discovery program (grant NNM16AA09C) and by the NSF (grant DMS-1521765). Conceptualization: C.S.B. and B.P.W. Methodology: C.S.B., B.P.W., and E.A.L. Investigation: C.S.B. and B.P.W. Interpretation: C.S.B., B.P.W., J.F.J.B., and X.-N.B. Visualization: C.S.B. Supervision: B.P.W. Writing—initial drafts: C.S.B. and B.P.W. Writing—review and editing: B.P.W., J.F.J.B., X.-N.B., E.A.L., N.C., and E.N.M. Funding acquisition: B.P.W. The authors declare that they have no competing interests. All data needed to evaluate the conclusions in the paper are present in the paper and available through the Magnetics Information Consortium (MagIC) Database (earthref.org/MagIC/17129).
Supplementary materials
Supplementary text and materials are available at: DOI:10.1126/sciadv.abj6928.