Complex interplay of magnetic ordering and spin-lattice coupling in orthochromite Nd0.5Dy0.5CrO3
Abstract
The mixed rare-earth orthochromite Nd0.5Dy0.5CrO3 has a Néel temperature () of 175 K, resulting in the G-type antiferromagnetic ordering of Cr3+ spins. The inverse susceptibility shows a deviation from Curie-Weiss law at 230 K, with a large effective paramagnetic moment of 8.8 . The ZFC-FC magnetization bifurcate just above and show a distinct signature of spin reorientation near 60 K. Neutron diffraction show that below , the Cr3+ spins align in representation as (, ). Below 60 K, due to spin reorientation, the magnetic structure is in () configuration. The neutron diffraction does not show any signature of rare-earth ordering even at 1.5 K. First principles density functional theory calculations within GGA+U and GGA+U+SO approximations reveal that the G-type antiferromagnetic order is the ground state magnetic structure of Cr sublattice and the spin-reorientation of Cr3+ spins can happen in the absence of 3d-4f interactions unlike in the case of orthoferrites. The specific heat shows a ‘’ anomaly at , while at low temperature two distinct Schottky anomalies are observed; a Schottky peak at 2 K and an additional step-like feature above 10 K. Above , the magnetic transition is preceded by structural anomalies as seen in our x-ray diffraction and Raman measurements. The deviation of structural parameters near Néel temperature is smaller. The phonon frequencies show deviation from the standard anharmonic behaviour: first near 250 K, due to magneto-volume effects while the second deviation occurs near 200 K due to spin-phonon coupling.
I Introduction
The magnetic properties of orthochromites CrO3 (R: rare-earth) have been extensively studied in the past fifty years[1, 2, 3, 4, 5]. The magnetic ordering is predominantly G-type antiferromagnetism[1, 2, 6, 3], along with weak ferromagnetism (FM) due to the Dzyaloshinskii-Moriya interaction between the Cr3+ spins[3, 4].
With decreasing temperature, similar to orthoferrites (FeO3), they show the interesting property of spin reorientation, wherein the easy axis of the Cr3+ spins rotate from one crystallographic axis to another[7, 1]. The spin reorientation can be induced by external magnetic field or laser source, which finds commercial applications in spin switching devices[8, 9, 10, 11].
Additional interesting properties of orthochromites include magnetocaloric effect (useful in refrigeration) and the magnetoelectric effect, which is useful in spintronic and other multifunctional devices that can be controlled by electric and magnetic fields[5, 12, 13, 14, 15].
Structurally, the orthoferrites and orthochromites crystallize in the orthorhombic space group.
Compared to the orthoferrites, which have a Néel temperature ( TN1) between 620 K and 740 K (depending on )[16, 17, 18], the orthochromites show paramagnetic (PM)-antiferromagnetic (AFM) ordering of Cr3+ sublattice between 290 K and 120 K[1]. The Cr3+ ions have been observed to order near 220 K and 146 K in NdCrO3 and DyCrO3 respectively[19, 5].
Similar to Fe3+ spins, the magnetic structure of Cr3+ spins can be described in Betraut notation as (, , ), (, , ), (, , ) and (, , )[20].
Unlike the orthoferrites, which order in below TN1 [17], the orthochromites can order in or magnetic structures below the Néel temperature[1].
Interestingly, the spin reorientation behaviour is also different from that in orthoferrites.
For instance, NdCrO3 shows a abrupt reorientation near 35 K while DyCrO3 does not show any spin reorientation and remains in the structure[21, 1, 3]. This is contrary to that in orthoferrites which show the canonical reorientation[17, 22], while DyFeO3 shows reorientation[17].
This suggests that the influence of rare-earth in orthochromites is different as compared to that in orthoferrites.
Additionally, the rare-earth ordering in CrO3 varies across the series.
Below 10 K, the rare-earths order independently (for Dy, Tb) or due to polarization of Cr3+ spins[1, 2]. The temperature at which independent rare-earth ordering occurs can be considered as the second Néel temperature ()[12].
In DyCrO3, the Dy3+ moments order independently as (,)[23], while the Nd3+ moments in NdCrO3 order as , which is symmetry compatible with structure[24].
In NdCrO3, the Nd3+-Nd3+ interactions are weaker than the Nd3+-Cr3+ interactions. Therefore, the collective independent ordering of Nd3+ moments does not occur[25, 21].
Important properties observed in orthoferrites and orthochromites are the magneto-electricity and ferroelectric (FE) polarization[26, 27].
In DyFeO3, the breaking of inversion symmetry takes place due to magnetic structure, that has non-zero magnetoelectric tensor. In addition to this, the exchange striction mechanism between Dy3+ and Fe3+ moments has been suggested to be responsible for the origin of ferroelectricity in DyFeO3, below its ordering temperature (4 K)[28].
Similar mechanism should be valid for the orthochromites. Thus, the magnetoelectric effect in orthochromites is associated with the rare-earth ordering which occurs below in DyCrO3 and TbCrO3[12].
However, this does not clearly elucidate the possibility of ferroelectricity in the system.
Experimentally, ferroelectricity has been observed in orthochromites at temperatures below as well as above [29, 30, 31, 32]. The nature of ferroelectricity is believed to be controversial. In ErCrO3, the electric polarization is observed below [33].
In NdCrO3, the ferroelectric phase develops at 88 K, which is well below the Néel temperature[30], while in the case of SmCrO3, the ferroelectric phase develops in the paramagnetic region itself[31]. Interestingly, in DyCrO3, the FE polarization is not reported, but a paraelectric phase is observed below the antiferromagnetic ordering temperature[34].
The development of ferroelectric polarization is also accompanied with the breaking of inversion symmetry of the unit cell, which is a requisite condition[35, 34].
The structural distortion associated with FE polarization is believed to be the result of an off-centric displacement of the Cr3+ ions within the oxygen octahedra[34].
In addition to high-resolution x-ray diffraction using synchrotron radiation, the local structural changes can also be probed using Raman spectroscopy. Deviation from anharmonicity, especially close to Néel temperature, suggests a strong spin-phonon coupling[29].
Due to the different magnetic and structural properties shown by NdCrO3 and DyCrO3, it would be interesting to observe the magnetic structure and the resultant spin-phonon coupling in doped compound Nd0.5Dy0.5CrO3. Thus, the present studies are based on the doped orthochromite Nd0.5Dy0.5CrO3, wherein we explore the magnetic properties viz. spin reorientation, rare-earth ordering and the lattice distortion occuring below 300 K, deviation of the phonon modes from anharmonic behaviour observed in the Raman spectra is also studied.
We have explored the bulk magnetic behaviour by DC magnetization and specific heat measurements. The temperature dependent magnetic structure has been studied using neutron diffraction. The possibility of structural distortion was explored using temperature-dependent synchrotron XRD studies. The behaviour of various phonon modes associated with the RO and CrO vibrations have been studied using temperature-dependent Raman spectroscopy.
II Methodology
II.1 Experimental
The polycrystalline samples of Nd0.5Dy0.5CrO3 (NDCO) were synthesised by conventional solid-state reaction method using stoichiometric proportions of highly pure (99.99) pre-dried precursors of Nd2O3, Dy2O3 and Cr2O3. The powdered constituents were mixed thoroughly and heated in a sequential manner at 1000 ∘C, 1200 ∘C, 1300 ∘C and finally at 1350 ∘C for 24 hrs.
The structural phase of the sample was identified using a Rigaku MiniFlex benchtop x-ray diffractometer employing Cu radiation. Temperature-dependent x-ray diffraction (XRD) measurements were performed at the synchrotron radiation facility Indus-2, India. The powder diffraction in the temperature range 5 K to 300 K was carried out at the Angle dispersive X-ray Diffraction (ADXRD) beamline (BL-12), while the high temperature experiments were carried out at BL-11, in the range 300 K to 500 K. Rietveld refinement of the diffraction patterns were performed using the FULLPROF package[36].
DC magnetization was measured using the SQUID magnetometer of magnetic property measurement system (MPMS-XL) and the vibrating sample magnetometer (VSM) module of physical property measurement system (PPMS-Dynacool) manufactured by Quantum Design Inc. Zero field cooled (ZFC) and field cooled (FC) measurements from 300 K to 2 K in magnetic fields of 50 Oe, 100 Oe and 1000 Oe were carried out to identify the different magnetic transitions. Field variation of magnetization was measured at various temperatures between 300 K and 2 K.
Heat capacity measurements in the temperature range 2-300 K were carried out using a QD-PPMS (Physical Property measurement system by Quantum Design). Additional heat capacity measurements in the milli-Kelvin range were carried out using the QD-PPMS with 3He option in external magnetic fields of 0, 2, and 5 T.
Powder Neutron diffraction studies at zero magnetic field were carried out at various temperatures in the range 1.5-300 K to identify the crystal, magnetic structure and their variations as a function of temperature. The studies were carried out at focusing powder diffractometer E6 at BER-II reactor in Helmholtz-Zentrum Berlin, Germany ( = 2.40 ). The diffraction data were analyzed using FullProf [36] suite of programs using the Rietveld method[37]. The magnetic structure was determined using the irreducible representations from BasIreps [38] and refined using FullProf.
Raman spectra of NDCO were recorded in the region 50 to 800 cm-1 at different temperatures varying from 300 K to 80 K in single channel mode on a micro-Raman setup (Model RM1000) procured from Renishaw, equipped with a 2400 lines/mm grating and a Peltier cooled CCD. The
532 nm line of He-Ne laser was used as an excitation source. The resolution of the spectrometer was nearly 1 cm-1. A microscope from Olympus (Model MX50 A/T) attached with the spectrometer focuses the incident laser light
on the sample and collects the back-scattered Raman signal. The sample was kept in a quartz sample holder, which was put in the computer-controlled high/low temperature cell, THM 600 temperature controlled stage from Linkam Scientific Instruments. The individual peaks were fitted to Lorentzian function.
II.2 Theoretical
For understanding of the electronic structure and low temperature magnetic behaviour of NDCO, we have performed density functional theory (DFT) calculations as implemented in the Vienna Ab-initio Simulation Package (VASP), which uses the projector augmented wave (PAW) method[39]. The calculations were performed using Perdew-Burke-Ernzerhof (PBE) exchange-correlation functional within generalized gradient approximation (GGA)[40] and GGA+[41] approximation. A cut-off energy of 500 eV was used in the expansion of the plane waves. A 666 Monkhorst-Pack -mesh centered at point in Brillouin zone is used for performing the Brillouin zone integrations. The calculations are performed using as initial input, the structural parameters of NDCO obtained at 5 K. In the unit cell, the Nd and Dy atoms are arranged in alternate manner. Thus, each Nd atom has six Dy atoms as nearest neighbours and vice-versa. The Nd/Dy states were treated as core states for structural relaxation. Ionic positions were relaxed until the forces on the ions are less than 0.1 meVÅ-1. For the electronic self-consistent calculations, the Nd/Dy electrons are treated as core and subsequently as valence electrons. The valence band for each atom has the following elements and corresponding orbitals; Cr: , , O: , and Nd/Dy: , , , . The electronic self-consistent calculations are performed in the GGA+U approximation which includes the effect of Coulomb correlation (U). Additionally, the non-collinear calculations are carried out using the GGA+U+SO approximation which includes both Coulomb correlation (U) and spin-orbit (SO) coupling, to find the ground state magnetic order of NDCO system.
III Experimental Results
III.1 DC Magnetization
Fig. 1a shows the temperature variation of zero field cooled (ZFC) and field-cooled (FC) magnetization for NDCO from 2 K to 300 K in a magnetic field of 100 Oe. The signature of Néel temperature () occurs just below 200 K. The vs. plot of the ZFC curve in the inset, shows a dip at 180 K, corresponding to . With decreasing temperature, the increase in FC curve is rapid, while the increase in ZFC curve is more gradual. The FC curve shows a continuous increase until it reaches a maximum near 60 K. In a similar manner, the ZFC curve also shows a peak at 60 K below which it drops. The simultaneous decrease of ZFC and FC suggests a Morin transition[42]. However, near 50 K, the ZFC shows an increase, while the FC falls rapidly. The change in ZFC and FC curves can be understood as the process of spin reorientation. The vs. plot also shows the signature of spin reorientation in the inset of Fig. 1a. The transition is similar to that observed in Nd1-xDyxCrO3 for 0.33 and 0.66[3]. Near 20 K, a crossover between the ZFC and FC curves is observed.
A crossover, absent in both parent compounds, is seen in Nd1-xDyxCrO3 for = 0.33 and 0.66[3]. In Fig. 1b, the ZFC-FC curves are shown in an applied field of 1000 Oe. A similar bifurcation occurs below 200 K, although it is of much smaller magnitude. The peak associated with spin reorientation is observed near 60 K. Below 40 K, ZFC and FC magnetization values show a continuous rise.
The temperature variation of inverse magnetic susceptibility, (T) of NDCO in the range 50-300 K is shown in Fig. 2 for fields of 50 and 100 Oe. The curves show a linear behaviour in the paramagnetic region. However, well above , both the curves show deviation from the Curie-Weiss behaviour. In the presence of 50 and 100 Oe magnetic field, the deviation starts near 230 K and is somewhat sharp.
In the linear region (300 K to 240 K), (T) is fitted to the Curie-Weiss law, (T)=(-)/, where = /3,
is the Avogadro number, is the effective magnetic moment, and is the Boltzmann constant. From our fitting, we obtain = -20 K. Though, the negative value conforms to the antiferromagnetic ordering, the small value of / 0.11, is an indicator of disorder-induced frustration in the system[43].
Also, an effective moment () value of 8.8 is obtained, which is much higher than the theoretical paramagnetic moment of Cr3+ spins (3.9 ). However, the total theoretical moment, (0.5+0.5+ = 8.83 is close to estimated .
The downward deviation of is a possible indicator of the formation of Griffith’s phase, which is defined as development of FM clusters in a PM matrix and absence of long-range order[44].
Since the deviation begins near 230 K it can probably be considered as the Griffith’s temperature (). In the Griffith’s region, shows a power law behaviour, = ()1-λ, where, is the maximum possible critical temperature, while is the exponent. In the paramagnetic region, 0, while in the Griffith’s phase 0 1[45].
Attempts were made to fit the low field data, as well as that for 1000 Oe from plots of log10() against log10(). However, =0 could not be obtained in the paramagnetic region for H=50 Oe and 100 Oe. Although the ZFC-FC suggests formation of clusters above , the clustered phase cannot be called as Griffith’s phase.
The isothermal field variation of magnetization for various temperatures is shown in Fig. 3. At 300 K, the curve is linear, indicating a paramagnetic phase (lower inset).
The curves start showing a non-linear behaviour at low magnetic field values only below 150 K. The curve shows a hysteresis loop with a coercivity of nearly 1000 Oe, indicating the existence of weak ferromagnetic moment of the Cr3+ spins. Between 50 K and 5 K, the magnetization isotherms develop a non-linear behaviour, which can be attributed to the polarization of the moments. At 5 K, the loop is ‘S’-shaped curve with a negligible loop width. In 50 kOe magnetic field, the magnetization attains near-saturation and a value of 2.7 The value is however smaller than 4 obtained in the case of Nd0.5Dy0.5FeO3[46]. This also suggests a smaller polarizability of rare-earth ions (Nd3+ and Dy3+) in the presence of applied field in NDCO.
III.2 Specific heat

As shown in the Fig. 4a, the specific heat () of NDCO in the temperature range 0.4-300 K has been measured. To obtain the magnetic specific heat in the entire temperature range, the specific heat of non-magnetic LaGaO3 has been subtracted from that of NDCO. The subtraction was carried after a suitable scaling of the specific heat data of LaGaO3. The inset shows the magnetic specific heat in the full temperature range. A -anomaly in the magnetic data is observed near 175 K, which can be considered as the ordering temperature of the Cr3+ sub-system, in agreement with the magnetization studies. The width and the height are similar to that reported in NdCrO3[21]. The broader transition observed in our sample can be attributed to the polycrystalline nature of our sample. Additional disorder due to the presence of two rare-earth atoms can also contribute to the broad transition. Below 100 K, however, we do not observe any signature of spin reorientation in the present heat capacity data, contrary to that observed in NdCrO3[21].
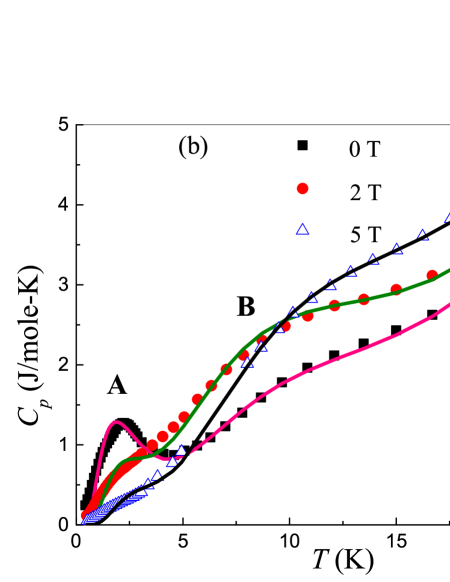
In Fig. 4b, we show the low temperature specific heat, in the temperature range 0.4 K to 25 K. The gradual broadening of specific heat curve below 20 K indicates the contribution from the electronic Schottky specific heat due to the crystal field effects in Nd3+ and Dy3+ ions.
A -anomaly indicating independent rare-earth ordering is absent.
The low temperature specific heat shows a prominent peak (marked A) at 2.5 K. Additionally, near 10 K, a broad hump-like feature marked B occurs.
The features A and B can be attributed to the electronic Schottky specific heat. The feature A signifies the Schottky specific heat typically seen in various rare-earth based compounds.
However, the peak height and the width of feature A in NDCO, is smaller than that observed in the similar compound Nd0.5Dy0.5FeO3[46].
Unlike in Nd0.5Dy0.5FeO3, we observe two distinct features A and B, associated with Schottky specific heat[46].
The Schottky specific heat can be understood in terms of individual crystal field splitting of both rare-earth ions.
The ground state of Dy3+ ion is while that of the Nd3+ ion is . Both the ions in monoclinic crystal field split into a series of Kramer’s doublets. Thus, the ground state of both ions are Kramer’s doublets, which are further split by internal and external magnetic fields.
Thus, feature A can be attributed to the splitting of the ground state doublet of the Dy3+ ion. The feature B is due to the splitting in the Nd3+ ion, since in NdCrO3, a similar feature is observed above 10 K in specific heat data[21].
The specific heat in the range 2 to 25 K is fitted to the sum of two-level Schottky terms associated with the ground state doublets of Dy3+ and Nd3+ ions along with the lattice term as given in the equation (1).
| (1) |
In the above equation, and correspond to the splitting in the Dy3+ and Nd3+ ions, while is the lattice contribution. The fitting is carried out for 0, 2, and 5 T. At 0 T, the fitting yields / = 4.5 K and / = 29 K. From optical studies on DyFeO3, a splitting of nearly 6.5 K is obtained[47], which is close to the value obtained in NDCO. In a similar manner, / is also in agreement with a splitting of 27 K obtained in the case of NdCrO3[21]. The clear separation of the two Schottky features is due to the fact that Nd-Cr exchange interactions are much stronger than the Dy-Cr interactions[21, 23]. In a field of 2 T, increases to 5.9 K, while decreases to 26 K. Finally, at 5 T, increases to 8.3 K, while also increases to 31 K. The difference between and suggests that the Nd-Dy exchange interactions do not play any significant role, which is also evident from our neutron diffraction studies, as discussed below.
III.3 Neutron Diffraction
To ascertain the evolution of magnetic structure and possible rare-earth ordering, powder neutron diffraction experiments were performed in the temperature range 300 - 1.5 K.
The diffraction data obtained at 248 K consists of Bragg peaks which correspond to the crystal lattice (Fig. 5a).
In the diffraction pattern for 200 K the emergence of magnetic peak around 2= is observed (not shown), which corresponds to ordering of Cr sub-lattice. The signature of long-range magnetic ordering in NDCO starts at 180 K, close to .
Fig. 5b shows the diffraction pattern for T=148 K. A magnetic peak occurs around , which by the limit of resolution is a convolution of two magnetic peaks. These peaks are indexed as (011) and (101), which are structurally forbidden and correspond to the ordering vector, =(0,0,0).
In the space group, for =(0,0,0), there are eight irreducible representations denoted as to . For the Cr atom which occupies the Wyckoff position, four of these representations have zero coefficients.
The four possible representations to correspond to the Shubnikov magnetic space groups, (), (), (), and () in Bertraut’s notation[20]. In cartesian notation, the four magnetic space-groups can be written in a simplified manner as , , , and respectively. Here, , and corresponds to A-type, C-type and G-type antiferromagnetic arrangement of magnetic moments and denotes the ferromagnetic arrangement. The subscript denotes the direction of magnetic moments, i.e. along the x-, y- or z-axis.
The magnetic structures of both the end compounds are well studied. The Cr3+ spins in DyCrO3 order below = 146 K in (, , ) structure[1]. The Cr3+ spins in NdCrO3 order at a higher value of 220 K in the (, , ) structure[1].
Based on this, the magnetic peak in NDCO was fitted to structure, which yields a satisfactory fit between 180 and 60 K.
Fig 6a shows the enlarged version of the data at 99 K corresponding to the representation.
At 58 K(data not shown), the magnetic structure belongs to the (,,) representation. This also coincides with the spin reorientation process that occurs between 75 K and 60 K, consistent with our bulk magnetization measurements.
Fig. 5d shows the data at 50 K with the enlarged version of magnetic peak in Fig. 6b. Based on the shape and refinement of the Bragg peaks, it can be said that the Cr3+ spins order in the structure below 60 K. The presence of or is ruled out since their inclusion yields unsatisfactory results in refinement.
NdCrO3 has been reported to undergo spin-reorientation transition from (, ) to () around 35 K[1, 21]. Thus, the to spin reorientation below 60 K is consistent with that of NdCrO3[1]. Therefore, the substitution of Dy3+ moments results in the enhancement of the Morin transition temperature as compared to NdCrO3. The structure of Cr3+ spins persist until 1.5 K.
This behaviour agrees well with that of Nd0.33Dy0.67CrO3 and Nd0.67Dy0.33CrO3 compositions[3].
The temperature variation of the magnetic moments for the Cr3+ spins for different representations are shown in Fig. 7. From 200 K till 75 K, we observe an increase in , the magnetic moment associated with Cr3+ spins in the z-direction i.e., configuration. Between 75 K and 50 K, the component of magnetization vanishes due to the spin reorientation. At 50 K, the magnetic moment is due to , corresponding to the () spin structure. At 1.5 K, the magnetic moment, , is nearly 2.65(5) , which is slightly lower than the theoretical value of 3 , achieved by complete ordering of the Cr3+ spins.
At 1.5 K, no long range rare-earth ordering occurs. Since a single peak associated with any predicted long-ranged ordering of Nd/Dy moments is not observed. Also, a single broad hump indicating short-ranged ordering of Nd/Dy moments is also not observed. However, in Fig. 5f we observe small multiple humps centered at 16∘, 20∘, and 25∘. Due to the weak intensity, a satisfactory refinement could not be carried out. The angular positions of humps at 16∘ and 25∘ coincide with Dy-ordering, as in DyCrO3[6, 2] and polarization of Nd3+ moments respectively[24].
Thus, the arrangement of the moments either due to a) independent long-ranged ordering or b) polarization due to -Cr interactions is duly suppressed in NDCO unlike in doped orthoferrites. In doped orthoferrite Nd0.5Dy0.5FeO3[46], the low temperature neutron diffraction pattern shows magnetic Bragg peaks associated with , due to rare-earth polarization.
III.4 Density Functional Theory Calculations
The electronic structure calculations are performed for various collinear magnetic configurations of Cr sublattice with ferromagnetic (FM), A-type, C-type and G-type anti-ferromagnetic arrangements of the Cr3+ moments within the structurally optimized NDCO unit cell. In these calculations, the Nd/Dy electrons are treated as core-electrons. Thus there are no 4f moments at Nd/Dy sites.
For 5 eV and 1 eV, the calculated magnetic moment of Cr3+ is found to be 2.9 , which is close to the free ion moment value of 3 .
Comparing the total energies of various magnetic configurations considered, it is found that G-type arrangement has the minimum energy. The total energies have the following sequence . Setting the G-type structure as 0 meV, the energies of C-type, A-type and FM magnetic structures are 30 meV, 67 meV and 97 meV respectively. Thus, we see considerable difference in energy between various magnetic structures of Cr sublattice. Based on the method used by Nagaosa [48], the Cr3+-Cr3+ in-plane magnetic exchange coupling and out-of-plane exchange coupling are determined. From our calculations, we obtain -7.4 meV and -6.9 meV, indicating a small anisotropic character. Additionally, our non-collinear calculations within GGA+U+SO approximation with Cr3+ spins oriented along different crystallographic directions reveal that for room temperature structure of NDCO at 300 K, the configuration(see above) is energetically lower than the configuration by 0.01 meV, while for the low temperature (1.5 K) structure, the configuration is lower by 0.02 meV. Thus, from our calculations we observe the spin-reorientation of Cr3+ spins even in the absence of interactions (though the energy difference is very low) which was found to be essential for another doped orthoferrite Nd0.5Dy0.5FeO3[46].
These results are consistent with our experimental observations as the spin-reorientation of Cr spins is observed while no rare-earth magnetic ordering is observed down to the lowest temperature measured.
To probe the possible rare-earth ordering, self-consistent calculations are performed by taking the Nd/Dy electrons as valence electrons. The Nd3+/Dy3+ moments are arranged in G-type, C-type and A-type antiferromagnetic arrangements, while the Cr3+ magnetic arrangement is fixed as G-type in all calculations.
The Hubbard parameters for Nd and Dy are kept at 7.5 eV and 0.5 eV respectively, while for Cr3+, the parameters are kept at same values as previous calculations. From the calculations, it is found that the A-type ordering has lowest energy (set as 0 meV) while the G-type and C-type arrangements of moments have energies of +5 meV and +50 meV respectively. Thus in NDCO, the C-type arrangement of rare-earth has the highest energy. This is in contrast to the situation in mixed-doped orthoferrite Nd0.5Dy0.5FeO3, where the C-type arrangement of moments is lower in energy as compared to their G-type arrangement[46].
Thus, the polarization of Nd3+ moments observed in Nd0.5Dy0.5FeO3 due to the Nd-Fe interactions seems to be non-existent in NDCO.
In Fig. 8, we present the spin-resolved partial density of states (pDOS). The top panel contains the DOS, while the middle and bottom panel display the Cr and O DOS respectively.
As seen from the DOS, NDCO is an insulator and has a band gap of nearly 3 eV within the GGA+U with and values mentioned above. An increase in systematically increases the band gap.
Below the Fermi energy there occurs significant spectral weight due to Cr states, while the O has a much smaller spectral weight. The Nd states occurs in the region -3 to -4 eV, while the Dy states are split into two distinct regions. The first region corresponds to a broader peak near -4 eV, while around -8 eV, the Dy states show extremely sharp and localized peaks. Based on the figure, it can be said that the electronic states between Nd and Dy show minimal overlap.
The lack of any overlap between the electronic states of Nd and Dy is in agreement with the neutron diffraction data at 1.5 K which does not show signature of long ranged ordering, either independently or by polarization due to Cr spins.
III.5 Anomalous Volume Expansion
The structural studies were carried out in a wide temperature range, from 550 K to 5 K in NDCO. In the entire temperature range, the structure of NDCO is analyzed in the space group.
The temperature dependence of lattice parameters obtained from the Reitveld refinement of synchrotron x-ray diffraction data are presented in Fig. 9.
Between 550 K and 300 K, all the three parameters show a systematic decrease. Below 300 K, however, all the three lattice parameters show a step like increment with a peak around 250 K. The increase is most pronounced for . A corresponding increase is also seen in temperature variation of unit cell volume (), as shown in Fig. 10. The hump near 250 K may also be considered as the magneto-volume effect. The negative thermal expansion hints at a polar instability in the system. However, reduction in symmetry is not observed in this temperature region.
In the parent compound DyCrO3, a similar increase in volume is observed, with a peak near 260 K to 280 K, denoted as [34]. In NDCO, the decrease in volume below 250 K is more gradual, in contrast to the relatively sharp drop between 550 K and 300 K. However, no structural transformation is observed, from our refinement. Attempts to fit the data using space group, yield a higher “goodness of fit”.
An increase in the volume is compensated by the off-centric displacement of the Cr3+ ions, which results in an increase of covalent energy[35].
In general, the displacement of Cr3+, which removes the centro-symmetric character of the unit cell, is believed to be responsible for the ferroelectric distortion, which is accompanied by reduction of space-group symmetry of the orthochromites[49]. In our analysis of the diffraction data, attempts to free the position of Cr atom resulted in unusually high displacement from the (0.5,0,0) position.
In NdCrO3, however, the temperature variation of lattice parameters and volume, as well as the ferroelectric distortion occurs well below the Néel temperature (at 80 K), along with lowering of symmetry to structure[30]. Similar set of transitions are also observed in SmCrO3, though well above the Néel temperature [31]. This suggests that the nature of the magnetic -Cr interactions play a significant role in the ferroelectric distortion. However, similar symmetry reduction is not reported in DyCrO3[34].
Thus, in NDCO, we rule out the symmetry lowering associated with a possible ferroelectric transition.
To probe the effects of long range magnetic ordering and magneto-volume effect, the temperature variation of unit cell volume is fitted to the Grüneisen equation[50],
| (2) |
| (3) |
In the above equations, is the specific internal energy, is the Grüneisen parameter, is the incompressibility, is the extrapolated volume at 0 K, is the Debye temperature and . The temperature evolution of unit cell volume along with the theoretical curve is presented in Fig. 10. The theoretical curve deviates from the experimental curve below 300 K (near 250 K). Additional deviation occurs below 200 K coinciding with the magnetic transition. The deviation persists till low temperatures. However, a clear demarcation could not be made between the two regions.
III.6 Raman Spectroscopy
The Raman spectra measured between 450 and 90 K is shown in Fig. 11. The absence of peak splitting or broadening of the spectra indicates the homogeneous nature of our sample. Unlike previous reports on Dy1-xNdxCrO3[3], the Raman peaks are sharper with the presence of all the expected peaks. The orthorhombic structure contains 24 first-order Raman active modes which are classified as 7 + 5 + 7 + 5, involving vibration of Nd/Dy and Cr, O atoms[29, 51]. In Fig. 11, we show spectra collected both above and below the Néel temperature. The modes below 200 cm-1 viz. (2) and (1) can be attributed to vibrations of Nd/Dy atoms. The modes above 200 cm-1 can be attributed to the vibrations of the Nd/Dy and the O atoms. In the higher energy region of the spectra, the (7) mode near 560 cm-1 can be attributed to the antisymmetric in-phase stretching vibrations of the Cr-O bonds within the octahedra. Additionally, the peak near 320 cm-1 corresponding to the (4) mode is related to the combined Nd/Dy-O vibrations. It is known that the increase in ionic radii of the ion shifts the modes to lower energy[52]. Thus, the modes corresponding to Nd-O vibrations would occur at a lower energy compared to Dy-O. The peak positions are extracted by fitting the individual peaks to the Lorentzian function. The temperature variation of frequency of various modes is shown in Fig. 12(a-d). To understand the temperature dependence of various modes, the temperature variation of the phonon modes was fitted to the following expression, which corresponds to the anharmonic approximation[53].
| (4) |
In the above equation, (0) is the extrapolated frequency (T=0 K) of the mode, C is the anharmonicity constant. After optimisation, the frequencies of the various modes were fitted in the temperature range 450 K to 300 K and extrapolated to 0 K.
The experimental and theoretical curves are shown in Fig. 12(a-d). A deviation from anharmonic approximation is seen in all the modes.
In Fig. 12(a), the temperature variation of (1) mode is shown, which corresponds to vibrations of the Nd/Dy atoms. Below 200 K, there occurs a deviation from the intrinsic anharmonic variation. The nature of deviation indicates softening of the mode, induced by spin-phonon coupling and exchangestriction effect. The latter can result in a net displacement of Nd and Dy atoms.
Similar behaviour is also observed in the temperature variation of (4) as shown in Fig. 12(b). The (4) mode
corresponds to the Nd/Dy and O vibrations in the O12 polyhedra. However, unlike the (1) mode, a much stronger anomaly is observed below 300 K itself. The softening of the mode indicates the influence of the spin-phonon coupling. Similar behaviour is observed in GdCrO3, but in case of other rare-earths viz. Sm, Eu, the deviation is relatively smaller[54, 55, 56]. A combination of the behaviour of (4) and (1) modes suggest a net displacement of the Nd/Dy atoms from their equilibrium positions. However, the different Nd-O and Dy-O bond lengths result in a local variation of the effective displacements and the nature of the softening of the mode.
The (6) mode also shows softening below 200 K. However, similar to (1), the softening is moderate as shown in Fig. 12(c). Similar softening is observed in various orthochromites like GdCrO3 and SmCrO3[54, 55]. However, the corresponding deviation is much smaller in both compounds.
In Fig. 12d, we show the temperature variation of the (7) mode corresponding to the Cr-O stretching. The solid curve corresponds to the anharmonic contribution to phonon frequency. Interestingly, the deviation of the (7) mode starts near 300 K itself, which is nearly 125 K above the Néel temperature. The blue shift indicates hardening of the (7) mode.
In GdCrO3 and YCrO3, similar hardening is observed in the temperature variation of the frequency of (7) mode[54, 32]. The deviation at a much higher temperature than indicates the role of magnetovolume effect in NDCO. A similar reduction in unit cell volume has been observed in the case of YCrO3[57].
In NDCO, the deviation can be considered as a combined effect of magnetostriction as well as spin-phonon coupling. Based on our magnetization and neutron diffraction studies, the effect of spin-phonon coupling should start to develop only below 200 K. The spin-phonon coupling in NDCO can be attributed to the RCr and Cr-Cr exchange interactions. However, in the higher temperature range considered, it is expected that the Cr-Cr exchange interaction plays a greater role in the spin-phonon coupling. Moreover, it is known that the Dy-Cr exchange interactions are negligible.
To probe the effect of spin-phonon coupling, the scaling behaviour of the temperature variation of excess phonon frequency w.r.t. the spin-spin correlation function is checked. In mean field theory, is proportional to the square of the sublattice magnetization . Based on the expression derived by Granado et al., the deviation in frequency due to spin-phonon coupling can be written as[58, 54]:
| (5) |
In the above equation, is the spin-phonon coupling term, is the temperature-dependent sublattice magnetization from neuron diffraction data, M(0)=3 is the magnetic moment of Cr3+ ion in the totally ordered state at 0 K. The spin-phonon coupling constant () depends on the mode and the nature of individual atoms, along with the respective bond lengths and bond angles. An estimate of is obtained from Fig. 13 which shows a plot of versus (()/M(0))2. In Fig. 13, is the excess frequency obtained by subtracting (T) from the experimental frequencies (T) of the (7) mode. The value of () is obtained from total antiferromagnetic sub-lattice magnetization as in Fig. 7. A nearly linear scaling behaviour is obtained, covering a temperature range of 90 -200 K. Additionally, to qualitatively check the scaling behaviour, the inset shows the plot of and (()/M(0), where () is the spontaneous magnetization, obtained from the FC magnetization for 1000 Oe. In this case, the values were considered from 90 to 250 K. However, as seen above 200 K, there occurs no scaling between the excess frequency and magnetization, while below 200 K, a linear trend is observed. The persistance of the scaling even at 200 K can be attributed to the magnetic clusters which form well above . The slope from the main graph corresponds to , and has a value of nearly 8 cm-1. The value is considerably higher than the value obtained, for instance in the case of GdCrO3[54]. A possible reason for the overestimation is an obvious presence of the effects of magneto-volume in the deviation. Additionally, the above formula ignores the R-Cr exchange interactions which can affect the spin-phonon coupling.
III.7 Conclusion
Polycrystalline Nd0.5Dy0.5CrO3 (NDCO) has been synthesised by solid state reaction method. It crystallizes in orthorhombic () crystal structure. DC Magnetization shows a Néel temperature of 180 K, while the large paramagnetic moment and deviation from Curie Weiss behaviour at 230 K indicates the formation of magnetic clusters. Powder neutron diffraction measurements indicate that Cr3+ moments order as G-type antiferromagnet in structure below 180 K. Below 60 K, the Cr3+ undergoes a spin reorientation transition to , which persists till low temperature (1.5 K). Long range rare-earth ordering has not been observed in the powder neutron diffraction data. The density functional theory calculations reveal that the G-type arrangement of Cr3+ spins is its ground state, while in the case of , A-type arrangement is the ground state and C-type magnetic structure has the highest energy. The absence of hybridization between the Nd and Dy states signifies absence of long range ordering of the rare-earth by independent ordering or by polarization due to Cr3+ spins. The heat capacity data shows a -anomaly near Néel temperature (180 K). While the contribution due to rare-earth ordering is absent at low temperature, we observe distinct Schottky anomalies due to Nd3+ and Dy3+. Low temperature synchrotron XRD measurements rule out the possiblity of a structural phase transition. However, near 250 K, the system shows anomalous thermal expansion due to magneto-striction effects. Analysis of Raman spectroscopy data of various modes indicates deviation of the frequencies from the anharmonic approximation at 250 K itself. The scaling behaviour of the (7) mode associated with the Cr-O stretching with that of sub-lattice magnetization extends from 90 K till 200 K, i.e., even above the Néel temperature, which indicates prominent presence of spin-phonon coupling in the system.
Acknowledgements.
MA thanks UGC-DAE-CSR, Mumbai for scholarship (via CRS-M-228). CMNK acknowledges support from the Polish National Agency for Academic Exchange under the ‘Polish Returns 2019’ programme, grant PPN/PPO/2019/1/00014 and the subsidy of the Ministry of Science and Higher Education. RKS is grateful to UGC New Delhi and BHU Varanasi for financial support under IoE scheme. The support of IIT Roorkee through SMILE-13 grant is acknowledged. Characterization facilities of Institute Instrumentation Center, IIT Roorkee are duly acknowledged.References
- Hornreich [1978] R. M. Hornreich, Journal of Magnetism and Magnetic Materials 7, 280 (1978).
- Van Laar and Elemans [1971] B. Van Laar and J. B. A. A. Elemans, Journal de Physique 32, 301 (1971).
- McDannald et al. [2016] A. McDannald, C. R. dela Cruz, M. S. Seehra, and M. Jain, Physical Review B 93, 184430 (2016).
- McDannald et al. [2015] A. McDannald, L. Kuna, M. S. Seehra, and M. Jain, Physical Review B 91, 224415 (2015).
- McDannald et al. [2013] A. McDannald, L. Kuna, and M. Jain, Journal of Applied Physics 114, 113904 (2013).
- Bertaut and Mareschal [1968] E. Bertaut and J. Mareschal, J. Phys. France 29, 67 (1968).
- Yamaguchi [1974] T. Yamaguchi, J. Phys. Chem. Solids. 35, 479 (1974).
- Levy [1971] P. M. Levy, Journal of Applied Physics 1631, 3 (1971).
- Kimel et al. [2004] A. V. Kimel, A. Kirilyuk, A. Tsvetkov, R. V. Pisarev, and T. Rasing, Nature 429, 850 (2004).
- Cao et al. [2014] S. Cao, H. Zhao, B. Kang, J. Zhang, and W. Ren, Scientific Reports 4, 5960 (2014).
- Zhang et al. [2016] K. Zhang, K. Xu, X. Liu, Z. Zhang, Z. Jin, X. Lin, B. Li, S. Cao, and G. Ma, Scientific Reports 6, 23648 (2016).
- Yin et al. [2016] L. H. Yin, J. Yang, P. Tong, X. Luo, C. B. Park, K. W. Shin, W. H. Song, J. M. Dai, K. H. Kim, X. B. Zhu, and Y. P. Sun, Journal of Materials Chemistry C 4, 11198 (2016).
- Kumar et al. [2017] S. Kumar, I. Coondoo, M. Vasundhara, S. Kumar, A. L. Kholkin, and N. Panwar, Journal of Physics: Condensed Matter 29, 195802 (2017).
- Yin et al. [2014] L. H. Yin, J. Yang, R. R. Zhang, J. M. Dai, W. H. Song, and Y. P. Sun, Applied Physics Letters 104, 032904 (2014).
- Li et al. [2019] C. Li, G. O. Barasa, G. Zerihun, X. Chen, and S. Yuan, Journal of Alloys and Compounds 787, 463 (2019).
- Eibschütz et al. [1967] M. Eibschütz, S. Shtrikman, and D. Treves, Physical Review 156, 562 (1967).
- WHITE [1969] R. L. WHITE, Journal of Applied Physics 40, 1061 (1969).
- Tsymbal et al. [2007] L. T. Tsymbal, Y. B. Bazaliy, V. N. Derkachenko, V. I. Kamenevand, G. N. Kakazei, F. J. Palomares, and P. E. Wigen, Journal of Applied Physics 101, 123919 (2007).
- Du et al. [2010] Y. Du, Z. X. Cheng, X. L. Wang, and S. X. Dou, Journal of Applied Physics 108, 093914 (2010).
- Bertaut [1963] E. F. Bertaut, edited by G. T. Rado and H. Suhl (Academic Press, New York, 1963).
- Bartolomé et al. [2000] F. Bartolomé, J. Bartolomé, M. Castro, and J. J. Melero, Physical Review B 62, 1058 (2000).
- Yuan et al. [2011] S. Yuan, Y. Wang, M. Shao, F. Chang, B. Kang, Y. Isikawa, and S. Cao, Journal of Applied Physics 109, 07E141 (2011).
- Krynetskiǐ and Matveev [1997] I. B. Krynetskiǐ and V. M. Matveev, Physics of the Solid State 39, 584 (1997).
- Shamir et al. [1981] N. Shamir, H. Shaked, and S. Shtrikman, Physical Review B 24, 6642 (1981).
- Hornreich et al. [1975] R. M. Hornreich, Y. Komet, R. Nolan, B. M. Wanklyn, and I. Yaeger, Physical Review B 12, 5094 (1975).
- Rajeswaran et al. [2012] B. Rajeswaran, D. I. Khomskii, A. K. Zvezdin, C. N. R. Rao, and A. Sundaresan, Physical Review B 86, 214409 (2012).
- Saha et al. [2014] R. Saha, A. Sundaresan, and C. N. R. Rao, Materials Horizons 1, 20 (2014).
- Tokunaga et al. [2008] Y. Tokunaga, S. Iguchi, T. Arima, and Y. Tokura, Physical Review Letters 101, 097205 (2008).
- Bhadram et al. [2013] V. S. Bhadram, B. Rajeswaran, A. Sundaresan, and C. Narayana, EPL (Europhysics Letters) 101, 17008 (2013).
- Indra et al. [2016] A. Indra, K. Dey, A. Midya, P. Mandal, O. Gutowski, U. Rütt, S. Majumdar, and S. Giri, Journal of Physics: Condensed Matter 28, 279601 (2016).
- Ghosh et al. [2014] A. Ghosh, K. Dey, M. Chakraborty, S. Majumdar, and S. Giri, EPL (Europhysics Letters) 107, 47012 (2014).
- Sharma et al. [2014] Y. Sharma, S. Sahoo, W. Perez, S. Mukherjee, R. Gupta, A. Garg, R. Chatterjee, and R. S. Katiyar, Journal of Applied Physics 115, 183907 (2014).
- Su et al. [2012] Y. Su, J. Zhang, B. Li, and B. Kang, Ceramics International 38, S421 (2012).
- Yin et al. [2018] L. H. Yin, T. F. Shi, R. R. Zhang, C. B. Park, K. H. Kim, J. Yang, P. Tong, W. H. Song, J. M. Dai, X. B. Zhu, W. S. Yan, and Y. P. Sun, Physical Review B 98, 054301 (2018).
- Barone et al. [2011] P. Barone, S. Kanungo, S. Picozzi, and T. Saha-Dasgupta, Physical Review B 84, 134101 (2011).
- Rodríguez-Carvajal [1990] J. Rodríguez-Carvajal, Fullprof: a program for rietveld refinement and pattern matching analysis (1990).
- Rietveld [1969] H. Rietveld, A profile refinement method for nuclear and magnetic structures, Journal of Applied Crystallography 2, 65 (1969).
- Hovestreydt et al. [1992] E. Hovestreydt, M. Aroyo, S. Sattler, and H. Wondratschek, Journal of Applied Crystallography 25, 544 (1992).
- Kresse and Furthmüller [1996] G. Kresse and J. Furthmüller, Physical review B 54, 11169 (1996).
- Perdew et al. [1996] J. P. Perdew, K. Burke, and M. Ernzerhof, Generalized gradient approximation made simple, Physical Review Letters 77, 3865 (1996).
- Anisimov et al. [1993] V. I. Anisimov, I. V. Solovyev, M. A. Korotin, M. T. Czyzyk, and G. A. Sawatzky, Physical Review B 48, 16929 (1993).
- Prelorendjo et al. [1980] L. A. Prelorendjo, C. E. Johnson, M. F. Thomas, and B. M. Wanklynz, J. Phys. C: Solid St. Phys 13, 2567 (1980).
- Chakraborty et al. [2017] T. Chakraborty, H. S. Nair, H. Nhalil, K. R. Kumar, A. M. Strydom, and S. Elizabeth, Journal of Physics: Condensed Matter 29, 025804 (2017).
- Griffiths [1969] R. Griffiths, Physical Review Letters 21, 563 (1969).
- Pramanik and Banerjee [2010] A. K. Pramanik and A. Banerjee, Physical Review B 81, 024431 (2010).
- Singh et al. [2020] A. Singh, S. Rajput, P. Balasubramanian, M. Anas, F. Damay, C. M. N. Kumar, G. Eguchi, A. Jain, S. M. Yusuf, T. Maitra, and V. K. Malik, Physical Review B 102, 144432 (2020).
- Schuchert et al. [1969] H. Schuchert, S. Hüfner, and R. Faulhaber, Zeitschrift für Physik 220, 273 (1969).
- Zhong and Naoto [2004] F. Zhong and N. Naoto, Physical Review Letters 93, 176404 (2004).
- Yoshii et al. [2017] K. Yoshii, N. Ikeda, Y. Shimojo, and Y. Ishii, Materials Chemistry and Physics 190, 96 (2017).
- Sayetat et al. [1998] F. Sayetat, P. Fertey, and M. Kessler, Journal of Applied Crystallography 31, 121 (1998).
- Iliev and Abrashev [1998] M. Iliev and M. Abrashev, Physical Review B 57, 2872 (1998).
- Weber et al. [2012] M. C. Weber, J. Kreisel, P. A. Thomas, M. Newton, K. Sardar, and R. I. Walton, Physical Review B 85, 054303 (2012).
- Balkanski et al. [1983] M. Balkanski, R. F. Wallis, and E. Haro, Physical Review B 28, 1928 (1983).
- Mahana et al. [2017] S. Mahana, B. Rakshit, R. Basu, S. Dhara, B. Joseph, U. Manju, S. D. Mahanti, and D. Topwal, Physical Review B 96, 104106 (2017).
- El Amrani et al. [2014] M. El Amrani, M. Zaghrioui, V. Ta Phuoc, F. Gervais, and N. E. Massa, Journal of Magnetism and Magnetic Materials 361, 1 (2014).
- Bhadram et al. [2014] V. S. Bhadram, D. Swain, R. Dhanya, M. Polentarutti, A. Sundaresan, and C. Narayana, Materials Research Express 1, 026111 (2014).
- Zhu et al. [2020] Y. Zhu, Y. Fu, B. Tu, T. Li, J. Miao, Q. Zhao, S. Wu, J. Xia, P. Zhou, A. Huq, W. Schmidt, D. Ouyang, Z. Tang, Z. He, and H.-F. Li, Phys. Rev. Materials 4, 094409 (2020).
- Granado et al. [1999] E. Granado, A. García, J. A. Sanjurjo, C. Rettori, I. Torriani, F. Prado, R. D. Sánchez, A. Caneiro, and S. B. Oseroff, Physical Review B 60, 11879 (1999).