\ul
Stability of two-dimensional complex plasma monolayers in asymmetric capacitively-coupled radio-frequency discharges
Abstract
In this article, the stability of a complex plasma monolayer levitating in the sheath of the powered electrode of an asymmetric capacitively coupled radio-frequency argon discharge is studied. Compared to earlier studies, a better integration of the experimental results and theory is achieved by operating with actual experimental control parameters such as the gas pressure and the discharge power. It is shown that for a given microparticle monolayer at a fixed discharge power there exist two threshold pressures: (i) above a specific pressure , the monolayer always crystallises; (ii) below a specific pressure , the crystalline monolayer undergoes the mode-coupling instability and the two-dimensional complex plasma crystal melts. In-between and , the microparticle monolayer can be either in the fluid phase or the crystal phase: when increasing the pressure from below , the monolayer remains in the fluid phase until it reaches at which it recrystallises; when decreasing the pressure from above , the monolayer remains in the crystalline phase until it reaches at which the mode-coupling instability is triggered and the crystal melts. A simple self-consistent sheath model is used to calculate the rf sheath profile, the microparticle charges and the microparticle resonance frequency as a function of power and background argon pressure. Combined with calculation of the lattice modes the main trends of as a function of power and background argon pressure are recovered. The threshold of the mode-coupling instability in the crystalline phase is dominated by the crossing of the longitudinal in-plane lattice mode and the out-of plane lattice mode induced by the change of the sheath profile. Ion wakes are shown to have a significant effect too.
I Introduction
Two-dimensional (2D) complex plasma crystals are composed of negatively charged monosized spherical microparticles levitating in the sheath above a confining electrode [1]. Complex plasma crystals are generally studied in asymmetric capacitively coupled-radio frequency (cc-rf) argon discharges in which the injected monolayer of microparticles levitates in the sheath above the powered electrode and crystallises under specific discharge conditions [2, 3, 4, 5, 3, 6, 7, 8, 9]. Since microparticles can easily be imaged thanks to laser light scattering and the use of fast cameras, microparticle trajectories can be recovered and one can obtain information about the crystal at the kinetic ”particle” level. Thus, complex plasma crystals often serve as model systems to study generic phenomena such as wave propagation [5, 10], shocks and phase transitions [11].
However, due to the very nature of the complex plasma monolayer, complex plasma specific phenomena can occur. Because of the ion flow coming from the bulk plasma and directed towards the electrode, ion wakes are formed downstream of each microparticle [12, 13, 14]. The ion wakes exert attractive force on the neighbouring particles making the microparticle-microparticle interactions non-reciprocal. Under specific conditions, these non-reciprocal interactions can trigger the mode-coupling instability (MCI) [15, 16, 17, 9, 18, 19] in which energy from the flowing ions is transferred to the microparticles and can heat up the microparticle suspension. Indeed, in 2D complex plasma crystals, three wave modes can be sustained: longitudinal and transverse in-plane acoustic modes and, due to the finite strength of the vertical confinement, an out-of-plane optical mode (associated with vertical oscillations [20, 15, 7, 17, 21]. Due to wake attraction, when the longitudinal in-plane mode and the out-of-plane mode cross, an unstable hybrid mode is formed (the typical fingerprints being a hot spot in reciprocal space at the edge of the first Brillouin zone, angular dependence and mixed polarisation [17, 18]), which can trigger MCI if the instability growth rate is larger than the damping rate due to friction with the neutral background [17]. MCI is observed in both crystalline [17, 9, 18] and fluid monolayers [19, 22]. In the first case, MCI can result in rapid melting of the monolayer if its growth rate is high enough. In the latter case, MCI can prevent crystallisation of the monolayer by pumping more kinetic energy into the microparticles than the energy dissipated through friction with the neutral gas background [23, 24, 22]. Since for given discharge parameters (rf power, neutral gas pressure, geometry) and fixed monolayer parameters (number density and size of the microparticles) the growth rate in a fluid monolayer is higher than in a crystalline monolayer[19], it allows external triggering of the MCI [25] and prevents recrystallisation of a melted monolayer without strongly altering the discharge parameters [25, 22].
It was shown experimentally that MCI is triggered at specific pressure and rf power thresholds [9, 18]. MCI is very sensitive to the magnitude of the effective wake dipole moment since the shape of the dispersion relations critically depends on it [26]. MCI threshold and growth rate also strongly depend on the depth of the mode crossing [26], which is a function the ion-wake parameters and vertical confinement frequency. Both the ion wake and the vertical confinement frequency depend on the parameters of the rf sheath in which the microparticles are levitating such as the strength of the confining sheath electric field and the local ion and electron densities. Therefore, in order to understand the dynamics of the microparticle monolayer, it is very important to be able to relate the discharge parameters (background argon pressure, rf power) to the sheath parameters (electric field profile, ion flux profile, ion and electron density profiles) . Modeling the rf sheath in a cc-rf discharge is however not trivial and accurate calculation of rf sheath profile has been a subject of active research for the past three decades, see for example Refs. [27, 28, 29, 30, 31, 32, 33, 34, 35, 36].
In this article, the stability of 2D complex plasma monolayers levitating in the sheath above the powered electrode of a cc-rf discharge is experimentally studied. In Sec. II, the experimental set up is described. In Sec. III, the experimental characterisation of the cc-rf discharge (electron density and powered electrode self bias) as a function of the background argon pressure and the forward rf power is presented. In Sec. IV, a study of the stability (crystal or fluid) of specific microparticle monolayers as a function of rf power is performed. It allowed us to measure the MCI pressure threshold and the crystallisation pressure threshold over a wide range of rf powers. In Sec. V, a simple self-consistent sheath model is described and used to calculate the sheath profile and microparticle charge, and vertical resonance frequency as a function of discharge parameters. In Sec. VI, the results of Sec. V are used to calculate the lattice modes of 2D complex plasma crystal with and without ion wakes. The influence of the interparticle distance and wake parameters are investigated. The calculated results are compared to experimental results. In Sec. VII, the main results are summarised and future investigations are discussed.
II Experimental set up
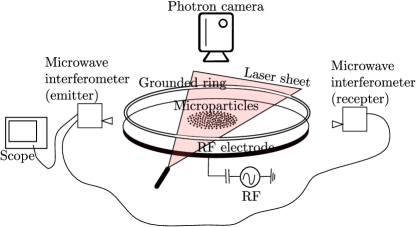
The experiments were performed in a modified Gaseous Electronic Conference rf cell (GEC). It is an asymmetric cc-rf discharge at 13.56 MHz. A sketch of the setup is shown in Fig. 1. Experiments were performed with an argon pressure, , between 0.5 and 2 Pa. The forward rf power, , was set between 5 and 25 W. Langmuir probe studies using the same setup have shown that the electron temperature is eV and that the electron density is at Pa and W [37]. A Miwitron Ka-band microwave interferometer MWI 2650 working at 26.5 GHz was used to measure the electron density, , in pristine plasma condition (without injected microparticles) for different and . The interferometer had a resolution of .
Melamine-formaldehyde (MF) spherical microparticles with a diameter of were injected in the plasma. They levitated in the sheath above the lower rf electrode where the electric force balanced their weight and formed a highly ordered horizontal monolayer. The microparticle monolayer was illuminated by a horizontal laser sheet and the microparticles were imaged through the top chamber window by using a 4 Megapixel Photron FASTCAM Mini WX100 camera at a speed of 250 frames per second. Particle tracking allowed us to recover the particle horizontal coordinates, and with subpixel resolution in each frame, and the velocities, and , were then calculated [8]. An additional side-view camera (Basler Ace ACA640- 100GM) was used to check that no particles were levitating above or under the main monolayer. More details can be found in previous publications [38, 39, 37, 9]
III Characterisation of the cc-rf discharge
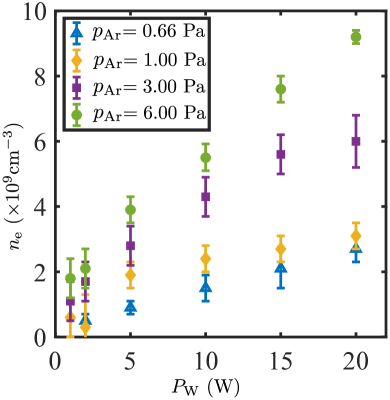
Electron density measurements have been taken with the microwave interferometer for different pressure between 0.66 Pa and 6.0 Pa and for rf power between 1 W and 20 W. The results are are shown in Fig. 2. The density reported at Pa and W is which is in agreement with previous Langmuir probe measurements [37]. As expected, increases with forward RF power and pressure [40, 34]. The measured values of bulk plasma density are used as input parameters for sheath profile calculations in Sec. V.3.
The absolute value of self-bias voltage on the powered electrode, , has also been measured for a few relevant experimental discharge conditions. The results are shown in Fig. 3 (dots). As can be seen, is not very sensitive to pressure. It has approximately a square-root dependence on the forward rf power.
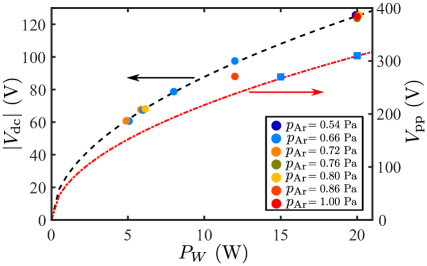
It is known that the self-bias voltage is related to the ratio of the areas of the powered surface to the grounded surface interacting with the plasma [41, 40]. The ratio of the self bias voltage to the amplitude of the rf voltage is in first approximation given by [42, 43]:
| (1) |
where is the peak-to-peak rf voltage. It was experimentally measured that in a modified GEC cell similar to the one that was used for the current set of experiments, [43]. Using the fit of as a function of and Eq. (1), was calculated and the result is shown by the dotted red line in Fig. 3. The results match reasonably well with two measured values of at 15 W and 20 W for Pa (blue squares). The calculated values of and are used as input parameters to calculate sheath profiles in Sec. V.3.
IV Stability of complex plasma monolayers
A large monolayer suspension was created by injecting monosized melamine formaldehyde microparticles (diameter ). The monolayer was kept for the 2 sets of experiments (referred to as Experiment I and Experiment II) separated by 1 hour. According to Ref.[44], the MF microparticles are etched at a rate of in an argon discharge meaning that the microparticle diameter for the second set of experiments was .
The crystallisation and melting pressures of the monolayer were explored for different rf powers. At a given rf power, starting from a fluid monolayer, the argon pressure was gradually increased until the monolayer was fully crystallised and the crystallisation pressure was recorded. Note that during the pressure increase period, the monolayer remained in the fluid phase 111 Except when within a few Pa of the crystallisation pressure where the outer part of the monolayer has started crystallising while the centre remained melted. Then the pressure was very slowly decreased until MCI was triggered in the crystal resulting in the rapid melting of the monolayer in a pattern similar to the results reported in Refs. [46, 47, 22]. Note that during the pressure decrease period, the monolayer remained in the crystalline phase until MCI was triggered. The rf power was then decreased and the procedure was repeated.
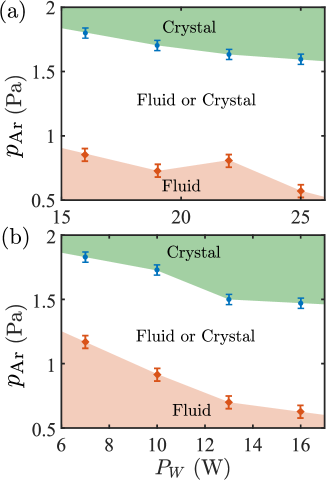
The results for the two sets of experiments are shown in Fig. 4. As can be seen, in both cases, the higher the power the lower the crystallisation and melting pressures. Moreover, the gap between the two pressures, in which the monolayer remains in the crystalline phase when decreasing the pressure from above the crystallisation threshold and remains fluid when increasing the pressure from bellow the MCI melting threshold, increases when increasing the RF power.
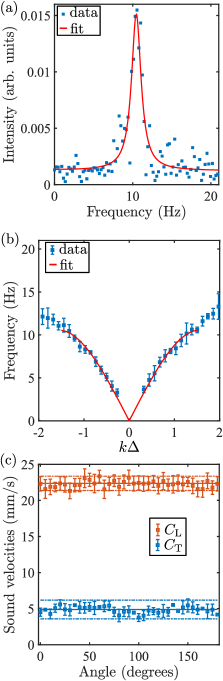
During the decreasing pressure phase, the crystalline monolayer was imaged with the high-speed Photron camera in order to track the particle trajectories and recover the longitudinal and transverse current fluctuation spectra following the procedure described in Refs. [48, 49, 46]. To extract the longitudinal and transverse dispersion relations where is the frequency of the lattice modes with wave number , the current fluctuation spectra were fitted to a double-Lorentzian form [50, 51]:
| (2) |
with a constant proportional to the damping rate of the mode. The indices and are for longitudinal and transverse, respectively. In Fig. 5(a), the fit of the current spectrum for a normalised wave number , where is the interparticle distance is shown and the entire experimental longitudinal dispersion relation is shown in Fig. 5(b) for wave propagating at an angle of with respect to the camera field of view. The interparticle distance was obtained from the position of the first peak of the pair correlation function and error bars are the widths of the peaks at half maximum. Due to high noise level for , the frequencies of the mode at these long wavelengths were not measured. Then, longitudinal and transverse dispersion relations were fitted for by the polynomial of the form , where are the longitudinal and transverse sound speeds and are constants taking into account the non-linearity of the dispersion relation for .
By numerically rotating the frame with respect to the original camera field of view and repeating the procedure, wave propagation could be studied at different angles. were obtained every (see Fig. 5(c)) and the average values of the sound speeds were calculated for different crystal conditions. Assuming screened Coulomb interactions and following the method of Ref. [6], these values were then used to extract the microparticle charge , the Debye (screening) length and the coupling parameter . The results are summarised in Table 1.
| \ul | (W) | (Pa) | (Pa) | (Pa) | (mm) | (mm/s) | (mm/s) | (e) | \ul | () |
|---|---|---|---|---|---|---|---|---|---|---|
| Experiment I | 25 | 1.583 | ||||||||
| 1.167 | ||||||||||
| 0.750 | ||||||||||
| 22 | 1.633 | |||||||||
| 1.167 | ||||||||||
| 0.833 | ||||||||||
| 19 | 1.703 | |||||||||
| 1.167 | ||||||||||
| 1.000 | ||||||||||
| 0.833 | ||||||||||
| 16 | 1.800 | |||||||||
| 1.250 | ||||||||||
| 1.000 | ||||||||||
| Experiment II | 16 | 1.47 | ||||||||
| 1.167 | ||||||||||
| 0.750 | ||||||||||
| 13 | 1.500 | |||||||||
| 1.167 | ||||||||||
| 0.750 | ||||||||||
| 10 | 1.730 | |||||||||
| 1.167 | ||||||||||
| 0.967 | ||||||||||
| 7 | 1.830 | |||||||||
| 1.250 |
As can be seen, decreasing the pressure at constant RF power resulted in an increase of both sound speeds and a slight increase of the interparticle distance. Assuming pure screened Coulomb interactions, it corresponded to an increase of the microparticle charges. Accordingly, the maximum frequency of the longitudinal dispersion relation (not shown here) increased when decreasing pressure making the out-of-plane mode and the in-plane mode closer to each other as the MCI pressure threshold, , was approached. No trend in the evolution of the coupling parameter could be extracted due to the large error on the sound speeds, especially the transverse sound speed.
V Sheath profile above the powered electrode of a capacitively coupled radio-frequency discharges
Any modification of the discharge parameters ( and/or ) has an impact on the plasma and therefore on the sheath properties. It is then evident that since the microparticle monolayer levitates in the rf sheath above the powered electrode, any changes of the discharge parameters also affect the monolayer properties. In this section, a simple model allowing calculation of the sheath profile above the powered electrode in an asymmetric cc-rf discharge as a function of the discharge parameters is described. The model is then validated against available experimental data and then used to obtain the dependence of sheath parameters (sheath length, ion and electron densities, electric field) as a function of the discharge parameters ( and ).
V.1 Description of the model
In a cc-rf discharge, the rf frequency is generally much higher than the ion plasma frequency and much lower than the electron plasma frequency, i.e. where are the ion, electron and rf angular frequency, respectively. In that respect, the ions respond to the time-averaged sheath electric field. Moreover, in most of 2D complex plasma crystal experiments, the working pressure is around 1 Pa. In this situation, ion collisions cannot be neglected [28]. The main assumptions of the following model are based on earlier work by M. Lieberman [28]:
-
1.
Collisional ion motion with a constant ion mean free path in the sheath,
-
2.
Cold ions (ion temperature ),
-
3.
Inertia-less electrons that respond instantaneously to the electric field,
-
4.
No secondary electrons emitted from the electrode,
-
5.
No ionisation in the sheath.
In most experiments, asymmetric cc-rf discharges with grounded area much larger than the powered electrode area are used. Moreover, since the matching circuit very often contains a blocking capacitor, no direct-current can flow in the external circuit. Since the area of each electrode is different, the amount of collected ions and electrons during each rf cycle in also different and results in the appearance of a self-bias voltage on the powered electrode [41, 30]. Ideally, it would be necessary to consider both sheath in front of both electrodes simultaneously [30]. However, in order to simplify the problem, the following assumptions are made:
-
1.
The voltage on the rf electrode is of the form:
(3) The input values of and were discussed in Sec. III.
-
2.
At all time instants, the plasma must remain quasi neutral and therefore the current going through the powered electrode sheath and the anode sheath must be equal in intensity and of opposite signs. Following the method described by Song et al. [42], the time dependence of the plasma potential with respect to the grounded wall is approximated by:
(4)
In the following, the plasma potential is taken as the reference potential (). At any given instant of time, the potential of the rf electrode with respect to the plasma is:
| (5) |
The time-dependant potential profile in the sheath follows the Poisson equation:
| (6) |
The boundary conditions are and , where is the length of the ion sheath.
Since , ions react only to the time-averaged electric field where is the time-averaged electric potential across the sheath of the powered electrode. Therefore, in the sheath, the ion particle conservation and momentum conservation equations are [52, 29]:
| (7) | ||||
| (8) |
where is the plasma density at the plasma sheath boundary, is the ion velocity at a given position in the sheath, is the velocity of the ions at the ion sheath boundary (), and is the ion mass. When taking into account collisions, is the modified Bohm velocity [52, 29]:
| (9) |
where is the electron temperature in eV, is the elementary charge, is the electron Debye length.
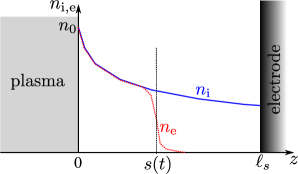
In order to calculate the sheath profile, one needs to make a few approximations. First of all, in order to solve Eq. 6, one needs to know the exact position of the time-varying sheath boundary. Indeed, depending on the voltage across the sheath, the electron sheath boundary will change and oscillate between the position of the ion sheath boundary to a minimum distance to the electrode (see Fig. 6).
Generally, in cc-rf discharges, the amplitude of the rf voltage is much higher than the electron temperature, i.e. and the electron Debye length is much smaller than the sheath width . It is thus clear that on the plasma side (), the quasi-neutrality holds (), while on the sheath side (), the electron density falls very rapidly (). Many studies dealing with the structure of cc-rf sheath therefore use this approximation known as the step model which has been extensively used in different models of cc-rf sheath [27, 28, 29, 30, 32, 33, 31, 35]. In many of these models, the solution of the rf sheath relies on calculating the rf current through the sheaths (powered and grounded) and assuming a zero net current [27, 28, 29, 30, 33]. It allows one to calculate the position of the electron sheath at all times and from there the other quantities such as the average potential drop and average electric field in the sheath can be derived. Calculations of these kind have been performed for both symmetric [27, 28, 29] and asymmetric discharges [30, 33]. It was nevertheless shown that, in the case of symmetric cc-rf discharges, these models were able to accurately describe the current-voltage characteristics but showed discrepancies in the potential and electric field profiles with respect to the exact solution [31]. More recent models allow for very accurate descriptions of the cc-rf sheath but require input such as the maximum sheath extension, the ion mean free path and the electron Debye length [35]. The ion mean free path and the electron Debye length can be easily obtained from discharge pressure, interferometry measurements and literature data. However, the maximum sheath extension is not a parameter which is very often measured. Moreover, the current and voltage waveforms on the powered electrode are usually not monitored. However, in our experiments, the self-bias voltage and the electron density were measured as a function of the forward rf power and argon pressure over a wide range of parameters which can be used to recover the rf voltage amplitude using Eq. 1. The electron temperature can be estimated using the uniform density discharge model [40]:
| (10) |
where is the ionisation rate [40], is the Bohm velocity, is the neutral gas number density and is the effective plasma size for particle loss with the height of the discharge chamber, its radius, and [40] and the ion mean free path in the plasma bulk.
The sheath profile can then be calculated using the following approximation for the time-dependent Poisson equation:
| (11) |
As can be seen, this approximation lies between the ion matrix sheath approximation () and the step model. It however allows us to solve the Poisson equation at anytime knowing the voltage drop in the sheath. The mean electric field and ion density profiles are then obtained in a recursive approach. Starting from the collision-less dc sheath profile with a potential drop equal to the maximum of , a maximum sheath length and an initial ion density profile are calculated [40, 53]:
| (12) | |||||
| (13) | |||||
| (14) |
Then the time-dependant potential profile over one rf period is calculated by solving Eq. (11) with Matlab and using the following boundary conditions:
| (15) | ||||
| (16) |
and new time-averaged potential and electric field are calculated. If the time-averaged electric field on the plasma side () is lower than , a value necessary to ensure monotonically decreasing ion density and increasing ion velocity in the sheath region, then the sheath boundary on the plasma side is moved towards the wall until the average electric field reaches and a new sheath length is obtained. Using Eqs. (7) and (8) with the boundary conditions:
| (17) | ||||
| (18) |
a new ion density profile is obtained and the time-dependant potential profile is calculated again. The procedure is repeated until it converges, which typically occurs in 10 to 15 iterations.
V.2 Comparison to experimental data, validation of the model
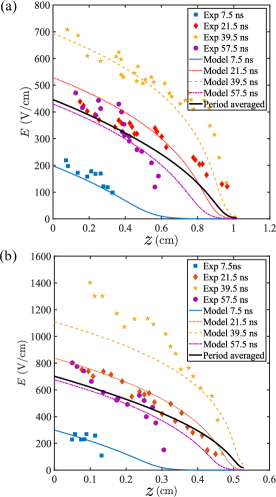
Schulze et al. have measured experimentally the time-dependant electric field of a cc-rf capacitive discharge in krypton at different pressures [54]. Czarnetzki used this set of measurements to validate with success his advanced model of cc-rf sheath [35].
Two sets of discharge parameters were used to validate our model:
- (a)
- (b)
In Fig. 7, the model results are compared to the experimental data of Schulze et al. [54]. As can be seen, the agreement is not perfect and the model tends to slightly underestimate the electric field, especially at large pressure. However, one should note that the length of the sheath is recovered within a few percent and that the electric field values are in respectable agreement with the measured ones.
We can therefore conclude that our simple model is able to catch the main features of the collisional cc-rf sheath and can reasonably estimate the main sheath parameters as a function of position for an adequate range of discharge parameters.
V.3 Calculated sheath profile
The model was then used for conditions relevant to our experimental conditions. The argon pressure was varied between 0.5 Pa and 2 Pa by steps of 0.05 Pa and the rf power was varied between 5 W and 25 W by steps of 1 W. In Fig. 8 the sheath potential (Figs. 8(a-c)) and the electron and ion densities (Figs. 8(d-f)) are shown as a function of position for different pressures and rf powers.
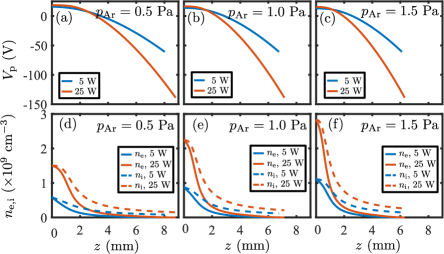
As can be seen in the top row of Fig. 8, increasing pressure at constant rf power results in shorter sheath length for a similar potential drop (the sheath length is mm at Pa and drops down to mm at Pa). Therefore, the vertical electric field is weaker at lower pressures. One can therefore expect a weaker vertical confinement for microparticles levitating in the rf sheath at low pressure for a given rf power. Increasing the rf power at constant pressure results in a slight increase of the sheath length but larger plasma potential drops due to increasing self-bias voltage (the potential drop is V at W and V at W). Therefore, a stronger vertical electric field and a stiffer vertical confinement for microparticles levitating in the rf sheath at high rf power are expected.
Both and have an impact on plasma density. We know that at a given pressure, the plasma density is increasing almost linearly with rf power (see Fig. 2). Since the sheath length is weakly dependant on rf power (see previous paragraph), the gradients of ion and electron densities in the sheath increase with rf power as can be seen in the bottom row of Fig. 8. At high pressure, the plasma density is higher (due to collisions), the sheath length is short resulting in steep density gradients.
Using the calculated sheath profiles, the dependence of dust particle charge number, , levitation height, and vertical resonance frequency, on discharge parameters is explored in the next section.
VI Microparticle properties and mode-coupling instability
In this section, the influence of discharge parameters on , , and is investigated. Then, the threshold of MCI in 2D complex plasma crystal as a function of discharge parameters is studied.
VI.1 Dust particle charge, levitation height and vertical resonance frequency
With the calculated sheath profile as a function of rf power and pressure, the equilibrium dust particle charge and levitation height can be calculated. At any point in the sheath, the ion and electron densities are known allowing the calculation of ion and electron currents, and respectively onto the microparticle surface in a collisional plasma [56, 57]:
| (19) | ||||
| (20) |
where is the radius of the microparticle, is the normalised microparticle floating potential and is the linearised Debye length at the considered position in the sheath with . At equilibrium and the normalised floating potential can be obtained for any position in the sheath (ions are assumed to be in thermal equilibrium with the background gas, eV). The microparticle charge number where is the microparticle charge is then obtained:
| (21) |
Since and therefore the mass of the microparticle are known and since the sheath electric field profile has been calculated, the equilibrium levitation height and the vertical resonance (confinement) frequency can be obtained using the following equations:
| (22) | |||
| (23) |
In Fig. 9, the results of the calculation of levitation height, particle charge at equilibrium position and vertical resonance frequency as a function of rf power and background argon pressure are shown.
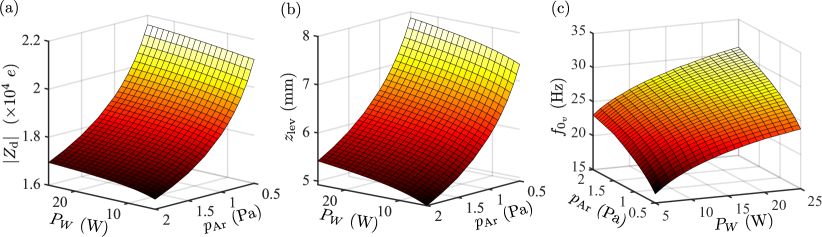
The obtained equilibrium particle charges are between and (see Fig. 9(a)), which is slightly larger than the measured one (see Table. 1) but are of the same order of magnitude. One can see that at a given argon background pressure, and are only slightly increasing with rf power. Moreover, the microparticles levitate quite high in the sheath near the sheath edge (for example at 1 Pa, the sheath length is around mm [see Fig. 8] and the levitation height is around mm [see Fig. 9(b)]). This is due to the fact that even though the ion and electron densities are increasing with rf power, the electron temperature is mostly set by the background gas pressure. Since has a greater influence than on the magnitude of the electron current onto a microparticle and therefore the microparticle charge, the microparticle equilibrium charge depends only weekly on rf power. Since at equilibrium levitation height, the gravity force is compensated by the electric force and, as seen previously, the sheath length being only weakly dependant on rf power, the particle levitation height will only slightly change.
The vertical resonance frequency is increasing significantly with both rf power and argon background pressure (see Fig. 9(c)). In both cases, this is due to steeper electric field when increasing rf power (resulting in larger self-bias) and when increasing the background argon pressure (resulting in shorter sheath). Therefore, decreasing pressure or rf power results in weaker vertical confinement and favours MCI for 2D complex plasma crystals. On the contrary, high pressure and high rf power favour crystallisation of complex plasma monolayer by providing stiffer vertical confinement. More details are given in the next subsection.
VI.2 Mode-coupling instability
It is well known that MCI can occur in 2D complex plasma crystals [17, 9, 18] and in fluid complex plasma monolayers [19, 22, 25]. In Sec. IV, it was demonstrated experimentally that decreasing pressure and/or rf power leads to MCI in 2D complex plasma crystals and that the MCI threshold and crystallisation threshold have defined trends.
One of the simplest ways to simulate MCI is to use the point-charge wake model [17, 18, 58]. In this model, the ion wake is approximated by a positive point charge downstream of each microparticle at a distance below the microparticle. Then each microparticle interacts with the other microparticles and their respective ion wakes through screened-Coulomb (Yukawa) interactions. The interparticle distance in the 2D crystal is set at a fixed value . In the calculation, the screening length is taken as the electron Debye length, at the equilibrium leviation height. To compute the different lattice modes in the 2D complex plasma crystals, one can calculate the dynamical matrix which has the form [17, 18, 58]:
| (24) |
where , and are the dispersion elements, are the coupling terms between the in-plane and out-of-plane modes due to the particle-wake interaction. Detailed expressions of these different terms as functions of , , , , and , where is the wave vector of the considered lattice mode can be found in Refs. [17, 18, 58]. The dispersion relation of the microparticle lattice modes are obtained for any by solving , where is the unit matrix, so that are the eigenvalues of the dynamical matrix, where is the damping rate due to neutral gas friction.
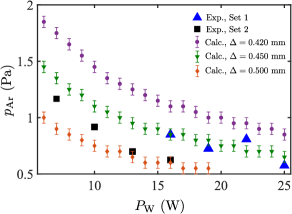
It is known that the mode coupling instability in a 2D complex plasma crystal is triggered when the out-of-plane mode and the in-plane longitudinal mode cross [17, 18] except in very specific experimental conditions where the ion wake charges are really strong allowing coupling of the modes without direct crossing [59]. Firstly, the influence of the interparticle distance on mode crossing is investigated in the case where ion wakes are ignored (). Using the results of Sec. V.3 and Sec. VI.1, the minimum pressure for out-of-plane and in-plane longitudinal mode crossing as a function of power were calculated for different (420 , 450 and 500 ). The results are presented in Fig. 10. As can be seen, the out-of-plane and in-plane longitudinal mode crossing minimum pressure decreases when increasing the rf power. This can be understood due to the competing effects of the pressure decrease which makes sheath longer and therefore weaken the confining electric field and the rf power increase that increases the self-bias of the powered electrode and makes the vertical confinement stiffer. Moreover, at low pressure the microparticle charge is larger due to a higher electron temperature, which for a fixed interparticle distance renders the interaction force greater and therefore increases the maximum frequency of the longitudinal in-plane mode and makes mode crossing easier. In addition, one can see that the pressure threshold is systematically lower for larger . This is due to the weaker interparticle interaction which reduces the maximum frequency of the longitudinal in-plane mode and the minimum frequency of the out-of-plane mode. Finally, we can see that experimental points follow roughly the same trend. This shows that the sheath profile (which depends on and ) plays a major role in the crossing of the modes and the triggering of MCI in 2D complex plasma crystals.
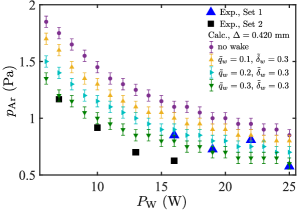
In a second step, the interparticle distance was fixed to and point-charge wakes were considered. Only the value of the wake charge was varied (), while the distance to the microparticle is fixed (). Then, the pressure threshold for the crossing of the modes (and the triggering of MCI) were calculated again. The results are presented in Fig. 11. As can be seen, the main trends are still there: when increasing the rf power, the threshold pressure decreases. However, the ion wakes have a significant effect. Increasing the ion wake charge significantly decreases the pressure threshold at a given rf power. The wake charges are unknown in the experiment and their overall effect on the measured pressure threshold are difficult to estimate. However, one can see in Figs. 10 and 11 that the experimental threshold values are not exactly aligned with the calculated one. Note again that the experimental particle charges are slightly smaller than the calculated ones and used in the calculation is slightly larger than the experimental one (which is in addition not a constant for a given but slightly decreases with . In order to calculate the true MCI pressure threshold, it would be necessary to take into account the evolution of the horizontal confinement as a function of and as well as self-consistent wake parameters for the calculation of the lattice modes. A more sophisticated model for the ion wake such as those described in Refs. [58, 60, 61] is also needed as the wake model has a strong influence on the shape of the lattice modes [58].
To conclude, let us discuss the trend for the crystallisation pressure observed in Fig. 4. As it was shown in Sec. IV, the crystallisation pressure follows the same trend as the MCI threshold pressure: it decreases with increasing power. This can be roughly explained through the modification of the sheath profile. When the increases, the sheath electric field and therefore the vertical confinement become stronger. However, when in the fluid phase, the crossing of the out-of-plane mode with the longitudinal in-plane mode always occurs and MCI will exist unless damping due to neutral friction is high enough to suppress it [19]. At constant rf power, the microparticle charges decrease when increasing pressure (see Fig. 9 and Tab. 1). Therefore, the longitudinal in-plane mode is not as steep (the longitudinal sound speed decreases, see Tab. 1) and it will result in smaller instability growth rate. It was also shown in Ref. [19], in the framework of the wake-layer model, that when the vertical confinement frequency is increased above the threshold for mode crossing for MCI in a 2D crystal with the same microparticle parameters as in the fluid layer (same microparticle charges and same microparticle number density), the instability growth rate decreases as . The crystallisation threshold is therefore also influenced by the wake parameters. Since these parameters are unknown, the crystallisation pressures were not calculated but ion wakes are expected to have a non-negligible effect as for the MCI threshold pressure in 2D complex plasma crystals. In future studies, the use of a self-consistent wake model such as in Ref. [61] in addition to proper modelling of the horizontal confinement as a function of discharge parameters should enable us to derive self-consistently the MCI threshold and crystallisation pressures.
VII Summary and Conclusion
In this article, the MCI threshold pressure and crystallisation pressure of monolayer complex plasma levitating in the sheath of an argon cc-rf discharge were investigated. It was found that the stability of a crystalline microparticle monolayer increases with pressure and with the rf power: at constant rf power, the higher the rf power the lower the crystallisation and MCI threshold pressures; at constant background argon pressure, the higher the pressure the lower rf power for crystallisation of the monolayer and for the triggering of MCI. It was also found by measuring the longitudinal and transverse sound speeds in two dimensional complex plasma crystal that at constant rf power, lower pressure resulted in larger sound speeds and therefore larger microparticle charges. These results are in agreement with previous observations of the MCI [9, 18].
A simple rf sheath model was developed to calculate the evolution of the rf sheath profile as a function of the input rf power and the background argon pressure. Using experimental measurements of the electron density in the plasma bulk and the powered electrode self-bias as input parameters, the model was able to show that the argon pressure and the rf power have significant influence on sheath profiles. Using the calculated sheath parameters, the microparticle equilibrium charge, the equilibrium levitation height and the vertical confinement frequency were also calculated. It was found that: (i) a power increase at constant pressure leads to increase of , and and (ii) a pressure increase at constant rf power leads to decrease of , and an increase of . Combined with the point-charge wake model [17], the trends for MCI threshold pressure could be reproduced (i.e. decreasing the pressure at constant power would lead to the crossing of the longitudinal in-plane mode and the out-of-plane mode and trigger MCI, lower rf power results in higher MCI threshold pressure). However, it was also shown that the MCI threshold is sensitive to interparticle distance and wake parameters.
Compared to earlier studies, a better integration of the experimental results and theory was achieved by operating with actual experimental control parameters such as the gas pressure and the discharge power. However, future studies will concentrate on the use of a self-consistent wake model [61] to study the influence of ion wakes on dust equilibrium position and vertical resonance frequency. The influence of the plasma parameters on horizontal confinement should also be taken into account in order to model self-consistently the interparticle distance in monolayer complex plasma enabling more detailed investigations of fluid MCI and the crystallisation threshold pressure.
Acknowledgements.
The authors would like to thank S. Zhdanov for fruitful comments and discussions. The authors would also like to thank H. Thomas for his careful reading of our manuscript. L. Couëdel acknowledges the support of the Natural Sciences and Engineering Research Council of Canada (NSERC), RGPIN-2019-04333.References
- Morfill and Thomas [1996] G. Morfill and H. Thomas, Plasma crystal, Journal of Vacuum Science & Technology A: Vacuum, Surfaces, and Films 14, 490 (1996).
- Melzer et al. [2000] A. Melzer, S. Nunomura, D. Samsonov, Z. W. Ma, and J. Goree, Laser-excited mach cones in a dusty plasma crystal, Phys. Rev. E 62, 4162 (2000).
- Nunomura et al. [2000] S. Nunomura, D. Samsonov, and J. Goree, Transverse waves in a two-dimensional screened-coulomb crystal (dusty plasma), Phys. Rev. Lett. 84, 5141 (2000).
- Schweigert et al. [2002] V. A. Schweigert, I. V. Schweigert, V. Nosenko, and J. Goree, Acceleration and orbits of charged particles beneath a monolayer plasma crystal, Phys. Plasmas 9, 4465 (2002).
- Nosenko et al. [2003] V. Nosenko, J. Goree, Z. W. Ma, D. H. E. Dubin, and A. Piel, Compressional and shear wakes in a two-dimensional dusty plasma crystal, Physical Review E 68, 056409 (2003).
- Nunomura et al. [2002] S. Nunomura, J. Goree, S. Hu, X. Wang, A. Bhattacharjee, and K. Avinash, Phonon spectrum in a plasma crystal, Phys. Rev. Lett. 89, 035001 (2002).
- Qiao and Hyde [2003] K. Qiao and T. W. Hyde, Dispersion properties of the out-of-plane transverse wave in a two-dimensional coulomb crystal, Phys. Rev. E 68, 046403 (2003).
- Couëdel and Nosenko [2019] L. Couëdel and V. Nosenko, Tracking and linking of microparticle trajectories during mode-coupling induced melting in a two-dimensional complex plasma crystal, Journal of Imaging 5, 10.3390/jimaging5030041 (2019).
- Couëdel et al. [2010] L. Couëdel, V. Nosenko, A. V. Ivlev, S. K. Zhdanov, H. M. Thomas, and G. E. Morfill, Direct observation of mode-coupling instability in two-dimensional plasma crystals, Phys. Rev. Lett. 104, 195001 (2010).
- Samsonov et al. [2005] D. Samsonov, S. Zhdanov, and G. Morfill, Vertical wave packets observed in a crystallized hexagonal monolayer complex plasma, Phys. Rev. E 71, 026410 (2005).
- Thomas and Morfill [1996] H. M. Thomas and G. E. Morfill, Melting dynamics of a plasma crystal, Nature 379, 806 (1996).
- Ishihara and Vladimirov [1997] O. Ishihara and S. V. Vladimirov, Wake potential of a dust grain in a plasma with ion flow, Phys. Plasmas 4, 69 (1997).
- Vladimirov et al. [2003] S. V. Vladimirov, S. A. Maiorov, and O. Ishihara, Molecular dynamics simulation of plasma flow around two stationary dust grains, Phys. Plasmas 10, 3867 (2003).
- Matthews et al. [2020] L. S. Matthews, D. L. Sanford, E. G. Kostadinova, K. S. Ashrafi, E. Guay, and T. W. Hyde, Dust charging in dynamic ion wakes, Physics of Plasmas 27, 023703 (2020).
- Ivlev and Morfill [2000] A. V. Ivlev and G. Morfill, Anisotropic dust lattice modes, Phys. Rev. E 63, 016409 (2000).
- Ivlev et al. [2003] A. V. Ivlev, U. Konopka, G. Morfill, and G. Joyce, Melting of monolayer plasma crystals, Phys. Rev. E 68, 026405 (2003).
- Zhdanov et al. [2009] S. K. Zhdanov, A. V. Ivlev, and G. E. Morfill, Mode-coupling instability of 2d plasma crystals, Phys. Plasmas 16, 083706 (2009).
- Couëdel et al. [2011] L. Couëdel, S. K. Zhdanov, A. V. Ivlev, V. Nosenko, H. M. Thomas, and G. E. Morfill, Wave mode coupling due to plasma wakes in two-dimensional plasma crystals: In-depth view, Phys. Plasmas 18, 083707 (2011).
- Ivlev et al. [2014] A. V. Ivlev, S. K. Zhdanov, M. Lampe, and G. E. Morfill, Mode-coupling instability in a fluid two-dimensional complex plasma, Phys. Rev. Lett. 113, 135002 (2014).
- Vladimirov et al. [1997] S. V. Vladimirov, P. V. Shevchenko, and N. F. Cramer, Vibrational modes in the dust-plasma crystal, Phys. Rev. E 56, R74 (1997).
- Couëdel et al. [2009] L. Couëdel, V. Nosenko, S. K. Zhdanov, A. V. Ivlev, H. M. Thomas, and G. E. Morfill, First direct measurement of optical phonons in 2d plasma crystals, Phys. Rev. Lett. 103, 215001 (2009).
- Yurchenko et al. [2017] S. O. Yurchenko, E. V. Yakovlev, L. Couëdel, N. P. Kryuchkov, A. M. Lipaev, V. N. Naumkin, A. Y. Kislov, P. V. Ovcharov, K. I. Zaytsev, E. V. Vorob’ev, G. E. Morfill, and A. V. Ivlev, Flame propagation in two-dimensional solids: Particle-resolved studies with complex plasmas, Phys. Rev. E 96, 043201 (2017).
- Williams et al. [2012] J. D. Williams, E. Thomas, L. Couëdel, A. V. Ivlev, S. K. Zhdanov, V. Nosenko, H. M. Thomas, and G. E. Morfill, Kinetics of the melting front in two-dimensional plasma crystals: Complementary analysis with the particle image and particle tracking velocimetries, Phys. Rev. E 86, 046401 (2012).
- Röcker et al. [2014] T. B. Röcker, L. Couëdel, S. K. Zhdanov, V. Nosenko, A. V. Ivlev, H. M. Thomas, and G. E. Morfill, Nonlinear regime of the mode-coupling instability in 2d plasma crystals, EPL (Europhysics Letters) 106, 45001 (2014).
- Couëdel et al. [2018] L. Couëdel, V. Nosenko, M. Rubin-Zuzic, S. Zhdanov, Y. Elskens, T. Hall, and A. V. Ivlev, Full melting of a two-dimensional complex plasma crystal triggered by localized pulsed laser heating, Phys. Rev. E 97, 043206 (2018).
- Röcker et al. [2014] T. B. Röcker, A. V. Ivlev, S. K. Zhdanov, and G. E. Morfill, Effect of strong wakes on waves in two-dimensional plasma crystals, Phys. Rev. E 89, 013104 (2014).
- Lieberman [1988] M. A. Lieberman, Analytical solution for capacitive rf sheath, IEEE Trans. Plasma Sci 16, 638 (1988).
- Lieberman [1989] M. A. Lieberman, Dynamics of a collisional, capacitive rf sheath, IEEE Trans. Plasma Sci. 17, 338 (1989).
- Godyak and Sternberg [1990a] V. A. Godyak and N. Sternberg, Dynamic model of the electrode sheath in a symmetricaly driven plasma, Phys. Rev. A 42, 2299 (1990a).
- Chandhok and Grizzle [1998] M. Chandhok and J. W. Grizzle, Modeling the pressure dependence of dc bias voltage in asymmetric, capacitive rf sheaths, IEEE transactions on plasma science 26, 181 (1998).
- Gierling and Riemann [1998] J. Gierling and K.-U. Riemann, Comparison of a consistent theory of radio frequency sheaths with step models, Journal of Applied Physics 83, 3521 (1998).
- Sobolewski [2000] M. A. Sobolewski, Sheath model for radio-frequency-biased, high-density plasmas valid for all , Phys. Rev. E 62, 8540 (2000).
- Dewan et al. [2002] M. N. A. Dewan, P. J. McNally, and P. A. F. Herbert, Plasma modeling for a nonsymmetric capacitive discharge driven by a nonsinusoidal radio frequency current, Journal of Applied Physics 91, 5604 (2002).
- Chabert and Braithwaite [2011] P. Chabert and N. Braithwaite, Physics of radio-frequency plasmas (Cambridge University Press, 2011).
- Czarnetzki [2013] U. Czarnetzki, Analytical model for the radio-frequency sheath, Phys. Rev. E 88, 063101 (2013).
- Chabert et al. [2021] P. Chabert, T. V. Tsankov, and U. Czarnetzki, Foundations of capacitive and inductive radio-frequency discharges, Plasma Sources Science and Technology 30, 024001 (2021).
- Nosenko et al. [2009] V. Nosenko, A. V. Ivlev, S. K. Zhdanov, M. Fink, and G. E. Morfill, Rotating electric fields in complex (dusty) plasmas, Phys. Plasmas 16, 083708 (2009).
- Nosenko et al. [2006] V. Nosenko, J. Goree, and A. Piel, Laser method of heating monolayer dusty plasmas, Phys. Plasmas 13, 032106 (2006).
- Nosenko et al. [2007] V. Nosenko, S. Zhdanov, and G. Morfill, Supersonic dislocations observed in a plasma crystal, Phys. Rev. Lett. 99, 025002 (2007).
- Lieberman and Lichtenberg [1994] M. A. Lieberman and A. J. Lichtenberg, Principles of plasma discharges and materials processing, edited by Wiley (Wiley, New York, 1994).
- Raizer et al. [1995] Y. P. Raizer, M. N. Shneider, and N. A. Yatsenko, Radio-Frequency Capacitive discharges, edited by C. P. LLC (CRC Press LLC, Florida, 1995).
- Song et al. [1990] Y. P. Song, D. Field, and D. F. Klemperer, Electrical potentials in RF discharges, Journal of Physics D: Applied Physics 23, 673 (1990).
- Land et al. [2009] V. Land, E. Shen, B. Smith, L. Matthews, and T. Hyde, Experimental and computational characterization of a modified GEC cell for dusty plasma experiments, New Journal of Physics 11, 063024 (2009).
- Kohlmann et al. [2019] N. Kohlmann, F. Wieben, O. H. Asnaz, D. Block, and F. Greiner, High-precision in-situ size measurements of single microparticles in an rf plasma, Physics of Plasmas 26, 053701 (2019).
- Note [1] Except when within a few Pa of the crystallisation pressure where the outer part of the monolayer has started crystallising while the centre remained melted.
- Couëdel et al. [2014] L. Couëdel, S. Zhdanov, V. Nosenko, A. V. Ivlev, H. M. Thomas, and G. E. Morfill, Synchronization of particle motion induced by mode coupling in a two-dimensional plasma crystal, Phys. Rev. E 89, 053108 (2014).
- Laut et al. [2015] I. Laut, C. Räth, S. Zhdanov, V. Nosenko, L. Couëdel, and H. M. Thomas, Synchronization of particle motion in compressed two-dimensional plasma crystals, EPL (Europhysics Letters) 110, 65001 (2015).
- Jean-Pierre Hansen [2006] I. M. Jean-Pierre Hansen, Theory of simple liquids, 3rd ed. (Elsevier / Academic Press, 2006).
- Liu et al. [2009] B. Liu, J. Goree, V. E. Fortov, A. M. Lipaev, V. I. Molotkov, O. F. Petrov, G. E. Morfill, H. M. Thomas, H. Rothermel, and A. V. Ivlev, Transverse oscillations in a single-layer dusty plasma under microgravity, Phys. Plasmas 16, 083703 (2009).
- Kryuchkov et al. [2019] N. P. Kryuchkov, L. A. Mistryukova, V. V. Brazhkin, and S. O. Yurchenko, Excitation spectra in fluids: How to analyze them properly, Scientific reports 9, 1 (2019).
- Khrapak and Couëdel [2020] S. Khrapak and L. Couëdel, Dispersion relations of yukawa fluids at weak and moderate coupling, Phys. Rev. E 102, 033207 (2020).
- Godyak and Sternberg [1990b] V. A. Godyak and N. Sternberg, Smooth plasma-sheath transition in a hydrodynamic model, IEEE Trans Plasma Sci 18, 159 (1990b).
- Moisan and Pelletier [2006] M. Moisan and J. Pelletier, Physique des plasmas collisionnels: Application aux décharges haute fréquence, edited by E. Sciences (Grenoble Sciences, Bonchamp-Lès-Laval, 2006).
- Schulze et al. [2008] J. Schulze, B. G. Heil, D. Luggenhölscher, R. P. Brinkmann, and U. Czarnetzki, Stochastic heating in asymmetric capacitively coupled RF discharges, Journal of Physics D: Applied Physics 41, 195212 (2008).
- Hause et al. [2013] M. L. Hause, B. D. Prince, and R. J. Bemish, Krypton charge exchange cross sections for hall effect thruster models, Journal of Applied Physics 113, 163301 (2013).
- Zobnin et al. [2008] A. V. Zobnin, A. D. Usachev, O. F. Petrov, and V. E. Fortov, Ion current on a small spherical attractive probe in a weakly ionized plasma with ion-neutral collisions (kinetic approach), Phys. Plasmas 15, 043705 (2008).
- Khrapak and Morfill [2009] S. Khrapak and G. Morfill, Basic processes in complex (dusty) plasmas: Charging, interactions, and ion drag force, Contributions to Plasma Physics 49, 148 (2009).
- Röcker et al. [2012a] T. B. Röcker, A. V. Ivlev, R. Kompaneets, and G. E. Morfill, Mode coupling in two-dimensional plasma crystals: Role of the wake model, Phys. Plasmas 19, 033708 (2012a).
- Meyer et al. [2017] J. K. Meyer, I. Laut, S. K. Zhdanov, V. Nosenko, and H. M. Thomas, Coupling of noncrossing wave modes in a two-dimensional plasma crystal, Phys. Rev. Lett. 119, 255001 (2017).
- Röcker et al. [2012b] T. B. Röcker, S. K. Zhdanov, A. V. Ivlev, M. Lampe, G. Joyce, and G. E. Morfill, Effective dipole moment for the mode coupling instability: Mapping of self-consistent wake models, Phys. Plasmas 19, 073708 (2012b).
- Kompaneets et al. [2016] R. Kompaneets, G. E. Morfill, and A. V. Ivlev, Wakes in complex plasmas: A self-consistent kinetic theory, Phys. Rev. E 93, 063201 (2016).