Neutron Tomography of Spent Fuel Casks
Abstract
Dry casks for spent nuclear fuel (SNF) ensure the safe storage of SNF and provide radiation shielding. However, the presence of the thick casks encompassing several layers of steel and concrete makes inspection of the SNF a challenging task. Fast neutron interrogation is a viable method for the nondestructive assay of dry storage casks. In this study, we performed a Monte Carlo simulation-based study associated with a machine-learning-based image reconstruction method to verify the content of SNF dry storage casks. We studied the use of neutron transmission and back-scattered measurements to assess the potential damage to fuel assemblies or fuel pin diversion during transportation of dry casks. We used Geant4 to model a realistic HI-STAR 100 cask, MPC-68 canister and basket, and GE-14 fuel assembly irradiated by a D-T neutron generator. Several bundle diversion scenarios were simulated. The angular distribution of the neutrons scattered by the cask was used to identify the diversions inside the fuel cask. A fuel bundle with at least 75% of its pins removed can be identified with a drop in the back-scattered signature larger than compared with a fully loaded scenario. We combined an iterative reconstruction algorithm with a convolutional neural network (CNN) to obtain a cross-sectional image of the fuel inside the cask. The proposed imaging approach allows locating the position of a missing fuel bundle with at least 75% of the pins removed when performing tomographic imaging of a canister with an overall scan time of less than two hours, when using a commercial neutron generator with a source strength of n/s in the 4 solid angle.
keywords:
Neutron tomography, Spent nuclear fuel, Dry cask storage, Nondestructive assay, Fast Iterative Shrinkage-Thresholding Algorithm1 Introduction
Spent nuclear fuel (SNF) bundles can be stored in water pools, dry storage and transport casks, and vault-type storage facilities [1]. By the end of 2020, there are 94 operating commercial nuclear reactors in the United States. Most of water pools at reactor sites have almost reached their full capacity [2]. When the capacity of the water pool is reached or there is a need to transfer SNF to an away-from-reactor (AFR) reprocessing plant or a long-term storage site, the SNF is removed from the water pool and loaded into the interim dry storage cask or transfer cask before transportation. Therefore, the application of the dry cask storage and transport service is becoming more and more important with the increasing need to transfer SNF bundles from an at-reactor (AR) pool to an AFR storage [3]. Verifying the integrity of the SNF without reopening the sealed containers or dry casks is an open technological challenge.
Continuity of knowledge (CoK) to ensure that the information on spent fuel is uninterrupted and authentic [4] is typically ensured using seals and visual observation. However, some cases may require reestablishment of inventory after the loss of CoK. Currently, there are no generally accepted or fully verified methods to reestablish the CoK without reopening the dry casks. Therefore, a reliable method to non-destructively assay SNF casks and verify their content and integrity is needed.
There have been several approaches proposed for the verification and detection of SNF dry casks. These approaches are mostly simulation-based studies and some have been extended to experimental verification. Scientists at Idaho National Laboratory (INL) developed the Compton Dry-Cask Imaging Scanner (CDCIS) which identified the presence of SNF based on passive gamma rays emitted by SNF [5]. The CDCIS failed when tested at Doel, Belgium nuclear power plant due to the thick ballistic shield on top of the Belgian cask [5]. Cosmic-ray muon computed tomography is another technique that has been both theoretically and experimentally evaluated. Researchers from Los Alamos National Laboratory (LANL) and the University of New Mexico applied filtered back projection to reconstruct images using muon scattering and attenuation signatures, respectively [6]. Researchers from LANL, the University of New Mexico, and INL measured MC-10 cask using cosmic-ray muon computed tomography [7]. Researchers from Oak Ridge National Laboratory conducted a study to image the dry storage casks using a simple Point of Closest Approach (PoCA) algorithm with muons [8][9]. Other approaches include using Thomson-scattering quasi-monoenergetic photon sources on a MC-10 cask that can be applied to MPC-24, MPC-32 and MPC-68 casks [10], using high-energy X-ray computed tomography [11]as well as high-energy neutron transmission analysis [2]. Among these proposed verification methods, the most promising one seems to be the cosmic-ray muon tomography method. However, it requires a long inspection time of more than one day and thus it cannot be used to verify the cask’s integrity in case of an accident occurring during transportation.
In this paper, we present a method based on 14.1-MeV neutron tomography. This method aims at identifying potential fuel diversion scenarios. We exploit the penetrating power of 14.1 MeV DT neutrons together with reconstruction algorithms to improve the method’s sensitivity. First, we studied the sensitivity of the inspection method to missing assemblies. We studied the signatures that showed the highest correlations with the missing SNF assembly. Then, we used the identified signatures to carry out the neutron tomography technique and obtain the reconstructed cross-sectional images of the canister. The results showed that for an inspection consisting of 12 scans, the total measurement time is less than 2 hours considering an intrinsic detector efficiency of 60%.
2 Methods
We simulated a realistic dry cask system, which consists of a HI-STAR-100 cask, MPC-68 canister and basket, and GE-14 fuel assembly using Geant4 toolkit [12]. In this section, we introduce the simulated geometry of the cask and the computational methods used to locate missing fuel bundles. We simulated various fuel assembly diversion scenarios and obtained the neutron back-scattered signature that is related with the missing bundle locations. We used the neutron back-scattered signature and a bi-dimensional image reconstruction algorithm and a CNN model to obtain reconstructed images of the spent fuel assemblies.
2.1 Spent fuel dry cask model
The cask overpack is a thick layer of stainless steel and has an additional neutron-absorbing layer made of Holtite-A alongside the sidewall. The overall height of the cask overpack is over 5 m and its maximum diameter is approximately 2.5 m.
The canister and basket can hold 68 boiling water reactor (BWR) fuel assemblies. Each assembly encompasses 92 SNF rods arranged in a 1010 square matrix. The assembly contains two water rods at the center, each occupying four-pin locations, and seventy full-length fuel rods, fourteen part-length fuel rods as well as eight tie rods. The full-length fuel rods are approx. 400 cm long, with approx. 380 cm of fuel pellets (the remaining length includes a plenum region and the connecting shanks), whereas the part-length fuel rods are approx. 250-cm long, with approx. 213 cm of fuel pellets [13]. The tie rods are screwed into the lower tie plate and are used to support the assembly during the operation of the fuel handling process [13].
2.2 Geant4 model and simulation setup
We used the Geant4 toolkit to simulate the dry cask system [14] and the interrogating source. The physics list used in the Geant4 model was the QGSP_BERT_HP, which provides high-precision neutron transport simulation at energies below 20 MeV. The source term was simulated as a 14.1-MeV mono-energetic neutron beam. It was placed at the mid-plane of the cask targeting at the side surface. This energy corresponds to the energy of the neutrons produced by a Deuterium-Tritium (D-T) generator. The D-T generator produces 14.1 MeV neutrons through the following fusion reaction between deuteron ions (D) and tritium ions (T): [15]. The neutron carries 80% (i.e., ) of the released energy.
The visualization of the Geant4 model is shown in Fig. 1. Fig. 1(b) shows the realistic layout of the dry cask system, including the neutron absorbing shielding layer, cask overpack, canister, fuel basket structures (honeycomb structure and neutron absorbing panel) and supports, as well as fuel bundles (fuel rods, water rods and tie rods). The orientation of the inner fuel assembly deployment is known on the outside of the dry cask sidewall. The outermost layer shown in blue is the neutron shield layer of the cask. In the image reconstruction analysis, we removed both the neutron shield and the cask and kept only the canister. During specific stages of the SNF bundles’ transfer, such as moving the SNF from the water pool into the transfer cask or from the transfer cask to the final storage place, the SNF could be contained only in the canister and not surrounded by the thick metal cask and the neutron shield. Hence, the nondestructive assay (NDA) of the assemblies without neutron shield can be performed during these transfer procedures.
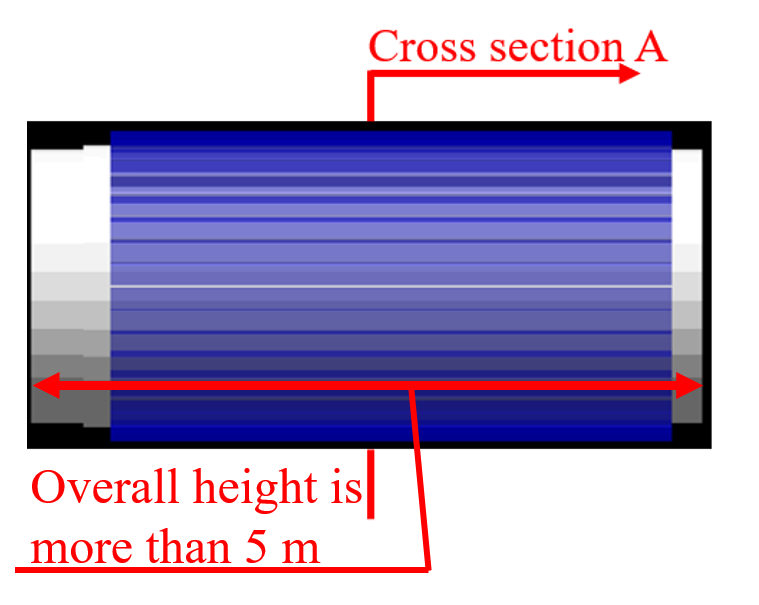
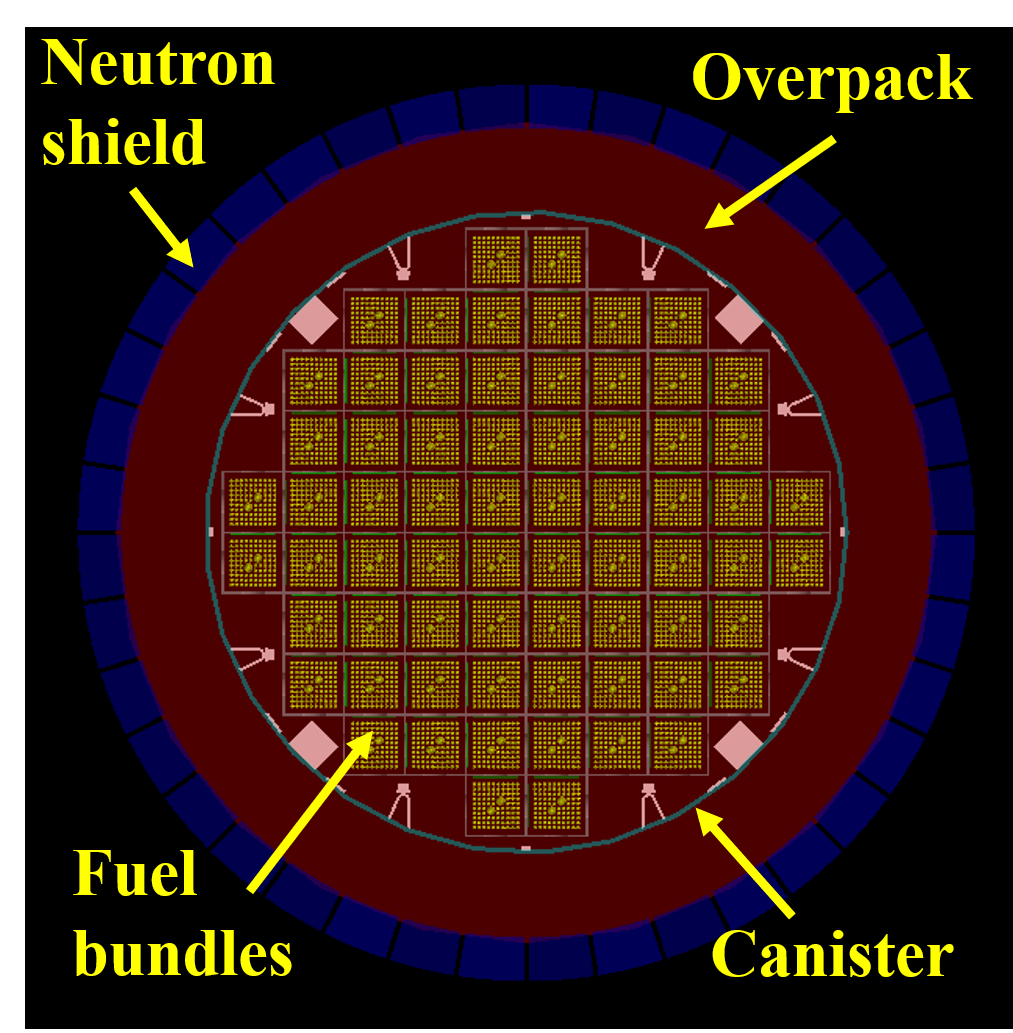
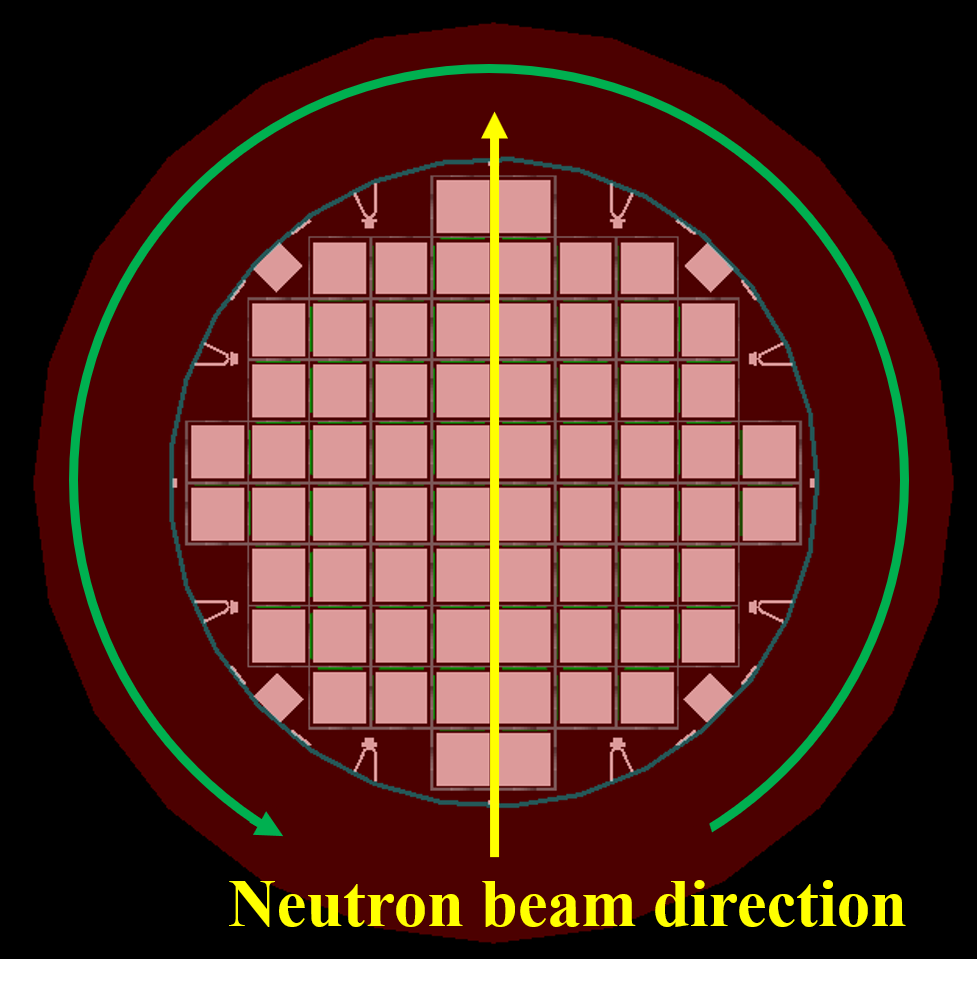
Fig. 1(a) and Fig. 1(b) show a detailed schematic of the SNF within the cask. We developed a simplified model with homogenized fuel assembly as shown in Fig. 1(c) to reduce simulation run-time while keeping a realistic fuel composition. The structure, compositions and layout of the simplified model are analogous to the original realistic model. The only difference between the two models is that in the homogenized composition of the fuel assembly, each assembly is modeled as a bulk volume without the geometric detail of single fuel pins. The fuel pellets are composed of ceramic uranium dioxide and gadolinium oxide. In the simplified model, the fuel assembly contains a mixture of the same material compositions distributed evenly throughout the whole assembly volume and therefore with an overall density of 3.98 . While yielding similar results in terms of neutron scattered and transmitted distribution, the run-time of the simplified model is approximately eight times faster than the detailed model.
2.3 Neutron back-scattered and transmitted signatures
We identified signatures that were highly correlated to the presence of SNF assemblies, while being minimally affected by the neutron attenuation. Inspection of spent-fuel cask is challenging because of the limited penetrability, even of high energy 14.1 MeV neutrons. The half-value layer (HVL) exerted by spent fuel to neutrons is 3.272 cm. With each fuel rod’s diameter equal to approx. 1 cm [13], we can expect the intensity of the beam to be reduced to less than 50% by only four fuel rods. The strong attenuation caused by the fuel assemblies will dramatically reduce the probability of detection neutrons transmitted through the canister. We identified high-efficiency, information-rich features to address this challenge. The combination of back-scattered and transmitted neutrons was used to identify the defects in the fuel assemblies.
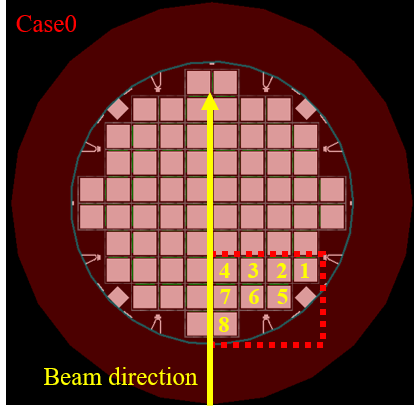
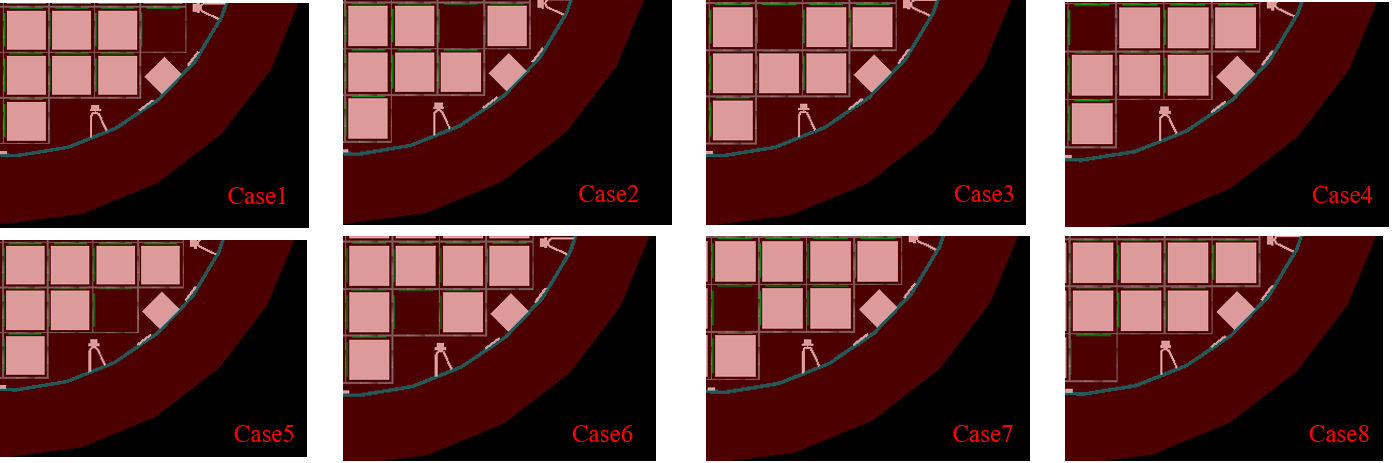
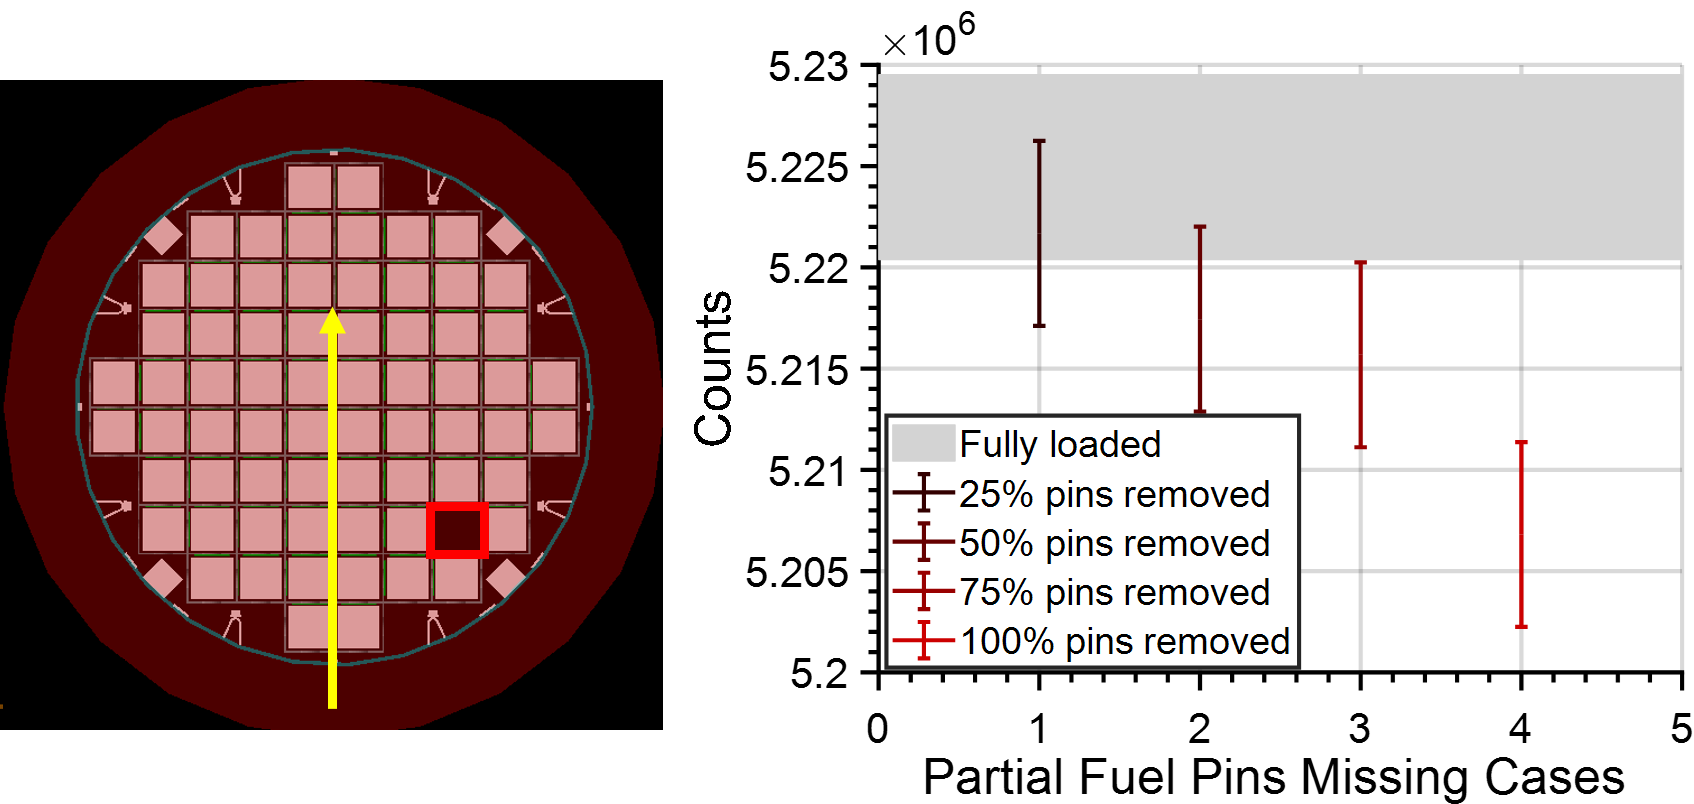
We detected the neutrons emerging from the surface of the dry cask under several fuel assembly mis-loading scenarios. All neutrons that incident into the detectors are contributing to the gross neutron counts. We consider using organic scintillation detectors when estimating the actual measurement time and assume the intrinsic detection efficiency to be 60%. Since the fuel assembly layout is symmetric, we simulated one-quarter of the cask highlighted in Fig. 2 within the dashed red rectangle box. The neutron beam was simulated as conical for variance reduction, and the yellow arrow in Fig. 2 represents the neutron beam direction. We simulated eight fuel assembly anomalous scenarios and compared the corresponding results with that of a fully-loaded cask (referred to as Case0). In each anomalous scenario, we removed one fuel assembly. These scenarios are illustrated in Fig. 3.
2.4 Bi-dimensional image reconstruction through iterative algorithm
Spent fuel verification procedures are generally verification-based, where a previous measurement of the item is compared to the current one to ensure CoK. This procedure would greatly benefit from an imaging approach, which is more informative compared to a gross counting measurement performed outside the cask. After simulating the correlation of the back-scattered signature, as reported in Section 2.3, we developed an imaging method to locate the missing bundles in a 2D cross-sectional view of the fuel region. We assumed the model of the fuel bundles as a linear forward model. The linearity assumption is based on the fact that neutrons resulting from fission reactions can be neglected and therefore the problem is similar to an X-ray tomography where the attenuation coefficient is replaced by the neutron removal macroscopic cross section. Traditional image reconstruction methods such as filtered back projection (FBP) derive the attenuation of radiation through an object from the length of the radiation path. FBP uses the estimated linear attenuation coefficient to form the attenuation profiles, then reconstructs images of the object through inverse Radon transform with mathematical filters applied to remove the blur from back-projection. However, due to the shielding effect of the fuel assemblies, this method needs a long measurement time to obtain transmitted signals that enable satisfactory imaging. We used instead a linear-inverse approach solved through a sparsity-promoting algorithm, proven to yield improved imaging performance when compared to FBP [16]. The distribution of fuel assemblies inside the canister can be considered as a sparse matrix if we treat the location of the missing fuel rods as 1 and other locations 0. The image reconstruction with sparse data can be achieved by solving a regularized linear inverse problem using the fast-iterative shrinkage-thresholding algorithm (FISTA) [17].
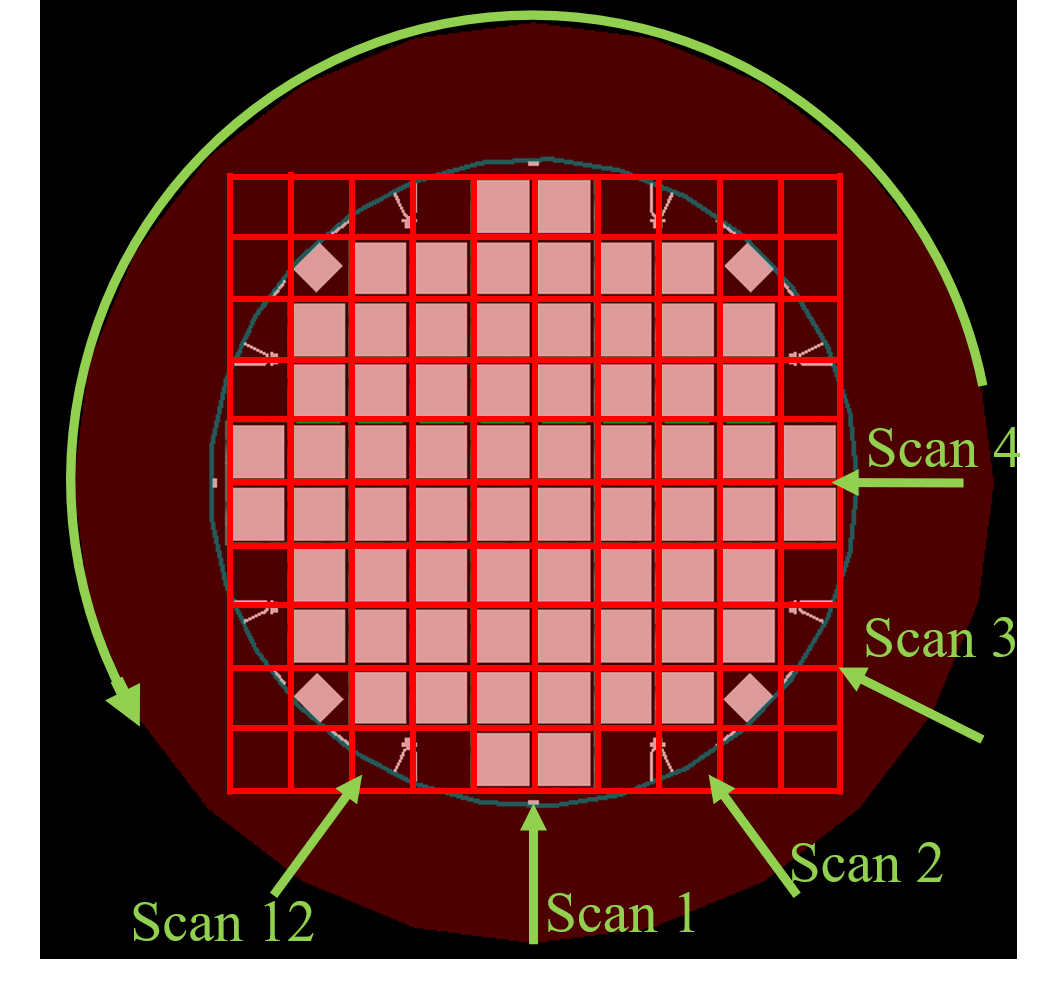
In the inspection of the dry cask, we discretized the region-of-interest (ROI) of the fuel assembly into pixels as shown in Fig. 4, where in this example. Then, we performed the NDA at 12 angles around the cask, 30o apart from each other (Fig. 4). The selected number of scans is a trade-off between minimizing the relative uncertainty associated with the measurement at each angle while keeping the measurement within a reasonable time frame. In each configuration, we removed one assembly from the fully-loaded canister and measured the back-scattered neutrons within the selected 36 detection regions (starting from the neutron beam travelling direction, each detection region occupies detection angles and thus the surface of detection angles is divided into 36 detection regions). We obtained a readout with entries for each missing fuel assembly scenario, where 36 is the number of detection regions. Therefore, the response matrix of the system is a matrix, with the column () being the readout of the system for the canister with the fuel portion corresponding to the pixel removed. We assume the system to be linear, i.e., the readout of the canister with unknown fuel assembly removed is a linear function of the true fuel assembly distribution :
| (1) |
where stands for the random observation noise.
Here the noise term is modeled by Gaussian random noise and the unknown fuel assembly distribution is estimated by solving the following penalized least-square problem, subject to the constraint that cannot be negative:
| (2) |
In Eq. 2, denotes the norm. The first term in the function is a quadratic data fidelity term and the second term is a regularization parameter. provides a trade-off between fidelity to the measurements and noise sensitivity. This regularization parameter promotes solutions where is sparse. This equation can be solved using the FISTA algorithm, as detailed the following steps.
FISTA with constant step size [17]:
Input: : The Lipschitz constant of (depending on noise level).
Procedure:
-
1.
Set the initial values:
, , and
-
2.
When is satisfied, the algorithm will do an iteration until is reached with the following equations:
(3) (4) (5) (6)
Output: .
It will finally return the value , i.e., the reconstructed image, when the set total number of iterations is reached.
The number of maximum iterations is determined based on the SNR of the reconstructed images and also the norm of .
2.5 Bi-dimensional Image Reconstruction through Machine Learning
Neural networks have been used in nuclear engineering for multiple applications, ranging from data mining [18] to radiation detection [19].
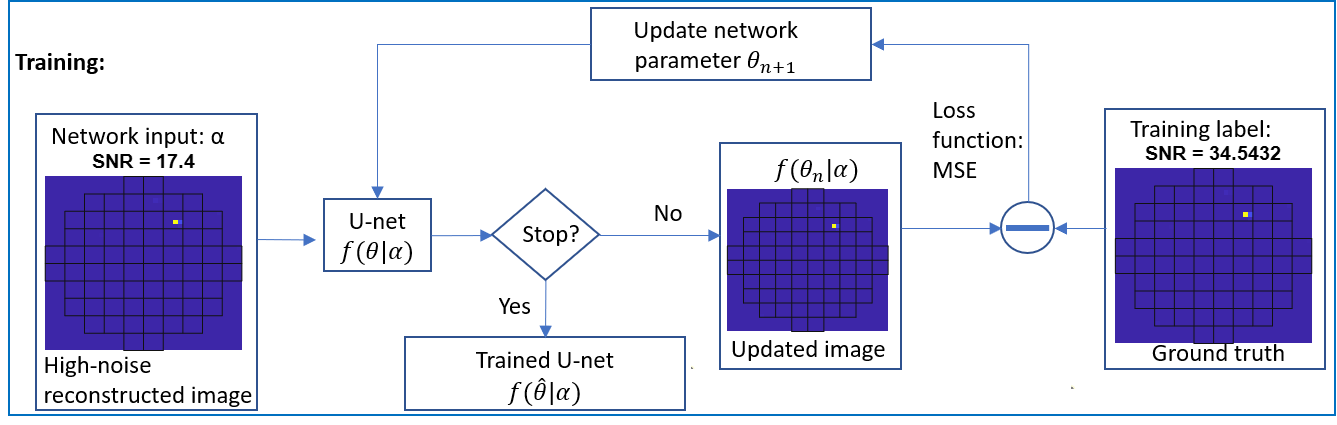
We applied a CNN model to de-noise the reconstructed images obtained from FISTA to improve the image quality. Fig. 5 shows the training process of the proposed CNN model. The CNN model is based on the 2D-Unet neural network and is pre-trained using the reconstructed images from FISTA. We use high-quality images as the training label and low-quality images as the network input. The high-quality images were generated using simulated data with low relative uncertainty of counts, and the low-quality images were generated using simulated data with few source neutrons, resulting in a high relative uncertainty of counts. The mean squared error between the network output and the training label was used a loss function of the CNN model and minimized during the training process. Based on the FISTA algorithm, the image size of the CNN input is determined as . The CNN featured four convolutional layers, a convolutional filter and a unit batch size. The number of training epochs that minimized the loss function was selected.
3 Results
3.1 Analysis of neutron back-scattered signature
We detected neutrons in the range emerging from the surface of the canister and analyzed the sensitivity of the gross neutron count to missing fuel rods and whole assemblies as a function of the angle with respect to the interrogating beam axis.
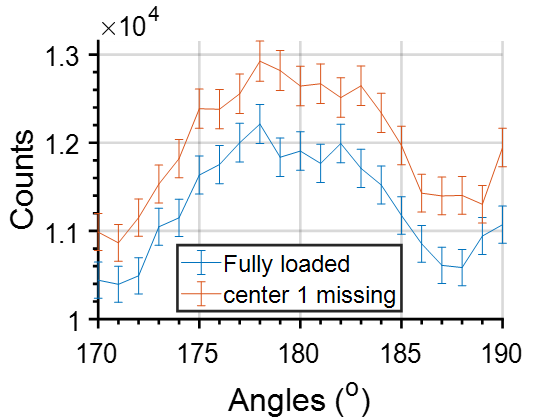
Fig. 6 shows the neutron counts in the - interval. The grey bar represents the counts detected from the fully loaded case (Case0) with an uncertainty of . The other eight data points indicate the counts of neutrons for the above-mentioned assembly missing cases (Case1-Case8) with an uncertainty of . Fig. 6 shows that the neutron counts reaching the surface of the canister may change significantly with the number and position of the missing assemblies when compared to the fully loaded case. This signature can be used in the identification of the mis-loaded SNF assemblies.
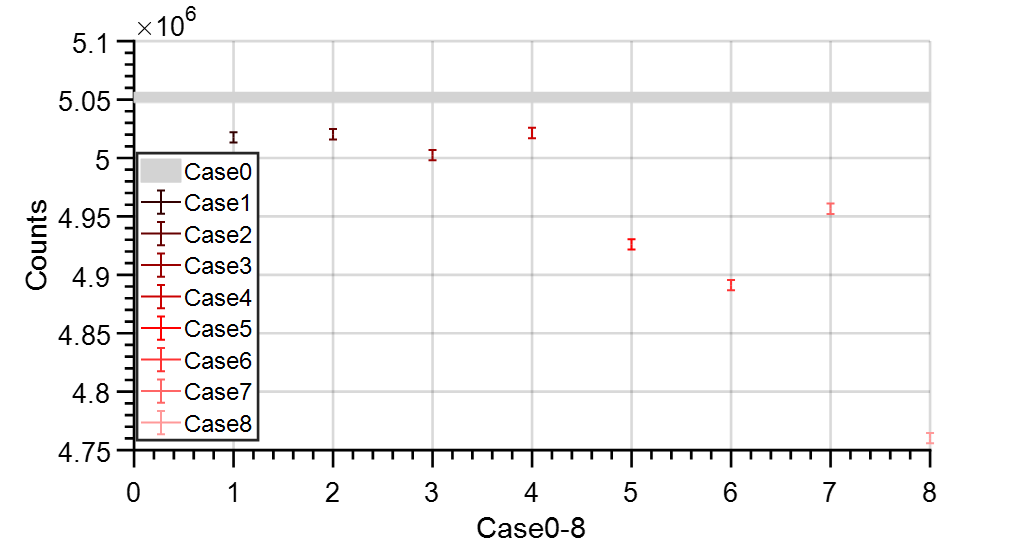
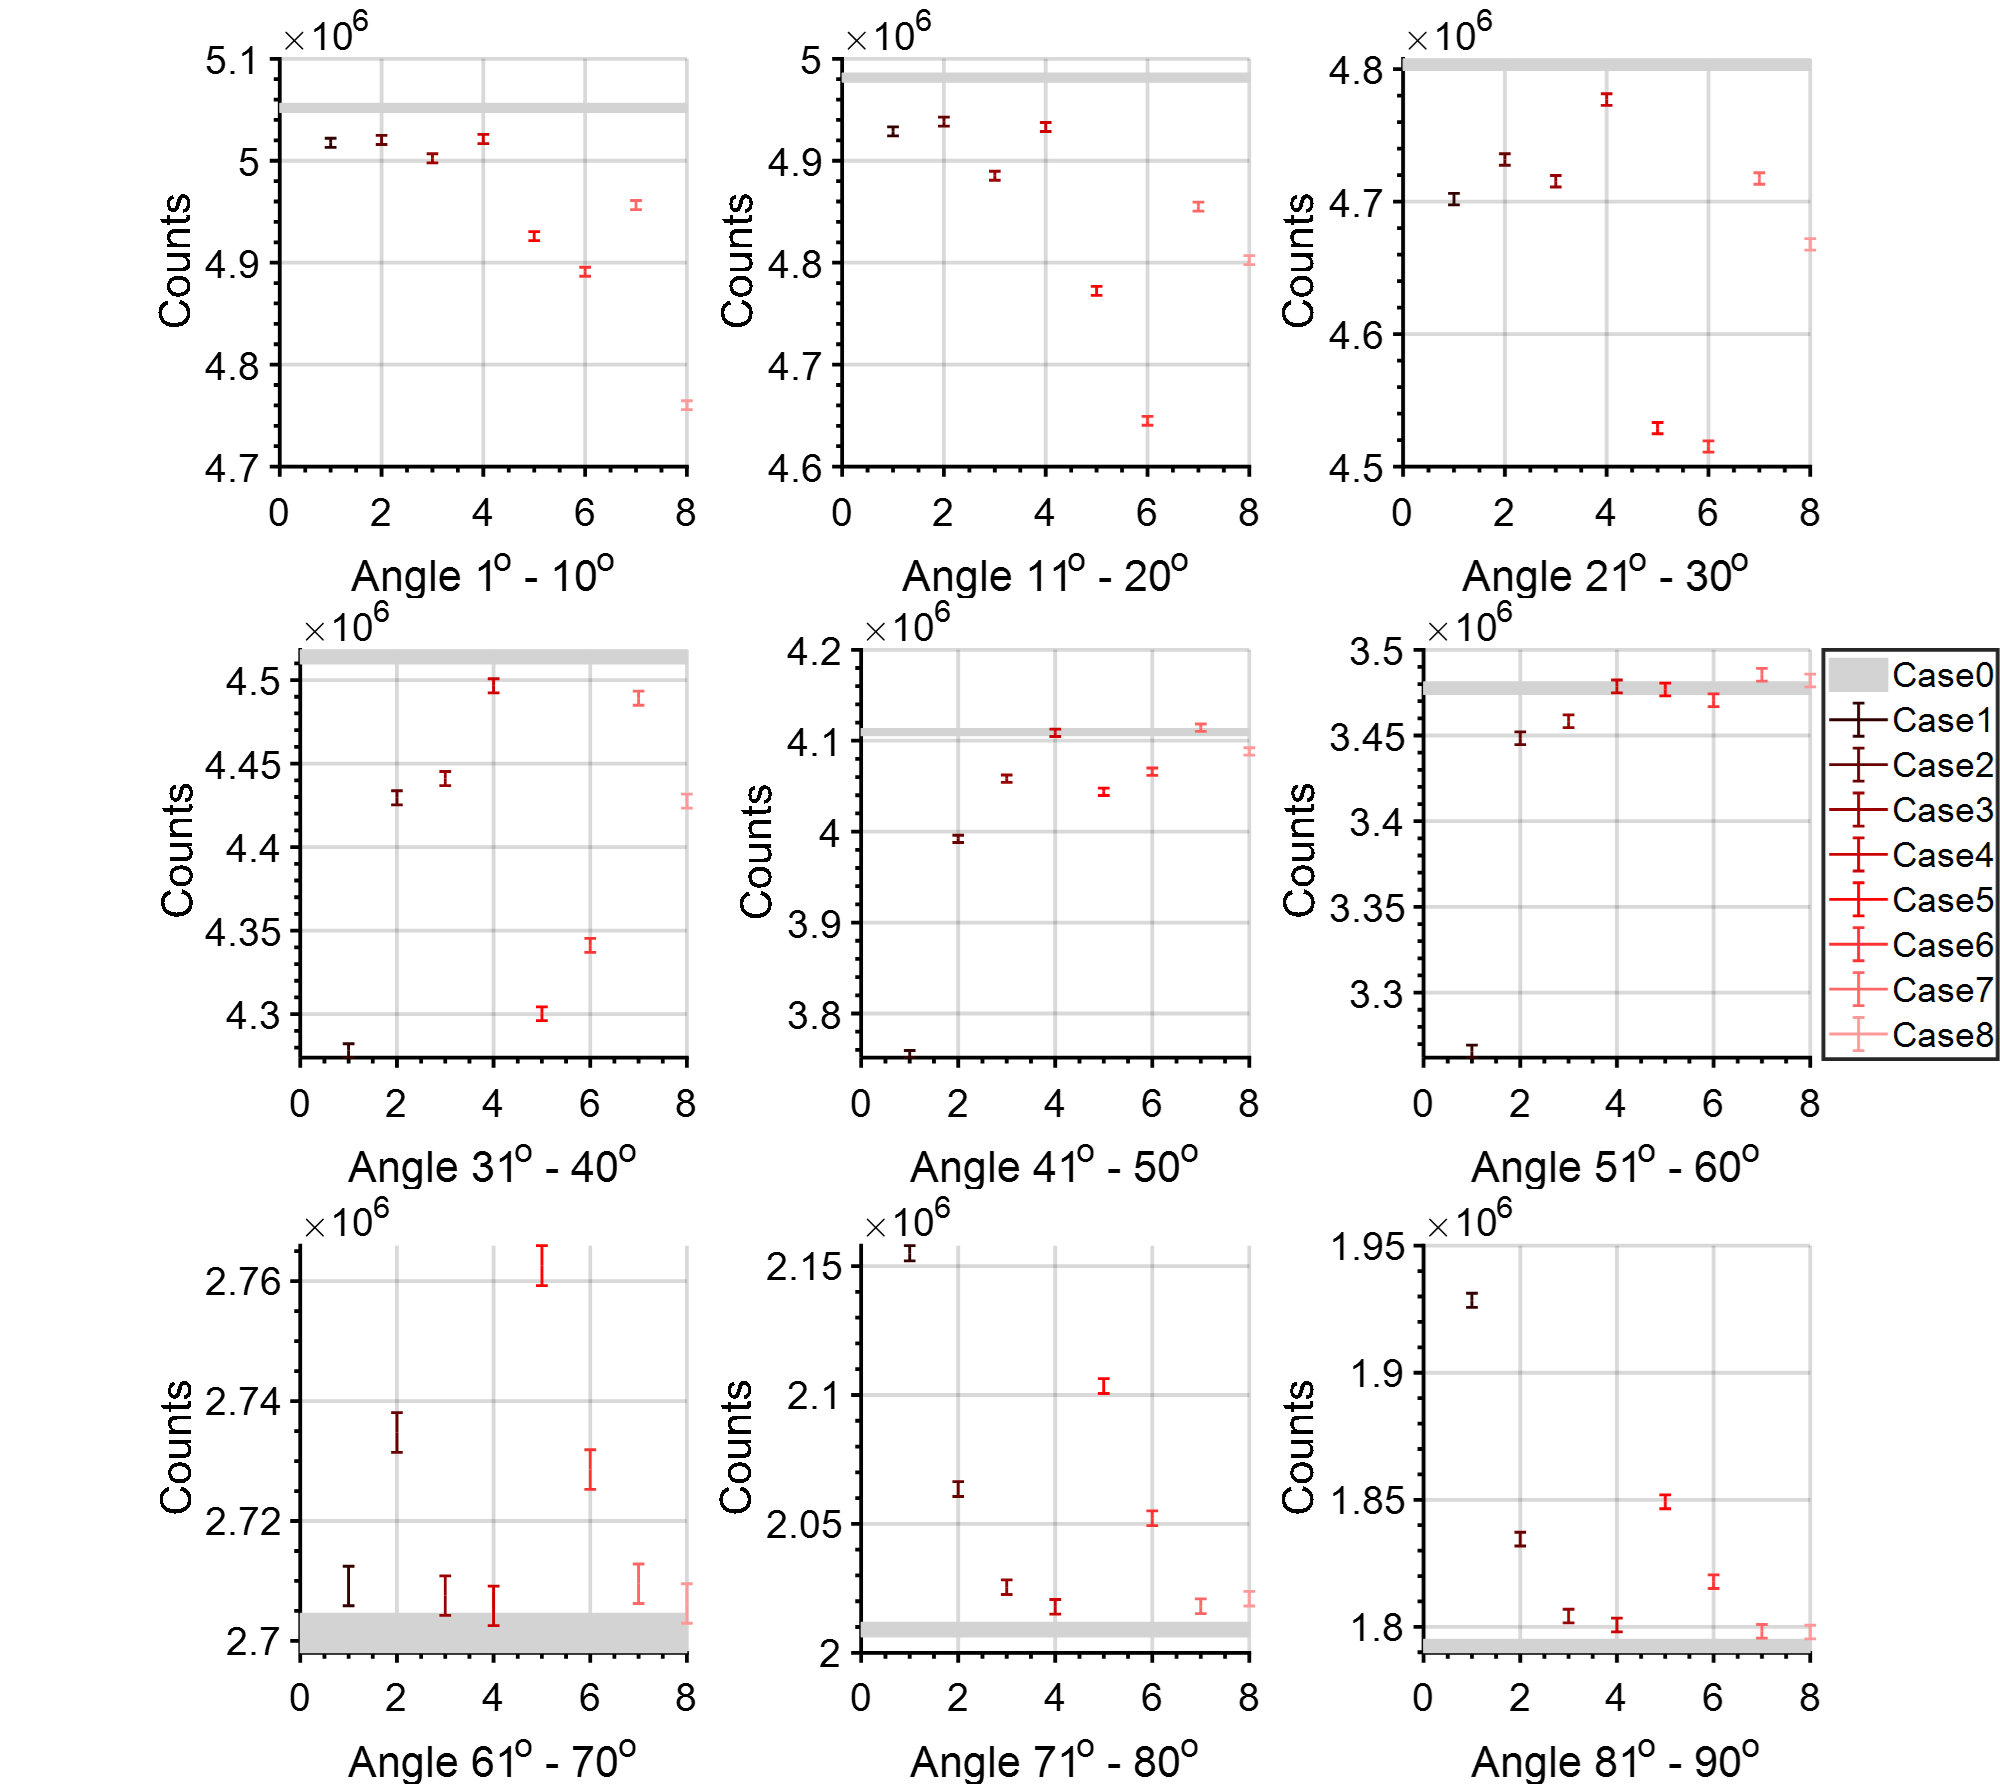
Fig. 7 shows the variation of the neutron angular distribution with the position of the mis-loaded assembly. The angular distribution of the neutron counts for various assembly missing cases shows that there is a statistically significant drop () of the counts compared to the fully loaded case, i.e. Case0, at the - angle with respect to the neutron beam direction, for all the investigated assembly missing cases.
We also performed the simulation with 25%, 50%, 75%, and 100% (i.e., one whole fuel assembly removed from the canister) fuel rods removed to study the sensitivity of our method to the scenarios where some of the fuel rods are removed within one fuel assembly. Fig. 8 shows the comparison of neutron counts with different partially loaded configurations for Case2. The grey bar represents the neutron counts of the fully-loaded case with an uncertainty of . From the results, we can identify with a confidence of a partially loaded fuel assembly with a fraction of at least 75% of the rods being removed.
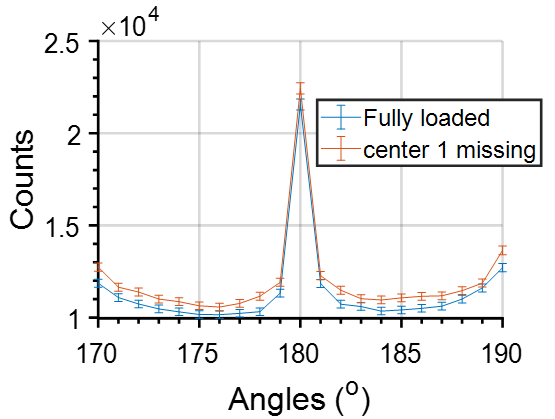
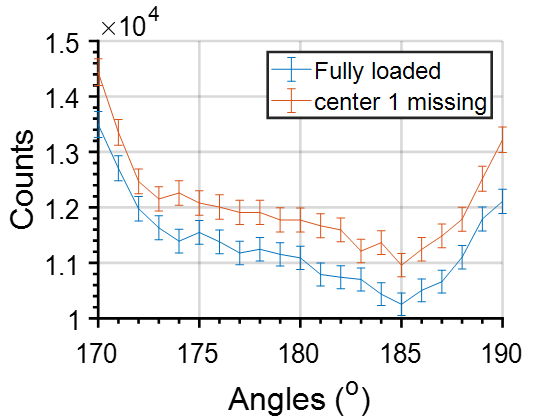
The transmitted neutron signature is shown in Fig. 9. One can observe a significant difference in the neutron distribution between the single fuel assembly missing at the center region and the fully loaded cases, with an uncertainty of . The transmitted neutron signature can thus be used to inspect innermost bundles. However, an interrogating neutron fluence at least one order of magnitude higher (for example, ) is needed to obtain statistically significant results, compared to the analysis based on the back-scattered neutron signature.
3.2 Image reconstruction
3.2.1 Results from FISTA
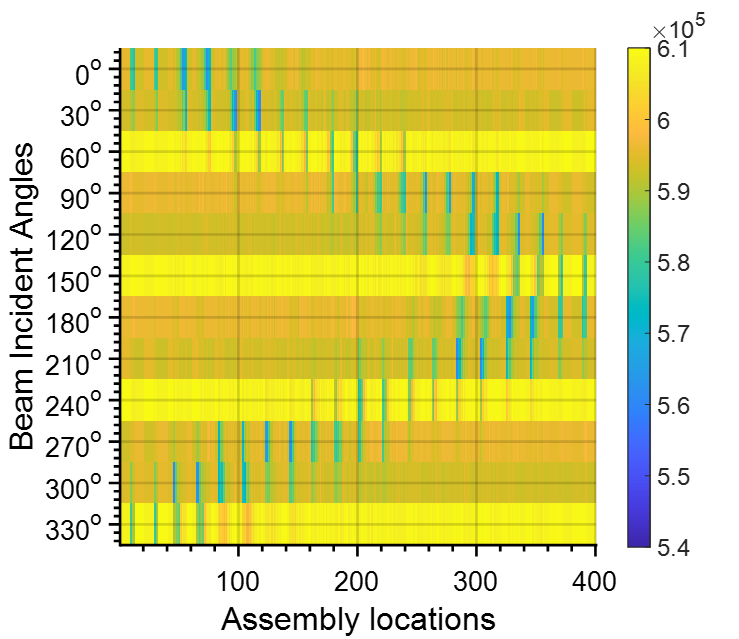
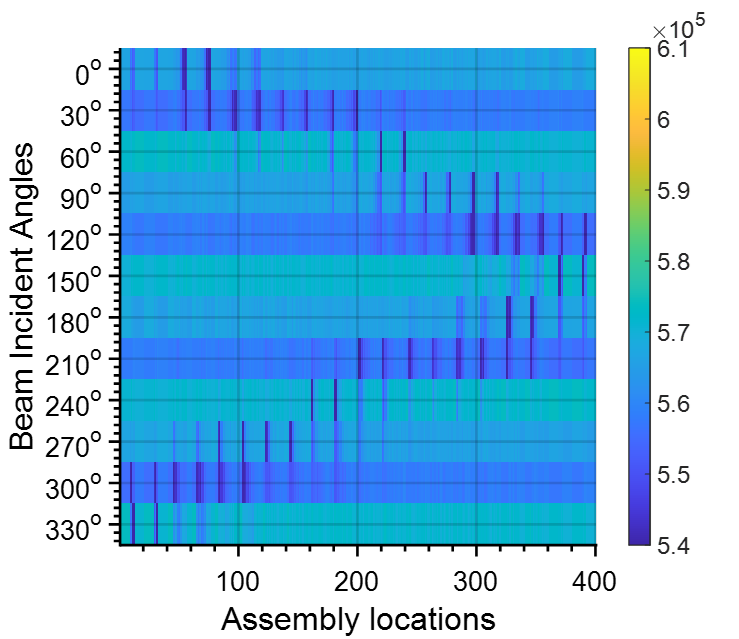
We used the Geant4 model to generate the response matrix, hence accurately capturing the neutron transport physics in the canister. Simulated and noise-corrupted casks with various configurations of missing fuel bundles were used to test the reconstruction algorithm. We defined a finer response matrix with to improve the sensitivity of the reconstruction algorithm. The dimension of the finer response matrix is , with each pixel representing the system response to one-fourth fuel assembly removed from the canister. Fig. 10a and b show the simulated fine response matrix for detection angles in the - and - intervals, respectively, where the interrogating beam rotated around the cask in intervals (y axis). The color bar shows the intensity of each pixel in a linear scale. From the response matrix, the intensity of the corresponding pixel drops as expected when a fuel assembly is removed.
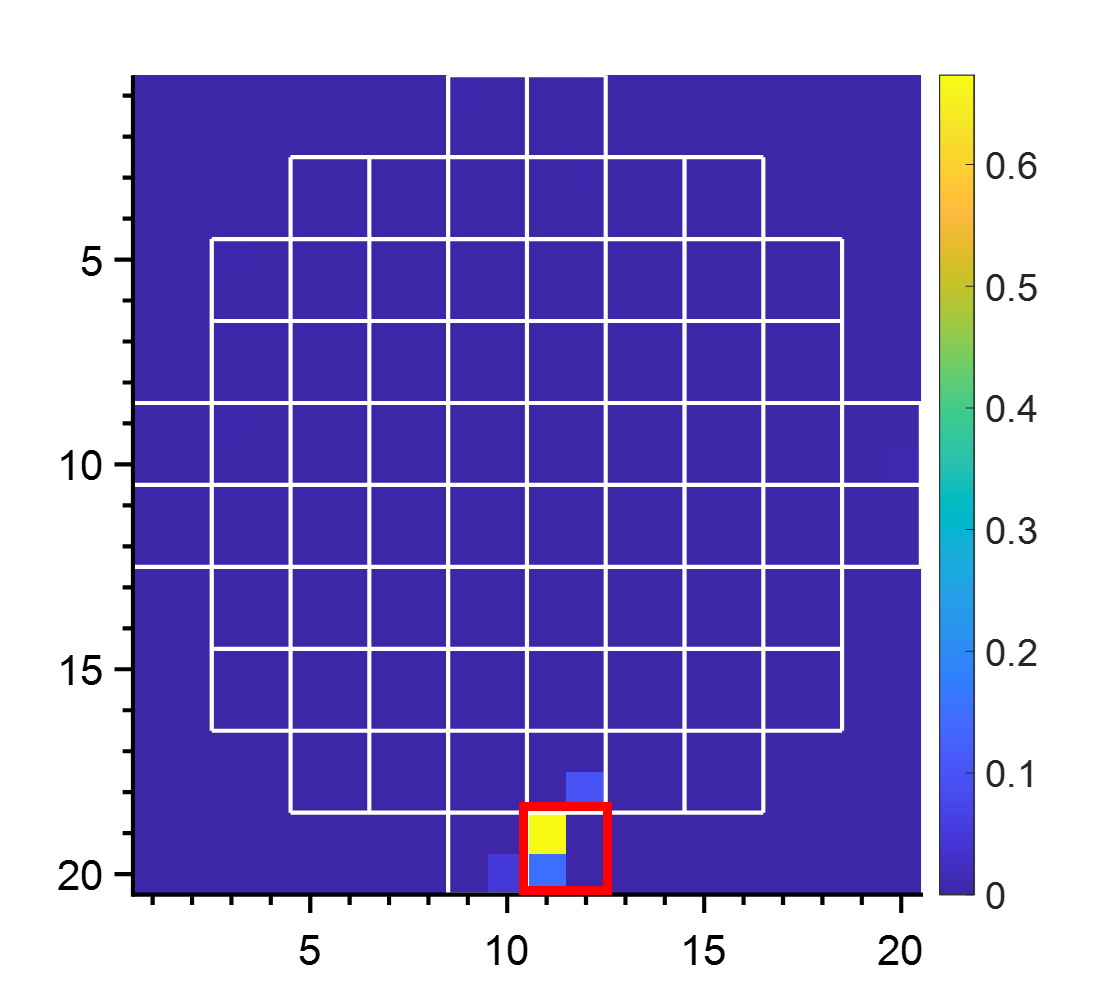
The noise associated with the measured data is due to statistical and systematical noise sources. While statistical noise depends mainly on the number of acquired counts, systematical noise sources may range from detector gain drift to bias in the source position. In our simulated model, we only considered the statistical random noise. Hence, the noise level decreases with the measurement time. With a measurement time less than for one scan, we expect an average relative uncertainty associated with the counts at the detectors less than (1 SD). When the noise level is low (measurement time per scanning angle), we can obtain well-reconstructed images that allow to accurately identify the location of the missing fuel assemblies, as shown in Fig. 11. We reconstructed several cases with one missing fuel assembly, at different locations. We simulated five cases named as Case-A1 to Case-A5, as shown in Fig. 11. The pixel with the highest intensity corresponds to the identified assembly location by the algorithm. In these five cases, the missing fuel assembly is always correctly located, despite of its location.
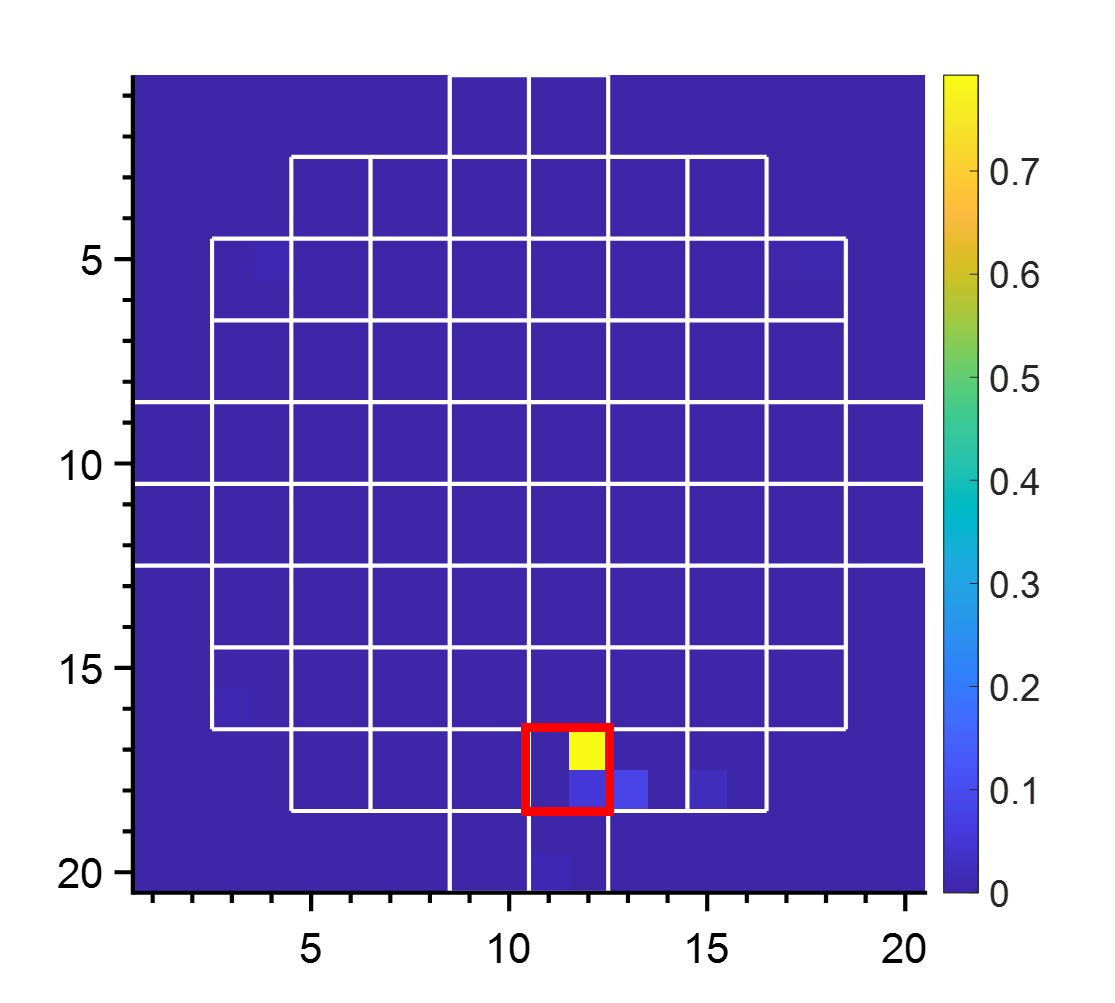
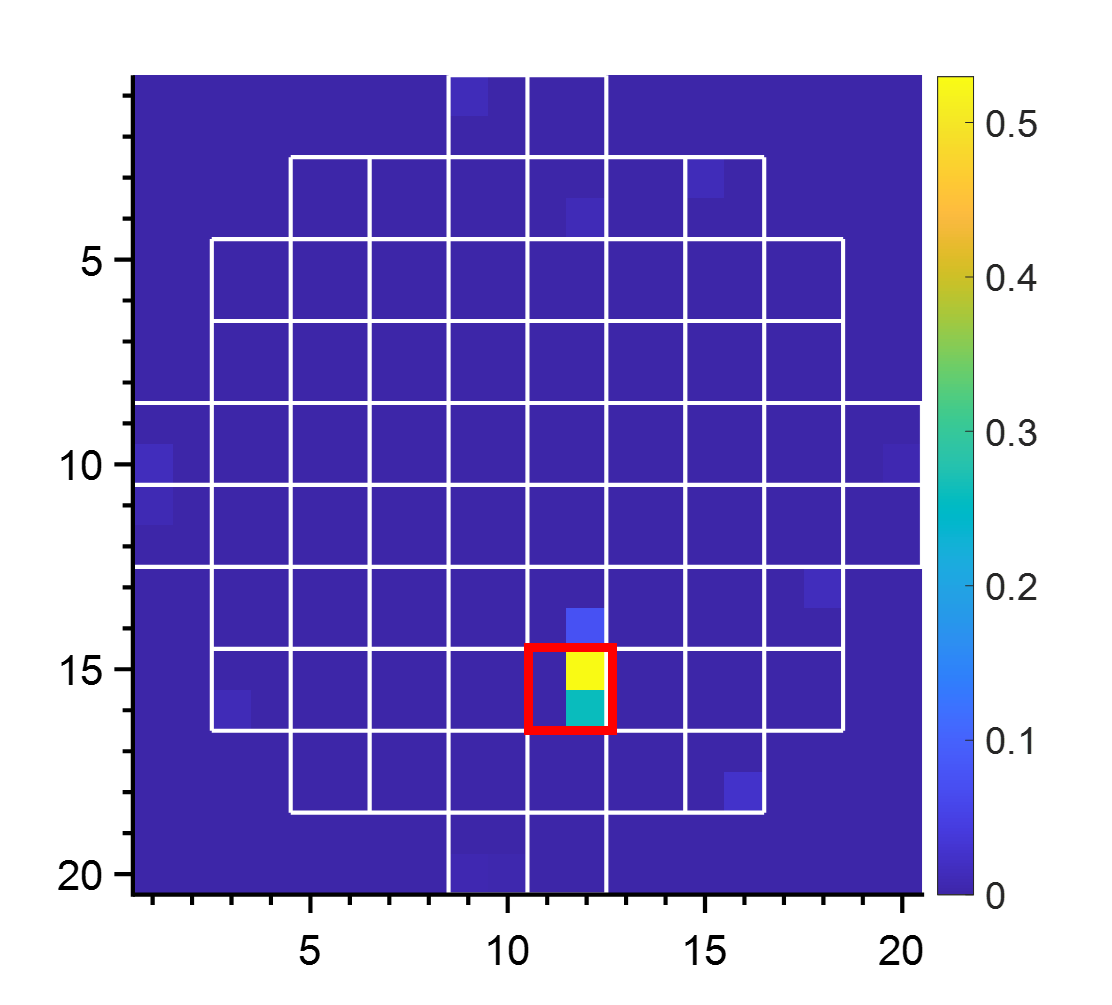
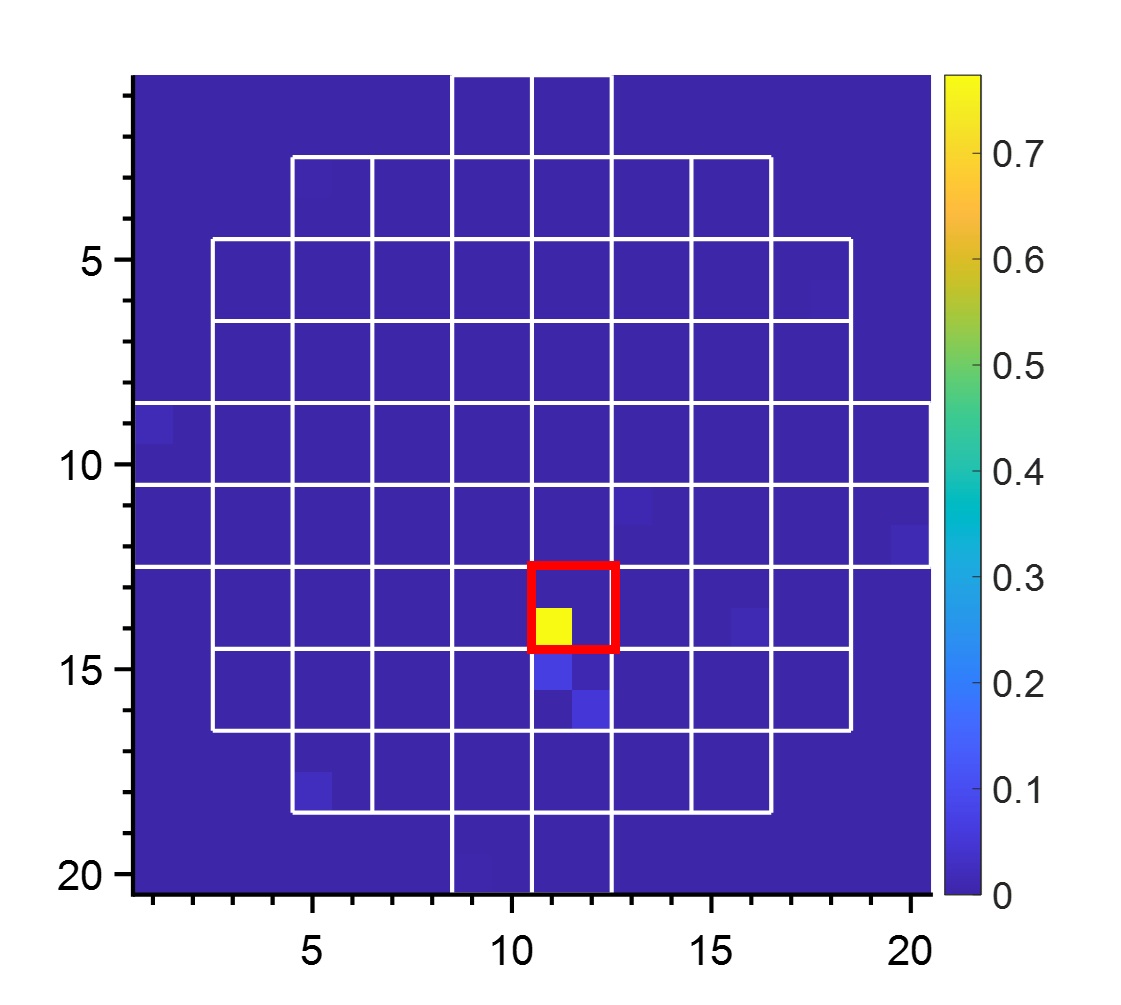
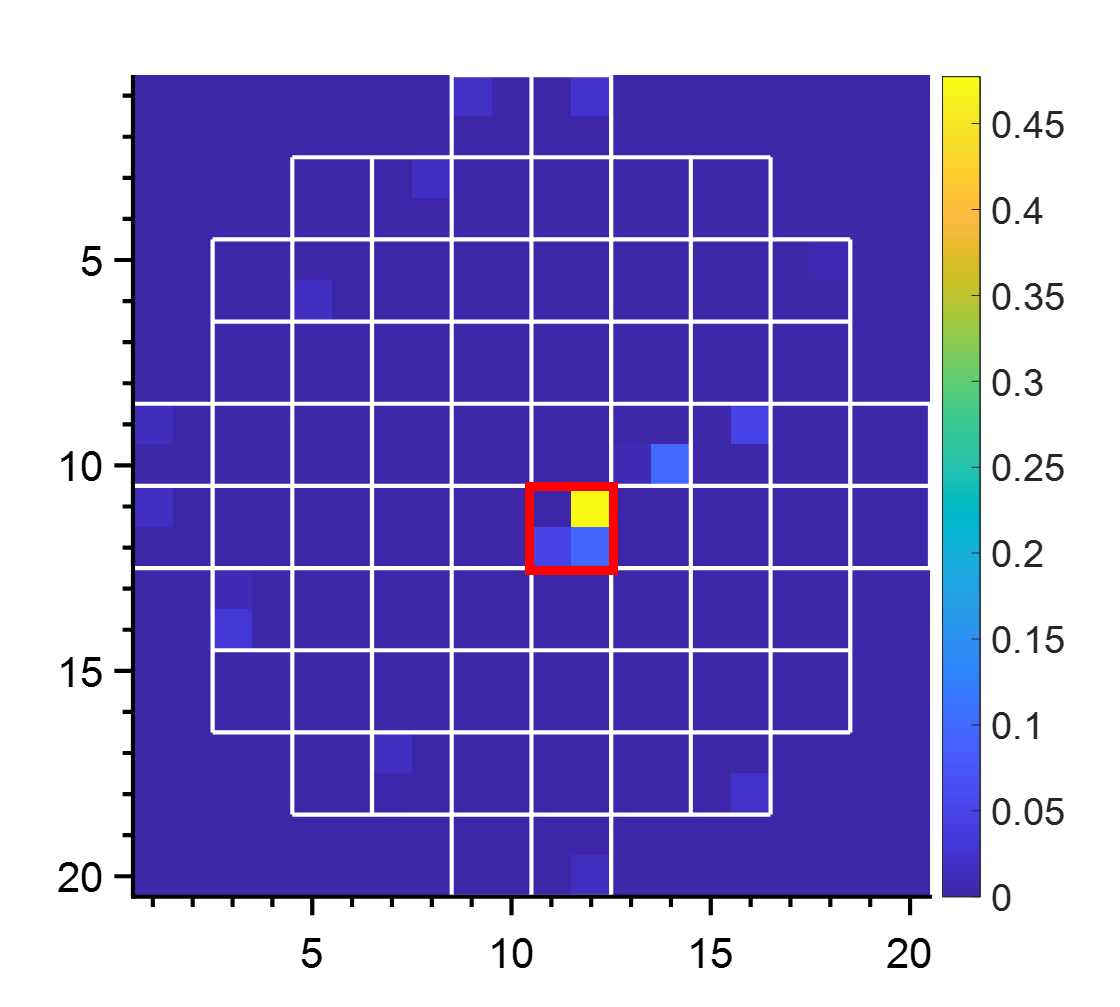
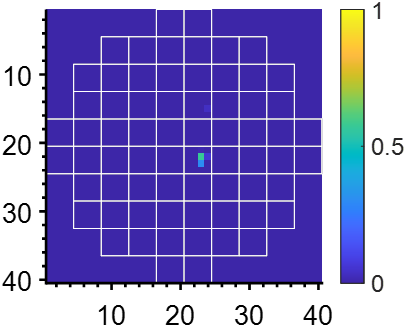
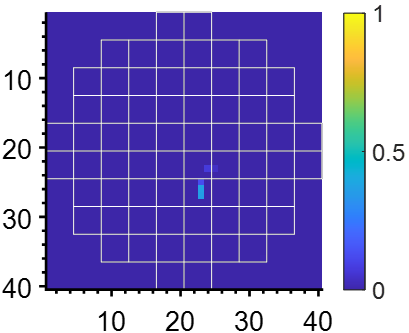
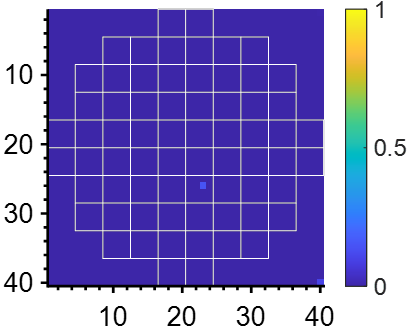
We then reconstructed four cases with of pins removed in one fuel assembly, located along the cask diagonal to investigate the penetrability of the NDA method. The reconstructed images are shown in Fig. 12.
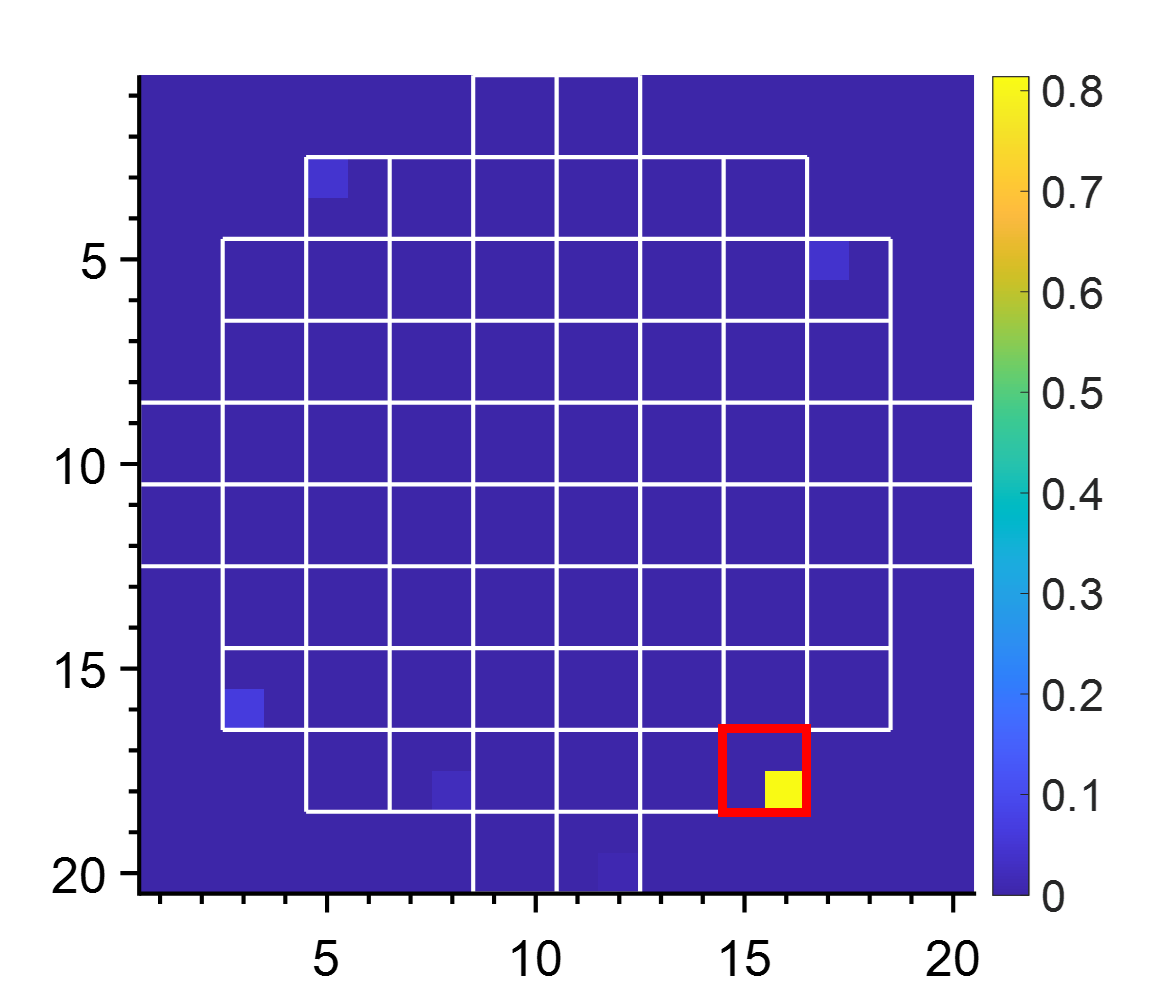
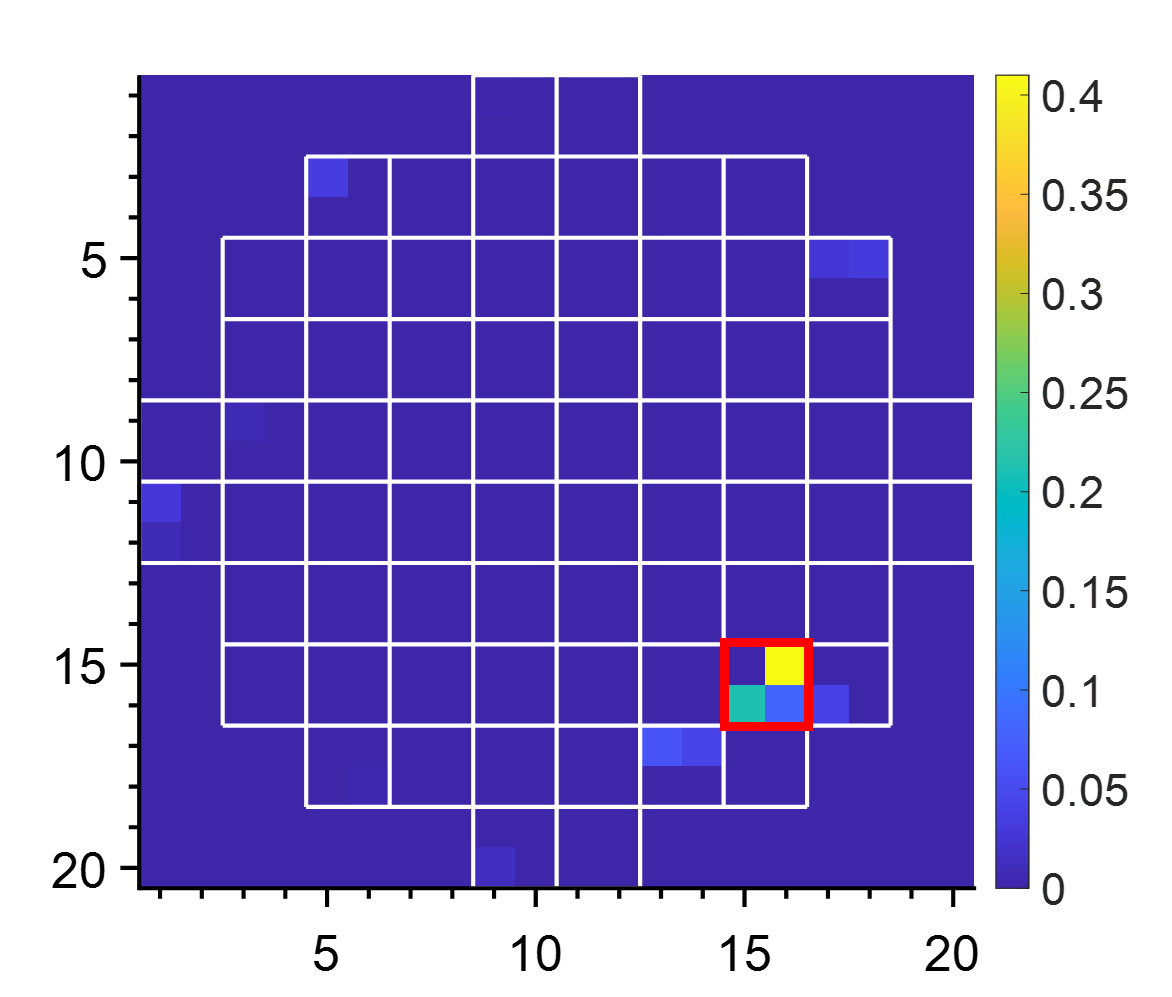
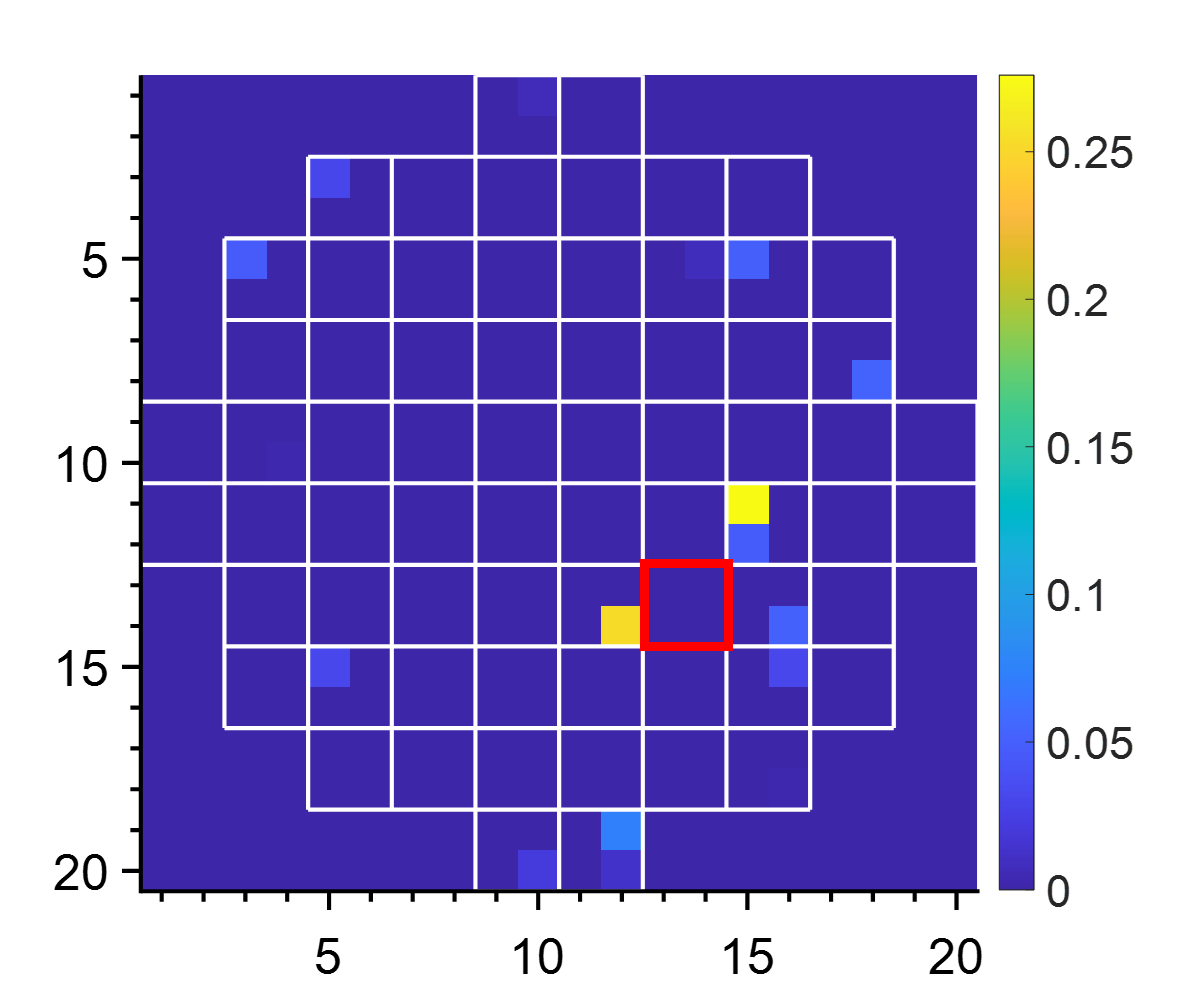
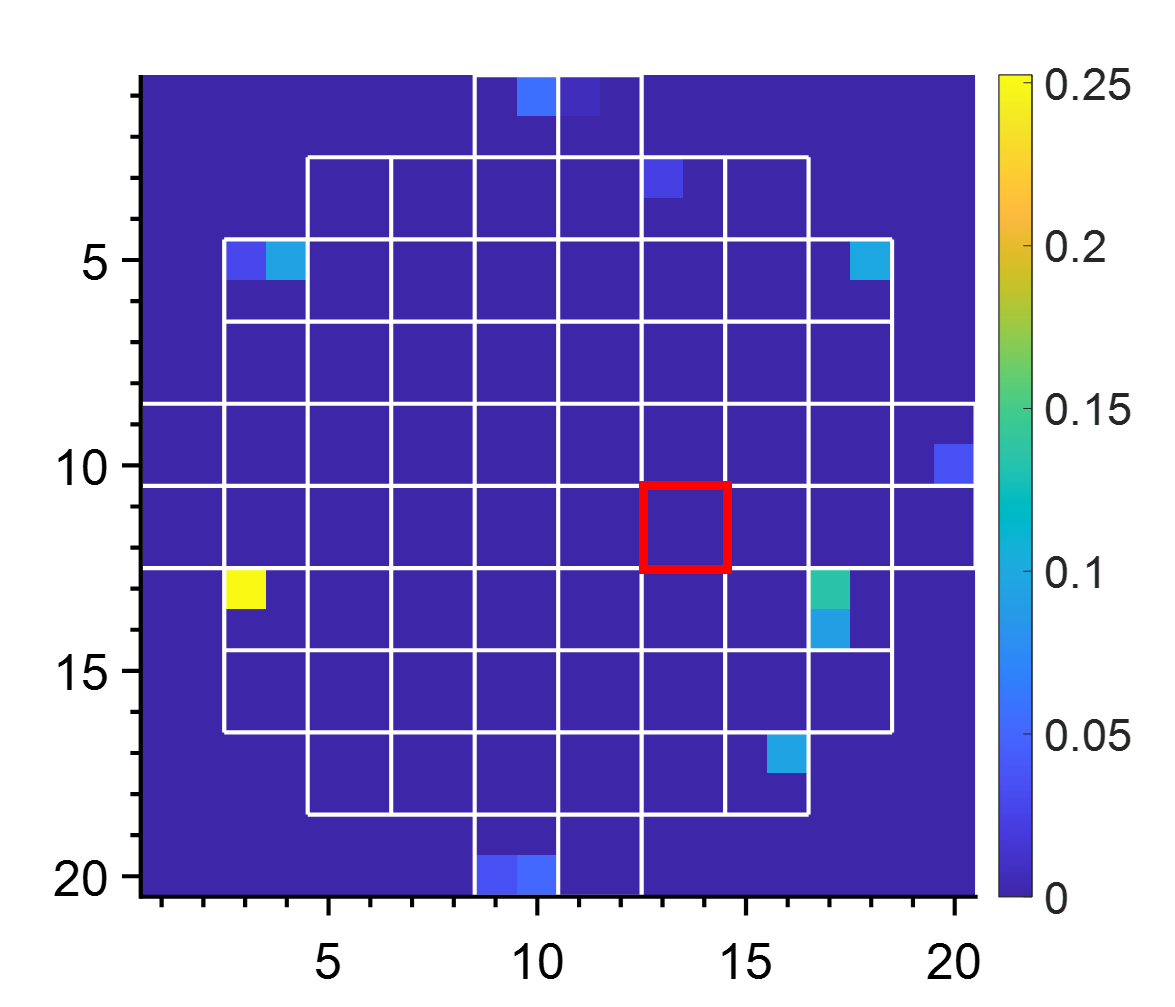
In Fig. 12, we can successfully identify the missing fuel assemblies that are close to the sidewall of the canister. As the location of the missing fuel assembly moves from the peripheral to the center of the canister, the sensitivity of the method drops.
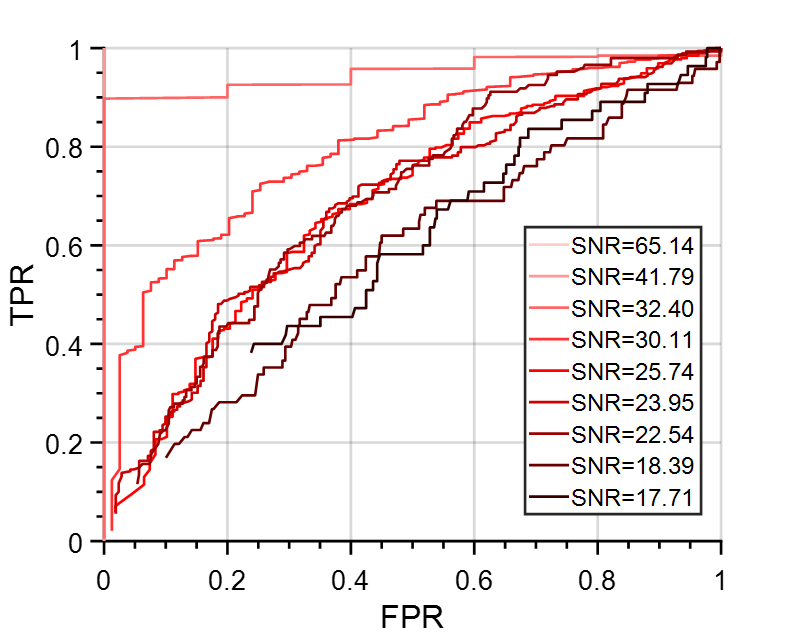
We added Gaussian noise to the readout data to generate noise-corrupted input data and evaluate the effect of noise on the reconstructed images. The noisy input data have an SNR ranging from 18 to 65. We calculated the receiver operating characteristic (ROC) curve for different noise levels as shown in Fig. 13, for the case study of a missing fuel assembly at the bottom-right corner (i.e., Case7). In the ROC, a fuel-missing case corresponds to a pixel intensity of the reconstructed image higher than the threshold. Conversely, a full-assembly case corresponds to a pixel intensity lower than the threshold. True positive (TP) cases refer to correctly identified fuel-missing cases. False positive (FP) cases refer to cases that are identified as fuel-missing whereas in reality the assemblies are full. The true positive rate (TPR) is the ratio between TP cases and all cases that are identified as fuel-missing ones. The false positive rate (FPR) is the ratio between FP cases over all cases that are identified as full-assembly ones. The ROC curves show the relationship of noise intensity with the accuracy of the reconstruction, that is, the higher the noise level (i.e., the lower the SNR), the worse the ability to identify the correct location of the missing fuel assembly. Therefore, to ensure the accuracy of the image reconstruction, we need sufficiently high neutron fluence (which should ensure the canister being actually irradiated by at least a total of source neutrons), especially for the mis-loaded scenarios with fuel assemblies located in the inner region of the canister.
3.2.2 Results from CNN
The images reconstructed with FISTA tend to be noisy when the missing assembly is located in the center part of the cask. Hence, we applied the CNN model to improve the quality of the reconstructed images.
Fig. 14 shows the noisy reconstructed images from FISTA as the network inputs and the corresponding CNN outputs. From the comparison between the inputs and corresponding outputs, the SNR of the reconstructed images can be improved by a factor of at least 1.5.

4 Discussion and Conclusions
We presented the results of a simulation-based study aimed at identifying suitable operating parameters for the non-destructive inspection of SNF with 14.1 MeV interrogating neutrons. We simulated a D-T neutron generator with a source strength of 1010 n/s, suitably collimated to minimize off-axis irradiation that would otherwise increase the measurement background without adding useful information. Fast neutrons emitted as a result of the interactions of the primary beam with the SNF were detected and used as a signature to identify missing fuel rods. We found that a direct angle-differential fast neutron measurement is a viable approach to detect missing pins inside a fuel cask. Based on the proposed method, one assembly with at least 75% pins (69 out of 92 fuel pins) removed can be identified. The detection of a single missing pin is challenging with this method. Other time-correlated signatures could be considered in the future to improve the specificity of the NDA method to fissile and fissionable material. For example, longer irradiation time would enable the measurement of coincidence neutrons that are a specific signature of induced fission. In general, a longer inspection time, corresponding to a neutron fluence irradiating the cask , would yield a lower relative uncertainty of the neutron counts, which could improve the overall NDA performances.
Most of the fast neutrons were produced by scattering reactions while fissions accounted for less than of all the interactions occurring within the cask. These conditions allowed us to adopt an iterative linear imaging reconstruction approach based on the accurate simulation of the system response to missing fuel located throughout the cask. We hence reconstructed the bi-dimensional cross-section of a SNF assembly by solving an inverse problem with FISTA. When solving the inverse problem, the location of the missing fuel can be reconstructed by unfolding it from the neutron angular distribution and the knowledge of the system response to missing bundles within the entire SNF cask field-of-view. Images reconstructed using FISTA tend to be noisy when the missing fuel assembly is located in inner region of the canister. We denoised the reconstructed images and improved the SNR by applying a CNN-based model. By optimizing the parameters of the CNN architecture, such as the number of layers, number of convolutional filters, the filter size, the batch size, and the number of training epochs, we were able to identify and locate one missing fuel assembly in the center of the canister, hence improving the overall penetrability of the method, with respect to the direct measurement of the back-scattered signature.
This method allowed us to accurately locate the position of a full missing bundle with an overall measurement time less than 2 hours and a source strength of at least n/s in the 4 solid angle, using organic scintillation detectors.
Using organic scintillation detectors to perform the tomographic inspection, the measurement time of a single scan is approximately to achieve an average relative uncertainty associated with the counts at the detectors less than . Therefore, the measurement time for an inspection including 12 scans was estimated to be 1.7 hours.
The simulated inspection time of less than two hours is much shorter when compared to other proposed methods, which may require an inspection time longer than 24 hours [6]. The estimated inspection time can be further reduced using a stronger source and a closer source-to-canister distance. However, reducing the source-to-canister distance will require further collimation of the source that might reduce the field-of-view of the source and the overall neutron flux irradiating the assemblies.
The overall scope of this work was to study the feasibility of neutron imaging of spent fuel through simulations. A realistic experimental verification of the neutron tomographic imaging of the canister was not conducted on SNF casks. We are currently validating our simulated model using a small-scale experiment based on a P385 neutron generator.
Acknowledgements
This work is funded in part by the Department of Energy (DOE) under contract number 000128931. The Argonne Leadership Computing Facility (ALCF) provided the access to super-computing resources.
References
References
-
[1]
Storage
of Spent Nuclear Fuel, no. SSG-15 in Specific Safety Guides, INTERNATIONAL
ATOMIC ENERGY AGENCY, Vienna, 2012.
URL https://www.iaea.org/publications/8532/storage-of-spent-nuclear-fuel - [2] C. Greulich, C. Hughes, Y. Gao, A. Enqvist, J. Baciak, High energy neutron transmission analysis of dry cask storage, Nuclear Instruments and Methods in Physics Research Section A: Accelerators, Spectrometers, Detectors and Associated Equipment 874 (2017) 5–11.
- [3] Transportation of spent nuclear fuel, https://www.nrc.gov/waste/spent-fuel-transp.html (jan 2020).
- [4] D. S. Blair, A global perspective on continuity of knowledge: Concepts and challenges., Tech. rep., Sandia National Lab.(SNL-NM), Albuquerque, NM (United States) (2014).
- [5] C. Wharton, E. Seabury, A. Caffrey, P. Winston, Summary report: Inl cdcis cask scanner testing at doel, belgium, Idaho National Laboratory, Tech. Rep (2013).
- [6] D. Poulson, J. M. Durham, E. Guardincerri, C. Morris, J. D. Bacon, K. Plaud-Ramos, D. Morley, A. A. Hecht, Cosmic ray muon computed tomography of spent nuclear fuel in dry storage casks, Nuclear Instruments and Methods in Physics Research Section A: Accelerators, Spectrometers, Detectors and Associated Equipment 842 (2017) 48–53.
- [7] J. M. Durham, D. Poulson, J. Bacon, D. Chichester, E. Guardincerri, C. Morris, K. Plaud-Ramos, W. Schwendiman, J. Tolman, P. Winston, Verification of spent nuclear fuel in sealed dry storage casks via measurements of cosmic-ray muon scattering, Physical Review Applied 9 (4) (2018) 044013.
- [8] S. Chatzidakis, C. Choi, L. Tsoukalas, Investigation of imaging spent nuclear fuel dry casks using cosmic ray muons, Transactions 114 (1) (2016) 152–155.
- [9] S. Chatzidakis, Classification and imaging of spent nuclear fuel dry casks using cosmic ray muons, Oak Ridge, TN: Oak Ridge National Laboratory (ORNL).[Google Scholar] (2017).
- [10] C. A. Miller, C. G. Geddes, B. A. Ludewigt, S. D. Clarke, S. A. Pozzi, Verification of dry storage cask loading using monoenergetic photon sources, Annals of Nuclear Energy 137 (2020) 107091.
- [11] X. Liu, H. K. Lee, A simulation study of the spent nuclear fuel cask condition evaluation using high energy x-ray computed tomography, NDT & E International 80 (2016) 58–64.
- [12] S. Agostinelli, J. Allison, K. a. Amako, J. Apostolakis, H. Araujo, P. Arce, M. Asai, D. Axen, S. Banerjee, G. . Barrand, et al., Geant4—a simulation toolkit, Nuclear instruments and methods in physics research section A: Accelerators, Spectrometers, Detectors and Associated Equipment 506 (3) (2003) 250–303.
- [13] O. Ezvan, X. Zeng, B. Gencturk, R. Ghanem, Simplified design: Hi-star 100 cask, mpc-68 canister and basket, ge-14 fuel assembly, Tech. Rep. DE-FOA-0001281, University of Southern California (USC).
- [14] Z. Liu, J. George, L. J. Meng, Nondestructive assessment of transportation fuel cask using time-tagged neutron interrogations, in: Symposium on Radiation Measurements and Applications (SORMA XVII), 2018.
- [15] Wikipedia contributors, Fusion power — Wikipedia, the free encyclopedia, https://en.wikipedia.org/w/index.php?title=Fusion_power&oldid=972723724, [Online; accessed 17-August-2020] (2020).
- [16] M. Fang, Y. Altmann, D. Della Latta, M. Salvatori, A. Di Fulvio, Quantitative imaging and automated fuel pin identification for passive gamma emission tomography, Scientific reports 11 (1) (2021) 1–11.
- [17] A. Beck, M. Teboulle, A fast iterative shrinkage-thresholding algorithm for linear inverse problems, SIAM journal on imaging sciences 2 (1) (2009) 183–202.
- [18] Y. A. Korovin, A. Maksimushkina, The use of neural networks for approximation of nuclear data, Physics of Atomic Nuclei 78 (12) (2015) 1406–1414.
- [19] C. Fu, A. Di Fulvio, S. Clarke, D. Wentzloff, S. Pozzi, H. Kim, Artificial neural network algorithms for pulse shape discrimination and recovery of piled-up pulses in organic scintillators, Annals of Nuclear Energy 120 (2018) 410–421.