A Turbulent Heating Model Combining Diffusion and Advection Effects for Giant Planet Magnetospheres
Abstract
The ion temperature of the magnetospheres of Jupiter and Saturn was observed to increase substantially from about 10 to 30 planet radii. Different heating mechanisms have been proposed to explain such observations, including a heating model for Jupiter based on MHD turbulence with flux-tube diffusion. More recently, an MHD turbulent heating model based on advection was shown to also explain the temperature increase at Jupiter and Saturn. We further develop this turbulent heating model by combining effects from both diffusion and advection. The combined model resolves the physical consistency requirement that diffusion should dominate over advection when the radial flow velocity is small and vice versa when it is large. Comparisons with observations show that previous agreements, using the advection only model, are still valid for larger radial distance. Moreover, the additional heating by diffusion results in a better agreement with the temperature observations for smaller radial distance.
Geophysical Research Letters
Geophysical Institute, University of Alaska Fairbanks, Fairbanks, AK, USA
C. S. Ngcng2@alaska.edu
A new and improved model for the heating of the magnetospheres of Jupiter and Saturn by magnetohydrodynamic turbulence is developed
The model combines effects from diffusion and advection such that each is dominant when the radial flow velocity is small or large
Predictions of the temperature and radial flow velocity profiles agree better with Jupiter and Saturn observations than previous models
Plain Language Summary
The ion temperature of the magnetospheres of Jupiter and Saturn was observed to increase substantially near the planet. This suggests that there should be some heating sources to counter the cooling effect due to expansion. There have been several models trying to explain such observation using different heating mechanisms, including a heating model for Jupiter based on turbulence and diffusion effects, as well as a model based on advection effects for Jupiter and Saturn. We further develop a heating model by combining effects from both diffusion and advection. The combined model resolves the physical consistency requirement that diffusion should be stronger than advection nearer to the planet, but shifting to the opposite farther away. Comparisons with observations show that previous agreements using the advection only model are still valid, and are improved by including diffusion nearer to the planet.
1 Introduction
One major unresolved problem in the physics of giant magnetospheres is to find the mechanism responsible for the observed increase of ion temperature with radial distance [<]e.g.,¿Bagenal11. Such observations show that the ion temperature of the magnetospheres of Jupiter and Saturn increase substantially, about a factor of 3, from about 10 to 30 planet radii. This suggests that there should be some heating sources to counter the cooling effect due to adiabatic expansion. There have been several models proposed to explain such observations using different heating mechanisms [<]e.g.,¿Hill83_Dessler. \citeASaur04 considered the possibility of turbulent heating of Jupiter’s magnetodisc (10 to 40 ) based on magnetohydrodynamic (MHD) turbulence, and flux tube diffusion. Another turbulent heating model for Jupiter was developed by \citeANg-etal-JGR-2018, in which the outward plasma transport is dominated by advection rather than diffusion, as inspired by turbulent heating models of the solar wind [<]e.g.,¿Ng10a. They found that the observed heating rate density due to MHD turbulence can provide enough heating to explain the observed increase of ion temperature to about 30 . More recently the same turbulence heating model was also applied to Saturn’s magnetosphere by \citeAhttps://doi.org/10.1029/2020JA027986, who also found a consistent relationship between the heating rate density and the temperature increase.
The justification for the advection dominated turbulent heating model was argued in details by \citeANg-etal-JGR-2018, based on the observed fact that beyond about 10 the radial transport time becomes much shorter, or the radial outflow speed becomes much larger [Delamere \BBA Bagenal (\APACyear2010), Bagenal \BBA Delamere (\APACyear2011), Bagenal \BOthers. (\APACyear2016)]. While this model does give the required heating rate at the radial positions up to about 30 planet radii for both Jupiter and Saturn, strictly speaking it cannot be applied to positions near and inward of 10 planet radii due to the fact the the radial outflow speed is still small there. Moreover, the temperature increases predicted by this model do seem to be significantly smaller than the observed data for both Jupiter and Saturn in the near planet positions [Ng \BOthers. (\APACyear2018), Neupane \BOthers. (\APACyear2021)].
In this paper, we develop a new turbulent heating model by combining the diffusion model of \citeASaur04, and the advection model of \citeANg-etal-JGR-2018. The formulation for this model will be given in the next Section. In Section 3 we will apply this new model to both Jupiter and Saturn cases to compare the predicted temperature, as well as radial outflow speed, with observations. Discussion and conclusion will be given in Section 4.
2 A Combined Turbulent Heating Model
We start the derivation of the one-dimensional steady-state turbulent heating model by writing down the transport equations for mass,
| (1) |
In this equation, is the mass rate to be transported out of the inner magnetosphere injected by Io of Jupiter or Enceladus of Saturn. is the radius of the planet. is the normalized radial position. is the scale height of an equatorially confined plasma sheet. is the average mass of ions to be transported out. is the volume ion number density. is the radial outflow velocity. is the diffusion coefficient of the flux tube content of ions. Similarly, the transport equations for heat is of the form
| (2) |
where is the Boltzmann constant, is the ion temperature, is the ion pressure, is the heating rate density, assumed to be due to the dissipation of MHD turbulence in this paper. On the right hand sides of Eqs. (1) and (2), the first term is due to advection and the second term is due to diffusion. The previous turbulent heating models by \citeASaur04 and \citeANg-etal-JGR-2018 can be recovered by keeping only the diffusion terms or the advection terms respectively.
While the scale height as a function of can be expressed as an empirical formula fitted to observations [Bagenal \BBA Delamere (\APACyear2011), Bagenal \BOthers. (\APACyear2016), Thomsen \BOthers. (\APACyear2010), Wilson \BOthers. (\APACyear2017)], for simplicity we can approximate it as either a constant such as used by \citeANg-etal-JGR-2018, or a linear function such as , with the constant , used by \citeAhttps://doi.org/10.1029/2020JA027986. We will adopt the latter form in this paper for uniformity, although it is straightforward to derive alternate equations based on other models for the scale height. The ion density is also assumed to have a power law profile of . Following \citeASaur04, we will also assume the diffusion coefficient is having a form of power law dependency such that the radial outflow velocity can be solved from Eq. (1) as
| (3) |
For a diffusion only model without radial outflow, we then have and
| (4) |
Note that instead in \citeASaur04, which is simply due to assuming a constant , rather than the linear form used in this derivation. If is a constant and with Eq. (4), would be identically zero for all , which is in contradiction with the observed growth along [<]e.g.,¿Bagenal11. While such a growth in must be due to a dynamical mechanism, here we will simply model the growth by assuming starts decreasing with from (after a certain initial position ) and compare with observations.
Substituting Eq. (3) into Eq. (2), a second order ordinary differential equation for can be obtained as
| (5) |
where ,
| (6) |
and
| (7) |
Since will be chosen to be less than for larger , is positive when becomes larger. In this case, terms proportional to dominate the left hand side of Eq. (5) such that the advection only model by \citeANg-etal-JGR-2018 is recovered when is larger. Eq. (5) can be solved as a two-point boundary value problem with set for the small side. The boundary condition for the large side is set by requiring that advection terms are larger than diffusion terms on the left hand side of Eq. (5). Numerically this is imposed by choosing on the large boundary such that there is no artificial oscillations in to make the term large. From the experience in actually solving this equation numerically, this can be easily achieved. Much effort has been spent by \citeAKaminker17, \citeANg-etal-JGR-2018 and \citeAhttps://doi.org/10.1029/2020JA027986 to determine the heating rate density by analyzing MHD turbulence spectra from magnetometer data for both Saturn and Jupiter. Please refer to these papers for the data analysis methods, as well as various plots showing the distributions of as functions of positions. While the resulting values scatter over some ranges for different , for the purpose of entering into the model calculations, it can be approximated by a fitting function of the form , as obtained by \citeANg-etal-JGR-2018 and \citeAhttps://doi.org/10.1029/2020JA027986.
3 Comparing Model Predictions with Observations
We now apply the new turbulent heating model with both advection and diffusion physics to the Jupiter case using data and parameters used by \citeANg-etal-JGR-2018. Let us first list the values of parameters we use: , , , , , , , , , and .
The values of and are chosen here to be consistent with our published work. In principle, those values should be determined by physical chemistry models for the inner magnetospheres [Delamere \BOthers. (\APACyear2005), Fleshman \BOthers. (\APACyear2013)]. By such considerations, as well as observations, [<]e.g.,¿sittler2008, could be chosen slightly inwards to about 8 for Jupiter, and about 7 for Saturn. Such small adjustments should not affect the conclusion of this paper, but might be needed for future investigations.
While there is a considerable amount of freedom to choose the profile of as a function of , many small adjustments simply produce qualitatively similar results. Therefore we only try a few different profiles and report here just one reasonable case with shown as the red curve in Fig. 1. With this choice of , the radial outflow velocity can then be calculated using Eqs. (3) and (4), shown as the red curve in Fig. 2. We see that for this profile of , is mostly within of the observed values from \citeABagenal11, shown as the black dashed curve, which are derived from Galileo data, interpolated for the specific value used in this calculation. The model does get higher than the observed values as getting near 30 when the heating model is expected to start failing.
The corresponding ion temperature can then be calculated using Eq. (5), shown as the red curve in Fig. 3. The blue curve in Fig. 3 shows calculated using the advection only model, i.e., keeping only terms proportional to on the left hand side of Eq. (5). We see that the output from the combined model shows a much faster increase from than the advection only model. Then the two models actually give virtually the same after . Overall, the output from the advection only model is well within a factor of two of the output from the combined model. This provides a justification that the advection only model used by \citeANg-etal-JGR-2018 is valid, as long as the radial outflow velocity begins to grow larger. Also shown as the black dashed curve in Fig. 3 is the observed , again from \citeABagenal11. We see that the predicted from both models actually fall within of the observed values for over half of the range shown. The predicted becomes consistently larger than the observations further in the range but is still within a factor of three.
Let us now apply the same model to the Saturn case using data and parameters used by \citeAhttps://doi.org/10.1029/2020JA027986. Let us first list the values of parameters we use: , , , , , , , , and . As in the Jupiter case, a profile is chosen after a few trials to give reasonable profiles, shown as the blue curve in Fig. 1. It has values quite different from the Jupiter case since the values are different. Due to some uncertainty in the value of [Delamere \BBA Bagenal (\APACyear2013), Fleshman \BOthers. (\APACyear2013)], three values, 30, 50, and 80 kg/s, are used, as in \citeAhttps://doi.org/10.1029/2020JA027986. The profiles for these three cases calculated from Eqs. (3) and (4) are shown in Fig. 4 as the red, green, and blue curves respectively. We see that while the blue curve seems to be closest to the observed values (black curve) from \citeAdoi:10.1002/2017JA024117, the green curve is still mainly within the uncertainty region (the shaded area indicating values between 25th and 75th percentile). Only the red curve is significantly below observations.
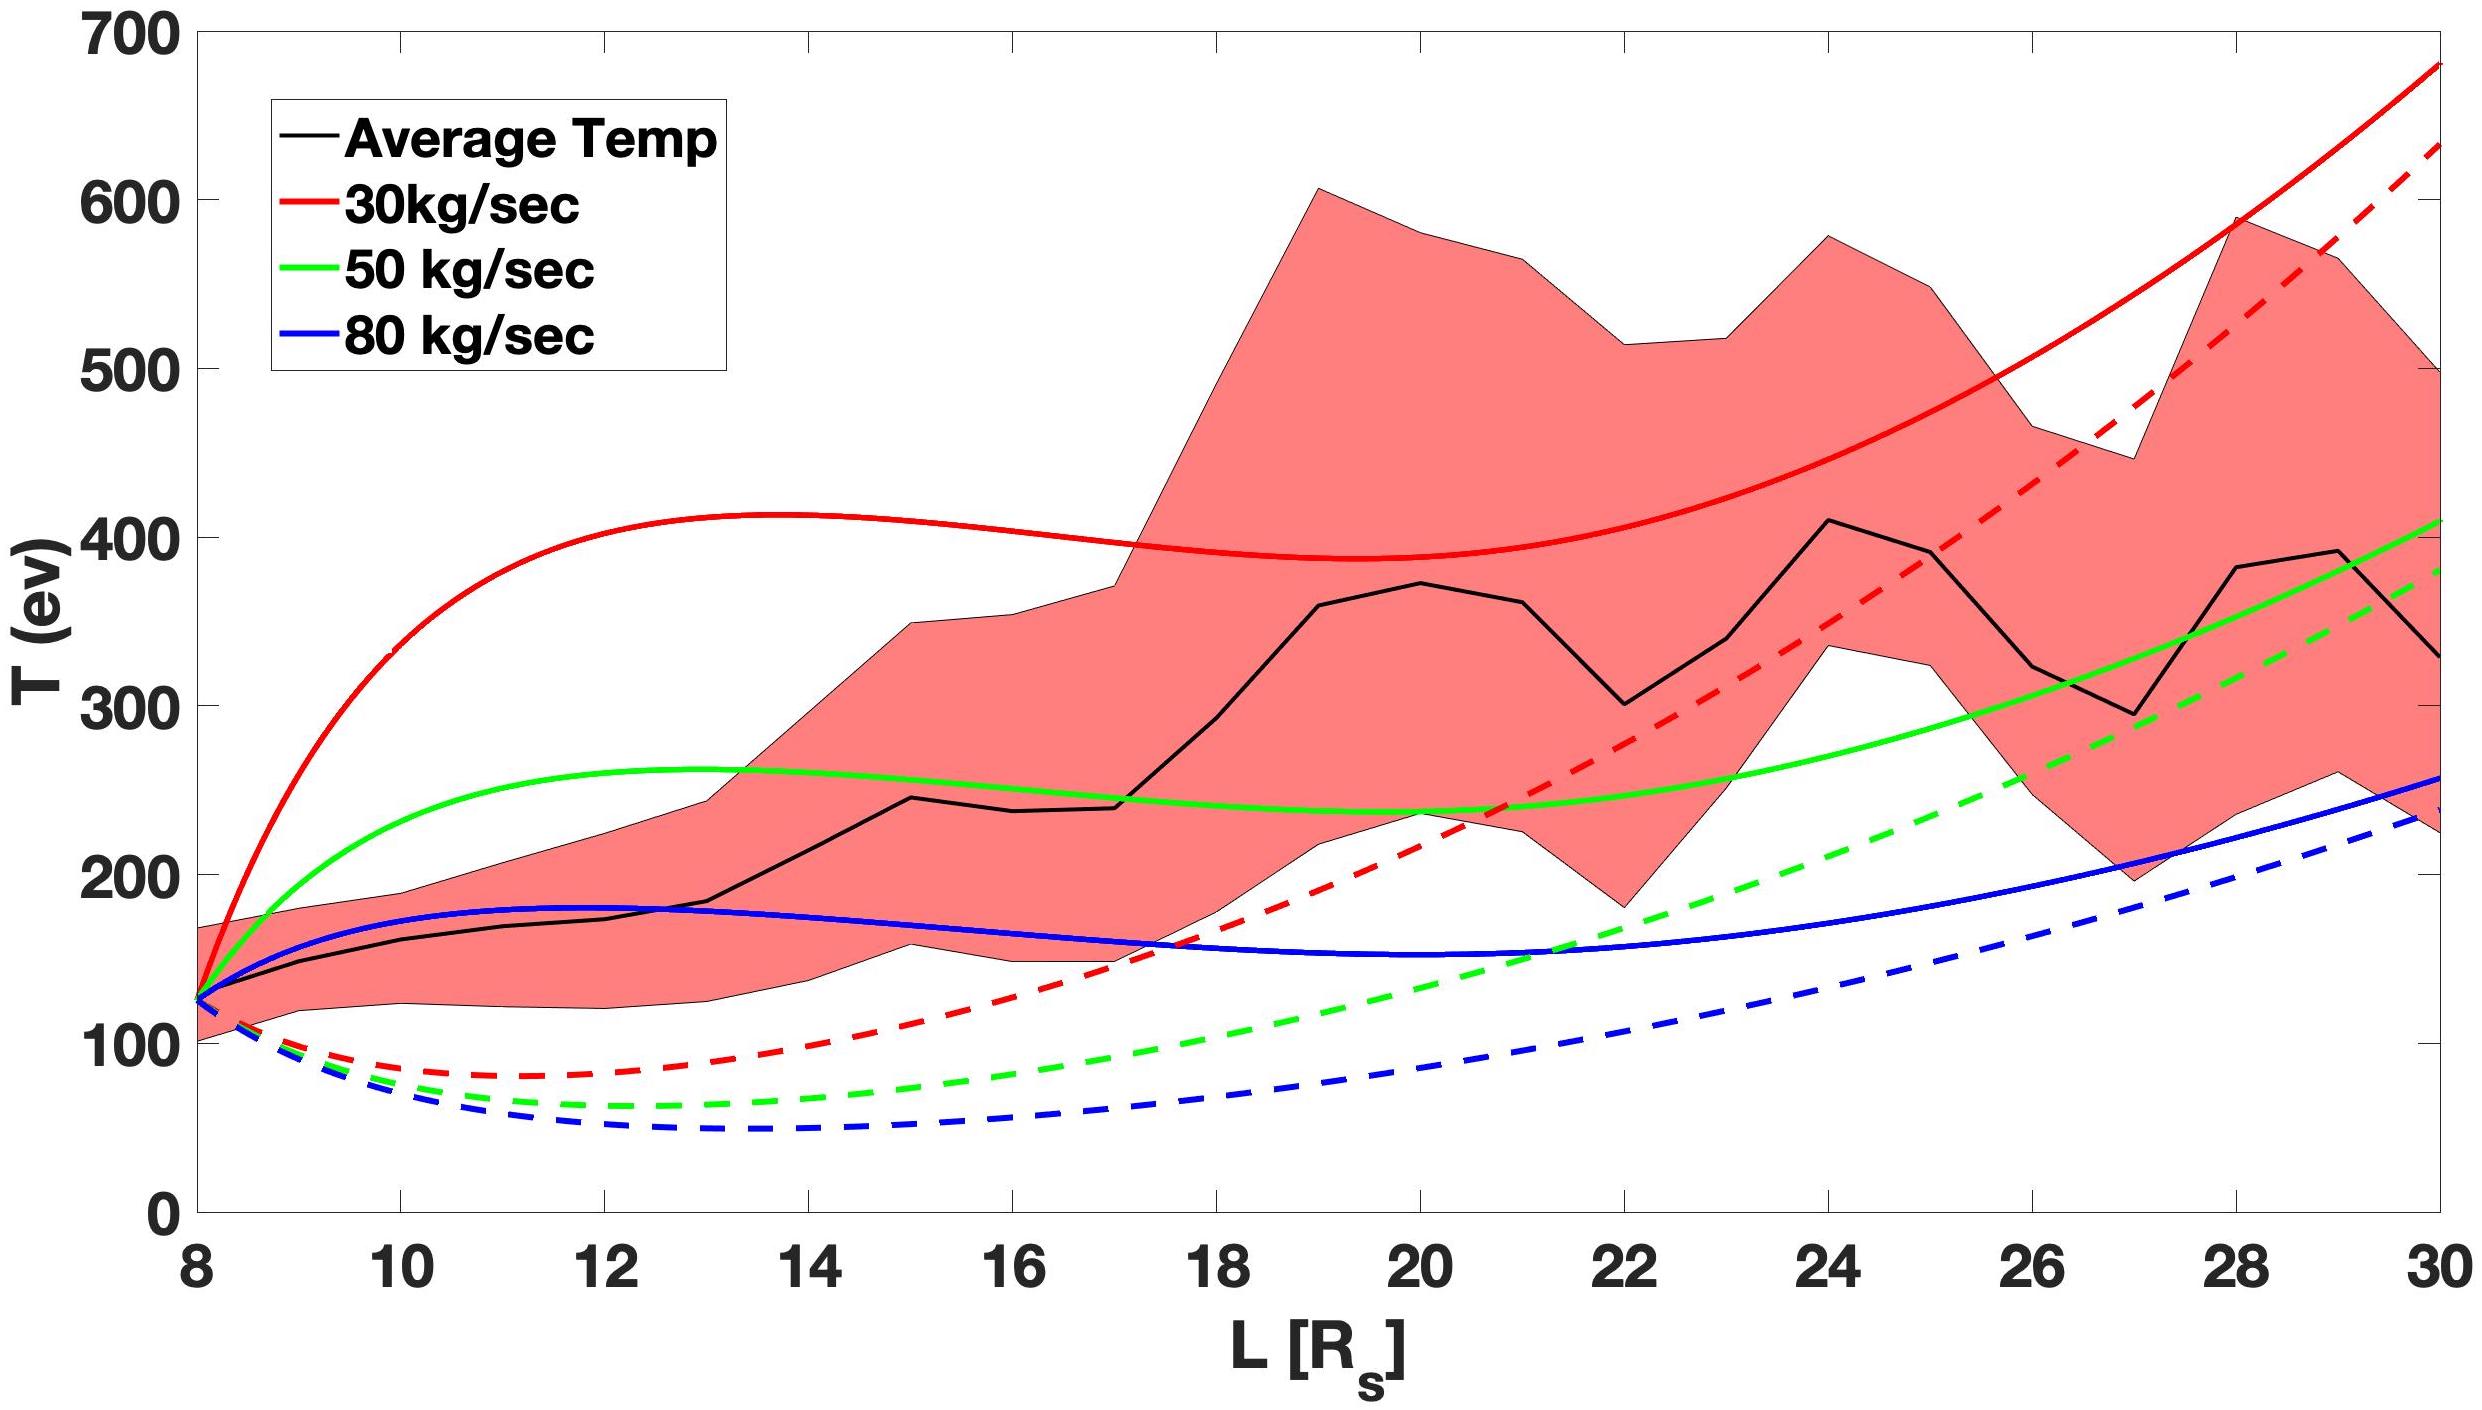
The corresponding ion temperature calculated from Eq. (5) are shown in Fig. 5 for the same three cases as the red, green, and blue curves. The observed temperature shown as the black curve is again from \citeAdoi:10.1002/2017JA024117. We see that the green solid curve fits the observations the best, while the red solid curve is significantly higher, and the blue solid curve is significantly lower. Combining both the and comparisons, the case for the green curves, or , seems to give an overall satisfactory predictions. In Fig. 5 we have also plotted predictions using the advection only model as dashed curves, with the same color for each case. Comparing with those curves, the combined model again gives a much faster increase of starting from , instead of having initial decreases, which now fits much better with observations, while the predictions at larger are essentially at the same levels. Therefore the Saturn case again shows that the combined model indeed provides better agreement, and also recovers the advection only model for larger .
4 Conclusion
In this paper, we have developed the formulation for a one-dimensional steady-state turbulent heating model for the inner magnetospheres of giant planets, by combining both the diffusion and advection effects. Combining these effects into a single model provides a better theoretical foundation than either the diffusion only or advection only approaches of \citeASaur04, and \citeANg-etal-JGR-2018 respectively. This is because the new model will consistently have the diffusion effects being dominant when the radial outflow speed is small, but will change to advection effects being dominant when is larger. In practice, we also show that the combined model does give better comparisons with observations of both , and the ion temperature , by repeating the studies done previously for Jupiter by \citeANg-etal-JGR-2018, and for Saturn by \citeAhttps://doi.org/10.1029/2020JA027986. The new calculations from the combined model also provide a justification for the advection only model for the use in larger radial positions when has increased substantially, since the two models give almost the same outputs for larger . With this new model and the comparisons with observations, there is more confidence that MHD turbulence can indeed provide enough heating to explain the increase with ion temperature in the inner magnetospheres of the giant planets.
While this turbulent heating model is now on firmer ground, it is still far from being a dynamical model, since we have not included an equation of motion that can provide a mechanism for the increase of . Rather, we have simply tuned the model to better compare with observed profiles of and . Such a study is obviously a worthwhile future research direction, but is outside the scope of this paper. We additionally neglect other effects which contribute to the beginning of the break down of the model after about such as the beginning of the breakdown of corotation, and the return of flux tubes, as well as other possible heat loss mechanisms. Therefore, there are several potential directions that can be taken to facilitate further improvement of the model.
Acknowledgements.
This work is supported by NASA grant 80NSSC20K1279. Data Availability Statement The new model outputs in this paper is based on parameters from previous data analysis in the papers by \citeANg-etal-JGR-2018 and \citeAhttps://doi.org/10.1029/2020JA027986. Please refer to these two papers for the availability of data used in those studies.References
- Bagenal \BBA Delamere (\APACyear2011) \APACinsertmetastarBagenal11{APACrefauthors}Bagenal, F.\BCBT \BBA Delamere, P\BPBIA. \APACrefYearMonthDay2011\APACmonth05. \BBOQ\APACrefatitleFlow of mass and energy in the magnetospheres of Jupiter and Saturn Flow of mass and energy in the magnetospheres of Jupiter and Saturn.\BBCQ \APACjournalVolNumPagesJournal of Geophysical Research (Space Physics)116A155209. {APACrefDOI} 10.1029/2010JA016294 \PrintBackRefs\CurrentBib
- Bagenal \BOthers. (\APACyear2016) \APACinsertmetastarBagenal16{APACrefauthors}Bagenal, F., Wilson, R\BPBIJ., Siler, S., Paterson, W\BPBIR.\BCBL \BBA Kurth, W\BPBIS. \APACrefYearMonthDay2016. \BBOQ\APACrefatitleSurvey of Galileo plasma observations in Jupiter’s plasma sheet Survey of galileo plasma observations in jupiter’s plasma sheet.\BBCQ \APACjournalVolNumPagesJournal of Geophysical Research: Planetsn/a–n/a. {APACrefURL} http://dx.doi.org/10.1002/2016JE005009 \APACrefnote2016JE005009 {APACrefDOI} 10.1002/2016JE005009 \PrintBackRefs\CurrentBib
- Delamere \BBA Bagenal (\APACyear2010) \APACinsertmetastarDelamere10{APACrefauthors}Delamere, P\BPBIA.\BCBT \BBA Bagenal, F. \APACrefYearMonthDay2010\APACmonth10. \BBOQ\APACrefatitleSolar wind interaction with Jupiter’s magnetosphere Solar wind interaction with Jupiter’s magnetosphere.\BBCQ \APACjournalVolNumPagesJournal of Geophysical Research (Space Physics)115A1410201-+. {APACrefDOI} 10.1029/2010JA015347 \PrintBackRefs\CurrentBib
- Delamere \BBA Bagenal (\APACyear2013) \APACinsertmetastarDelamere13b{APACrefauthors}Delamere, P\BPBIA.\BCBT \BBA Bagenal, F. \APACrefYearMonthDay2013\APACmonth11. \BBOQ\APACrefatitleMagnetotail structure of the giant magnetospheres: Implications of the viscous interaction with the solar wind Magnetotail structure of the giant magnetospheres: Implications of the viscous interaction with the solar wind.\BBCQ \APACjournalVolNumPagesJournal of Geophysical Research (Space Physics)1187045-7053. {APACrefDOI} 10.1002/2013JA019179 \PrintBackRefs\CurrentBib
- Delamere \BOthers. (\APACyear2005) \APACinsertmetastarDelamere05{APACrefauthors}Delamere, P\BPBIA., Bagenal, F.\BCBL \BBA Steffl, A. \APACrefYearMonthDay2005\APACmonth12. \BBOQ\APACrefatitleRadial variations in the Io plasma torus during the Cassini era Radial variations in the Io plasma torus during the Cassini era.\BBCQ \APACjournalVolNumPagesJournal of Geophysical Research (Space Physics)11012223-+. {APACrefDOI} 10.1029/2005JA011251 \PrintBackRefs\CurrentBib
- Fleshman \BOthers. (\APACyear2013) \APACinsertmetastarFleshman13{APACrefauthors}Fleshman, B\BPBIL., Delamere, P\BPBIA., Bagenal, F.\BCBL \BBA Cassidy, T. \APACrefYearMonthDay2013\APACmonth08. \BBOQ\APACrefatitleA 1-D model of physical chemistry in Saturn’s inner magnetosphere A 1-D model of physical chemistry in Saturn’s inner magnetosphere.\BBCQ \APACjournalVolNumPagesJournal of Geophysical Research (Planets)1181567-1581. {APACrefDOI} 10.1002/jgre.20106 \PrintBackRefs\CurrentBib
- Hill \BOthers. (\APACyear1983) \APACinsertmetastarHill83_Dessler{APACrefauthors}Hill, T\BPBIW., Dessler, A\BPBIJ.\BCBL \BBA Goertz, C\BPBIK. \APACrefYearMonthDay1983. \BBOQ\APACrefatitleMagnetospheric Models Magnetospheric Models.\BBCQ \BIn A\BPBIJ. Dessler (\BED), \APACrefbtitlePhysics of the Jovian Magnetosphere Physics of the jovian magnetosphere (\BPG 353-394). \PrintBackRefs\CurrentBib
- Kaminker \BOthers. (\APACyear2017) \APACinsertmetastarKaminker17{APACrefauthors}Kaminker, V., Delamere, P\BPBIA., Ng, C\BPBIS., Dennis, T., Otto, A.\BCBL \BBA Ma, X. \APACrefYearMonthDay2017\APACmonth04. \BBOQ\APACrefatitleLocal time dependence of turbulent magnetic fields in Saturn’s magnetodisc Local time dependence of turbulent magnetic fields in Saturn’s magnetodisc.\BBCQ \APACjournalVolNumPagesJournal of Geophysical Research (Space Physics)1223972-3984. {APACrefDOI} 10.1002/2016JA023834 \PrintBackRefs\CurrentBib
- Neupane \BOthers. (\APACyear2021) \APACinsertmetastarhttps://doi.org/10.1029/2020JA027986{APACrefauthors}Neupane, B\BPBIR., Delamere, P\BPBIA., Ma, X., Ng, C\BHBIS., Burkholder, B.\BCBL \BBA Damiano, P. \APACrefYearMonthDay2021. \BBOQ\APACrefatitleOn The Nature of Turbulent Heating and Radial Transport in Saturn’s Magnetosphere On the nature of turbulent heating and radial transport in saturn’s magnetosphere.\BBCQ \APACjournalVolNumPagesJournal of Geophysical Research: Space Physics1261e2020JA027986. {APACrefURL} https://agupubs.onlinelibrary.wiley.com/doi/abs/10.1029/2020JA027986 \APACrefnotee2020JA027986 2020JA027986 {APACrefDOI} https://doi.org/10.1029/2020JA027986 \PrintBackRefs\CurrentBib
- Ng \BOthers. (\APACyear2010) \APACinsertmetastarNg10a{APACrefauthors}Ng, C\BPBIS., Bhattacharjee, A., Munsi, D., Isenberg, P\BPBIA.\BCBL \BBA Smith, C\BPBIW. \APACrefYearMonthDay2010\APACmonth02. \BBOQ\APACrefatitleKolmogorov versus Iroshnikov-Kraichnan spectra: Consequences for ion heating in the solar wind Kolmogorov versus Iroshnikov-Kraichnan spectra: Consequences for ion heating in the solar wind.\BBCQ \APACjournalVolNumPagesJ. Geophys. Res.1152101. {APACrefDOI} 10.1029/2009JA014377 \PrintBackRefs\CurrentBib
- Ng \BOthers. (\APACyear2018) \APACinsertmetastarNg-etal-JGR-2018{APACrefauthors}Ng, C\BPBIS., Delamere, P\BPBIA., Kaminker, V.\BCBL \BBA Damiano, P\BPBIA. \APACrefYearMonthDay2018. \BBOQ\APACrefatitleRadial Transport and Plasma Heating in Jupiter’s Magnetodisc Radial transport and plasma heating in jupiter’s magnetodisc.\BBCQ \APACjournalVolNumPagesJournal of Geophysical Research: Space Physics12386611-6620. {APACrefURL} https://agupubs.onlinelibrary.wiley.com/doi/abs/10.1029/2018JA025345 {APACrefDOI} 10.1029/2018JA025345 \PrintBackRefs\CurrentBib
- Saur (\APACyear2004) \APACinsertmetastarSaur04{APACrefauthors}Saur, J. \APACrefYearMonthDay2004\APACmonth02. \BBOQ\APACrefatitleTurbulent Heating of Jupiter’s Middle Magnetosphere Turbulent Heating of Jupiter’s Middle Magnetosphere.\BBCQ \APACjournalVolNumPagesAstrophys. J. Lett.602L137-L140. {APACrefDOI} 10.1086/382588 \PrintBackRefs\CurrentBib
- Sittler \BOthers. (\APACyear2008) \APACinsertmetastarsittler2008{APACrefauthors}Sittler, E., Andre, N., Blanc, M., Burger, M., Johnson, R., Coates, A.\BDBLYoung, D. \APACrefYearMonthDay2008. \BBOQ\APACrefatitleIon and neutral sources and sinks within Saturn’s inner magnetosphere: Cassini results Ion and neutral sources and sinks within saturn’s inner magnetosphere: Cassini results.\BBCQ \APACjournalVolNumPagesPlanetary and Space Science5613-18. {APACrefURL} https://www.sciencedirect.com/science/article/pii/S0032063307002309 \APACrefnoteSurfaces and Atmospheres of the Outer Planets, their Satellites and Ring Systems: Part III {APACrefDOI} https://doi.org/10.1016/j.pss.2007.06.006 \PrintBackRefs\CurrentBib
- Thomsen \BOthers. (\APACyear2010) \APACinsertmetastarThomsen10{APACrefauthors}Thomsen, M\BPBIF., Reisenfeld, D\BPBIB., Delapp, D\BPBIM., Tokar, R\BPBIL., Young, D\BPBIT., Crary, F\BPBIJ.\BDBLWilliams, J\BPBID. \APACrefYearMonthDay2010\APACmonth10. \BBOQ\APACrefatitleSurvey of ion plasma parameters in Saturn’s magnetosphere Survey of ion plasma parameters in Saturn’s magnetosphere.\BBCQ \APACjournalVolNumPagesJournal of Geophysical Research (Space Physics)11510220-+. {APACrefDOI} 10.1029/2010JA015267 \PrintBackRefs\CurrentBib
- Wilson \BOthers. (\APACyear2017) \APACinsertmetastardoi:10.1002/2017JA024117{APACrefauthors}Wilson, R\BPBIJ., Bagenal, F.\BCBL \BBA Persoon, A\BPBIM. \APACrefYearMonthDay2017. \BBOQ\APACrefatitleSurvey of thermal plasma ions in Saturn’s magnetosphere utilizing a forward model Survey of thermal plasma ions in saturn’s magnetosphere utilizing a forward model.\BBCQ \APACjournalVolNumPagesJournal of Geophysical Research: Space Physics12277256-7278. {APACrefURL} https://agupubs.onlinelibrary.wiley.com/doi/abs/10.1002/2017JA024117 {APACrefDOI} 10.1002/2017JA024117 \PrintBackRefs\CurrentBib