SN 2015bq: A Luminous Type Ia Supernova with Early Flux Excess
Abstract
We present optical and ultraviolet (UV) observations of a luminous type Ia supernova (SN Ia) SN 2015bq characterized by the early flux excess. This SN reaches a B-band absolute magnitude at mag and a peak bolometric luminosity at erg s-1, with a relatively small post-maximum decline rate [ mag]. The flux excess observed in the light curves of SN 2015bq a few days after the explosion, especially seen in the UV bands, might be due to the radioactive decay of 56Ni mixed into the surface. The radiation from the decay of the surface 56Ni heats the outer layer of this SN. It produces blue color followed by monotonically reddening in the early phase, dominated iron-group lines, and weak intermediate-mass elements absorption features in the early spectra. The scenario of enhanced 56Ni in the surface is consistent with a large amount of 56Ni ( = 0.97 ) synthesized during the explosion. The properties of SN 2015bq are found to locate between SN 1991T and SN 1999aa, suggesting the latter two subclasses of SNe Ia may have a common origin.
1 Introduction
Type Ia supernovae (SNe Ia) are excellent distance indicators on cosmic scales whose peak luminosities can be well calibrated by the relation with the width of the light curve (i.e., width-luminosity relation, WLR; Phillips, 1993). Moreover, the studies of SNe Ia provide the first evidence for accelerating expansion of the universe (Riess et al., 1998; Perlmutter et al., 1999), indicating that the current universe is dominated by dark energy. Current research shows that SNe Ia are produced by thermonuclear explosion of a carbon-oxygen white dwarf (WD) in the binary system when approaching the Chandrasekhar-mass ( 1.38; Hillebrandt & Niemeyer, 2000; Maoz et al., 2014). At the same time, the sub-Chandrasekhar model has also been examined to account for most SNe Ia (e.g., Livio, 2000; Sim et al., 2010; Flörs et al., 2020). There are two main progenitor scenarios. One is the single-degenerate (SD) scenario, in which the WD reaches the Chandrasekhar-mass limit by accreting matter from a nondegenerate companion star (Whelan & Iben, 1973; Nomoto, 1982; Nomoto et al., 1997). Another is the double-degenerate (DD) scenario, where two WDs in the close binary system eventually merge and explode by losing energy and angular momentum through gravitational wave radiation (Iben & Tutukov, 1984; Webbink, 1984).
According to the spectroscopic characteristics, SNe Ia could be divided into several subclasses (Benetti et al., 2005; Branch et al., 2009; Wang et al., 2009a). For example, SNe Ia characterized by relatively weak absorption of Si II 6355 and Si II 5972 are divided into shallow silicon (SS) subclass in the scheme of Branch et al. (2006, 2009).
However, SS is not a homogeneous category. It includes the SNe Ia possibly originating from a possible super-Chandrasekhar-mass progenitor, i.e., SN 2003fg (Jeffery et al., 2006), SN 2006gz (Hicken et al., 2007), SN 2007if (Scalzo et al., 2010), SN 2009dc (Taubenberger et al., 2011), the luminous 1991T/1999aa-like events dominated by higher ionization lines (Fe III) at the early phase, the narrow-lined events (NL, e.g., SN 2012fr (Zhang et al., 2014)) located between 91T and the normal ones, the spectroscopically normal events (e.g., SN 2006S (Blondin et al., 2012)), and the faint 2002cx-like SNe (Li et al., 2003; Chornock et al., 2006; McCully et al., 2014).
The dense and timely observations are essential to understand the physical origin of the diversity seen in the SS SNe Ia. This paper presents such data for SN 2015bq, a luminous 99aa-like event that shows flux excess at the early phase. Based on the optical and ultraviolet observations of SN 2015bq, we analyze its light curves and the color curves in Section 3. The investigations of the spectra are presented in Section 4. Next we discuss the mass of , the early excess and the diversity among luminous SS Ia in Section 5. Finally, a summary is given in Section 6.
2 Observations and Data Reduction
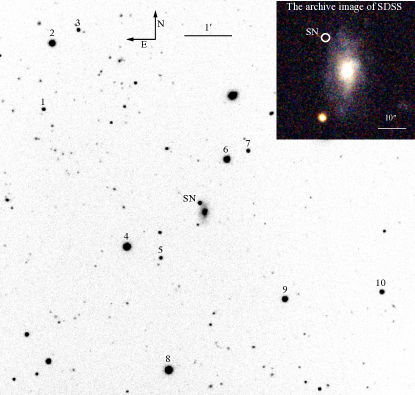
SN 2015bq was discovered independently by four transient survey projects (PSN J12350637+3114354 = PS15xn = CSS150219:123506+311436 = iPTF15ku; Ferretti et al., 2015). Its coordinates are RA = 12h35m0637, DEC = +3114354 (J2000), located at 71 west and 155 north of the center of the host galaxy LEDA 41898, which has a redshift of 0.028 (Takase & Miyauchi-Isobe, 1985) (see Figure 1).
Tsinghua University-NAOC Transient Survey (TNTS; Zhang et al., 2015b) initially reported the discovery of SN 2015bq via an unfiltered image at about 17.9 mag on February 16.72, 2015 UT (Universal Time is used throughout this paper). However, this transient was also independently discovered at about 2.3 days earlier by Palomar Transient Factory (PTF) at roughly a magnitude of PTF-g = 18.5 mag on February 14.43 2015 (Ferretti et al., 2015).
It was classified as a young 99aa-like event based on the spectra taken by Lijiang 2.4 meter telescope (LJT; Fan et al., 2015) with Yunnan Faint Object Spectrograph and Camera (YFOSC; Wang et al., 2019) on February 18.9 (Zhang et al., 2015a), and Nordic Optical Telescope (NOT) with Andalucia Faint Object Spectrograph and Camera (ALFOSC) on February 15 (Ferretti et al., 2015), respectively.
Thanks to the supernova program (LiONS, Lijiang One hour per Night for Supernova observation) of LJT, we can monitor this transient frequently at LJT in both photometric and spectroscopic modes. The observing campaign at LJT spanned from 12 d to 106 d relative to the -band maximum ( is the time since -band maximum and is used throughout this paper). Meanwhile, The Tsinghua-NAOC 0.8 m telescope (TNT; Wang et al., 2008; Huang et al., 2012) and Xing-Long 2.16 m telescope (XLT) at Xing-long Observation of National Astronomical Observatories (NAOC) also participated in the optical photometric and spectroscopic monitoring, respectively. Furthermore, the UV/optical data of SN 2015bq were also collected by the Ultraviolet/Optical Telescope (UVOT; Roming et al., 2005) onboard the Swift satellite also started, i.e., starting at -15 d.
2.1 Photometry Observation
Nearly daily UBVRI-band photometry of SN 2015bq were conducted at LJT for the first two months after the discovery. The ground-based optical photometry of SN 2015bq obtained by the LJT and TNT covered the period from t d to t d. The CCD images were reduced using the IRAF 111IRAF,the Image Reduction and Analysis Facility, is distributed by the National Optical Astronomy Observatory, which is operated by the Association of Universities for Research in Astronomy (AURA), Inc. under cooperative agreement with the National Science Foundation (NSF). standard procedure, including bias subtraction, flat fielding, and removal of cosmic rays. We performed background subtraction of the host galaxy light for all filters using template observations gathered in February 2016. Aperture photometry was applied to the image after template subtraction. The instrumental magnitudes of SN 2015bq are further converted to the standard Johnson UBV and Kron-Cousins RI systems based on the ten local standard stars (as labeled in Figure 1 and listed in Table A1). The final results of the photometry from the LJT and TNT are listed in Table A2.
The Swift-UVOT observations have covered for about the first month in three UV filters (uvw2, uvm2, and uvw1) and three broadband optical filters (u, b, and v). The UV-Optical photometry data presented in Table A3 has been published on the Swift Supernovae 222http://people.physics.tamu.edu/pbrown/SwiftSN/swift_sn.html website by Peter Brown. The UVOT data are reduced using the Swift’s Optical/Ultraviolet Supernova Archive (SOUSA; Brown et al., 2014) reductions, including subtracting the underlying host galaxy using Swift-UVOT observations from October and November 2016. Note that the upper limits of the uvm2 band are listed in Table A3 since there are no reliable detections of SN 2015bq in this band.
2.2 Spectroscopic Observation
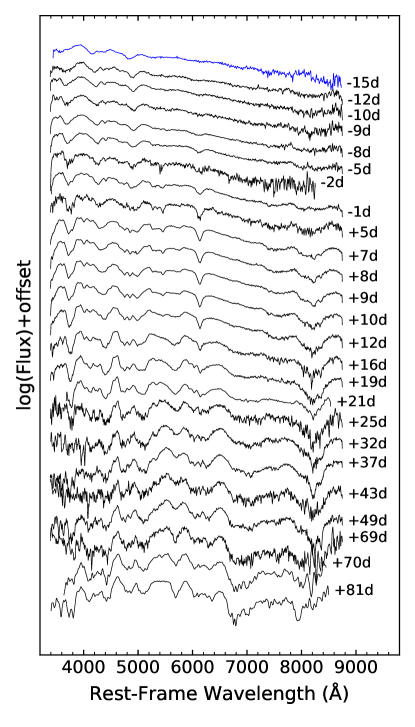
Twenty-three low-resolution spectra collected by the LJT, spaning from t 10 d to t = +83 d, are listed in Table 4 and presented in Figure 2. Furthermore, one spectrum was also obtained with the BFOSC (Beijing Faint Object Spectrograph and Camera) mounted on the Xinglong 2.16-m telescope.
All spectra were reduced using standard IRAF routines. The spectra were calibrated with the spectrophotometric standard stars observed at a similar air mass on the same night. Furthermore, the spectra were corrected for the continuum atmospheric extinction at the Lijiang Observatory, and the telluric lines were also removed.
Besides, a spectrum obtained on Feb. 05, 2015, at NOT with ALFOSC (Ferretti et al., 2015) presented at WISeREP 333http://wiserep.weizmann.ac.il/spectra/list (Yaron & Gal-Yam, 2012) is also plotted in Figure 2 for further analysis and discussion. In addition, the continuums of these spectra have been checked with the UBVRI-band photometry at similar phases.
3 Photometry
3.1 Optical and Ultraviolet Light Curves
The optical and UV light curves of SN 2015bq are displayed in Figure 3.
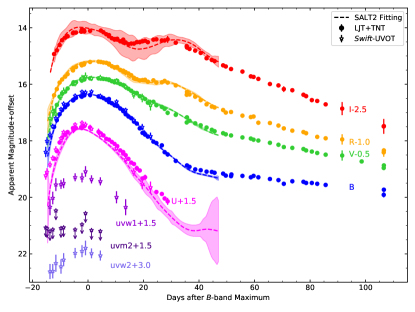
Using a polynomial fit to the observed light curves, we derived the parameters of peak magnitudes, the dates at the maximum brightness, and light-curve decline rates, as listed in Table 1. SN 2015bq reaches the -band peak magnitude at = 16.39 0.01 mag on JD 2457084.62 0.30, with the corresponding decline rate as = 0.78 0.03 mag. According to the width-luminosity relation, the small decline rate means that SN 2015bq has a high peak luminosity and synthesizes a significant amount of . The prominent -band and -band secondary maximum of SN 2015bq might be due to the Fe emission from high excitation transitions following recombination of doubly ionized elements to singly ionized states, usually seen in the luminous SNe Ia (Jack et al., 2015; Smitka et al., 2015). It is consistent with strong Fe III lines in the early spectra and amount of 56Ni estimated in Section 3.3.
Figure 3 displays the SALT2 (the spectral adaptive light curve template; Guy et al., 2007) fitting of the optical light curves of SN 2015bq. The fitting parameters and results are listed in Table 2, in which the maximum brightness matches the results from the polynomial fit. We calculate the , extinction, and distance modulus using those parameters (Vinkó et al., 2018), which yields as 0.86 0.06 mag, as 0.15 0.07 mag and as 35.55 0.14 mag. We take the average value as 0.82 0.05 mag from the above methods.
| Band | aaUncertainties of peak-light dates, in units of 0.01 day, are 1 . | bbUncertainties of magnitudes, in units of 0.01 mag, are 1 . | bbUncertainties of magnitudes, in units of 0.01 mag, are 1 . | |
|---|---|---|---|---|
| (Å) | (JD-2457000.5) | (mag) | (mag) | |
| uvw2 | 1928 | 83.23(40) | 18.80(26) | .. |
| uvw1 | 2600 | 83.23(40) | 17.59(19) | .. |
| U | 3650 | 81.39(30) | 16.00(02) | 0.89(05) |
| B | 4450 | 84.12(30) | 16.39(01) | 0.78(03) |
| V | 5500 | 85.45(30) | 16.27(03) | 0.53(05) |
| R | 6450 | 85.53(30) | 16.23(02) | 0.55(03) |
| I | 7870 | 83.56(50) | 16.61(05) | 0.46(05) |
| Parameter | Value |
|---|---|
| DayMax | 57085.32 0.04 |
| Color | 0.05 0.02 |
| X1 | 1.61 0.06 |
| RestFrameMag_0_U | 16.00 0.05 mag |
| RestFrameMag_0_B | 16.31 0.02 mag |
| RestFrameMag_0_V | 16.23 0.01 mag |
| RestFrameMag_0_R | 16.25 0.02 mag |
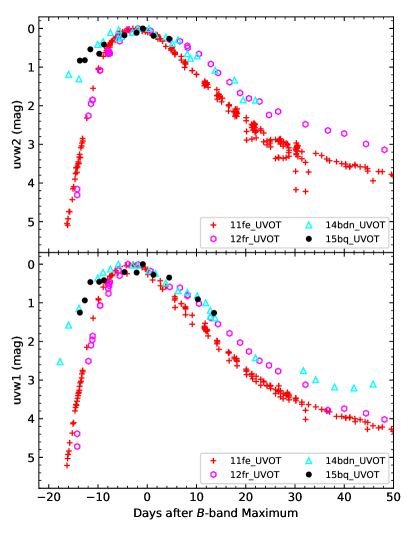
Figure 4 displays the comparison of SN 2015bq with some well-sampled luminous SS SNe Ia, including the superluminous SN Ia SN 2007if ( = 0.71 mag; Scalzo et al., 2010), luminous SN Ia SN 1991T ( = 0.95 mag; Lira et al., 1998), a transitional object linking 91T-like event to some superluminous SNe Ia SN 2011hr ( = 0.92 mag; Zhang et al., 2016), the 99aa-like events SN 1999aa ( = 0.85 mag; Jha, 2002) and iPTF 14bdn ( = 0.84 mag; Smitka et al., 2015), and the narrow-lined (NL) SNe Ia 2012fr ( = 0.85mag; Zhang et al., 2014). The normal SN Ia SN 2011fe ( = 1.08 mag; Brown et al., 2012) is also plotted here because of its extremely early and dense observations in multibands. The UV-band comparisons are displayed in Figure 5.
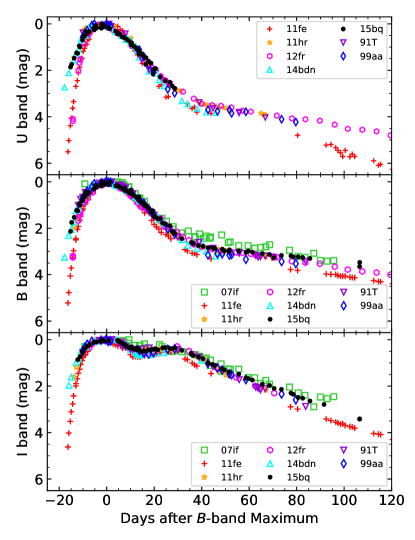
The comparison of light curves shows that SN 2015bq and iPTF 14bdn have higher luminosity than SN 2011fe in the early phase. They are about two magnitudes brighter than the latter one in the UV bands. After the -band maximum, there are no obvious distinctions in UBI bands. However, a possible “shoulder” is seen in the UV light curves of SN 2015bq, iPTF14bdn, and SN 2012fr.
In general, the photometry of SN 2015bq is very similar to iPTF 14bdn in all bands, especially both of them show the excess in the early phase. SN 2015bq and iPTF 14bdn were classified into early-excess SNe Ia (EExSNe) in Jiang et al. (2018). The luminosity enhancement characterizes this kind of SNe Ia in the first few days after the explosions. The origin of the early UV flux will be discussed in Section 5.2.
3.2 Color Curves and Interstellar Extinction
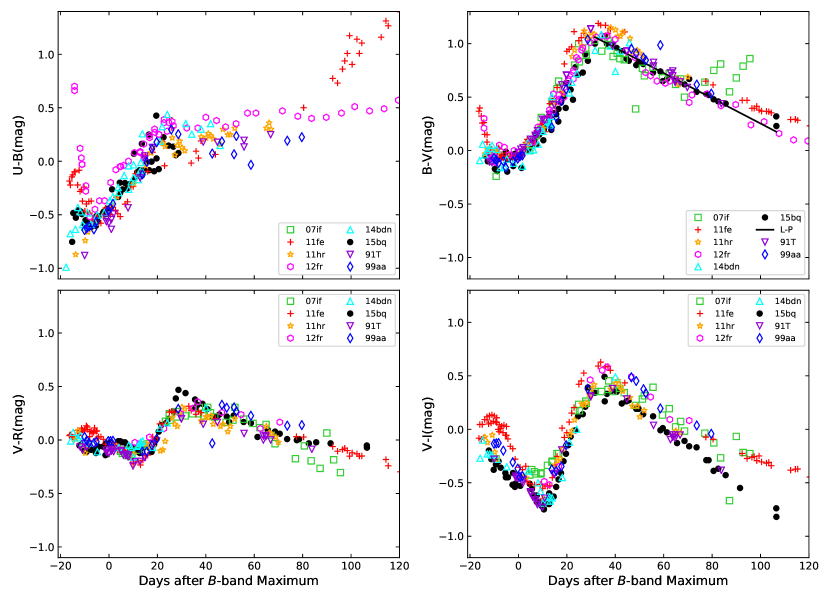
Figure 6 shows the optical color curves of the same sources as Figure 4. All of these color curves are corrected for the reddening of the Milky Way and the host galaxy. The reddening of SN 2015bq, = 0.13 0.04 mag, is estimated by the intrinsic color assumption of SNe Ia at +30 d t +90 d (named as Lira-Phillips relation; Phillips et al., 1999; Wang et al., 2009b). Considering that the Milky Way reddening presented by the Galaxy dust map is = 0.013 0.001 mag (Schlegel et al., 1998), the reddening due to the host galaxy is = 0.12 0.04 mag. Additionally, the result from the SALT2 fitting gives an extinction coefficient of = 0.15 0.07 mag, and we adopt the average of the two results, i.e., = 0.14 0.08 mag.
SN 2015bq is similar to iPTF 14bdn in color, and it seems these luminous SNe Ia are showing bluer color at the early phase.
At the early phase, 91T-like events show the bluest color among these samples, followed by 99aa-like SNe Ia and normal SNe Ia. Then we noticed that 91T/99aa-like SNe Ia are almost monotonically reddened, while normal SNe Ia shows a distinct “red-blue-red” evolution.
In color, SN 2015bq shows a redder color at about t +30 d. It might be related to the more significant band shoulder at this phase. There is a scatter in color, and SN 2015bq shows a blue color in the early phase of color, where the strength of the Ca II IR triplet could have a dominant effect.
4 Spectroscopy
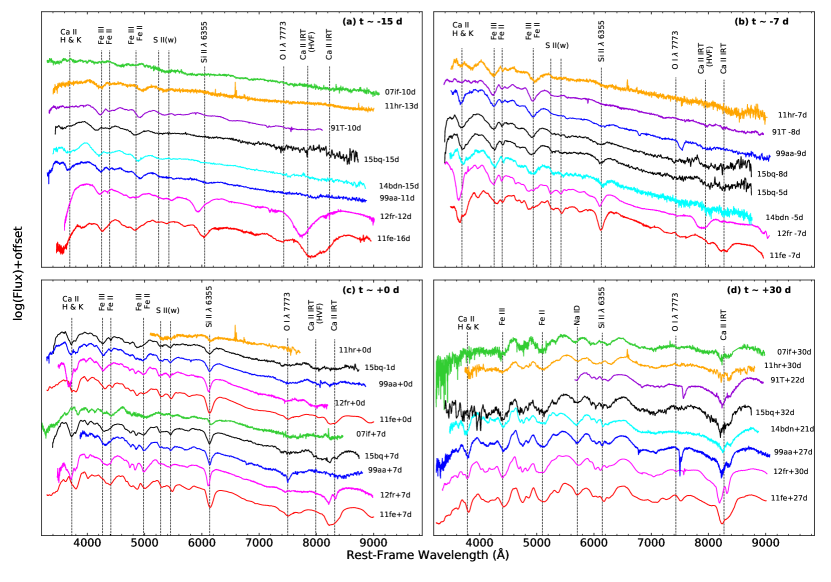
As shown in Figure 2, the early spectra of SN 2015bq are composed by superior absorption of iron-group elements (IGE) and Ca II HK, together with the weak absorption of the other IMEs, e.g., Si II lines, “W”-shaped S II lines and Ca II IR triplet lines. These features class SN 2015bq as a member of the 99aa-like event. More details of spectra evolution are in the following.
4.1 Spectra Temporal Evolution
We analyze the temporal evolution and comparison of spectra at some selected phases of our sample in this section, including SN 2015bq, SN 2007if, SN 2011hr, SN 1991T, iPTF 14bdn, SN 1999aa, SN 2012fr and SN 2011fe, which could give more details of the explosion.
The early spectra obtained at t 10 d are plotted in Figure 7(a). The dominant features at this phase are the high-velocity features (HVFs; Mazzali et al., 2005a, b; Zhao et al., 2015) of IMEs and high-ionized Fe group elements. At this phase, the spectra of normal SNe Ia show mainly lines of IMEs, including Si II 6355, Ca II HK, and Ca II IRT. At around t 14 d, the spectrum of SN 2015bq is dominated by the blended absorption lines of Fe III and Fe II lines, and the absorption lines of IMEs are almost absent.These are the standard features of 91T/99aa-like events.
However, the typical 99aa-like events, e.g., SN 1999aa and iPTF 14bdn, show evident absorption of Ca II HK at this phase, while the 91T-like events do not have such a feature. The spectrum of SN 2015bq has the similar Ca II HK feature, but it is weaker than that of SN 1999aa. At t 10 d, the spectrum of SN 2007if has no significant feature and is dominated by doubly ionized Fe. The above phenomenon illustrates that the order of ionization degree from high to low is superluminous SNe Ia, 91T-like events, 99aa-like events, and regular events. In addition, this sequence may help probe the temperature, as a higher temperature may lead to fewer IMEs and result in weak IME lines in the spectra (Mazzali et al., 1995).
The large dispersion of the colors in the early phase is closely related to the absorption strength of Ca II HK and IGEs. Meanwhile, the monotonically reddening color is associated with the strong IGEs lines and the weak IMEs lines. These may be due to the high temperature in the early phase.
Figure 7(b) displays the spectra at t 7 d. At around t 5 d, the spectra of SN 2015bq, iPTF 14bdn, and SN 1999aa show a weak absorption of Si II 6355, and the absorption of Ca II HK becomes stronger. These two lines are deeper than those of 91T-like events and weaker than those of normal events. The absorption of S II of SN 2015bq at t 5 d is not as strong as SN 2012fr and SN 2011fe at t 7 d, even weaker than that of iPTF14bdn at t 5 d.
The spectral evolution at around the -band maximum is displayed in Figure 7(c). At around t 0 d of 99aa-like events, the absorption features of Si II 6355 are becoming more dominant, and S II lines are becoming noticeable. However, they are still weaker than that in the normal event. At around t 7 d, the spectra of SN 2007if begin to show the absorption of IMEs, e.g., Si II 6355, Ca II HK, and the strength is still weaker than that of 99aa-like events. The absorption of S II of SN 2007if is still not significant.
The spectral evolution at one month after the -band maximum is displayed in Figure 7(d). The spectra are dominated by iron-group elements, Na ID, Ca II HK, and a strong Ca II IR triplet absorption. The double absorption features of Ca II IR triplet are more prominent in iPTF 14bdn, SN 1999aa, SN 2015bq, and SN 2012fr. At this phase, all the comparison SNe Ia shows a similar spectral evolution.
The diversity of the spectra of SNe Ia is mainly demonstrated in the early phase.
4.2 The Ejecta Velocity
The ejecta velocities of SN 2015bq derived from the absorption minimum of some spectral lines are displayed in Figure 8, including Si II 6355, Si II 5972, Ca II HK, Fe III, S II(w), C II 6580, Ca II IR triplet lines, and Si II 6355 HVF, Ca II HK HVF, Ca II IRT HVF. The locations of the absorption minimum are measured using both the Gaussian fit routine and direct measurement of the center of the absorption, and the results are averaged.
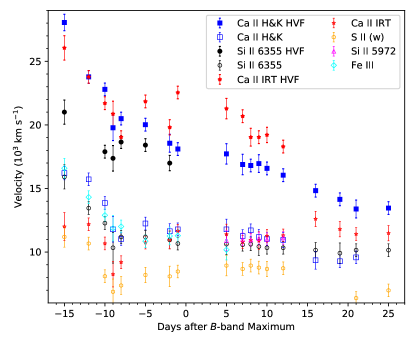
The velocity of Fe III at t 15 d is 16,000 km and declines quickly, disappeared at t 5 d with 11,000 km . Fe III is usually used to estimate the burning efficiency of SNe Ia. The dominated IGEs in the inner extent indicate that SN 2015bq produces more than the normal SNe Ia (Mazzali et al., 2007).
After the maximum light, the photospheric velocity of Si II 6355, Ca II HK, and Ca II IR triplet remains at 11,000 km for over a month. In contrast, Si II 5972 remains at a similar velocity just for ten days. Thus, the velocity of IMEs seems to have a plateau at t +5 d to t +12 d with a very low velocity gradient, which puts SN 2015bq into the low-velocity gradient (LVG) category of SNe Ia in the classification scheme of Benetti et al. (2005). On the other hand, the IMEs of SN 2015bq generally have similar expansion velocities (e.g., 11,000 km ), indicating that the burning products in the ejecta may have a relatively uniform distribution.
5 Discussion
5.1 The Peak Luminosity and The Nickel Mass
The distance modulus of SN 2015bq derived from the redshift of the host galaxy is = 35.45 0.15 mag (Mould et al., 2000), which is close to the result from SALT2 fitting ( = 35.55 0.14 mag). We adopt the average value of these two estimations and get mag, D = 126 9 Mpc.
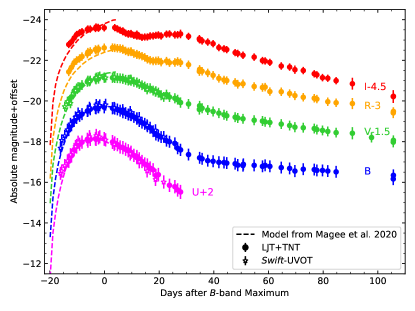
Adopting this distance and correcting for galactic extinction, we derive that the peak absolute magnitudes of SN 2015bq are mag and mag. Both are higher than the typical values of SNe Ia (e.g., the typical mag and mag given by Wang et al., 2006). The absolute magnitude light curves are displayed in Figure 9.
Furthermore, we plot a model, EXP_Ni0.8_KE0.50_P4.4, from TURTLS (a one-dimensional Monte-Carlo radiative transfer code designed for modeling the early time evolution of SNe Ia; Magee et al., 2018, 2020) which provides a better fit to the light curves of SN 2015bq than the rest of Magee et al. (2020).
Magee et al. (2020) model produces three parameters of SN 2015bq, where the total mass is 0.8. However, this model has only three options of mass (i.e., 0.4, 0.6, and 0.8), which may not be accurate enough to draw an actual mass of each particular SN Ia. Therefore, we did not use the result provided by Magee et al. (2020) as the mass of SN 2015bq. EXP_KE0.50 means the exponential density profiles with velocity scale km and kinetic energy erg. P4.4 is the scaling parameter with a smaller value of 4.4, which gives a more shallow distribution. We also get the rising time from the fitting as d.
However, this model does not fit the peak of light curves at V and I bands. It might be that there are more data points in UB- bands before the B-band maximum. Because Magee’s models simultaneously fit the data points of different bands in the early phase, the wights of U and B bands with more data are higher.
| name | EW(Si II ) | ref | ||||||
|---|---|---|---|---|---|---|---|---|
| d | d | |||||||
| (days) | (mag) | (mag) | () | () | (Å) | (Å) | ||
| SN 2007if | 24.0 | 0.71 | -20.23 | 3.22 | 1.60 | 29.95 | (1) | |
| SN 2011hr | 18.0 | 0.92 | -19.84 | 2.30 | 1.11 | 27.74 | (2) | |
| SN 1991T | 20.2 | 0.94 | -19.67 | 1.93 | 1.03 | 46.28 | (3) | |
| SN 2015bq | 20.77 | 0.82 | -19.68 | 1.75 | 0.97 | 43.93 | 56.89 | (4) |
| iPTF 14bdn | 19.9 | 0.84 | -19.57 | 1.76 | 0.93 | (5) | ||
| SN 1999aa | 19.0 | 0.85 | -19.60 | 1.73 | 0.72 | 55.33 | 58.78 | (6) |
| SN 2012fr | 17.9 | 0.85 | -19.49 | 1.82 | 0.88 | 61.57 | 61.58 | (7) |
| SN 2011fe | 17.5 | 1.11 | -19.24 | 1.31 | 0.62 | 79.71 | 88.79 | (8) |
References. — (1) Scalzo et al. (2010). (2) Zhang et al. (2016). (3) Lira et al. (1998); Contardo et al. (2000); Sasdelli et al. (2014). (4) This paper. (5) Smitka et al. (2015); (6) Garavini et al. (2004); Jha et al. (2006). (7) Childress et al. (2013); Zhang et al. (2014). (8) Pereira et al. (2013).
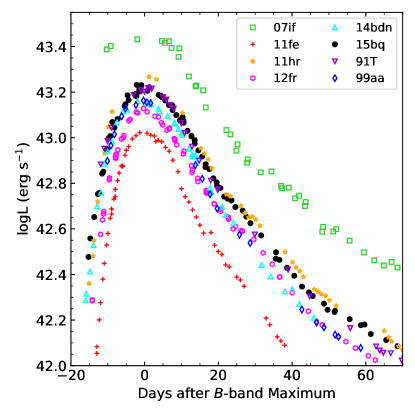
The bolometric luminosity of SN 2015bq is the sum of the flux of the four wavelength components: optical band, UV band, near-infrared (NIR) band, and the wavelength shorter than 1600 Å. The optical flux is calculated by the UBVRI photometry. Because the optical/UV-band light curves and color curves (see Figure 4 - 6) of iPTF14bdn are similar to SN 2015bq, we assume these two SNe have the same uvm2uvw1 color. Thus, we derive the missed uvm2-band magnitude of SN 2015bq by its uvw1-band light curve combined with the interpolated uvm2- uvw1 color of iPTF 14bdn. The flux of NIR and the wavelength shorter than 1600 Å could be estimated via the measurement of a large sample of SNe Ia. In this work, we evaluate that the NIR flux is 5% of the optical flux around the maximum according to Wang et al. (2009b), and the flux that Å is 3% of the optical flux according to Hsiao et al. (2007).
Following the above procedure, the peak bolometric luminosity of SN 2015bq is calculated to be .
5.2 The origin of early-excess flux
The early excess seen in the 99aa-like events, such as SN 2015bq (this paper), iPTF 14bdn (Smitka et al., 2015), and SN 1999aa (Jiang et al., 2018), relate to their dominated Fe III/Fe II lines and bluer color at the similar phase.
There are two physical mechanisms to explain the origin of early-excess SNe Ia: interaction or surface radioactivity. The interaction would happen between ejecta and a nondegenerate companion star (Kasen, 2010) or dense circumstellar matter (CSM; Piro & Morozova, 2016). Surface radioactivity could be helium detonation (He-det; Maeda et al., 2018) or surface--decay (Jiang et al., 2018).
SN 2015bq has a small decline rate ((B) mag) and higher peak luminosity () than normal SNe Ia, which produces a more significant amount of Ni (). It is likely SN 2015bq could have more mass of 56Ni at the surface than usual, although the fraction of this nickel may be small. Therefore, the surface--decay is preferred to interpret the early excess of SN 2015bq.It is consistent with the surface--decay scenario Jiang et al. (2018) proposed to explains the early excess in 91T/99aa-like events (Zhang et al., 2019).
The discussion about the mass above is primarily based on a model of ejecta shells outside a radiating photosphere. This model assumes a continuous mass distribution of , peaking toward the center of the ejecta (e.g., Arnett, 1982). However, the differences between 99aa-like and normal SNe Ia might be due to the off-center distance of the initial ignition point and the view angle effect (Jiang et al., 2018). The gravitationally confined detonation (GCD; Plewa et al., 2004; Kasen & Plewa, 2007; Jordan et al., 2008) model may describe the explosion of 99aa-like events by adjusting the off-center ignition point. In the GCD scenario, the transition of a deflagration bubble ignited near the stellar core will trigger a detonation at the opposite side, resulting in a more significant amount of at the outer layer.
Furthermore, Kasen (2010) proposed that the interaction between the expanding ejecta material and the nondegenerate companion star will cause a luminosity enhancement at the early phase and cause a “bump” feature in the light curve. Nevertheless, it needs a specific view angle, and only 10 SNe Ia may show the early excess in the observation. It seems to see a part of “bump” at early UV light curves of SN 2015bq. However, our observations started not early enough to have the complete early-time light curves. Thus we can not make sure there is a “bump”.
In addition, Jiang et al. (2018) found that a significant fraction of 91T/99aa-like objects shows early excess. They argued it could not be due to the viewing angle as predicted by the interaction scenario. Thus, the observation of SN 2015bq might prefer surface--decay scenario to interaction channel in terms of early flux excess.
5.3 Diversity of the luminous SS SNe Ia
Table 5.1 lists the EWs of Si II 6355 of the spectra presented in Figure 7(b). These SNe Ia, except SN 2011fe, can be classified into SS subtype in the Branch diagram (Branch et al., 2006, 2009) due to the small EW ( 60 Å) of Si II 6355 and the nearly absent Si II 5972 as seen in Figure 7(b). We further classify those SNe Ia as luminous SS SNe Ia due to the high peak luminosity listed in this table.
One can see a sequence of 12fr - 99aa - 15bq - 91T - 11hr - 07if in the profile of Si II 6355 that follows a change from deep and narrow to shallow and wide. Such a tendency corresponds to the luminosity increasing presented in Table 5.1. Thus, it seems that the peak luminosity of these SNe Ia decreases with the increasing EW of Si II 6355. Furthermore, the nickel masses of the explosions are causally varying with the luminosities in different sources, as the decay of nickel is thought to be responsible for the luminosity.
Indeed, SN 2012fr is likely to be a link between normal and 99aa-like (Zhang et al., 2014), SN 1999aa as a possible link between 91T-like and normal SNe Ia (Garavini et al., 2004), SN 2011hr represents a transitional object linking 91T-like SNe Ia to some superluminous SNe Ia (Zhang et al., 2016). Similarly, SN 2015bq in this work is possibly the connection between the 99aa-like and 91T-like SNe Ia, as the properties of its spectra seem to lie between the two types of SNe Ia (see Figure 7). In the early phase, a weak absorption of Ca II HK occurs in the spectrum of SN 2015bq, while there is no corresponding absorption for SN 1991T, and there is a stronger absorption for SN 1999aa. Meanwhile, the absorption strength of Si II 6355 of SN 2015bq is likely between 99aa-like and 91T-like SNe Ia (Figure 7 and Table 5.1). Those comparisons make SN 2015bq a possible intermediate in the “quasi-evolution” sequence of the luminous SS SNe Ia.
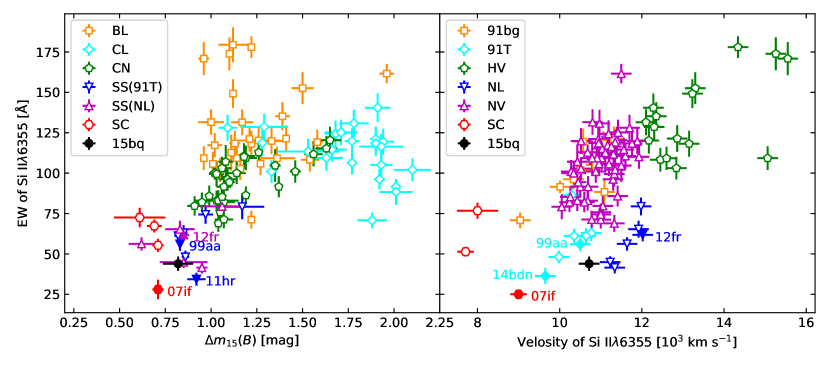
Zhai et al. (2016) suggested that the luminous SS SNe Ia had small EWs of Si II 6355 could be derived from different profiles of this line with smaller depth and larger width or with larger depth and small width. In the Branch and Wang diagram (Branch et al., 2009; Wang et al., 2009a), as shown in the left panel of Figure 12, SN 2015bq is located at the left bottom corner, which is considered the luminous SS SNe Ia region. SNe Ia in this region shows different properties that can be classified into another subclass, such as SC, 91T-like, 99aa-like, and NL SNe Ia. In the right panel, SN 2015bq is between the 91T-like SNe Ia and NL SNe Ia. It is consistent with the sequence mentioned above.
Although the spectra of those SNe Ia are not identical in the same phase (see Figure 7), the distinct structures in the spectra may be attributed to the variation of temperatures, as discussed in Section 4.1. Thus, the temperature might be a dominant factor in the luminous SS SNe Ia sequence from high to normal luminosity. It might suggest that those SNe originate from a similar mechanism. Such a scenario can naturally explain the possible tendency of the parameters in Table 5.1, e.g., the smaller EW of the absorption line of Si II 6355, the more thoroughly the silicon burns and the greater the luminosity.
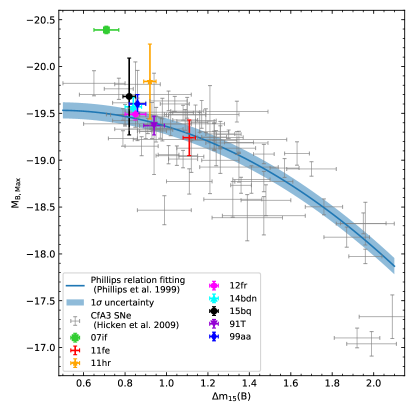
To check whether those luminous SS SNe Ia are fitted in the prediction of WLR or not, we make a comparison with the CfA3 sample (Hicken et al., 2009). As shown in Figure 11, most of them are still located at the WLR prediction with the CfA3 sample considering the measurement error, except SN 2007if. It indicates that the luminosity differences of those luminous SS SNe Ia are concentrated in the early phase, and their properties tend to be the same near the maximum. Based on the discussion in Section 5.2, the -abundance outer layer in the early phase might cause a variety of luminous SS SNe Ia.
6 Conclusion
In general, SN 2015bq is a luminous SN Ia with a slow rise and decline rate in the light curve. It reached the apparent peak magnitude of mag and an absolute peak magnitude of mag. Using UVBRI-band light curves, we derive a peak luminosity of for SN 2015bq, corresponding to a synthesized nickel mass of . The light-curve evolution is similar to that of another 1999aa-like event like iPTF 14bdn. The color is bluer than the normal SNe Ia and became monotonically reddened early. In particular, prominent excess emission can be seen in the UV bands. Meanwhile, its early spectra are characterized by prominent features of IGEs and Ca II HK absorptions, along with relatively weak absorption of IMEs, e.g., the shallow absorption features of Si II 6355 and Ca II IRT, and there is no obvious difference compared to normal SNe Ia after maximum light.
The surface--decay might be responsible for the early excess found in the UV-band light curves of SN 2015bq since the derived mass of synthesized in SN 2015bq is more significant than that in normal SNe Ia.
It seems that there is an evolutionary sequence in the parameters (e.g., , , color, , the EW of Si II 6355) of the luminous SS SNe Ia. With the spectral comparisons, SN 2015bq seems to be an inbetween object linking 91T-like and 99aa-like subclasses. The variations intrinsic to the sequence may be related to the temperature, which indicates that the origin of those luminous SS SNe Ia may be similar. The difference between them only exists in the early phase, which may be caused by different amounts of nickel mixed into the outer layers.
Acknowledgements
We thank the anonymous referee for the constructive comments and suggestions. We acknowledge the support of the staff of the LJT, TNT and XLT. Funding for the LJT has been provided by the CAS and the People’s Government of Yunnan Province. The LJT is jointly operated and administrated by YNAO and Center for Astronomical Mega-Science, CAS. JZ is supported by the National Natural Science Foundation of China (NSFC, grants 11773067, 12173082, 11403096), by the Youth Innovation Promotion Association of the CAS (grant 2018081), and by the Ten Thousand Talents Program of Yunnan for Top-notch Young Talents. XW is supported by NSFC (grants 12033003, and 11761141001), the Major State Basic Research Development Program (grant 2016YFA0400803), and the Scholar Program of Beijing Academy of Science and Technology (DZ:BS202002). This work is partially supported by National key research and development program 2018YFA0404204, the Science Foundation of Yunnan Province (No. 2018FA004). We acknowledge the science research grants from the China Manned Space Project with NO. CMS-CSST-2021-A13.
References
- Arnett (1982) Arnett, W. D. 1982, ApJ, 253, 785, doi: 10.1086/159681
- Benetti et al. (2005) Benetti, S., Cappellaro, E., Mazzali, P. A., et al. 2005, ApJ, 623, 1011, doi: 10.1086/428608
- Blondin et al. (2012) Blondin, S., Matheson, T., Kirshner, R. P., et al. 2012, AJ, 143, 126, doi: 10.1088/0004-6256/143/5/126
- Branch et al. (2009) Branch, D., Chau Dang, L., & Baron, E. 2009, PASP, 121, 238, doi: 10.1086/597788
- Branch et al. (2006) Branch, D., Dang, L. C., Hall, N., et al. 2006, PASP, 118, 560, doi: 10.1086/502778
- Brown et al. (2014) Brown, P. J., Breeveld, A. A., Holland, S., Kuin, P., & Pritchard, T. 2014, Ap&SS, 354, 89, doi: 10.1007/s10509-014-2059-8
- Brown et al. (2012) Brown, P. J., Dawson, K. S., de Pasquale, M., et al. 2012, ApJ, 753, 22, doi: 10.1088/0004-637X/753/1/22
- Childress et al. (2013) Childress, M. J., Scalzo, R. A., Sim, S. A., et al. 2013, ApJ, 770, 29, doi: 10.1088/0004-637X/770/1/29
- Chornock et al. (2006) Chornock, R., Filippenko, A. V., Branch, D., et al. 2006, PASP, 118, 722, doi: 10.1086/504117
- Contardo et al. (2000) Contardo, G., Leibundgut, B., & Vacca, W. D. 2000, A&A, 359, 876. https://arxiv.org/abs/astro-ph/0005507
- Fan et al. (2015) Fan, Y.-F., Bai, J.-M., Zhang, J.-J., et al. 2015, Research in Astronomy and Astrophysics, 15, 918, doi: 10.1088/1674-4527/15/6/014
- Ferretti et al. (2015) Ferretti, R., Fremling, C., Johansson, J., et al. 2015, The Astronomer’s Telegram, 7119, 1
- Flörs et al. (2020) Flörs, A., Spyromilio, J., Taubenberger, S., et al. 2020, MNRAS, 491, 2902, doi: 10.1093/mnras/stz3013
- Garavini et al. (2004) Garavini, G., Folatelli, G., Goobar, A., et al. 2004, AJ, 128, 387, doi: 10.1086/421747
- Guy et al. (2007) Guy, J., Astier, P., Baumont, S., et al. 2007, A&A, 466, 11, doi: 10.1051/0004-6361:20066930
- Hicken et al. (2007) Hicken, M., Garnavich, P. M., Prieto, J. L., et al. 2007, ApJ, 669, L17, doi: 10.1086/523301
- Hicken et al. (2009) Hicken, M., Challis, P., Jha, S., et al. 2009, ApJ, 700, 331, doi: 10.1088/0004-637X/700/1/331
- Hillebrandt & Niemeyer (2000) Hillebrandt, W., & Niemeyer, J. C. 2000, ARA&A, 38, 191, doi: 10.1146/annurev.astro.38.1.191
- Hsiao et al. (2007) Hsiao, E. Y., Conley, A., Howell, D. A., et al. 2007, ApJ, 663, 1187, doi: 10.1086/518232
- Huang et al. (2012) Huang, F., Li, J.-Z., Wang, X.-F., et al. 2012, Research in Astronomy and Astrophysics, 12, 1585, doi: 10.1088/1674-4527/12/11/012
- Iben & Tutukov (1984) Iben, I., J., & Tutukov, A. V. 1984, ApJS, 54, 335, doi: 10.1086/190932
- Jack et al. (2015) Jack, D., Baron, E., & Hauschildt, P. H. 2015, MNRAS, 449, 3581, doi: 10.1093/mnras/stv474
- Jeffery et al. (2006) Jeffery, D. J., Branch, D., & Baron, E. 2006, arXiv e-prints, astro. https://arxiv.org/abs/astro-ph/0609804
- Jha (2002) Jha, S. 2002, PhD thesis, HARVARD UNIVERSITY
- Jha et al. (2006) Jha, S., Kirshner, R. P., Challis, P., et al. 2006, AJ, 131, 527, doi: 10.1086/497989
- Jiang et al. (2018) Jiang, J.-a., Doi, M., Maeda, K., & Shigeyama, T. 2018, ApJ, 865, 149, doi: 10.3847/1538-4357/aadb9a
- Jordan et al. (2008) Jordan, G. C., I., Fisher, R. T., Townsley, D. M., et al. 2008, ApJ, 681, 1448, doi: 10.1086/588269
- Kasen (2010) Kasen, D. 2010, ApJ, 708, 1025, doi: 10.1088/0004-637X/708/2/1025
- Kasen & Plewa (2007) Kasen, D., & Plewa, T. 2007, ApJ, 662, 459, doi: 10.1086/516834
- Li et al. (2003) Li, W., Filippenko, A. V., Chornock, R., et al. 2003, PASP, 115, 453, doi: 10.1086/374200
- Lira et al. (1998) Lira, P., Suntzeff, N. B., Phillips, M. M., et al. 1998, AJ, 115, 234, doi: 10.1086/300175
- Livio (2000) Livio, M. 2000, in Type Ia Supernovae, Theory and Cosmology, ed. J. C. Niemeyer & J. W. Truran, 33. https://arxiv.org/abs/astro-ph/9903264
- Maeda et al. (2018) Maeda, K., Jiang, J.-a., Shigeyama, T., & Doi, M. 2018, ApJ, 861, 78, doi: 10.3847/1538-4357/aac8d8
- Magee et al. (2020) Magee, M. R., Maguire, K., Kotak, R., et al. 2020, A&A, 634, A37, doi: 10.1051/0004-6361/201936684
- Magee et al. (2018) Magee, M. R., Sim, S. A., Kotak, R., & Kerzendorf, W. E. 2018, A&A, 614, A115, doi: 10.1051/0004-6361/201832675
- Maoz et al. (2014) Maoz, D., Mannucci, F., & Nelemans, G. 2014, ARA&A, 52, 107, doi: 10.1146/annurev-astro-082812-141031
- Mazzali et al. (2005a) Mazzali, P. A., Benetti, S., Stehle, M., et al. 2005a, MNRAS, 357, 200, doi: 10.1111/j.1365-2966.2005.08640.x
- Mazzali et al. (1995) Mazzali, P. A., Danziger, I. J., & Turatto, M. 1995, A&A, 297, 509
- Mazzali et al. (2007) Mazzali, P. A., Röpke, F. K., Benetti, S., & Hillebrandt, W. 2007, Science, 315, 825, doi: 10.1126/science.1136259
- Mazzali et al. (2005b) Mazzali, P. A., Benetti, S., Altavilla, G., et al. 2005b, ApJ, 623, L37, doi: 10.1086/429874
- McCully et al. (2014) McCully, C., Jha, S. W., Foley, R. J., et al. 2014, ApJ, 786, 134, doi: 10.1088/0004-637X/786/2/134
- Mould et al. (2000) Mould, J. R., Huchra, J. P., Freedman, W. L., et al. 2000, ApJ, 529, 786, doi: 10.1086/308304
- Nomoto (1982) Nomoto, K. 1982, ApJ, 253, 798, doi: 10.1086/159682
- Nomoto et al. (1997) Nomoto, K., Iwamoto, K., & Kishimoto, N. 1997, Science, 276, 1378, doi: 10.1126/science.276.5317.1378
- Pereira et al. (2013) Pereira, R., Thomas, R. C., Aldering, G., et al. 2013, A&A, 554, A27, doi: 10.1051/0004-6361/201221008
- Perlmutter et al. (1999) Perlmutter, S., Aldering, G., Goldhaber, G., et al. 1999, ApJ, 517, 565, doi: 10.1086/307221
- Phillips (1993) Phillips, M. M. 1993, ApJ, 413, L105, doi: 10.1086/186970
- Phillips et al. (1999) Phillips, M. M., Lira, P., Suntzeff, N. B., et al. 1999, AJ, 118, 1766, doi: 10.1086/301032
- Piro & Morozova (2016) Piro, A. L., & Morozova, V. S. 2016, ApJ, 826, 96, doi: 10.3847/0004-637X/826/1/96
- Plewa et al. (2004) Plewa, T., Calder, A. C., & Lamb, D. Q. 2004, ApJ, 612, L37, doi: 10.1086/424036
- Riess et al. (1998) Riess, A. G., Filippenko, A. V., Challis, P., et al. 1998, AJ, 116, 1009, doi: 10.1086/300499
- Roming et al. (2005) Roming, P. W. A., Kennedy, T. E., Mason, K. O., et al. 2005, Space Sci. Rev., 120, 95, doi: 10.1007/s11214-005-5095-4
- Sasdelli et al. (2014) Sasdelli, M., Mazzali, P. A., Pian, E., et al. 2014, MNRAS, 445, 711, doi: 10.1093/mnras/stu1777
- Scalzo et al. (2010) Scalzo, R. A., Aldering, G., Antilogus, P., et al. 2010, ApJ, 713, 1073, doi: 10.1088/0004-637X/713/2/1073
- Schlegel et al. (1998) Schlegel, D. J., Finkbeiner, D. P., & Davis, M. 1998, ApJ, 500, 525, doi: 10.1086/305772
- Silverman & Filippenko (2012) Silverman, J. M., & Filippenko, A. V. 2012, MNRAS, 425, 1917, doi: 10.1111/j.1365-2966.2012.21276.x
- Sim et al. (2010) Sim, S. A., Röpke, F. K., Hillebrandt, W., et al. 2010, ApJ, 714, L52, doi: 10.1088/2041-8205/714/1/L52
- Smitka et al. (2015) Smitka, M. T., Brown, P. J., Suntzeff, N. B., et al. 2015, ApJ, 813, 30, doi: 10.1088/0004-637X/813/1/30
- Stritzinger & Leibundgut (2005) Stritzinger, M., & Leibundgut, B. 2005, A&A, 431, 423, doi: 10.1051/0004-6361:20041630
- Takase & Miyauchi-Isobe (1985) Takase, B., & Miyauchi-Isobe, N. 1985, Annals of the Tokyo Astronomical Observatory, 20, 335
- Taubenberger et al. (2011) Taubenberger, S., Benetti, S., Childress, M., et al. 2011, MNRAS, 412, 2735, doi: 10.1111/j.1365-2966.2010.18107.x
- Vinkó et al. (2018) Vinkó, J., Ordasi, A., Szalai, T., et al. 2018, PASP, 130, 064101, doi: 10.1088/1538-3873/aab258
- Wang et al. (2019) Wang, C.-J., Bai, J.-M., Fan, Y.-F., et al. 2019, Research in Astronomy and Astrophysics, 19, 149, doi: 10.1088/1674-4527/19/10/149
- Wang et al. (2006) Wang, X., Wang, L., Pain, R., Zhou, X., & Li, Z. 2006, ApJ, 645, 488, doi: 10.1086/504312
- Wang et al. (2008) Wang, X., Li, W., Filippenko, A. V., et al. 2008, ApJ, 675, 626, doi: 10.1086/526413
- Wang et al. (2009a) Wang, X., Filippenko, A. V., Ganeshalingam, M., et al. 2009a, ApJ, 699, L139, doi: 10.1088/0004-637X/699/2/L139
- Wang et al. (2009b) Wang, X., Li, W., Filippenko, A. V., et al. 2009b, ApJ, 697, 380, doi: 10.1088/0004-637X/697/1/380
- Webbink (1984) Webbink, R. F. 1984, ApJ, 277, 355, doi: 10.1086/161701
- Whelan & Iben (1973) Whelan, J., & Iben, Icko, J. 1973, ApJ, 186, 1007, doi: 10.1086/152565
- Yaron & Gal-Yam (2012) Yaron, O., & Gal-Yam, A. 2012, PASP, 124, 668, doi: 10.1086/666656
- Zhai et al. (2016) Zhai, Q., Zhang, J.-J., Wang, X.-F., et al. 2016, AJ, 151, 125, doi: 10.3847/0004-6256/151/5/125
- Zhang et al. (2015a) Zhang, J., Li, W., Mo, J., Wang, X., & Zhang, T. 2015a, The Astronomer’s Telegram, 7109, 1
- Zhang et al. (2014) Zhang, J.-J., Wang, X.-F., Bai, J.-M., et al. 2014, AJ, 148, 1, doi: 10.1088/0004-6256/148/1/1
- Zhang et al. (2016) Zhang, J.-J., Wang, X.-F., Sasdelli, M., et al. 2016, ApJ, 817, 114, doi: 10.3847/0004-637X/817/2/114
- Zhang et al. (2019) Zhang, T., Wang, X., Zhao, X., et al. 2019, ApJ, 872, 14, doi: 10.3847/1538-4357/aafacd
- Zhang et al. (2015b) Zhang, T.-M., Wang, X.-F., Chen, J.-C., et al. 2015b, Research in Astronomy and Astrophysics, 15, 215, doi: 10.1088/1674-4527/15/2/006
- Zhao et al. (2015) Zhao, X., Wang, X., Maeda, K., et al. 2015, ApJS, 220, 20, doi: 10.1088/0067-0049/220/1/20
Appendix A Photometry and spectroscopy data of SN 2015bq
| Star | (mag) | (mag) | (mag) | (mag) | (mag) |
|---|---|---|---|---|---|
| 1 | 18.10(04) | 18.16(03) | 17.49(02) | 17.10(02) | 16.74(04) |
| 2 | 14.46(02) | 14.52(01) | 14.23(02) | 14.18(01) | 14.08(03) |
| 3 | 17.39(04) | 17.70(02) | 17.22(03) | 16.99(02) | 16.71(04) |
| 4 | 16.27(02) | 15.26(04) | 14.05(02) | 13.37(02) | 12.71(02) |
| 5 | 17.90(04) | 18.22(02) | 17.68(02) | 17.34(04) | 16.99(02) |
| 6 | 15.39(02) | 15.14(02) | 14.38(03) | 13.97(01) | 13.57(02) |
| 7 | 18.41(02) | 18.14(04) | 17.31(02) | 16.80(01) | 16.33(02) |
| 8 | 16.57(02) | 15.53(02) | 14.15(02) | 13.13(01) | 12.12(03) |
| 9 | 17.99(05) | 17.17(03) | 15.80(04) | 14.77(02) | 13.72(04) |
| 10 | 18.46(05) | 17.70(03) | 16.65(03) | 15.97(01) | 15.51(04) |
Note. — See Figure 1 for the finder chart of SN 2015bq and the comparison stars. Uncertainties, in units of 0.01 mag, are 1.
| MJD | EpochaaReferring to the peak of band on March 03.12 2015, JD. 2457084.62. | U (mag) | B (mag) | V (mag) | R (mag) | I (mag) | Telescope |
|---|---|---|---|---|---|---|---|
| 57071.91 | -12.21 | 17.13(03) | 17.51(03) | 17.44(03) | 17.39(02) | 17.43(02) | LJT |
| 57072.9 | -11.22 | 16.86(08) | 17.27(03) | 17.23(03) | 17.17(03) | 17.30(03) | LJT |
| 57073.9 | -10.22 | 16.56(07) | 17.06(03) | 16.94(03) | 16.94(02) | 17.11(03) | LJT |
| 57074.81 | -9.31 | 16.39(16) | 16.91(04) | 16.82(04) | 16.83(03) | 16.94(03) | LJT |
| 57075.91 | -8.21 | 16.29(01) | 16.81(03) | 16.76(03) | 16.73(01) | 16.85(02) | LJT |
| 57076.78 | -7.34 | 16.19(02) | 16.72(03) | 16.65(03) | 16.64(02) | 16.80(02) | LJT |
| 57078.72 | -5.4 | 16.05(02) | 16.57(03) | 16.49(03) | 16.51(02) | 16.69(02) | LJT |
| 57078.92 | -5.2 | 16.12(11) | 16.55(04) | 16.43(04) | 16.42(02) | 16.67(03) | LJT |
| 57079.8 | -4.32 | 16.05(05) | 16.48(03) | 16.43(03) | 16.39(02) | 16.67(02) | LJT |
| 57081.68 | -2.44 | 16.02(03) | 16.42(03) | 16.33(03) | 16.29(03) | 16.64(03) | LJT |
| 57081.89 | -2.23 | 16.05(06) | 16.44(04) | 16.37(04) | 16.33(02) | 16.57(03) | LJT |
| 57082.66 | -1.46 | 16.36(04) | 16.26(04) | 16.30(05) | 16.59(03) | TNT | |
| 57082.81 | -1.31 | 15.98(04) | 16.39(05) | 16.33(05) | 16.26(03) | 16.63(02) | LJT |
| 57084.88 | 0.76 | 16.03(10) | 16.38(08) | 16.29(08) | 16.21(04) | 16.61(03) | LJT |
| 57087.93 | 3.81 | 16.18(11) | 16.43(07) | 16.29(07) | 16.20(04) | LJT | |
| 57088.75 | 4.63 | 16.24(07) | 16.45(05) | 16.30(05) | 16.21(02) | 16.60(02) | LJT |
| 57089.69 | 5.57 | 16.31(03) | 16.49(04) | 16.31(04) | 16.23(03) | 16.66(03) | LJT |
| 57090.71 | 6.59 | 16.43(03) | 16.55(03) | 16.32(03) | 16.24(02) | 16.73(02) | LJT |
| 57091.66 | 7.54 | 16.52(04) | 16.33(03) | 16.27(03) | 16.80(04) | TNT | |
| 57091.69 | 7.57 | 16.46(03) | 16.63(03) | 16.35(03) | 16.30(02) | 16.76(02) | LJT |
| 57092.7 | 8.58 | 16.54(03) | 16.67(02) | 16.39(02) | 16.36(03) | 16.87(02) | LJT |
| 57093.69 | 9.57 | 16.61(02) | 16.74(02) | 16.43(02) | 16.41(01) | 16.92(02) | LJT |
| 57093.82 | 9.7 | 16.74(02) | 16.39(03) | 16.40(03) | 16.90(04) | TNT | |
| 57094.66 | 10.54 | 16.76(03) | 16.38(02) | 16.39(04) | 16.92(03) | TNT | |
| 57094.67 | 10.55 | 16.69(05) | 16.77(02) | 16.44(02) | 16.41(02) | 16.89(03) | LJT |
| 57095.74 | 11.62 | 16.84(04) | 16.86(02) | 16.49(02) | 16.49(05) | 16.98(02) | LJT |
| 57096.81 | 12.69 | 16.90(07) | 16.92(03) | 16.53(03) | 16.55(01) | 17.02(02) | LJT |
| 57096.82 | 12.7 | 16.95(04) | 16.95(02) | 16.53(02) | 16.52(01) | 16.92(01) | LJT |
| 57097.69 | 13.57 | 17.01(03) | 17.06(02) | 16.60(02) | 16.57(01) | 17.02(02) | LJT |
| 57098.69 | 14.57 | 17.14(02) | 17.14(01) | 16.66(01) | 16.62(01) | 17.08(01) | LJT |
| 57099.7 | 15.58 | 17.27(06) | 17.20(05) | 16.73(05) | 16.68(03) | 17.06(03) | LJT |
| 57100.68 | 16.56 | 17.32(06) | 17.32(02) | 16.80(02) | 16.77(02) | 17.06(02) | LJT |
| 57101.7 | 17.58 | 17.47(09) | 17.39(05) | 16.81(05) | 16.82(01) | 17.01(05) | LJT |
| 57102.76 | 18.64 | 17.55(06) | 17.56(03) | 16.92(03) | 16.86(02) | 17.01(03) | LJT |
| 57103.76 | 19.64 | 17.83(05) | 17.72(06) | 16.96(06) | 16.85(03) | 16.98(03) | LJT |
| 57104.68 | 20.56 | 17.79(09) | 17.78(04) | 17.02(04) | 16.84(02) | 16.96(05) | LJT |
| 57105.68 | 21.56 | 17.85(03) | 17.15(04) | 16.91(02) | 17.01(04) | TNT | |
| 57107.68 | 23.56 | 18.03(02) | 17.12(02) | 16.86(02) | 16.92(02) | LJT | |
| 57108.75 | 24.63 | 18.31(05) | 18.08(04) | 17.24(04) | 16.94(02) | 16.91(04) | LJT |
| 57110.72 | 26.6 | 18.38(06) | 18.16(06) | 17.30(06) | 16.93(04) | 16.95(06) | LJT |
| 57111.72 | 27.6 | 18.54(05) | 18.40(04) | 17.37(04) | 16.88(02) | 16.95(04) | LJT |
| 57112.81 | 28.69 | 18.64(12) | 18.48(08) | 17.51(08) | 16.94(04) | 16.91(12) | LJT |
| 57115.73 | 31.61 | 18.71(03) | 17.58(03) | 17.04(02) | 17.03(03) | LJT | |
| 57119.67 | 35.55 | 17.85(07) | 17.37(07) | 17.15(05) | TNT | ||
| 57119.77 | 35.65 | 18.87(03) | 17.67(03) | 17.27(02) | 17.20(04) | LJT | |
| 57120.68 | 36.56 | 18.92(03) | 17.79(03) | 17.36(01) | 17.25(05) | LJT | |
| 57122.74 | 38.62 | 19.01(01) | 17.88(01) | 17.44(03) | 17.31(02) | LJT | |
| 57124.71 | 40.59 | 19.04(04) | 17.95(04) | 17.56(04) | 17.39(02) | LJT | |
| 57126.82 | 42.7 | 19.09(04) | 18.03(04) | 17.71(03) | 17.58(03) | LJT | |
| 57128.71 | 44.59 | 19.10(03) | 18.11(03) | 17.79(02) | 17.64(02) | LJT | |
| 57129.71 | 45.59 | 19.13(02) | 18.16(02) | 17.82(01) | 17.68(01) | LJT | |
| 57132.78 | 48.66 | 19.16(03) | 18.23(02) | 17.91(01) | 17.83(02) | LJT | |
| 57133.75 | 49.63 | 19.23(07) | 18.27(04) | 18.00(05) | 17.87(05) | TNT | |
| 57135.64 | 51.52 | 19.25(06) | 18.31(04) | 17.98(05) | 17.96(05) | TNT | |
| 57135.78 | 51.66 | 19.19(04) | LJT | ||||
| 57139.74 | 55.62 | 19.24(04) | 18.38(04) | 18.11(01) | 18.05(04) | LJT | |
| 57142.76 | 58.64 | 19.29(03) | 18.42(04) | 18.16(03) | 18.22(02) | LJT | |
| 57143.75 | 59.63 | 19.24(03) | 18.46(03) | 18.14(02) | 18.24(04) | LJT | |
| 57145.47 | 61.35 | 19.29(02) | 18.49(03) | 18.36(01) | 18.31(03) | LJT | |
| 57149.64 | 65.52 | 19.35(02) | 18.57(02) | 18.37(01) | 18.49(05) | LJT | |
| 57152.71 | 68.59 | 19.39(02) | 18.64(02) | 18.46(01) | 18.54(02) | LJT | |
| 57154.64 | 70.52 | 19.52(06) | 18.72(06) | 18.56(07) | 18.67(10) | TNT | |
| 57157.7 | 73.58 | 19.43(03) | 18.75(02) | 18.64(01) | 18.71(03) | LJT | |
| 57161.71 | 77.59 | 19.45(03) | 18.79(03) | 18.69(02) | 18.87(04) | LJT | |
| 57162.67 | 78.55 | 19.49(02) | 18.84(03) | 18.73(01) | 18.92(04) | LJT | |
| 57164.73 | 80.61 | 19.49(03) | 18.88(02) | 19.06(05) | LJT | ||
| 57166.67 | 82.55 | 19.52(02) | 18.93(03) | 18.86(02) | 19.09(03) | LJT | |
| 57169.71 | 85.59 | 19.56(02) | 18.99(02) | 18.91(02) | 19.21(03) | LJT | |
| 57175.66 | 91.54 | 19.02(18) | 18.95(18) | 19.36(23) | TNT | ||
| 57182.67 | 98.55 | 19.23(03) | LJT | ||||
| 57190.62 | 106.5 | 19.91(09) | 19.46(08) | 19.41(15) | 19.99(26) | TNT | |
| 57190.67 | 106.55 | 19.73(04) | 19.37(03) | 19.34(03) | 19.98(05) | LJT |
Note. — Uncertainties, in units of 0.01 mag, are 1; MJD = JD - 2400000.5.
| MJD | EpochaaReferring to the peak of band on March 03.12 2015, JD. 2457084.62. | (mag) | (mag)bbThe uvm2 magnitudes are 3 limit. | (mag) | (mag) | (mag) | (mag) |
|---|---|---|---|---|---|---|---|
| 57068.9104 | -15.71 | 19.57 | 17.72(15) | 18.39(18) | |||
| 57069.3702 | -15.25 | 19.60 | 17.61(14) | 18.01(14) | |||
| 57070.4379 | -14.18 | 19.62(26) | 19.70 | 18.83(30) | 17.34(11) | 17.79(11) | 17.71(24) |
| 57071.4439 | -13.17 | 19.61(26) | 19.64 | 18.52(22) | 17.11(10) | 17.49(10) | 17.46(19) |
| 57072.5678 | -12.05 | 19.33(30) | 18.97 | 18.05(22) | 16.81(12) | 17.20(11) | 17.55(26) |
| 57074.3692 | -10.25 | 19.45(25) | 19.59 | 18.04(16) | 16.41(07) | 16.88(07) | 16.92(14) |
| 57075.3376 | -9.28 | 19.21(23) | 19.57 | 18.00(17) | 16.19(08) | 16.69(08) | 16.75(13) |
| 57079.4904 | -5.13 | 18.97(18) | 19.64 | 17.79(14) | 15.92(07) | 16.40(07) | 16.47(10) |
| 57081.967 | -2.65 | 18.90(21) | 19.46 | 17.80(17) | 15.86(08) | 16.27(07) | 16.28(11) |
| 57083.2353 | -1.38 | 18.80(26) | 19.06 | 17.59(19) | 15.93(10) | 16.29(09) | 16.22(14) |
| 57085.3893 | 0.77 | 18.98(17) | 19.66 | 17.86(14) | 16.08(07) | 16.26(06) | 16.29(10) |
| 57088.5759 | 3.96 | 19.06(18) | 19.70 | 17.93(14) | 16.29(07) | 16.41(06) | 16.26(09) |
| 57094.4055 | 9.79 | 18.50(21) | 16.77(08) | 16.61(07) | 16.39(10) | ||
| 57097.6882 | 13.07 | 18.85(28) | 17.16(10) | 16.91(07) | 16.59(11) | ||
| 57100.5955 | 15.98 | 17.60(13) | 17.27(09) | 16.87(13) | |||
| 57103.6473 | 19.03 | 18.02(18) | 17.51(10) | 16.98(15) | |||
| 57106.6416 | 22.02 | 18.15(21) | 17.84(13) | 17.24(19) |
Note. — Uncertainties, in units of 0.01 mag, are 1; MJD = JD - 2400000.5.
| UT Date | MJD | EpopchaaReferring to the peak of band on March 03.12 2015, JD. 2457084.62. | Res | range | Exp. Time | Airmass | Telescope |
|---|---|---|---|---|---|---|---|
| days | (Å ) | (Å) | (s) | (+Instrument) | |||
| Feb. 18 | 57071.93 | -12.19 | 18 | 3500-9100 | 1800 | 1.16 | LJT YFSOC |
| Feb. 20 | 57073.90 | -10.22 | 18 | 3500-9100 | 1800 | 1.09 | LJT YFSOC |
| Feb. 21 | 57074.84 | -9.28 | 18 | 3500-9100 | 1800 | 1.00 | LJT YFSOC |
| Feb. 22 | 57075.91 | -8.21 | 18 | 3500-9100 | 2700 | 1.14 | LJT YFSOC |
| Feb. 25 | 57078.89 | -5.23 | 18 | 3500-9100 | 1800 | 1.10 | LJT YFSOC |
| Feb. 28 | 57081.86 | -2.26 | 18 | 3500-8700 | 1800 | 1.05 | LJT YFSOC |
| Mar. 1 | 57082.77 | -1.35 | 18 | 3500-9100 | 2400 | 1.02 | LJT YFSOC |
| Mar. 7 | 57088.72 | 4.60 | 18 | 3500-9100 | 2400 | 1.09 | LJT YFSOC |
| Mar. 9 | 57090.72 | 6.60 | 18 | 3500-9100 | 2400 | 1.07 | LJT YFSOC |
| Mar. 10 | 57091.70 | 7.58 | 18 | 3500-9100 | 2400 | 1.10 | LJT YFSOC |
| Mar. 11 | 57092.72 | 8.60 | 18 | 3500-9100 | 2400 | 1.06 | LJT YFSOC |
| Mar. 12 | 57093.69 | 9.57 | 18 | 3500-9100 | 2400 | 1.14 | LJT YFSOC |
| Mar. 14 | 57095.71 | 11.59 | 18 | 3500-9100 | 2400 | 1.06 | LJT YFSOC |
| Mar. 18 | 57099.71 | 15.59 | 18 | 3500-9100 | 2400 | 1.04 | LJT YFSOC |
| Mar. 21 | 57102.72 | 18.60 | 18 | 3500-9100 | 2700 | 1.01 | LJT YFSOC |
| Mar. 24 | 57105.61 | 21.49 | 27 | 3800-8800 | 2700 | 1.07 | XLT BFSOC |
| Mar. 28 | 57108.94 | 24.82 | 18 | 3500-9100 | 1520 | 1.00 | LJT YFSOC |
| Apr. 3 | 57115.75 | 31.63 | 18 | 3500-9100 | 2700 | 1.02 | LJT YFSOC |
| Apr. 8 | 57120.72 | 36.60 | 18 | 3500-9100 | 3000 | 1.01 | LJT YFSOC |
| Apr. 14 | 57126.83 | 42.71 | 18 | 3600-9100 | 3000 | 1.44 | LJT YFSOC |
| Apr. 20 | 57132.79 | 48.67 | 18 | 3500-9100 | 3000 | 1.27 | LJT YFSOC |
| May 10 | 57152.75 | 68.63 | 18 | 3620-9100 | 1500 | 1.39 | LJT YFSOC |
| May 11 | 57153.75 | 69.63 | 49 | 3770-8700 | 2400 | 1.40 | LJT YFSOC |
| May 22 | 57164.67 | 80.55 | 49 | 3600-8750 | 1415 | 1.14 | LJT YFSOC |