Identifying Incorrect Classifications with Balanced Uncertainty
Bolian Li Zige Zheng Changqing Zhang Tianjin University The Chinese University of Hong Kong, Shenzhen Tianjin University
Abstract
Uncertainty estimation is critical for cost-sensitive deep-learning applications (i.e. disease diagnosis). It is very challenging partly due to the inaccessibility of uncertainty groundtruth in most datasets. Previous works proposed to estimate the uncertainty from softmax calibration, Monte Carlo sampling, subjective logic and so on. However, these existing methods tend to be over-confident about their predictions with unreasonably low overall uncertainty, which originates from the imbalance between positive (correct classifications) and negative (incorrect classifications) samples. For this issue, we firstly propose the distributional imbalance to model the imbalance in uncertainty estimation as two kinds of distribution biases, and secondly propose Balanced True Class Probability () framework, which learns an uncertainty estimator with a novel Distributional Focal Loss () objective. Finally, we evaluate the in terms of failure prediction and out-of-distribution (OOD) detection on multiple datasets. The experimental results show that outperforms other uncertainty estimation methods especially in identifying incorrect classifications.
1 Introduction
Deep learning has fundamentally changed the way we co-operate with computing devices. Deep-learning-based applications have emerged into a variety of fields, including computer vision (Forsyth and Ponce, 2012), natural language processing (Deng and Liu, 2018) and data mining (Han et al., 2011). However, in some risk-sensitive applications, deploying traditional deep-learning models may bring disastrous outcomes since their predictions are not trustworthy (Floridi, 2019), such as disease diagnosis (Ao et al., 2020), automatic driving (Yasunobu and Sasaki, 2003) and robotics (Davies, 2000). Deep-learning models need to be interpretable (Molnar, 2020) and trustworthy (Abdar et al., 2020). To this end, uncertainty estimation proposes to enable deep-learning models to be self-aware about their predictions. They provide estimated uncertainty for users to choose to trust or not to trust the predictions. The recent uncertainty estimation methods propose to obtain the uncertainty scores from softmax calibration (Hendrycks and Gimpel, 2016), Monte Carlo sampling (Gal and Ghahramani, 2016) and subjective logic (Şensoy et al., 2018).
However, there is one limitation for current uncertainty estimation methods. These models tend to be overly confident about all predictions (provide unreasonably low overall uncertainty), even for the incorrect predictions (Mukhoti et al., 2020). For this issue, we conduct analytical experiments on the origin of this problem, and find that the imbalance problem (He and Garcia, 2009) is the primary cause. We also noticed that the traditional imbalance problem as mentioned in (He and Garcia, 2009) is based on classification task and is modeled with discrete mathematical forms, while in uncertainty estimation, the observed imbalance problem is between correct classifications (with continual low uncertainty groundtruth) and incorrect classifications (with continual high uncertainty groundtruth), which is based on regression task. For this issue, we propose the distributional imbalance to accurately model the imbalance problem in uncertainty estimation, which presents two kinds of distribution biases in the uncertainty distribution. Then, we propose the Balanced True Class Probability () framework to learn an uncertainty estimator on the Distributional Focal Loss () objective adapted from Focal Loss (FL, Lin et al. (2017)), which calibrates the uncertainty distribution by end-to-end training. Finally, we evaluate the in terms of failure prediction and out-of-distribution (OOD) detection on multiple datasets. The experimental results show that achieves the state-of-the-art performance, and outperforms other uncertainty estimation methods in identifying incorrect classifications.
The main contributions of this paper are summarized as follows:
-
•
We propose the distribution imbalance to model the imbalance problem in uncertainty estimation, presenting two kinds of distribution biases in the uncertainty distribution.
-
•
We propose the Balanced True Class Probability () framework to learn an uncertainty estimator in end-to-end training on a novel Distributional Focal Loss () objective.
-
•
We evaluate our model in terms of failure prediction and out-of-distribution (OOD) detection on various datasets. Our model achieves the state-of-the-art performance.
The rest of the paper is organized as: related works (Sec 2), preliminary (Sec 3), the introduction of distributional imbalance (Sec 4), the framework (Sec 5), experiments (Sec 6), and finally the conclusion and future work (Sec 7).
2 Related Works
In this section, we review the related works, including uncertainty estimation (Sec 2.1) and imbalanced learning (Sec 2.2).
2.1 Uncertainty Estimation
Uncertainty estimation is a critical topic with long history. Blatz et al. (2004) summarized traditional methods which are not based on deep learning. Abdar et al. (2020) summarized the techniques, applications and challenges of uncertainty estimation. Recently, MCP (Hendrycks and Gimpel, 2016) has become a widely used baseline by viewing the maximal value of softmax distribution as confidence. Probabilistic methods with Bayesian modeling obtain the uncertainty by post-process, such as Bayesian neural network (Blundell et al., 2015), Monte-Carlo dropout (Gal and Ghahramani, 2016), prior networks (Malinin and Gales, 2018) and variational inference (Posch et al., 2019). Subjective logic (Şensoy et al., 2018) employs evidence theory to obtain the uncertainty from Dirichlet distribution. Another approach of uncertainty estimation is based on deep regression, such as TCP (Corbière et al., 2019). Moon et al. (2020) developed a new form of loss function to regularize class probabilities for uncertainty estimation.
2.2 Imbalanced Learning
The imbalance problem is summarized in Han et al. (2005). threshold-moving proposed to adjust the decision threshold adaptively. Liu et al. (2008) introduced an under-sampling method with ensemble model. Han et al. (2005) developed an over-sampling way via data interpolation. Both of them concentrated on rebuilding balanced training data. Lin et al. (2017) raised the significance of the scarce classes by applying low weights to the classes with massive samples. Shrivastava et al. (2016) raised the significance of the scarce classes by applying high weights to the classes with few samples.
3 Preliminary
In this section, we introduce the concepts and definitions of uncertainty in section 3.1 and illustrate the task of failure prediction in section 3.2.
3.1 Uncertainty in Deep Learning
Uncertainty in deep learning is the extent to which predictions cannot be trusted. The source of uncertainty is 2-fold: data uncertainty and knowledge uncertainty (Abdar et al., 2020). There are multiple definitions of uncertainty (Malinin and Gales, 2018; Corbière et al., 2019; Koh and See, 1994). In this paper, we define uncertainty as real number that is complementary with the confidence score, which holds:
| (1) |
where and are the uncertainty and confidence of a prediction respectively. Moreover, we obtain the uncertainty groundtruth by TCP (Corbière et al., 2019), which uses the class probability of the labeled class as confidence score:
| (2) |
where and are the predicted and labeled class probability vectors respectively.
3.2 Failure Prediction
Failure prediction aims at evaluating the ability for the neural network to recognize when its predictions are wrong (Corbière et al., 2019). The classification results of a neural network are the groundtruth of failure prediction. The uncertainty is used to predict whether the classification result is correct. When uncertainty is lower than a given threshold: , it is predicted as correct classification (positive), and when , it is predicted as incorrect classification (negative). The evaluation of failure prediction is based on 4 pairs of conditions (i.e. true positive, false positive, false negative and true negative), which are shown in the confusion matrix in table 1.
| uncertainty | correct classification | incorrect classification |
|---|---|---|
| true positive (TP) | false positive (FP) | |
| false negative (FN) | true negative (TN) |
4 Distributional Imbalance
In this section, we introduce the concept of distributional imbalance in section 4.1 and provide visual illustration for it in section 4.2.
4.1 Concept of Distributional Imbalance
The traditional classificatory imbalance (He and Garcia, 2009) is based on classification task, in which the different numbers of samples in different classes are the primary cause. We propose the distributional imbalance to accurately model the imbalance problem in uncertainty estimation, considering the continuity of uncertainty scores. Specifically, the imbalanced uncertainty distribution of a neural network would have such 2 kinds of distribution biases:
-
•
The means of uncertainty distribution would be low. This is because the uncertainty groundtruth is dominated by massive correct classifications and would be over-fitted on the low uncertainty groundtruth.
-
•
The standard deviation of uncertainty distribution would be low. This is due to the unreasonably low overall uncertainty scores, and would lead to the difficulty in distinguishing between easy and hard samples by uncertainty.
The above distribution biases are visualized in figure 2, where the red distribution suffers from these 2 kinds of biases. Besides, our proposed objective () aims at adjusting the uncertainty distribution from the red one to the blue one. The demonstration of distributional imbalance on real-world datasets is shown in section 4.2.
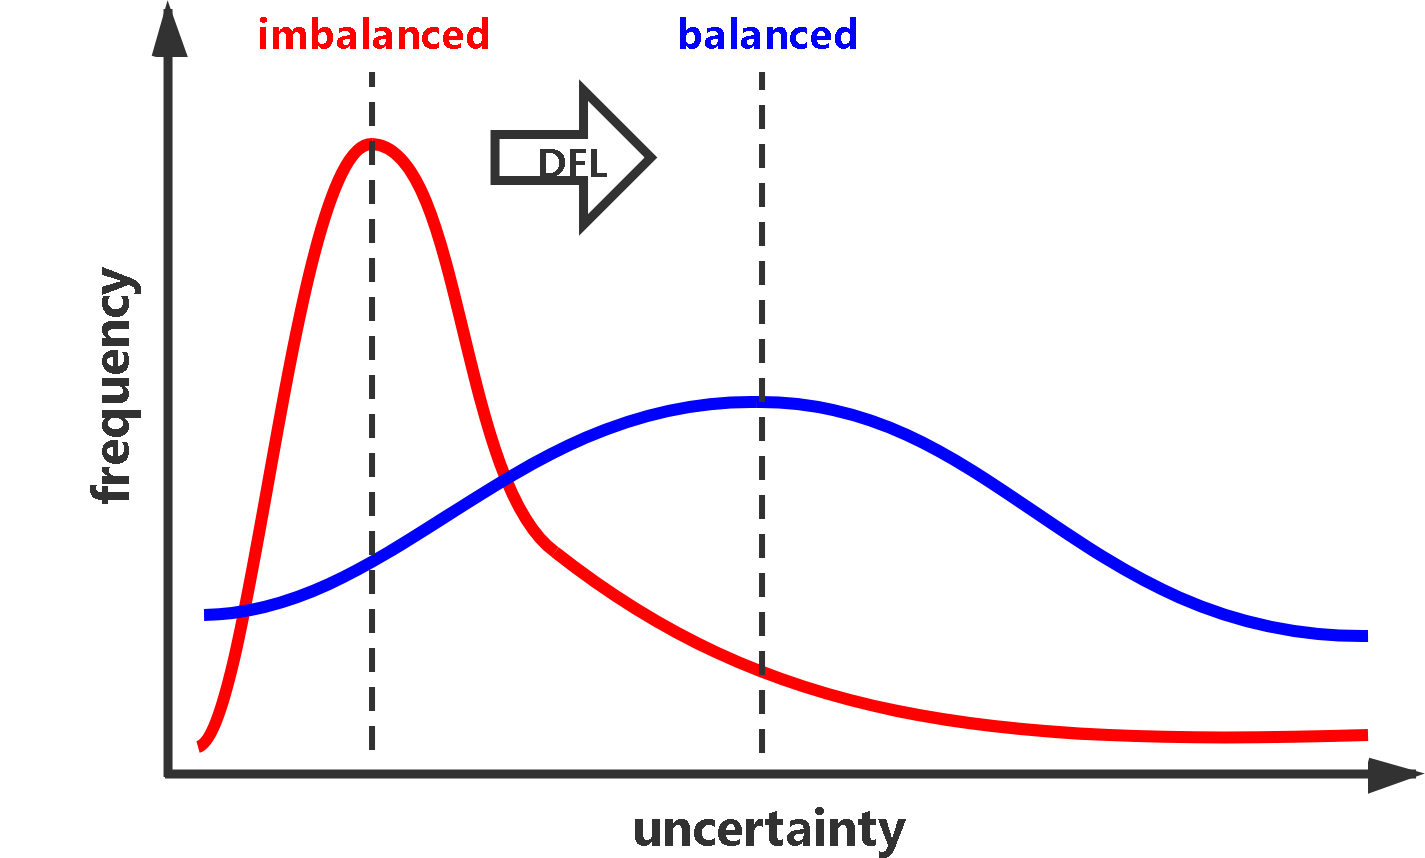
The harm of distributional imbalance is that, estimated uncertainty tends to be low even for incorrect classifications. It would cause the neural network to give wrong predictions confidently, which is unacceptable in some risk-sensitive applications like disease diagnosis (Ao et al., 2020).
4.2 Visualization of Distributional Imbalance
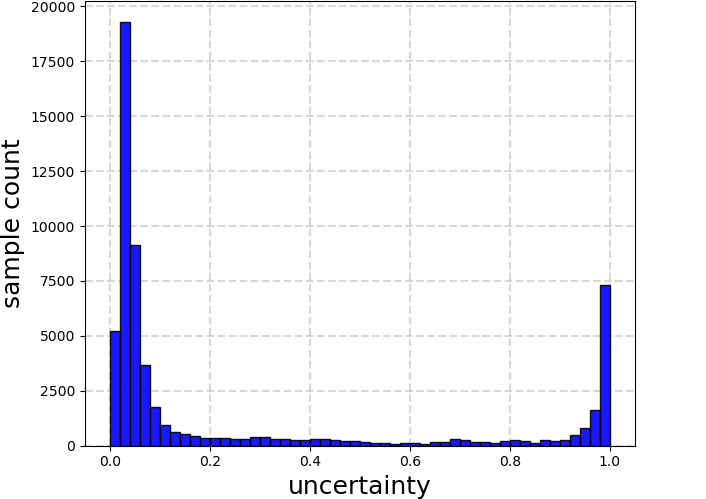
First, we visualize the TCP uncertainty scores (Eq.2) on Fashion-MNIST with the uncertainty histogram (50 bins, shown in Fig.3). The uncertainty scores are distributed just as what we talked in section 4.1. The real-world uncertainty distribution suffers from the distributional imbalance with low means and standard deviation.
Second, we visualize the false positive rate (FPR) and false negative rate (FNR) of 4 methods in figure 4. The FPR is used to measure how likely incorrect classifications are viewed as correct ones, which is computed by
| (3) |
and FNR is used to measure how likely correct classifications are viewed as incorrect ones, which is computed by
| (4) |
Here, and are the recall ratios of correct classification and incorrect classification respectively. We train each model for totally 20 epochs and make a checkpoint at each epoch. The evaluated FPRs and FNRs are based on uncertainty obtained from each checkpoint. Generally, the TCP suffers from high FPR, which is the consequence of distributional imbalance.
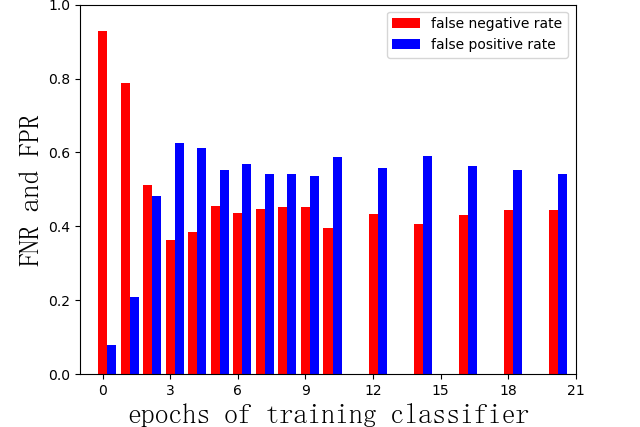
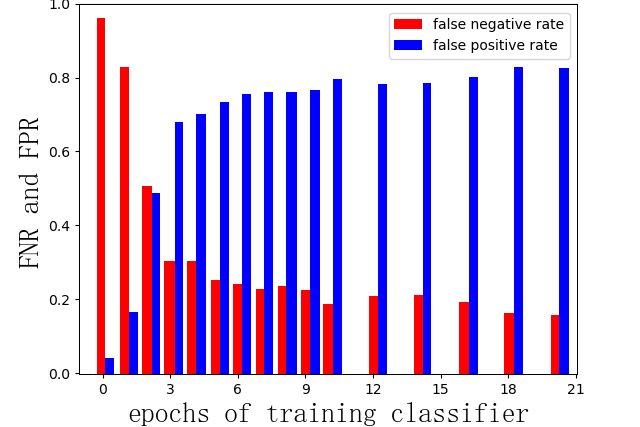
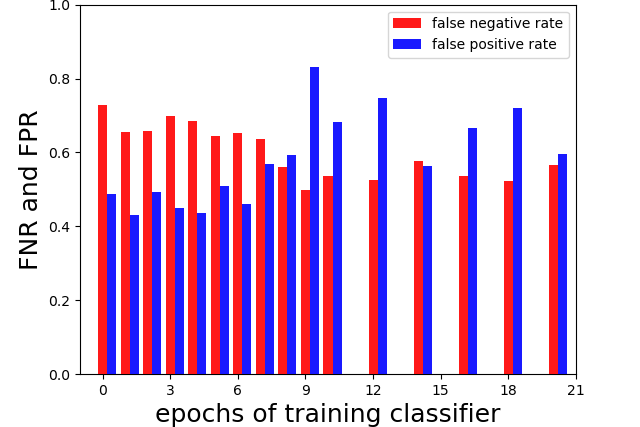
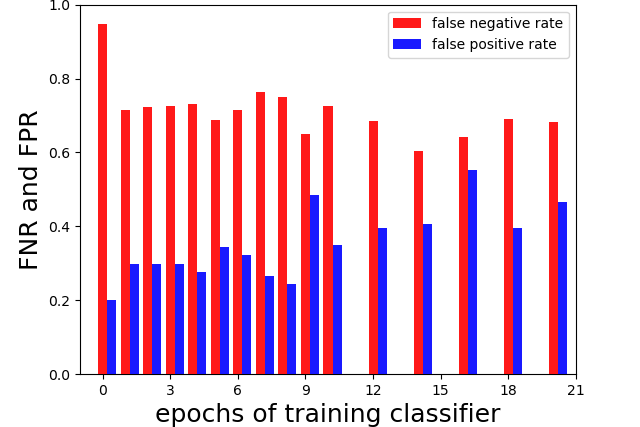
Moreover, the other 3 methods (, thresholding and OHEM Loss (Shrivastava et al., 2016)) all consider the imbalance problem in uncertainty estimation. Among them, our proposed outperforms OHEM Loss woth lower FPR, and has better overall performance compared to thresholding with averagely lower FNR and FPR.
5 Method
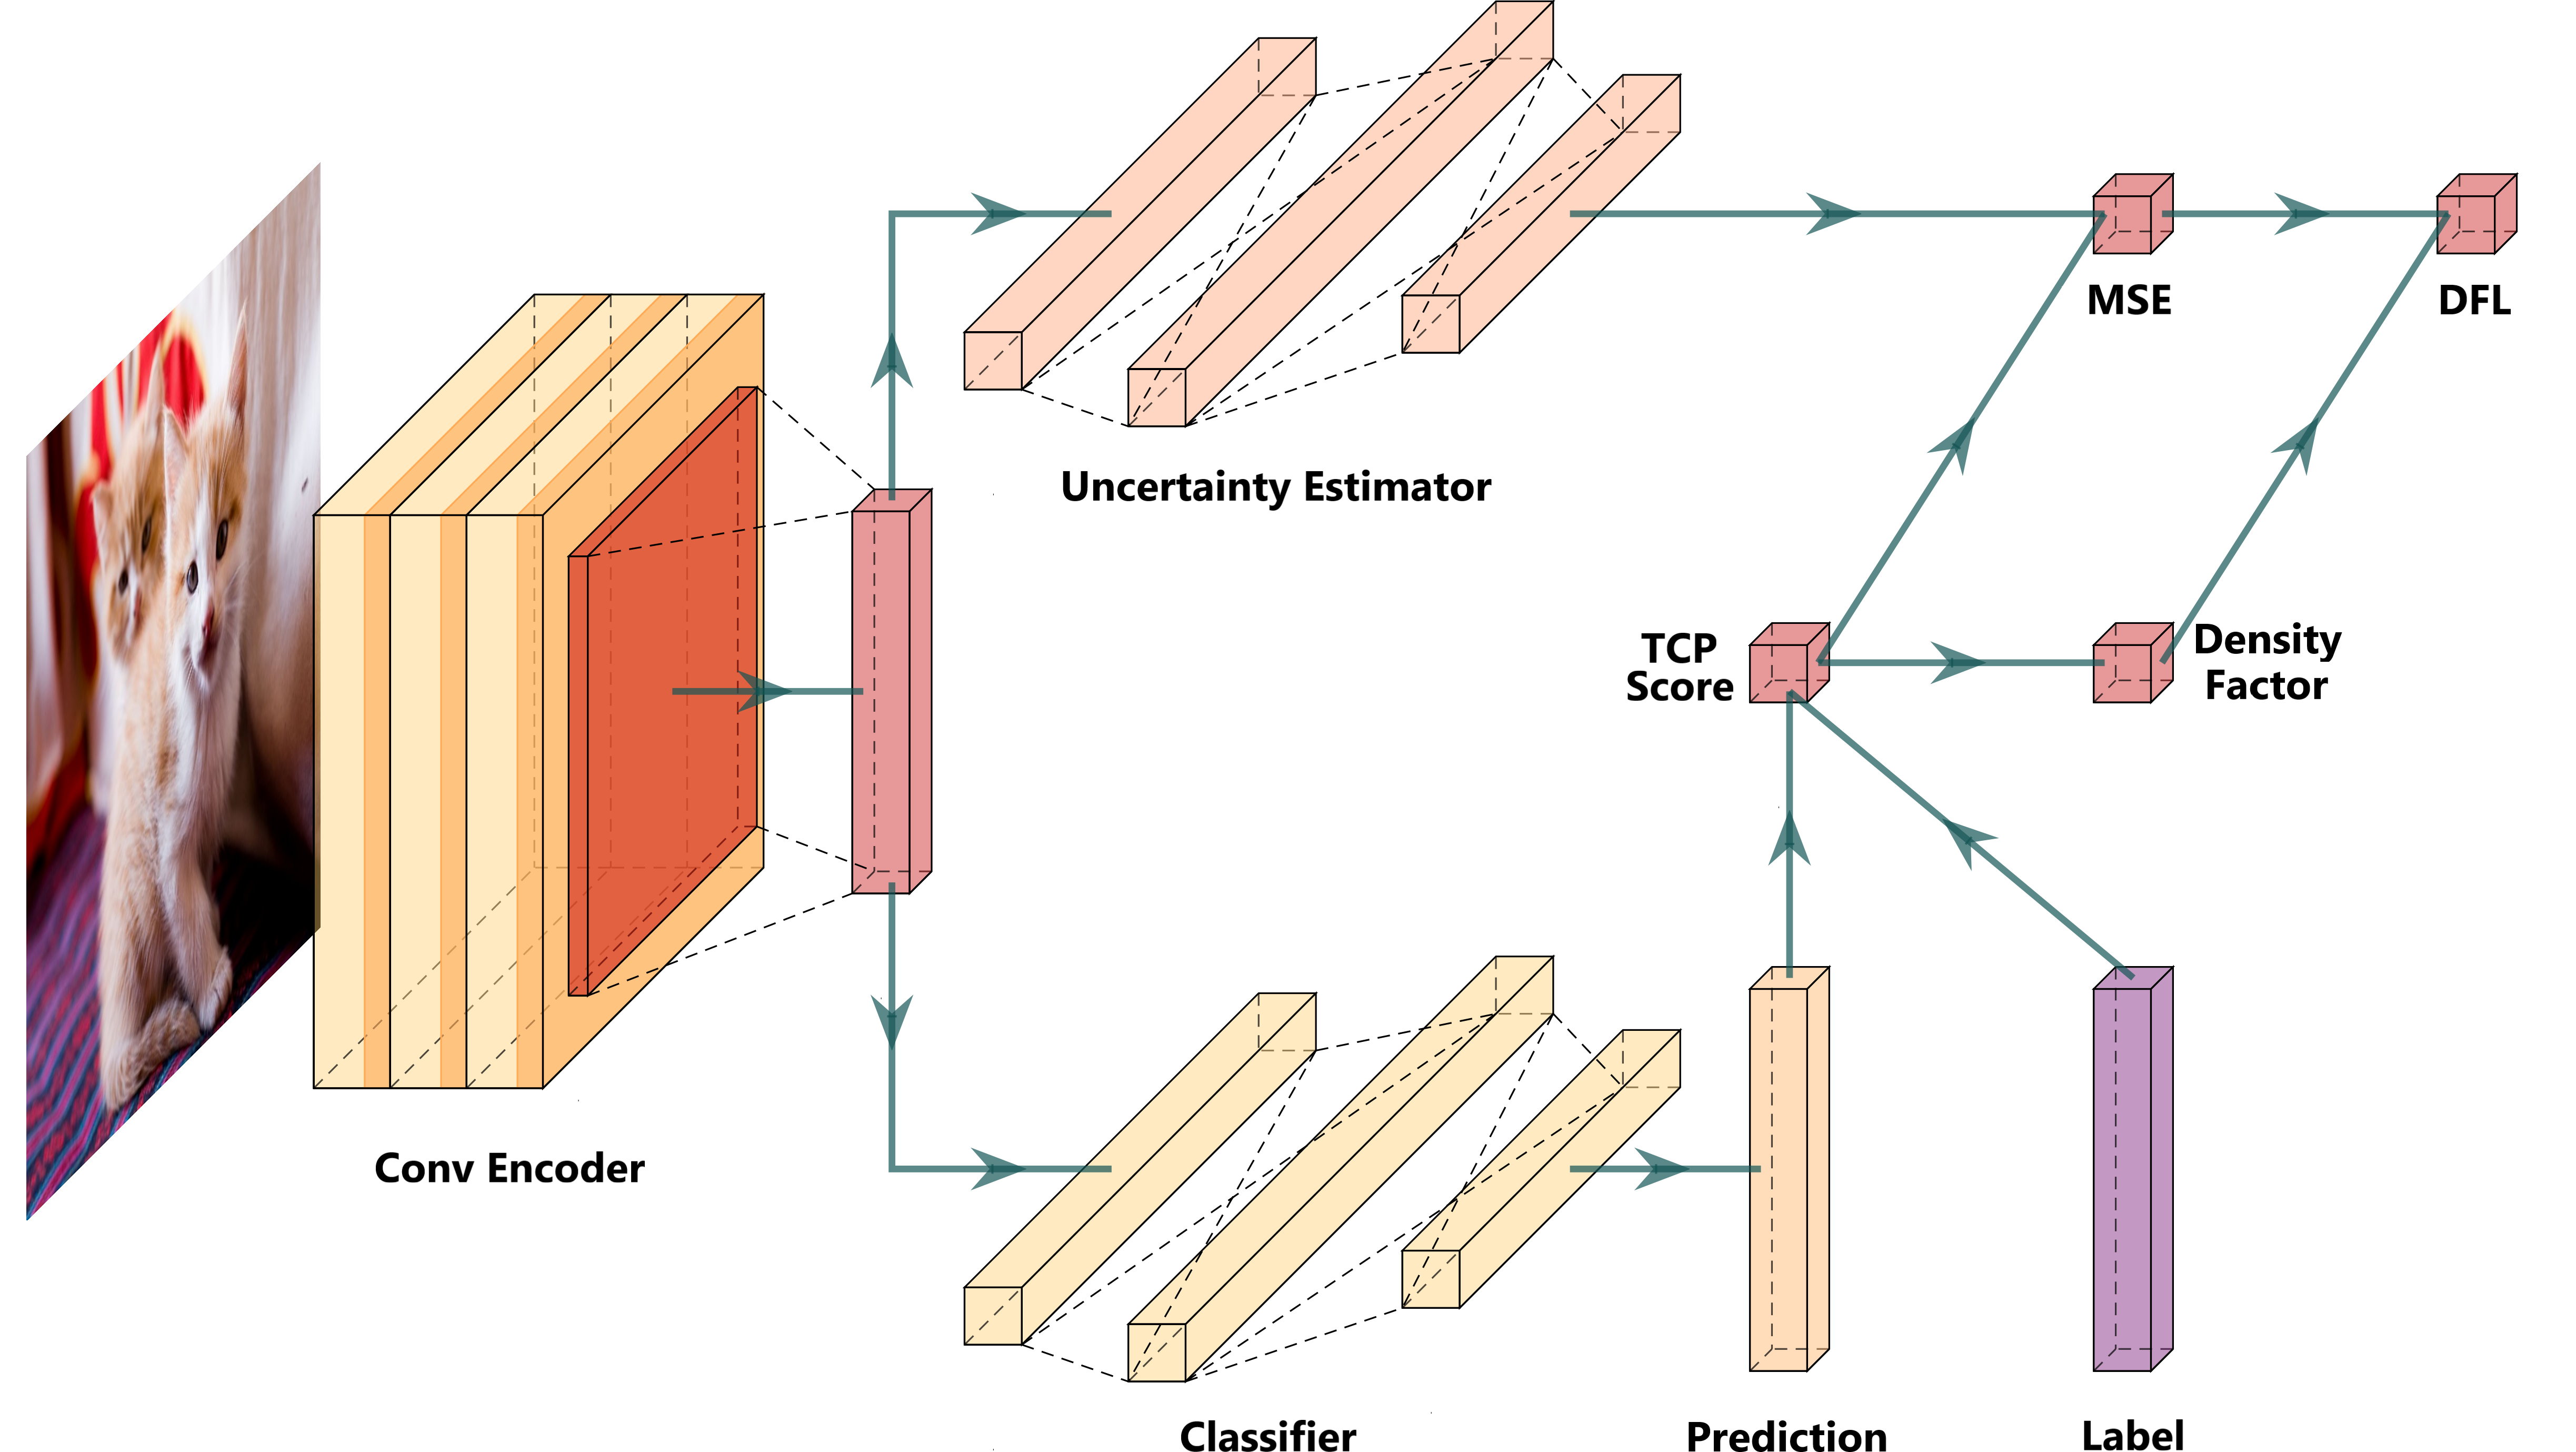
In this section, we propose a novel Distributional Focal Loss (DFL) in section 5.1 and introduce the training scheme of uncertainty estimator in section 5.2. Our discussion about objective and training process are based on the framework in figure 1.
5.1 Distributional Focal Loss
Previous work. To address the imbalance problem in classification tasks, Lin et al. (2017) proposed Focal Loss (FL) to adaptively reweight the CrossEntropy objective based on different class volumes. It is defined as
| (5) |
where is the predicted probability of the -th class, and is a fixed hyperparameter controlling the sensitivity of reweighting. This objective eliminates the imbalance originating from different class volumes.
Motivation. We are inspired by FL and are motivated to adapt the FL to uncertainty estimation. Given that uncertainty estimation is inherently a kind of regression tasks, and that it suffers from the distributional imbalance (see Sec 4), we propose a novel Distributional Focal Loss () objective and argue that:
-
•
First, we should employ the classic Mean Squared Error (MSE, Wang and Bovik (2009)) to compute the unweighted losses of all uncertainty scores, since uncertainty estimation is a kind of regression tasks.
-
•
Second, we should adjust the unweighted losses by a density factor similar to Eq.5. We use the density factor to measure the local frequency of given uncertainty scores in the uncertainty distribution.
Formulation. Following the above motivations, we define the objective as:
| (6) |
where is the estimated uncertainty score and is the groundtruth (TCP score). is a small continual subset centering at : , consisting of samples with similar uncertainty. The relative volume of this subset (or density factor): , is a rational approximation of local frequency in the uncertainty distribution. The objective can lead the neural network to focus less on the massive low uncertainty groundtruth, which originates from too many correct classifications.
5.2 Learning Uncertainty Estimator
We train the framework to learn a balanced uncertainty estimator following the training scheme of Corbière et al. (2019). First, we train the classifier on CrossEntropy objective with class labels. Second, we train the uncertainty estimator on objective with uncertainty groundtruth (TCP scores). Finally, we fine-tune the entire model by carrying out the above 2 steps simultaneously. The training process of is summarized in algorithm 1.
6 Experiments
In this section, we conduct experiments to evaluate the framework in failure prediction and out-of-distribution (OOD) detection on multiple datasets. We list the specifications of experiments in section 6.1, and provide detailed quantitative and visual results in section 6.2 and section 6.3 respectively. Our code is available at https://github.com/lblaoke/balanced-TCP
6.1 Experimental Setup
Datasets. For comprehensive and fair comparison with other uncertainty estiamtion methods, we use 5 real-world image datasets:
-
•
CIFAR-10 and CIFAR-100111http://www.cs.toronto.edu/~kriz/cifar.html consist of 60000 32x32 colour images. There are 50000 training images and 10000 test images (Krizhevsky, 2009).
-
•
SVHN222http://ufldl.stanford.edu/housenumbers/ is a real-world image dataset for developing machine learning and object recognition algorithms, obtained from house numbers in Google Street View images (Netzer et al., 2011).
-
•
MNIST333http://yann.lecun.com/exdb/mnist/ is a database of handwritten digits, and has a training set of 60000 examples, and a test set of 10000 examples (LeCun, 1998).
-
•
Fashion-MNIST444https://github.com/zalandoresearch/fashion-mnist is a dataset consisting of a training set of 60000 examples and a test set of 10000 examples. Each example is a 28x28 grayscale image, associated with a label from 10 classes (Xiao et al., 2017).
Metrics. For failure prediction, we evaluate models on balanced accuracy (BACC, Brodersen et al. (2010)), the area under curve (AUC, McClish (1989)) and false positive rate (FPR, defined in Eq.3). Specifically, BACC is computed by the average of recall obtained on each class:
| (7) | ||||
where and are the recall ratios of correct classification and incorrect classification respectively.
For OOD detection, we evaluate models on accuracy (ACC) and average uncertainty (AU). The larger AU a model has, the better it is since larger AU shows that this model is less likely to give low uncertainty to OOD data.
Compared methods. We compare the model with 2 sets of baseline methods: First, uncertainty estimation methods including MCP (Hendrycks and Gimpel, 2016), MCDropout (Gal and Ghahramani, 2016)), TrustScore (Jiang et al., 2018) and TCP (Corbière et al., 2019); second, imbalanced learning methods such as OHEM Loss (Shrivastava et al., 2016).
Implementation. The basic framework of is based on Corbière et al. (2019), which consists of a classifier, an uncertainty estimator and a shared encder (shown in Fig.1). To be specific, for all datasets, we build the encoder module on a series of convolutional layers. For classifier and uncertainty estimator, we build them both on fully connected layers. The details of network architecture are listed in the supplementary material. In evaluations, we evaluate each method on each metric for 5 times and report the average performances for fair comparison. We set the decision threshold as by default. Moreover, we recommend to set the hyperparameter following
| (8) |
where is the variance of uncertainty scores. It is rational since we need to make the objective in equation 6 sensitive when the variance of uncertainty distribution is low, which indicates strong distributional imbalance. The detailed deduction of equation 8 is listed in the supplementary material.
6.2 Quantitative Evaluations
Failure prediction. The quantitative results on failure prediction are shown in table 2. Our method achieves the state-of-the-art performance on each dataset for almost all metrics. Specifically, for datasets with complex visual details (i.e. SVHN), our method outperforms the others significantly, while for datasets with simple pixel-level details (i.e. Fashion-MNIST), our method outperforms the others slightly. This is due to the lack of complex visual details, which causes the classifier to give less incorrect classifications and therefore has negative effects on methods that do not consider imbalance problem in uncertainty estimation.
| Dataset | Metric | MCP | MCDropout | TrustScore | OHEM Loss | TCP | BTCP |
|---|---|---|---|---|---|---|---|
| CIFAR-10 | BACC | 64.32 | 78.62 | 78.21 | 78.00 | 71.93 | 78.80 |
| AUC | 84.23 | 89.08 | 88.47 | 85.71 | 85.60 | 89.09 | |
| FPR↓ | 10.62 | 9.02 | 5.70 | 2.13 | 7.72 | 2.01 | |
| CIFAR-100 | BACC | 72.86 | 75.78 | 74.70 | 77.14 | 77.51 | 77.80 |
| AUC | 85.67 | 86.09 | 84.17 | 87.17 | 86.28 | 88.07 | |
| FPR↓ | 7.20 | 4.68 | 4.74 | 3.53 | 3.19 | 3.11 | |
| SVHN | BACC | 61.26 | 84.55 | 85.35 | 80.27 | 83.86 | 87.97 |
| AUC | 93.20 | 92.85 | 92.16 | 90.60 | 93.44 | 93.66 | |
| FPR↓ | 8.66 | 5.60 | 3.74 | 1.16 | 2.41 | 0.67 | |
| MNIST | BACC | 85.54 | 89.33 | 90.52 | 87.16 | 90.75 | 91.52 |
| AUC | 97.13 | 97.15 | 97.52 | 97.29 | 97.83 | 97.33 | |
| FPR↓ | 3.80 | 2.26 | 3.00 | 0.52 | 0.34 | 0.26 | |
| Fashion-MNIST | BACC | 60.63 | 76.65 | 78.16 | 80.78 | 65.16 | 81.09 |
| AUC | 82.93 | 87.04 | 87.53 | 87.53 | 87.99 | 88.36 | |
| FPR↓ | 7.87 | 4.87 | 4.64 | 2.78 | 3.93 | 0.20 |
OOD detection. The quantitative results on OOD detection are shown in table 3. We use 4 pairs of in-distribution and OOD datasets. Our method () achieves the state-of-the-art performance on each dataset for almost all metrics. Such results show that the uncertainty of still performs well on traditional OOD detection tasks while having a balanced distribution.
| Dataset/OOD | CIFAR-10/SVHN | SVHN/CIFAR-10 | MNIST/Fashion-MNIST | Fashion-MNIST/MNIST | ||||
|---|---|---|---|---|---|---|---|---|
| Metric | ACC(%) | AU↑ | ACC(%) | AU↑ | ACC(%) | AU↑ | ACC(%) | AU↑ |
| MCP | 43.97 | 0.3652 | 43.56 | 0.3690 | 53.46 | 0.2745 | 38.42 | 0.2146 |
| MCDropout | 85.86 | 0.5056 | 74.28 | 0.4927 | 92.48 | 0.5147 | 46.09 | 0.3488 |
| TrustScore | 87.82 | 0.5919 | 79.38 | 0.5166 | 85.64 | 0.4168 | 42.78 | 0.3261 |
| OHEM Loss | 99.80 | 0.7056 | 85.93 | 0.6074 | 93.66 | 0.5826 | 51.97 | 0.4437 |
| TCP | 99.64 | 0.7190 | 75.18 | 0.5476 | 88.88 | 0.5434 | 47.09 | 0.4146 |
| BTCP | 99.83 | 0.7239 | 86.04 | 0.5823 | 99.56 | 0.8216 | 56.24 | 0.4789 |
6.3 Visual Evalutions
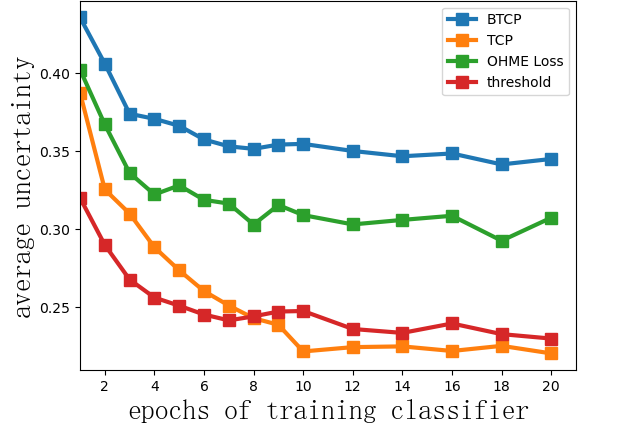
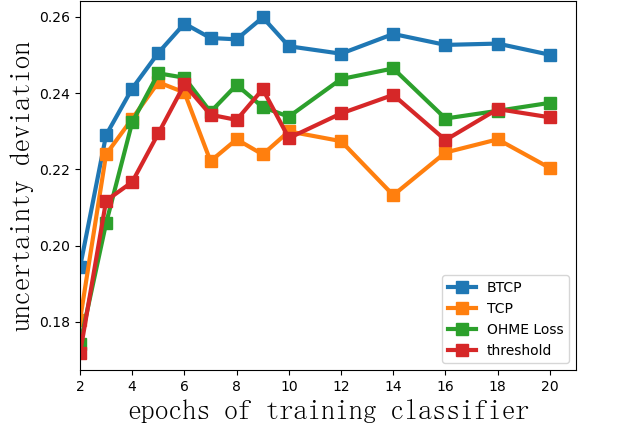
Uncertainty distribution. To show the effectiveness of in addressing distributional imbalance, we visualize the means and standard deviation of uncertainty distribution from 4 methods. We train 4 models on Fashion-MNIST for totally 20 epochs and make a checkpoint at each epoch. Then we obtain uncertainty scores based on these checkpoints. The uncertainty distribution of has higher means and standard deviation compared with the other 3 methods, which demonstrates that is the best method in addressing distributional imbalance.
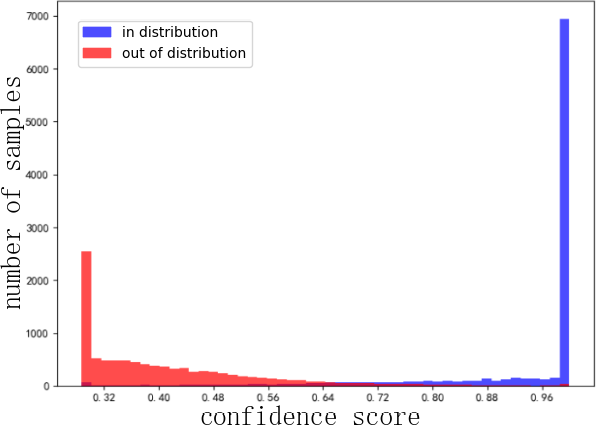
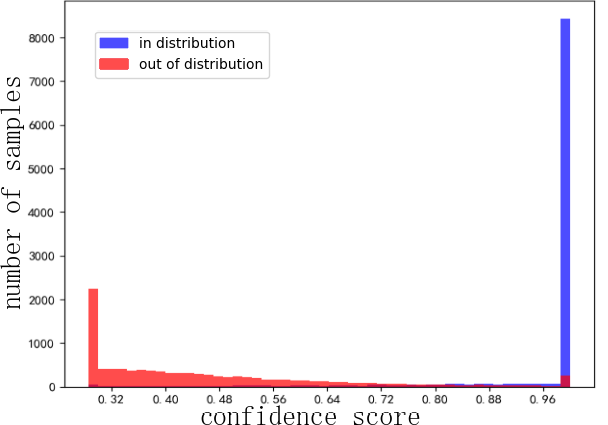
OOD confidence distribution. We also visualize the confidence distribution of OOD data (red) and in-distribution data (blue) from our method () and TCP (Corbière et al., 2019). The in-distribution and OOD datasets are MNIST and fashion-MNIST respectively. Our method outperforms TCP with lower overall confidence (higer overall uncertainty) in the OOD data and distinguishes more clearly between the in-distribution and OOD confidence distributions. Moreover, the in-distribution confidence of our method is also better since it is distributed more scattered and therefore more distinguishable for each sample.
7 Conclusion and Future Work
In this paper, we propose the Balanced True Class Probability () framework. We argue that the distributional imbalance between correct and incorrect classifications consists of two kinds of distribution biases, and is an inevitable problem for uncertainty estimation methods. We model uncertainty estimation as a regression task, propose to learn an uncertainty estimator to obtain the uncertainty scores, and propose to balance the objective for correct and incorrect classifications by a novel Distributional Focal Loss (). The experimental results verify the effectiveness of . Our future work will concentrate on introducing probabilistic modeling into the uncertainty estimator and attempting to estimate aleatoric and epistemic uncertainties in a separate way.
References
- Abdar et al. (2020) Moloud Abdar, Farhad Pourpanah, Sadiq Hussain, Dana Rezazadegan, Li Liu, Mohammad Ghavamzadeh, Paul Fieguth, Abbas Khosravi, U Rajendra Acharya, Vladimir Makarenkov, et al. A review of uncertainty quantification in deep learning: Techniques, applications and challenges. arXiv preprint arXiv:2011.06225, 2020.
- Ao et al. (2020) Chunyan Ao, Shunshan Jin, Hui Ding, Quan Zou, and Liang Yu. Application and development of artificial intelligence and intelligent disease diagnosis. Current pharmaceutical design, 26(26):3069–3075, 2020.
- Blatz et al. (2004) John Blatz, Erin Fitzgerald, George Foster, Simona Gandrabur, Cyril Goutte, Alex Kulesza, Alberto Sanchis, and Nicola Ueffing. Confidence estimation for machine translation. In Coling 2004: Proceedings of the 20th international conference on computational linguistics, pages 315–321, 2004.
- Blundell et al. (2015) Charles Blundell, Julien Cornebise, Koray Kavukcuoglu, and Daan Wierstra. Weight uncertainty in neural network. In International Conference on Machine Learning, pages 1613–1622. PMLR, 2015.
- Brodersen et al. (2010) Kay Henning Brodersen, Cheng Soon Ong, Klaas Enno Stephan, and Joachim M Buhmann. The balanced accuracy and its posterior distribution. In 2010 20th international conference on pattern recognition, pages 3121–3124. IEEE, 2010.
- Corbière et al. (2019) Charles Corbière, Nicolas Thome, Avner Bar-Hen, Matthieu Cord, and Patrick Pérez. Addressing failure prediction by learning model confidence. In 33rd Conference on Neural Information Processing Systems (NeurIPS 2019), pages 2898–2909. Curran Associates, Inc., 2019.
- Davies (2000) Brian Davies. A review of robotics in surgery. Proceedings of the Institution of Mechanical Engineers, Part H: Journal of Engineering in Medicine, 214(1):129–140, 2000.
- Deng and Liu (2018) Li Deng and Yang Liu. Deep learning in natural language processing. Springer, 2018.
- Floridi (2019) Luciano Floridi. Establishing the rules for building trustworthy ai. Nature Machine Intelligence, 1(6):261–262, 2019.
- Forsyth and Ponce (2012) David A Forsyth and Jean Ponce. Computer vision: a modern approach. Pearson,, 2012.
- Gal and Ghahramani (2016) Yarin Gal and Zoubin Ghahramani. Dropout as a bayesian approximation: Representing model uncertainty in deep learning. In international conference on machine learning, pages 1050–1059. PMLR, 2016.
- Han et al. (2005) Hui Han, Wen-Yuan Wang, and Bing-Huan Mao. Borderline-smote: a new over-sampling method in imbalanced data sets learning. In International conference on intelligent computing, pages 878–887. Springer, 2005.
- Han et al. (2011) Jiawei Han, Jian Pei, and Micheline Kamber. Data mining: concepts and techniques. Elsevier, 2011.
- He and Garcia (2009) Haibo He and Edwardo A Garcia. Learning from imbalanced data. IEEE Transactions on knowledge and data engineering, 21(9):1263–1284, 2009.
- Hendrycks and Gimpel (2016) Dan Hendrycks and Kevin Gimpel. A baseline for detecting misclassified and out-of-distribution examples in neural networks. arXiv preprint arXiv:1610.02136, 2016.
- Jiang et al. (2018) Heinrich Jiang, Been Kim, Melody Y Guan, and Maya R Gupta. To trust or not to trust a classifier. In NeurIPS, 2018.
- Koh and See (1994) Chan G Koh and LM See. Identification and uncertainty estimation of structural parameters. Journal of Engineering Mechanics, 120(6):1219–1236, 1994.
- Krizhevsky (2009) A Krizhevsky. Learning multiple layers of features from tiny images. Master’s thesis, University of Tront, 2009.
- LeCun (1998) Yann LeCun. The mnist database of handwritten digits. http://yann. lecun. com/exdb/mnist/, 1998.
- Lin et al. (2017) Tsung-Yi Lin, Priya Goyal, Ross Girshick, Kaiming He, and Piotr Dollár. Focal loss for dense object detection. In Proceedings of the IEEE international conference on computer vision, pages 2980–2988, 2017.
- Liu et al. (2008) Xu-Ying Liu, Jianxin Wu, and Zhi-Hua Zhou. Exploratory undersampling for class-imbalance learning. IEEE Transactions on Systems, Man, and Cybernetics, Part B (Cybernetics), 39(2):539–550, 2008.
- Malinin and Gales (2018) A Malinin and M Gales. Predictive uncertainty estimation via prior networks. In NIPS’18: Proceedings of the 32nd International Conference on Neural Information Processing Systems, volume 31, pages 7047–7058. Curran Associates, Inc., 2018.
- McClish (1989) Donna Katzman McClish. Analyzing a portion of the roc curve. Medical decision making, 9(3):190–195, 1989.
- Molnar (2020) Christoph Molnar. Interpretable machine learning. Lulu. com, 2020.
- Moon et al. (2020) Jooyoung Moon, Jihyo Kim, Younghak Shin, and Sangheum Hwang. Confidence-aware learning for deep neural networks. In international conference on machine learning, pages 7034–7044. PMLR, 2020.
- Mukhoti et al. (2020) Jishnu Mukhoti, Viveka Kulharia, Amartya Sanyal, Stuart Golodetz, Philip Torr, and Puneet Dokania. Calibrating deep neural networks using focal loss. Advances in Neural Information Processing Systems, 33, 2020.
- Netzer et al. (2011) Yuval Netzer, Tao Wang, Adam Coates, Alessandro Bissacco, Bo Wu, and Andrew Y Ng. Reading digits in natural images with unsupervised feature learning. 2011.
- Posch et al. (2019) Konstantin Posch, Jan Steinbrener, and Jürgen Pilz. Variational inference to measure model uncertainty in deep neural networks. arXiv preprint arXiv:1902.10189, 2019.
- Şensoy et al. (2018) Murat Şensoy, L Kaplan, and M Kandemir. Evidential deep learning to quantify classification uncertainty. Advances in Neural Information Processing Systems, 2018.
- Shrivastava et al. (2016) Abhinav Shrivastava, Abhinav Gupta, and Ross Girshick. Training region-based object detectors with online hard example mining. In Proceedings of the IEEE conference on computer vision and pattern recognition, pages 761–769, 2016.
- Wang and Bovik (2009) Zhou Wang and Alan C Bovik. Mean squared error: Love it or leave it? a new look at signal fidelity measures. IEEE signal processing magazine, 26(1):98–117, 2009.
- Xiao et al. (2017) Han Xiao, Kashif Rasul, and Roland Vollgraf. Fashion-mnist: a novel image dataset for benchmarking machine learning algorithms. arXiv preprint arXiv:1708.07747, 2017.
- Yasunobu and Sasaki (2003) Seiji Yasunobu and Ryota Sasaki. An auto-driving system by interactive driving knowledge acquisition. In SICE 2003 Annual Conference (IEEE Cat. No. 03TH8734), volume 3, pages 2935–2938. IEEE, 2003.