ivpcl.unm.edu
Dept. of Electrical and Computer Engineering
University of New Mexico, United States22institutetext: Dept. of Language, Literacy, and Sociocultural Studies
University of New Mexico, United States.
22email: {wshi, pattichi, sceledon, callopez}@unm.edu
Talking Detection In Collaborative Learning Environments††thanks: This material is based upon work supported by the National Science Foundation under Grant No.1613637, No.1842220, and No.1949230.
Abstract
We study the problem of detecting talking activities in collaborative learning videos. Our approach uses head detection and projections of the log-magnitude of optical flow vectors to reduce the problem to a simple classification of small projection images without the need for training complex, 3-D activity classification systems. The small projection images are then easily classified using a simple majority vote of standard classifiers. For talking detection, our proposed approach is shown to significantly outperform single activity systems. We have an overall accuracy of 59% compared to 42% for Temporal Segment Network (TSN) and 45% for Convolutional 3D (C3D). In addition, our method is able to detect multiple talking instances from multiple speakers, while also detecting the speakers themselves.
Keywords:
talking detection video analysis majority voting system1 Introduction
We study the problem of talking detection in collaborative learning environments. Here, our ultimate goal is to develop fast and reliable methods that can assist educational researchers analyze student participation in large video datasets.
Learning assessment relies heavily on the use of audio transcriptions that describe the interactions between the students and their facilitators. By identifying the video segments where a student is talking, educational researchers can then further analyze the nature of the interactions. For example, some students may stay quiet. Others may express themselves throughout the lessons. Ultimately, our computer-based system aims at aiding this type of analysis by identifying different talking patterns. However, for the purposes of this paper, we will only describe how to reliably detect students talking when the camera captures motions over their mouths.
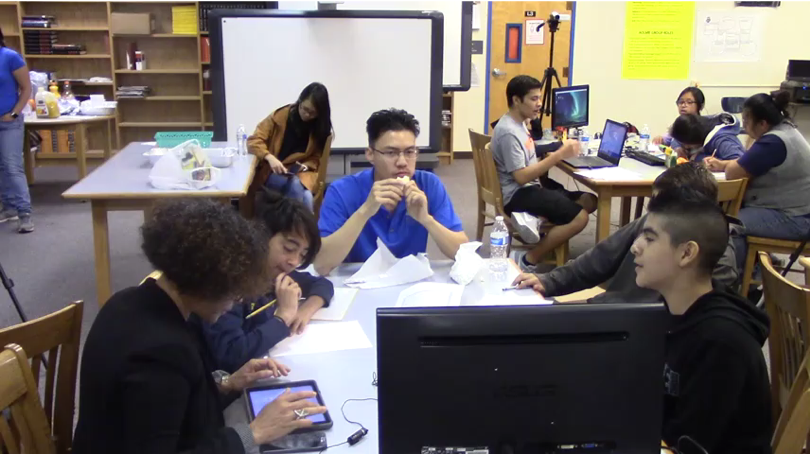
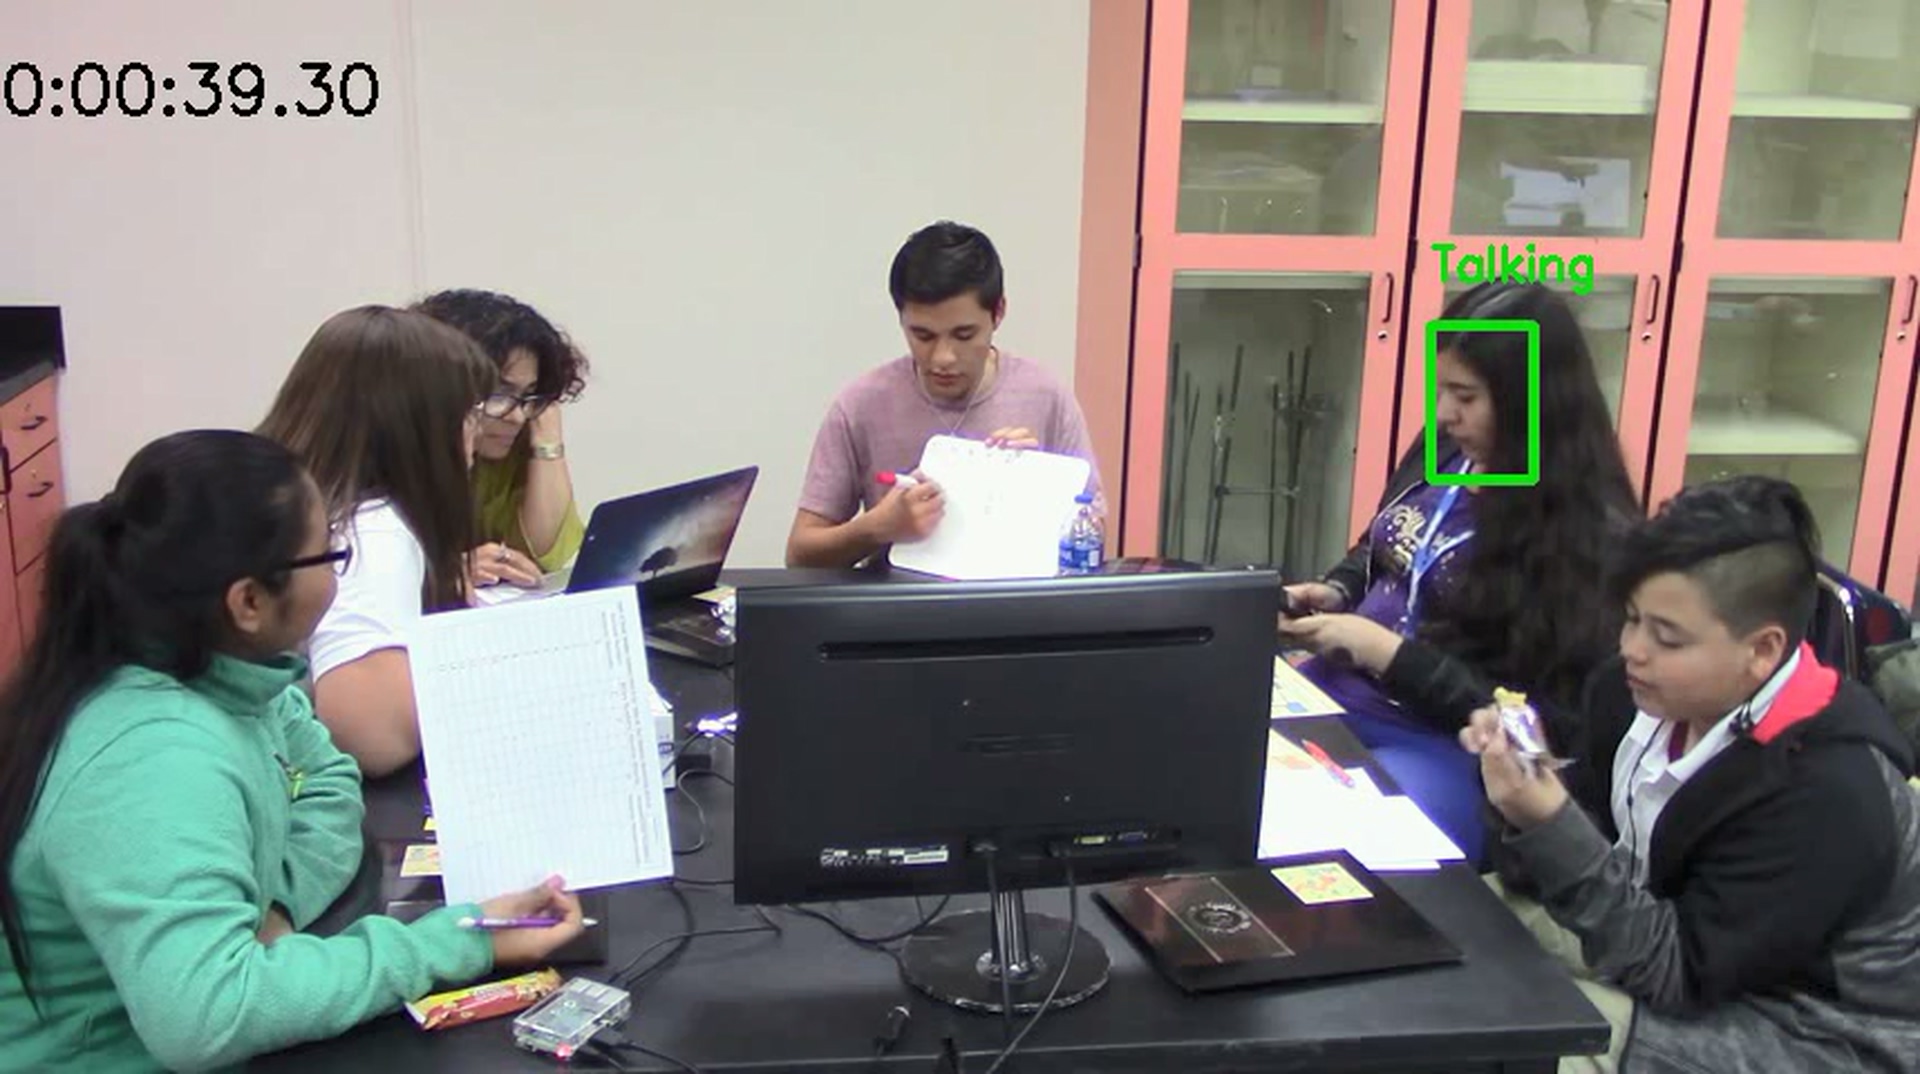
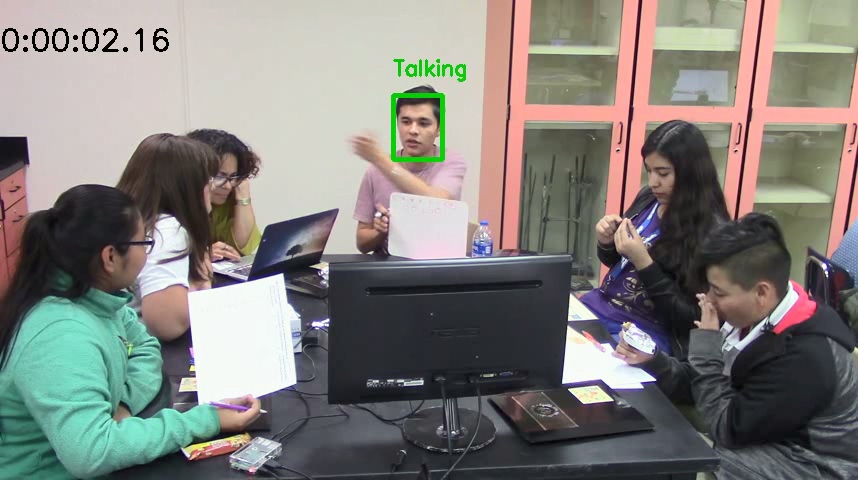
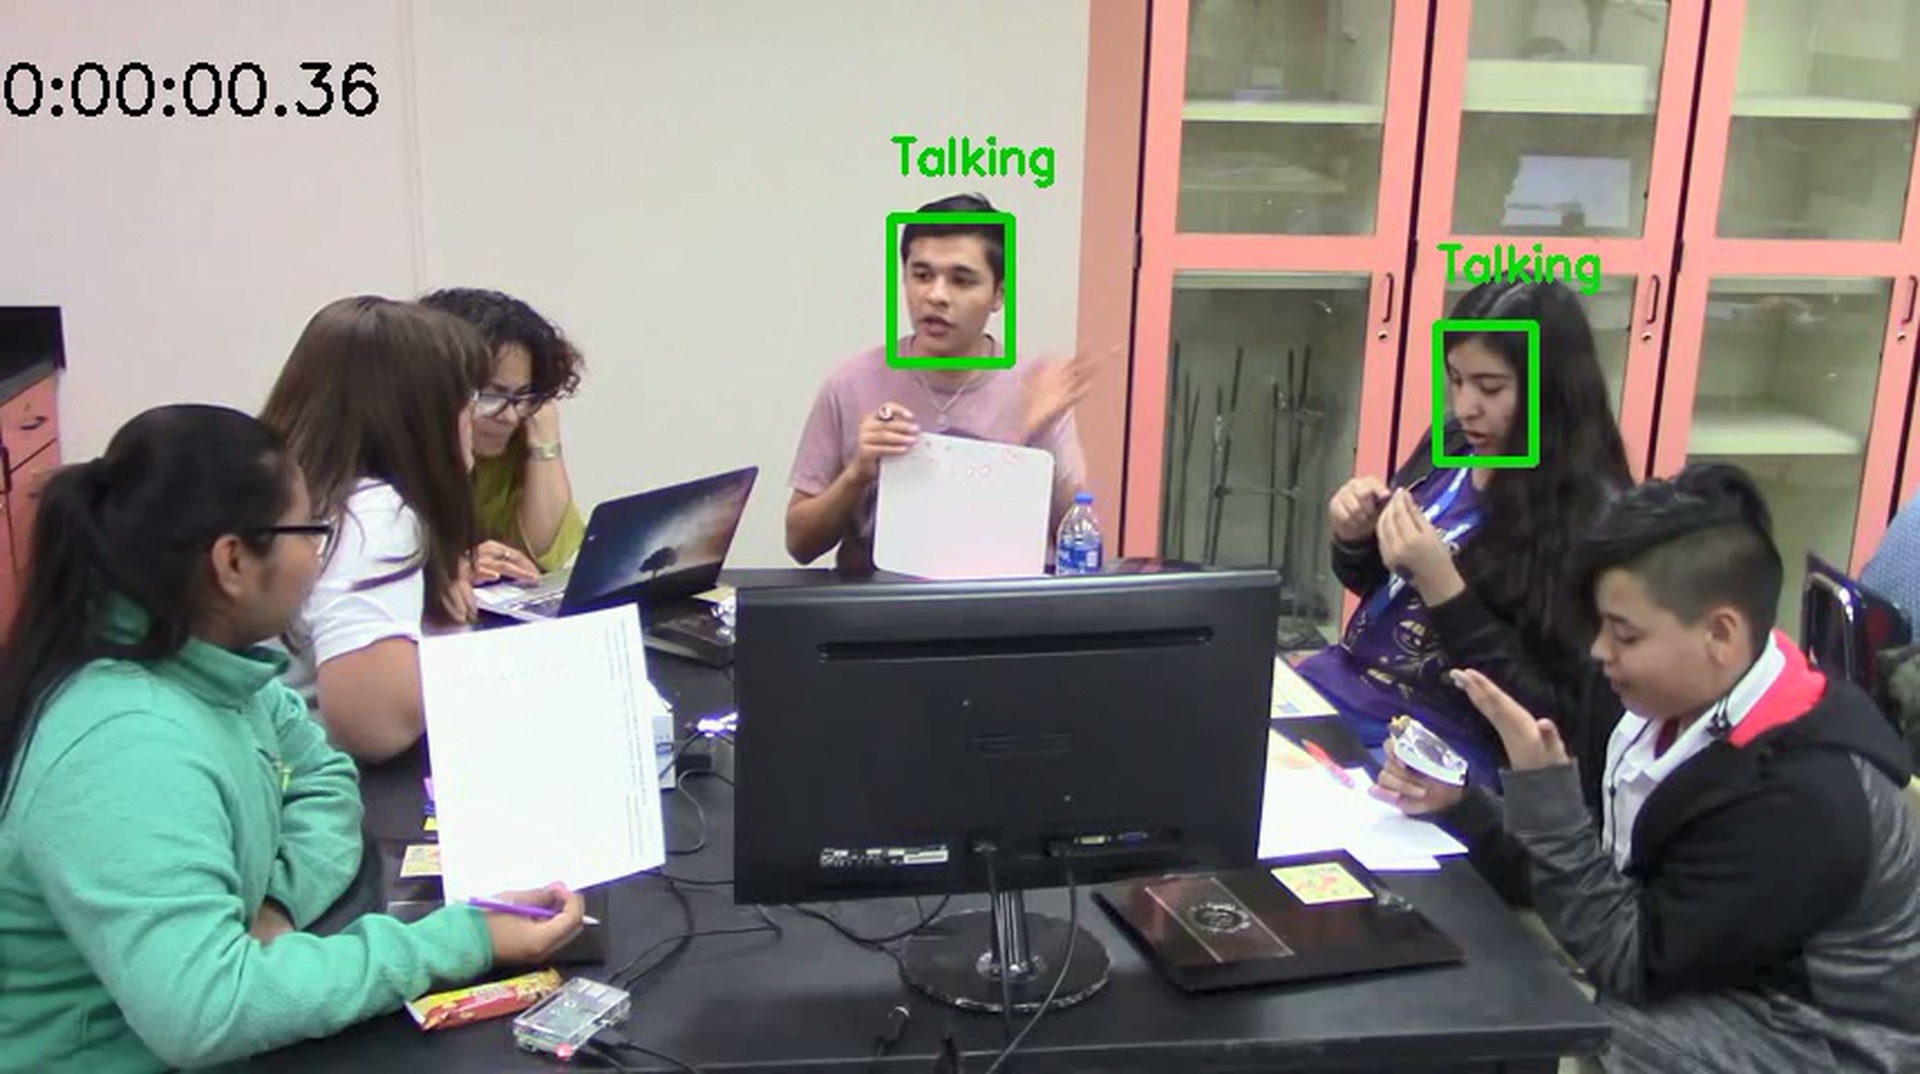
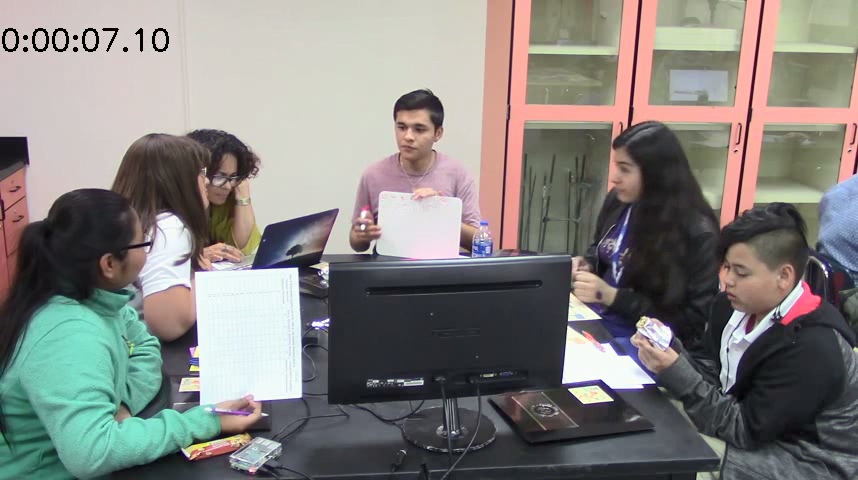
We present an example of our collaborative learning environment in Fig. 1. We are interested in detecting talking activities for the group that is closest to the camera. The students that are farther away appear at a smaller scale and need to be rejected from further consideration. Students appear at different angles to the camera. Instead of talking, students can also be eating, laughing, or yawing, and these activities should not be confused with talking (e.g., see eating example in Fig. 1). In many cases, the mouths may not be visible to the camera. In such cases, talking detection is not possible without processing the audio of the video.
We develop a direct and fast approach to talking detection that avoids the need for large training datasets. First, we detect the heads and faces to include the mouth regions. Then, over the detected head or face regions, we compute optical flow vectors and project the log-magnitudes of the vectors to generate a single region-proposal image over each candidate speaker. We then use voting from a list of simple classifiers to classify each segment as a talking or a non-talking segment.
Our talking detection research extends prior research by our group. In [6], [7] we introduced the use of multiscale AM-FM decompositions to detect student faces and the backs of the heads. In [9], the authors demonstrate the importance of using the instantaneous phase for face detection. In [8], we developed methods to identify possible group interactions through the use of AM-FM representations. In [2], we developed an open-source system for detecting writing and typing over cropped video segments. In [1], the author developed a hand movement detection system. In [4], we used simple color-based object detection followed by classification of optical flow vectors to detect writing, talking, and typing over a very small number of cropped video segments.
There is also significant human activity detection research within the computer vision community. In [12], the authors developed the Temporal Segment Network (TSN) for video-based activity recognition. TSN describes a deep learning based approach to detect a diverse range of activities using ConvNets. In [10], the authors developed the C3D network that trains deep 3D convolutional networks on a large-scale supervised video dataset to detect a diverse range of different activities. More recently, [11] generates a new spatiotemporal convolutional block “R(2+1)D” to train CNNs for activity recognition.
Our approach avoids the need to train large, deep learning systems on human video activity detection. Our approach is very fast because it reduces talking detection to the classification of small proposal regions of the projected motion magnitudes over the students’ faces or heads. It is ideally suited for our goal to process over 1,000 hours of videos for talking detection. We also provide comparisons against TSN and C3D to demonstrate that our approach is much more accurate.
We organize the rest of the paper into three additional sections. In section 2, we describe our proposed methodology. We then provide results in section 3 and provide concluding remarks in section 4.
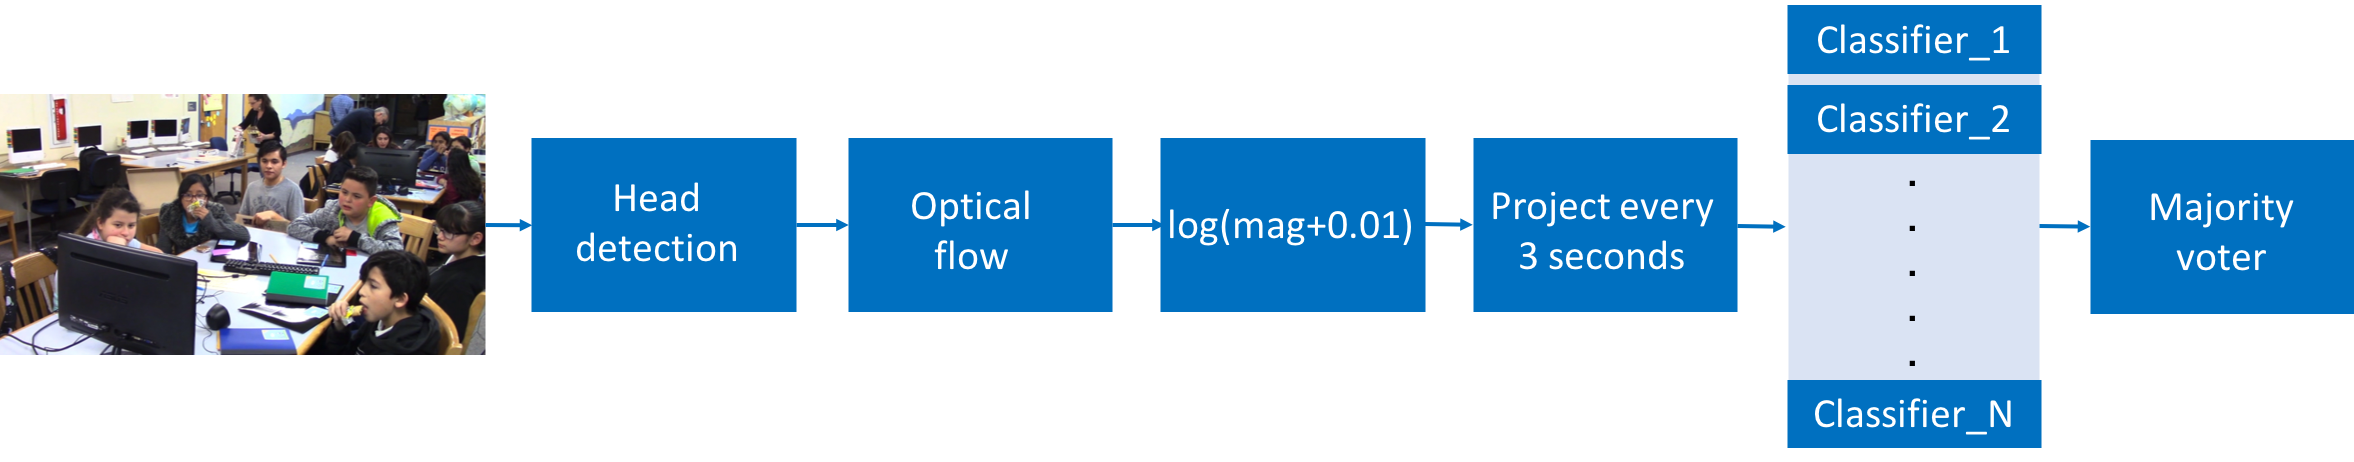
(a) Talking detection system.
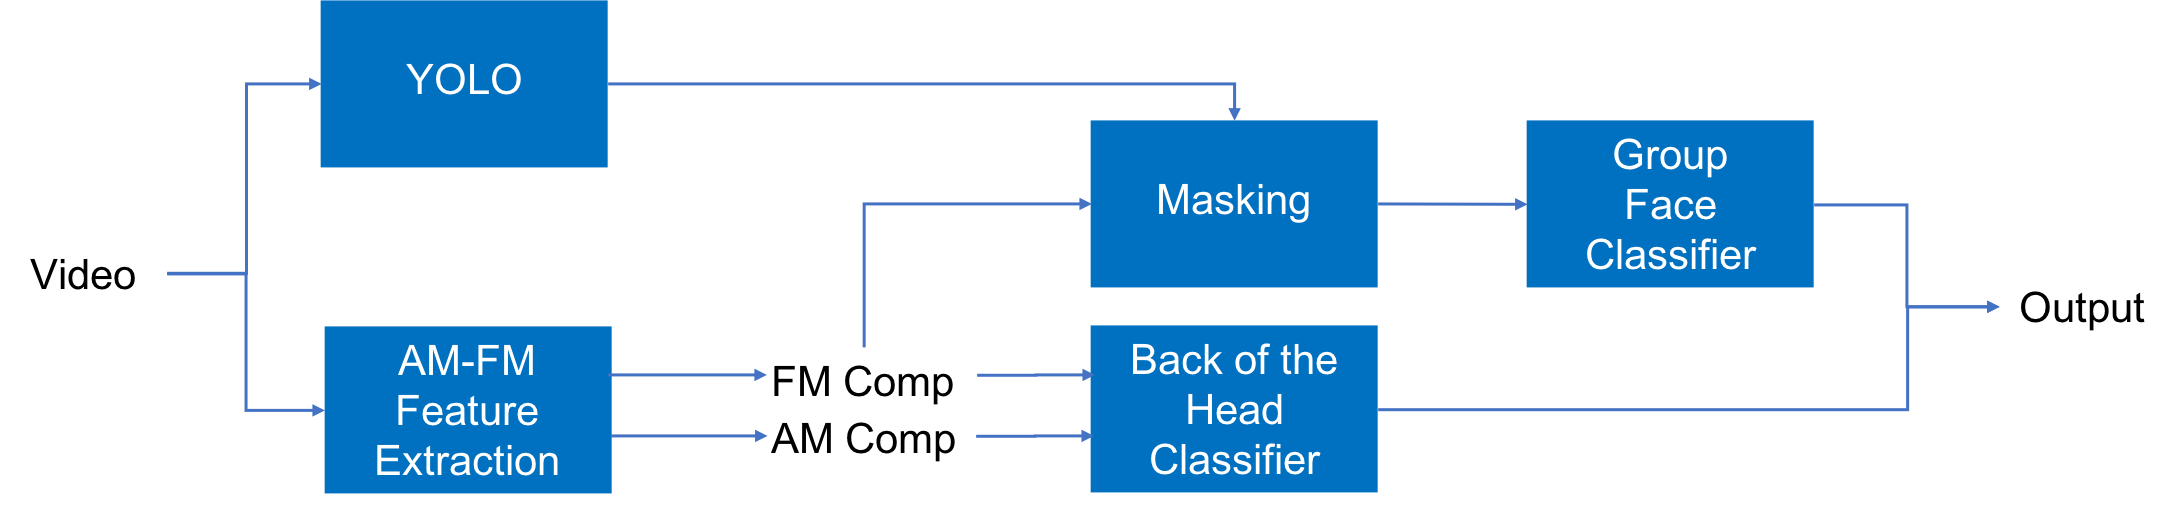
(b) Head detection system.
2 Methodology
We present a system diagram of the entire system in Fig 2(a). We also include a block diagram for the head detection system in Fig 2(b). In what follows, we summarize the components of each system.
We use multiple methods to locate both faces and the backs of the heads for the head detector. In the lower branch of Fig 2(b), we show how we extract AM-FM features using a 54-channel Gabor channel filterbank as described in [7] and [6]. We use AM-FM components to locate the back of the head region. For face detection, we use YOLO V3 [5]. We also use FM component classification (LeNet) to reject background faces that are characterized by higher frequency components since they are farther away from the camera.


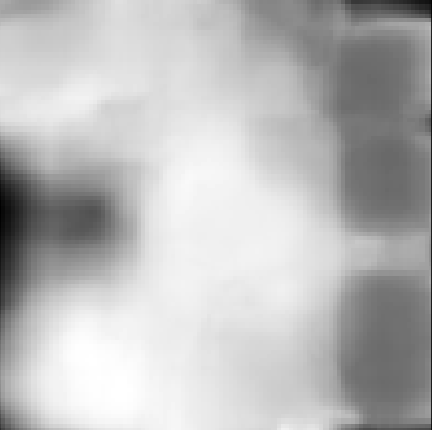

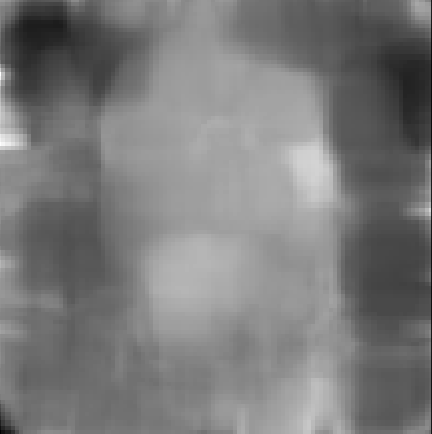

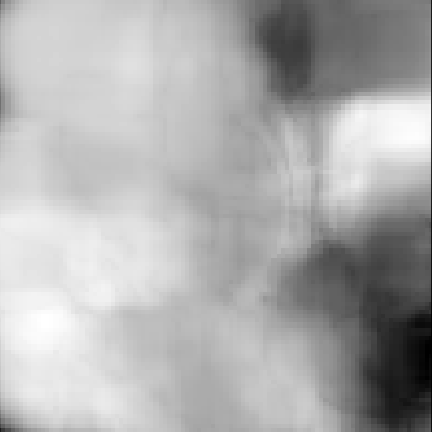

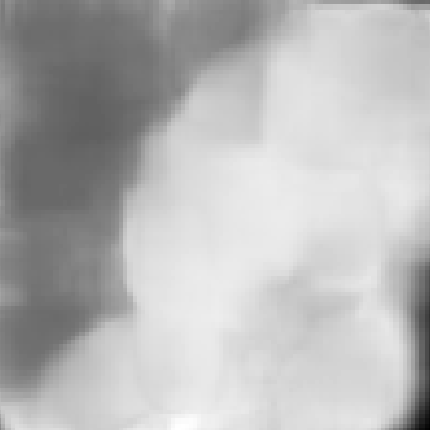


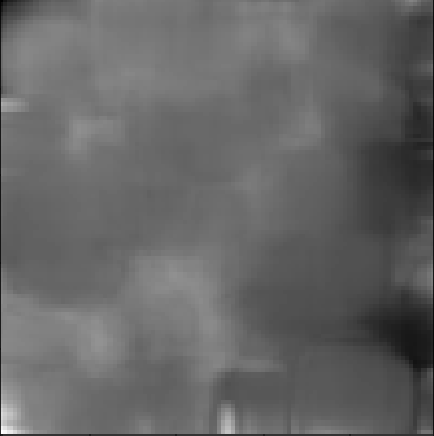

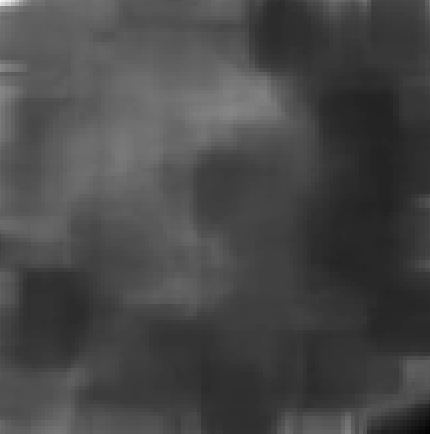

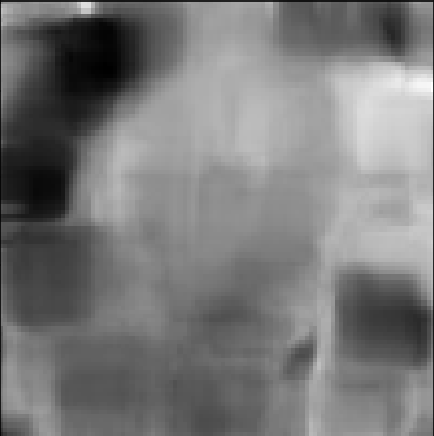

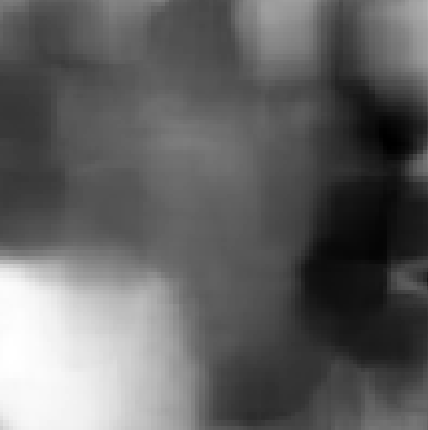

For each head detection, we produce 3-second video clip proposals for detecting talking activities. Over these regions, we compute dense optical flow estimates using Farneback’s algorithm [3]. At each pixel, we evaluate where represents the magnitude of each motion vector. Over each video segment, we then compute the projection image as given by:
We then train a variety of proposal region classifiers to differentiate between talking and non-talking activities.
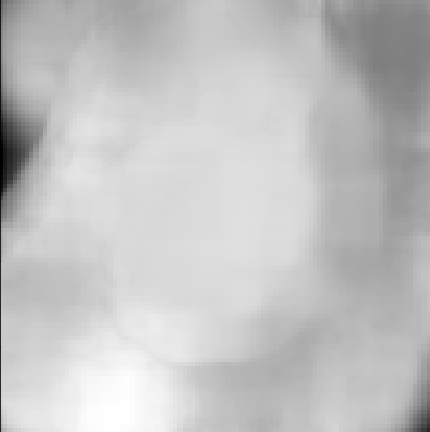
We present example projection images in Fig 3. From the examples, compared to projections of talking activities, it is clear that projections of non-talking activities are characterized by dark regions around the mouth regions.
For classifying the projected images, we consider simple classifiers. We considered a modified LeNet5, XGBoost, AdaBoost, decision tree, K-NN, quadratic discriminant analysis, and random forest classifier. Over the training set, we select the best three performing classifiers based on accuracy, AUC score, and F1 score, and then use a simple majority vote to combine them into a single system.
3 Results
We summarize our results into three subsections. First, we present results for our head detector in section 3.1. Second, we present results for our head region video detection results in section 3.2. Third, we present final results for the full system in section 3.3.
3.1 Head Detection System Results
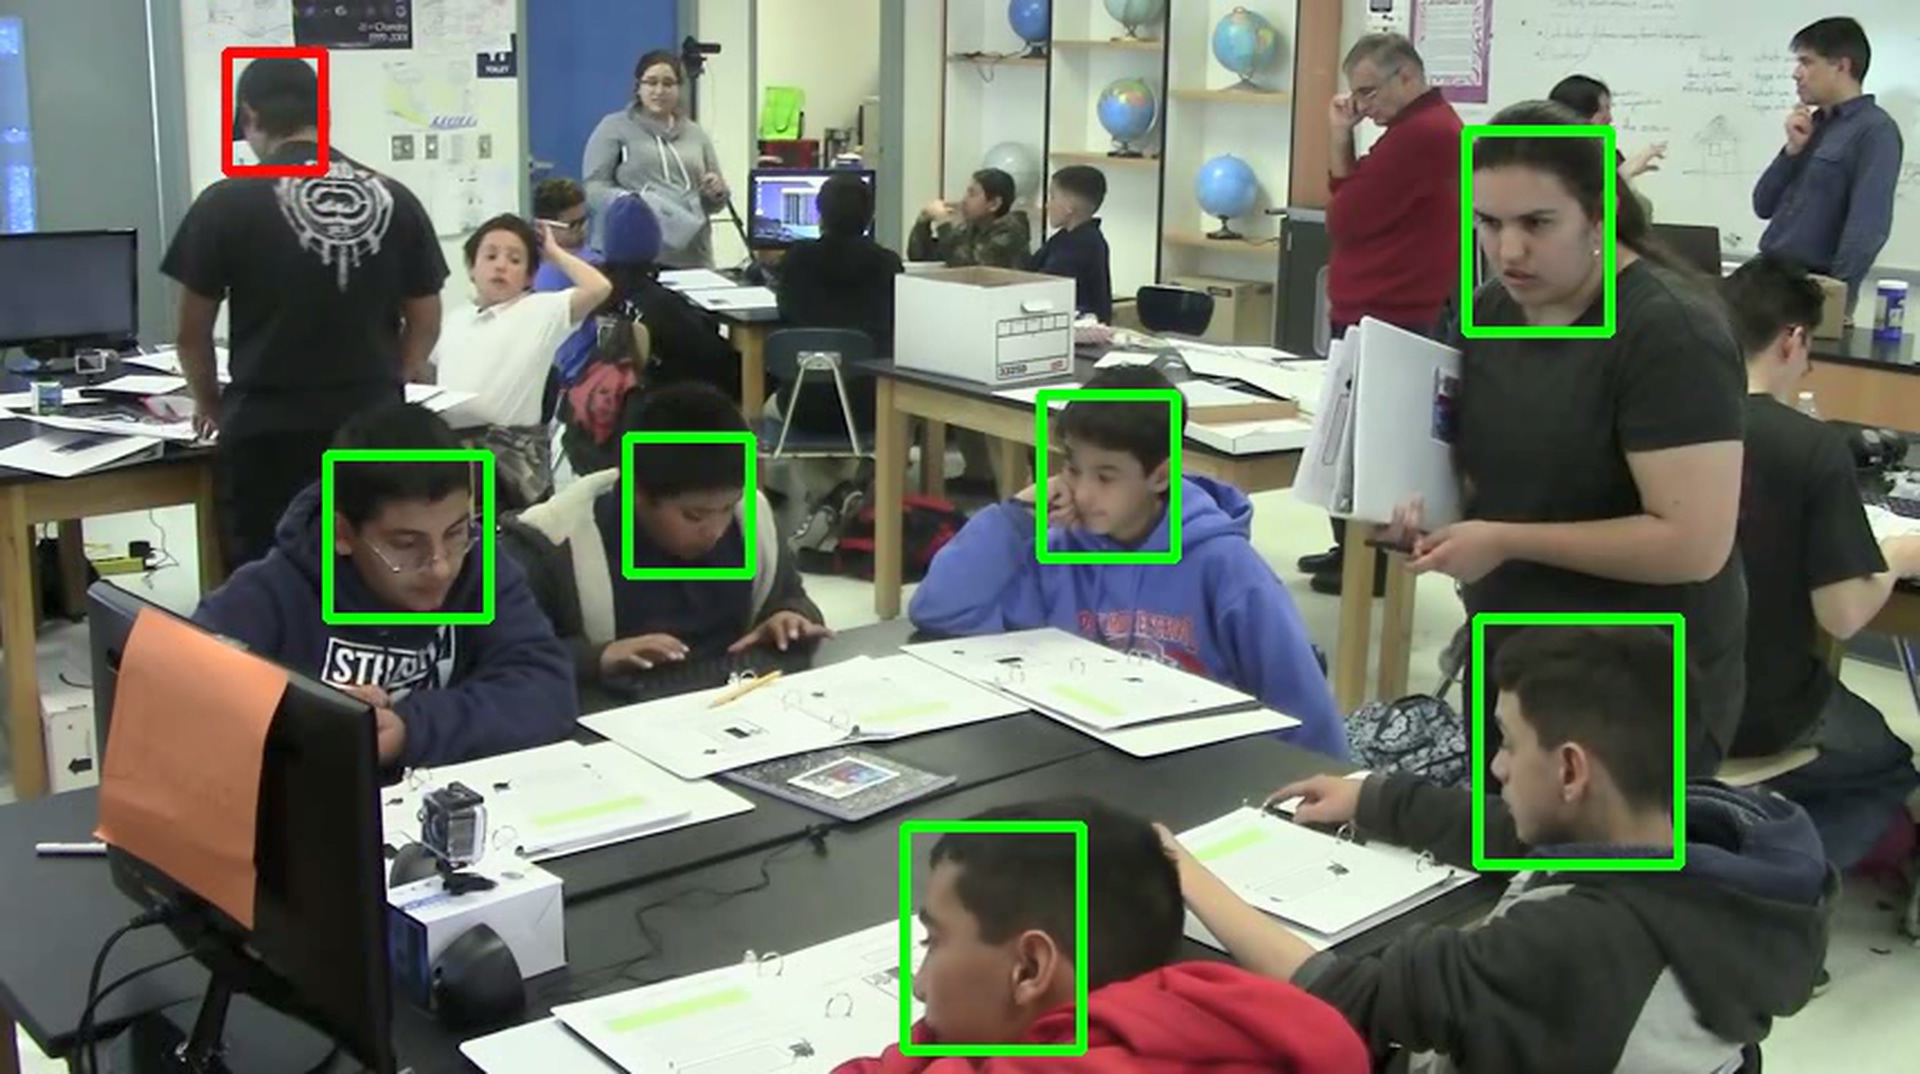
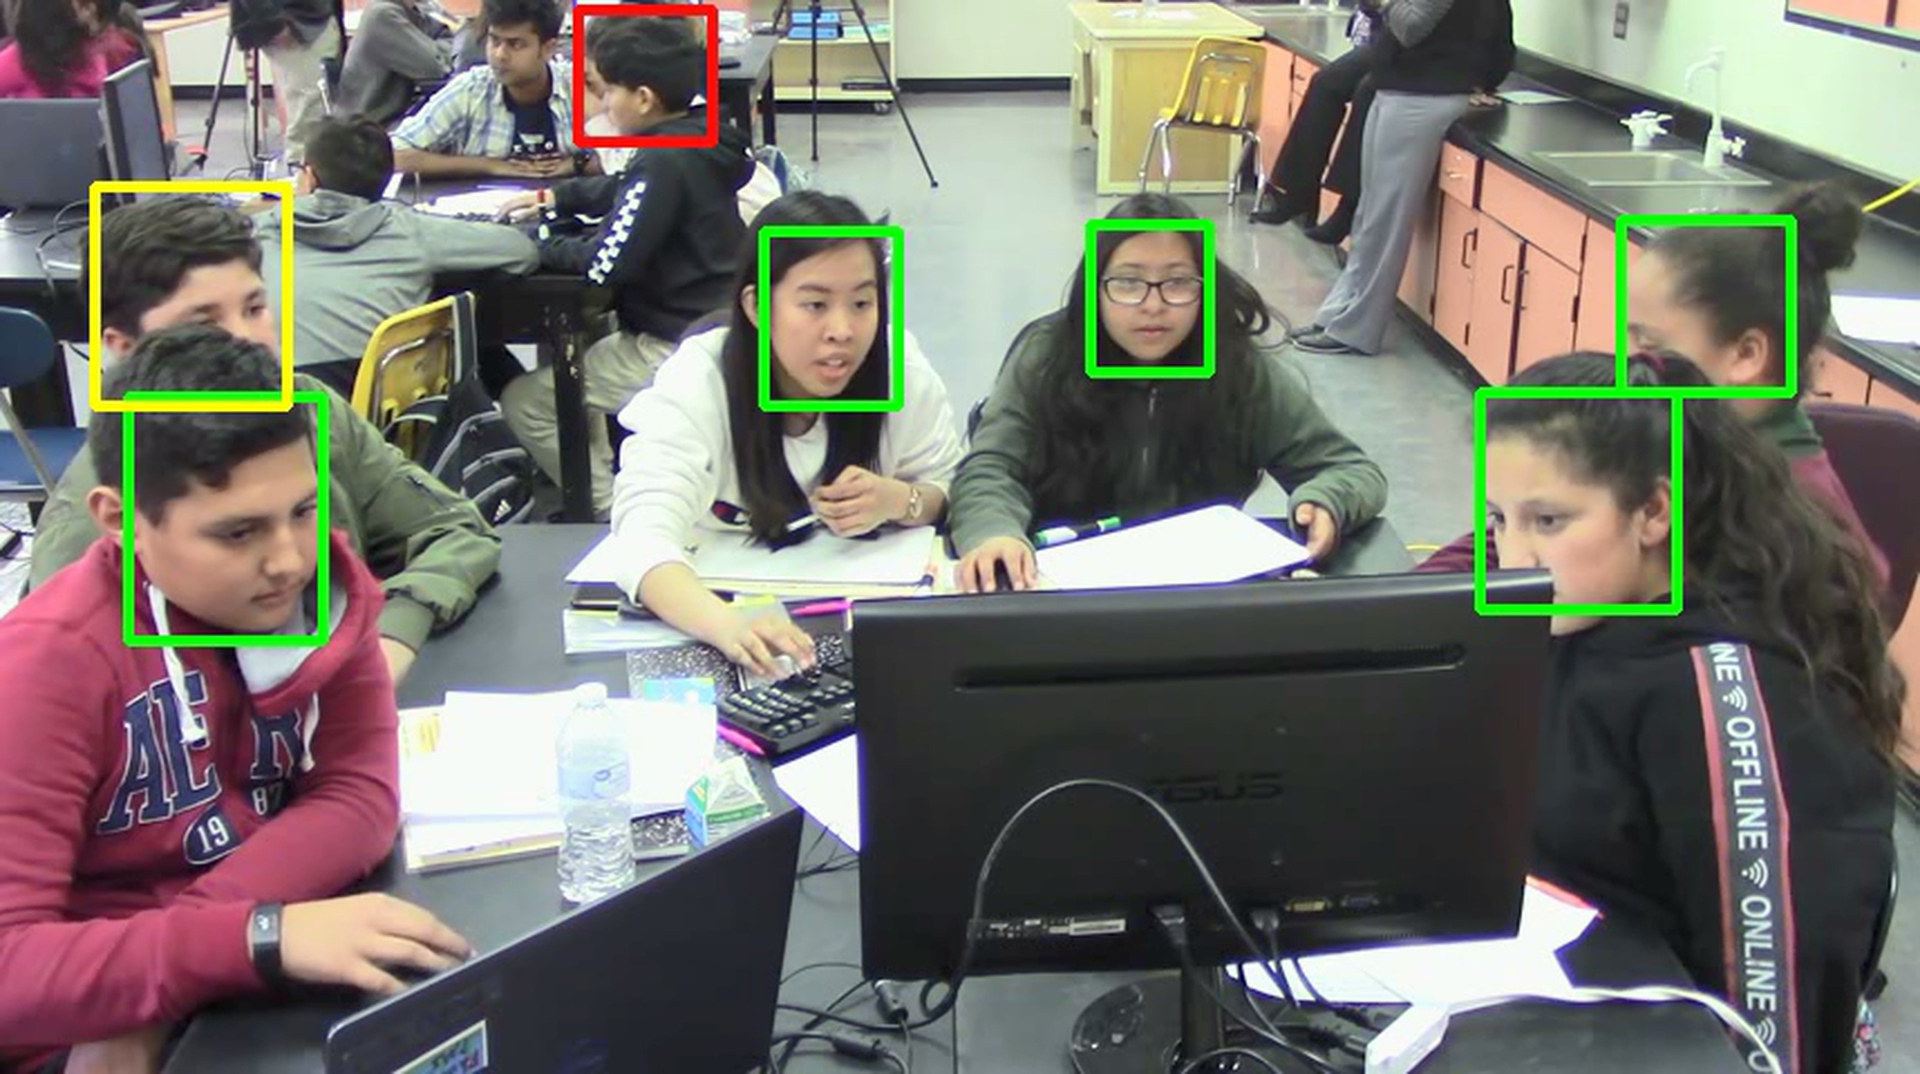
We summarize head detection results in Table 1. For training head detection, we selected 1,000 head examples and 1,200 non-face examples selected from 54 different video sessions. We then tested our head detector on four unseen videos as summarized in Table 1. We can see from the results that our proposed approach achieved F1 scores that range from 0.81 to 0.87 over 905,550 labeled students.
Example detections are shown in Fig 4. We can see from the example that our head classification system rejected all but one of the distant detections. Furthermore, we missed a single face due to occlusion.
| Video | Labeled Students | Detected Students | TP | FP | FN | F1 |
|---|---|---|---|---|---|---|
| V1 | 242,700 | 180,640 | 169,550 | 11,090 | 69,190 | 0.81 |
| V2 | 131,100 | 122,230 | 107,360 | 14,870 | 17,360 | 0.87 |
| V3 | 277,830 | 229,810 | 207,230 | 22,580 | 60,270 | 0.83 |
| V4 | 253,920 | 230,600 | 206,860 | 23,740 | 35,750 | 0.87 |
| Group ID | Cohort | Group | Date | Urban/ Rural | Frame Rate (fps) |
|---|---|---|---|---|---|
| 1 | C1L1 | D | May-04 | Rural | 60 |
| 2 | C1L1 | D | May-11 | Rural | 60 |
| 3 | C1L1 | C | May-02 | Urban | 60 |
| 4 | C1L1 | C | May-09 | Urban | 60 |
| 5 | C1L2 | A | Jun-22 | Rural | 60 |
| 6 | C2L1 | A | Mar-22 | Rural | 30 |
| 7 | C2L1 | A | Apr-19 | Rural | 30 |
| 8 | C2L1 | A | May-05 | Rural | 30 |
| 9 | C2L1 | A | May-10 | Rural | 30 |
| 10 | C2L1 | B | Mar-22 | Rural | 30 |
| 11 | C2L1 | D | Feb-23 | Rural | 30 |
| 12 | C2L1 | D | Mar-22 | Rural | 30 |
| 13 | C2L1 | A | Feb-20 | Urban | 30 |
| Group ID | Cohort | Group | Date | Urban/ Rural | Frame Rate (fps) |
|---|---|---|---|---|---|
| 1 | C1L1 | B | Mar-02 | Rural | 30 |
| 2 | C1L1 | C | Mar-30 | Rural | 60 |
| 3 | C1L1 | C | Apr-06 | Rural | 60 |
| 4 | C1L1 | C | Apr-13 | Rural | 60 |
| 5 | C1L1 | E | Mar-02 | Rural | 60 |
| 6 | C2L1 | B | Feb-23 | Rural | 30 |
| 7 | C2L1 | C | Apr-12 | Rural | 30 |
| 8 | C2L1 | D | Mar-08 | Rural | 30 |
| 9 | C2L1 | E | Apr-12 | Rural | 30 |
| 10 | C2L1 | B | Feb-27 | Urban | 30 |
| 11 | C3L1 | C | Apr-11 | Rural | 30 |
| 12 | C3L1 | D | Feb-21 | Rural | 30 |
| 13 | C3L1 | D | Mar-19 | Urban | 30 |
| Methods | Accuracy | AUC Score | Precision | Recall | F1 | Confusion Matrix |
|---|---|---|---|---|---|---|
| LeNet5 | 70% | 0.76 | 0.69 | 0.76 | 0.72 | |
| XGBoost | 67% | 0.73 | 0.65 | 0.78 | 0.71 | |
| AdaBoost | 70% | 0.70 | 0.64 | 0.72 | 0.67 | |
| Decision Tree | 59% | 0.59 | 0.60 | 0.60 | 0.60 | |
| KNN | 68% | 0.74 | 0.68 | 0.71 | 0.70 | |
| QDA | 61% | 0.71 | 0.82 | 0.30 | 0.44 | |
| Random Forest | 62% | 0.65 | 0.61 | 0.75 | 0.67 | |
| XGBoost+ AdaBoost+ KNN | 79% | 0.77 | 0.69 | 0.72 | 0.70 |
3.2 Head Video Region Classification Results
In this section, we provide comparisons against single activity classifiers. For this purpose, we crop head regions and resize them to pixels. For our comparisons, each video segment is clipped at 3 seconds. We report results on two datasets. The first dataset is used for selecting the classifiers that are used in our majority classification system. We use a second dataset to assess the performance of the majority classifier on four videos that range from 11 to 24 minutes.
| Video | Duration | Person Label | Ours | TSN | C3D |
| V1 | 23 min 45 s | Issac | 66% | 28% | 28% |
| Julia7P | 48% | 38% | 33% | ||
| Martina64P | 58% | 11% | 31% | ||
| Suzie66P | 44% | 11% | 7% | ||
| Bernard129P | 51% | 18% | 19% | ||
| Average | 53% | 21% | 24% | ||
| V2 | 11 min 20 s | Irma | 53% | 67% | 64% |
| Emilio25P | 68% | 21% | 14% | ||
| Herminio10P | 56% | 72% | 79% | ||
| Jacinto51P | 66% | 21% | 41% | ||
| Jorge17P | 60% | 53% | 43% | ||
| Juan16P | 62% | 39% | 35% | ||
| Average | 61% | 46% | 46% | ||
| V3 | 16 min 6 s | Kelly | 70% | 67% | 71% |
| Marta12P | 68% | 19% | 34% | ||
| Cindy14P | 74% | 23% | 74% | ||
| Carmen13P | 51% | 31% | 50% | ||
| Marina15P | 64% | 22% | 26% | ||
| Scott | 87% | 95% | 92% | ||
| Average | 69% | 43% | 58% | ||
| V4 | 23 min 45 s | Phuong | 58% | 71% | 58% |
| Jacob103P | 53% | 51% | 46% | ||
| Josephina104P | 42% | 63% | 47% | ||
| Juanita107P | 55% | 64% | 60% | ||
| Tina105P | 55% | 44% | 47% | ||
| Vincent106P | 45% | 43% | 40% | ||
| Average | 51% | 56% | 50% | ||
| Overall Average | 59% | 42% | 45% |
For training the proposed classification method and all other methods, we use 11,315 video clips extracted from 13 different video sessions, with a total of 27 students (see Table 2). For the validation set, we use 5,624 video clips extracted from 13 video sessions, with a total of 37 students (see Table 3). Table 4 summarizes the results from using different classifiers. We chose XGBoost, AdaBoost, and KNN for the voting system. Over our validation set, this combination gave the highest accuracy at 79%. For comparing our system against alternative approaches, we use four different videos as summarized in Table 5. From the results, our system gave an average accuracy of 59% compared to 42% for TSN and 45% for C3D.
3.3 Talking Activity Detection System
4 Conclusion
We presented a new method for detecting students talking in collaborative learning environment videos. Our approach combines head detection with activity detection using a projection of motion vectors and a majority voting classification system. Our approach significantly outperformed single activity classification systems. Yet, our average accuracy at 59% suggests that there is still room for significant improvement. Our approach will also need to be further validated before it can be effectively used by educational researchers.
References
- [1] Darsey, C.J.: Hand movement detection in collaborative learning environment videos (2018)
- [2] Eilar, C.W., Jatla, V., Pattichis, M.S., LópezLeiva, C., Celedón-Pattichis, S.: Distributed video analysis for the Advancing Out-of-school Learning in Mathematics and Engineering project. In: 50th Asilomar Conference on Signals, Systems and Computers. pp. 571–575. IEEE (2016)
- [3] Farnebäck, G.: Two-frame motion estimation based on polynomial expansion. In: Scandinavian conference on Image analysis. pp. 363–370. Springer (2003)
- [4] Jacoby, A.R., Pattichis, M.S., Celedón-Pattichis, S., LópezLeiva, C.: Context-sensitive human activity classification in collaborative learning environments. In: 2018 IEEE Southwest Symposium on Image Analysis and Interpretation (SSIAI). pp. 1–4. IEEE (2018)
- [5] Redmon, J., Farhadi, A.: Yolov3: An incremental improvement. arXiv preprint arXiv:1804.02767 (2018)
- [6] Shi, W.: Human Attention Detection Using AM-FM Representations. Master’s thesis, the University of New Mexico, Albuquerque, New Mexico (2016)
- [7] Shi, W., Pattichis, M.S., CeledLón-Pattichis, S., LoLópezLeiva, C.: Robust head detection in collaborative learning environments using am-fm representations. In: IEEE Southwest Symposium on Image Analysis and Interpretation (in press, 2018)
- [8] Shi, W., Pattichis, M.S., Celedón-Pattichis, S., LópezLeiva, C.: Dynamic group interactions in collaborative learning videos. In: 2018 52nd Asilomar Conference on Signals, Systems, and Computers. pp. 1528–1531. IEEE (2018)
- [9] Tapia, L.S., Pattichis, M.S., Celedón-Pattichis, S., LópezLeiva, C.: The importance of the instantaneous phase for face detection using simple convolutional neural networks. In: 2020 IEEE Southwest Symposium on Image Analysis and Interpretation (SSIAI). pp. 1–4. IEEE (2020)
- [10] Tran, D., Bourdev, L., Fergus, R., Torresani, L., Paluri, M.: Learning spatiotemporal features with 3d convolutional networks. In: Proceedings of the IEEE international conference on computer vision. pp. 4489–4497 (2015)
- [11] Tran, D., Wang, H., Torresani, L., Ray, J., LeCun, Y., Paluri, M.: A closer look at spatiotemporal convolutions for action recognition. In: Proceedings of the IEEE conference on Computer Vision and Pattern Recognition. pp. 6450–6459 (2018)
- [12] Wang, L., Xiong, Y., Wang, Z., Qiao, Y., Lin, D., Tang, X., Van Gool, L.: Temporal segment networks: Towards good practices for deep action recognition. In: European Conference on Computer Vision. pp. 20–36. Springer (2016)